Biodiversità ed Evoluzione - unibo.itamsdottorato.unibo.it/7570/1/Marti-Puig_Patricia_tesi.pdf ·...
117
Alma Mater Studiorum – Università di Bologna DOTTORATO DI RICERCA IN Biodiversità ed Evoluzione Ciclo 28 Settore Concorsuale di afferenza: 05/C1 Settore Scientifico disciplinare: BIO/07 GENETIC AND MORPHOLOGICAL FEATURES OF PATELLA CAERULEA AND PATELLA RUSTICA ACROSS MEDITERRANEAN MARINE PROTECTED AREAS Presentata da: Patricia Martí Puig Coordinatore Dottorato Relatore Barbara Mantovani Laura Airoldi Esame finale anno 2016
Transcript of Biodiversità ed Evoluzione - unibo.itamsdottorato.unibo.it/7570/1/Marti-Puig_Patricia_tesi.pdf ·...
Alma Mater Studiorum – Università di Bologna
DOTTORATO DI RICERCA IN
Biodiversità ed Evoluzione
Ciclo 28
Settore Concorsuale di afferenza: 05/C1
Settore Scientifico disciplinare: BIO/07
GENETIC AND MORPHOLOGICAL FEATURES OF PATELLA
CAERULEA AND PATELLA RUSTICA ACROSS MEDITERRANEAN
MARINE PROTECTED AREAS
Presentata da: Patricia Martí Puig
Coordinatore Dottorato Relatore
Barbara Mantovani Laura Airoldi
Esame finale anno 2016

II
III
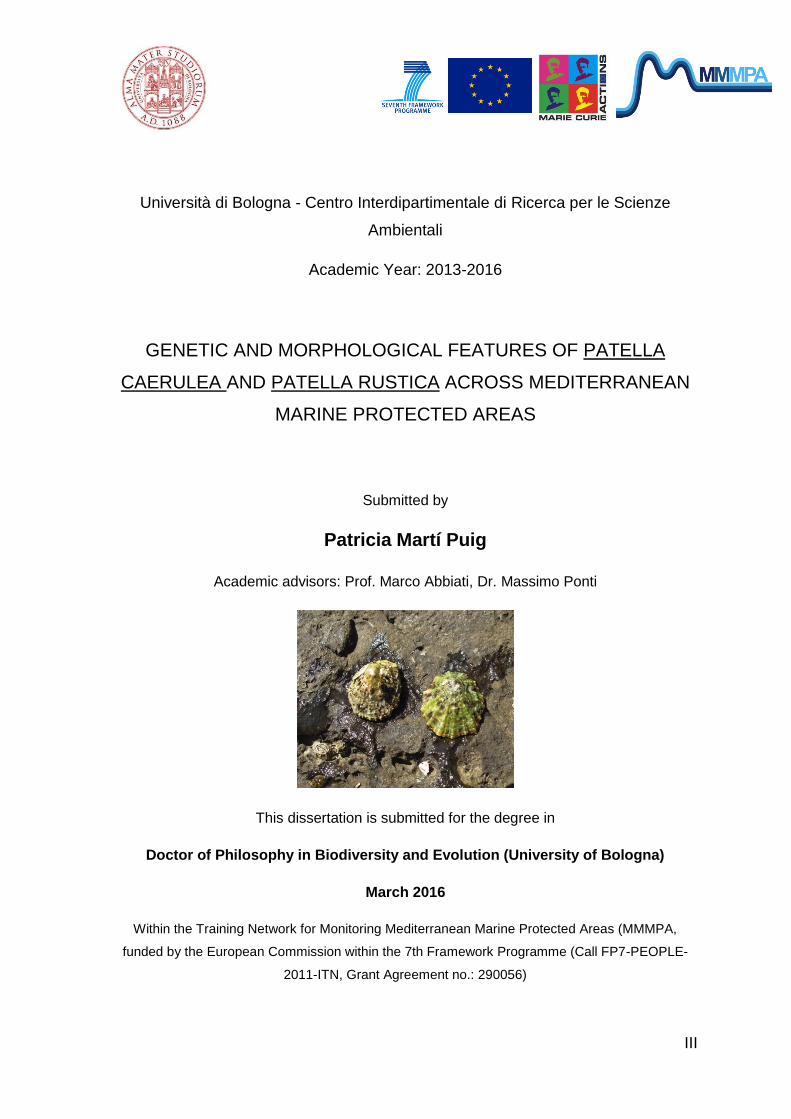
Università di Bologna - Centro Interdipartimentale di Ricerca per le Scienze
Ambientali
Academic Year: 2013-2016
GENETIC AND MORPHOLOGICAL FEATURES OF PATELLA
CAERULEA AND PATELLA RUSTICA ACROSS MEDITERRANEAN
MARINE PROTECTED AREAS
Submitted by
Patricia Martí Puig
Academic advisors: Prof. Marco Abbiati, Dr. Massimo Ponti
This dissertation is submitted for the degree in
Doctor of Philosophy in Biodiversity and Evolution (University of Bologna)
March 2016
Within the Training Network for Monitoring Mediterranean Marine Protected Areas (MMMPA,
funded by the European Commission within the 7th Framework Programme (Call FP7-PEOPLE-
2011-ITN, Grant Agreement no.: 290056)

IV
Cover picture
Patella rustica (left) and Patella caerulea (right) at Portofino MPA. Photo by Patricia Marti-
Puig

V
This thesis is dedicated to my nephew Matteo, the best present during my PhD.

VI
'PROTECT AND CONNECT THE OCEANS
DON'T LEAVE MPAs ALONE!'
http://m.youtube.com/watch?v=bFhexhq6tGE

VII
ACKNOWLEDGEMENTS
I would like to acknowledge first to Prof. Marco Abbiati, head of
Experimental Applied Ecology department, who accepted me in his research
group as a PhD student and followed me during these years. To Dr. Massimo
Ponti, partner coordinator of the project MMMPA, for being always available to
help, giving me advice and teaching me to be a better researcher, during all the
process of my PhD. Of course, thanks to Dr. Federica Costantini and Dr. Adriana
Villamor for their advice and assistance with the genetic analysis, for their patience
and perseverance. Thank you to the MPA managers who allowed the sampling for
this work. To Prof. José Charton and his students (José Pereguiñez and Ramón
García), to Ubica guys (Ubaldo Pantaleo and Marco Palma) and to the MPA
manager of Tavolara Augusto Navone for their assistance in the field-work. To
Roberto Buonomo for his assistance in R programing. To Dr. Paolo Albano, Dr.
Ayesha Tulloch and Dr. Francine Keshaw for their optimism and helpful
collaboration in the applications of my PhD research. Thanks to my other genetic
colleagues from Bologna, specially Alice, Greg & Carlo for the coffee times and for
their advices.
I would like to specially thank to all the MMMPA dream team, for the fruitful
collaboration during project and friendship, especially to the MMMPA Italian girls
(Vessa and Paula) for the beautiful short-movie (Zoe and her adventures in the
sea) that we create together and to Dani for ―the psychology and life lessons‖. To
Carlo Cerrano, the coordinator or the project, for his huge effort coordinating the
MMMPA team. Thanks to all the teachers and trainers that help me to develop
important skills for my PhD, life and future career.
I would like to take this opportunity to thank my family and loved ones. To
my special girl friends: Veronica, Vera and Fatine for the ―gossip‖ times. To my
tango, salsa, musician and CS friends: without you my life in Ravenna would not
have been the same! To Maria Crespo, my travel partner, who helped to
disconnect from research. To my forever friends in Barcelona (Belen, Marc,
Nadia…), who always supported me, specially to Sergio, Ivonne, Berta and

VIII
Carlitos for visiting me! Thanks also Ivonne Peña for your very useful advises as
an experience Doctor. To Jorge Aguadero for his leadership inspiration and
friendship. Special thanks to my beloved Dawid, mum, sister and nephew for their
support, love and inspiration! ―Mami, gracias por los bocadillos de jamón y las
comidas de madre mientras preparaba la tesis. ¡Madre solo hay una! Nina,
gracias por los chocolates y paquetes que me enviabas durante la tesis‖.
Finally, I would like to thank to ―Marie Curie‖, the grant that offered me the
opportunity for doing this research. During the last three years as a PhD student, it
was an intense professional and personal learning process, which has opened the
doors for continuing and growing in my career.
Patricia Martí Puig
29-February-2016
―The MMMPA dream team‖
IX
AUTHOR’S DECLARATION
The research for this thesis was supported by funding from the European
Union within the Training Network for Monitoring Mediterranean Marine Protected
Areas (MMMPA), a Marie Curie Initial Training Network, funded by the European
Commission within the 7th Framework Programme (Call FP7-PEOPLE-2011-ITN,
Grant Agreement no.: 290056).
All chapters in this thesis were written by Patricia Marti-Puig and are
formatted in the style of manuscripts for publication. Comments and editing were
provided by Dr. Massimo Ponti, Dr. Federica Costantini and Prof. Marco Abbiatti.
No data can be taken out of this work without prior approval of the thesis tutor/s. I
hereby confirm that I have independently composed this PhD thesis and that no
other than the indicated aid and sources have been used. This work has not been
presented to any other examination board.
Patricia Martí Puig
Ravenna, 26-March-2016

X
The “connectivity problem”
―I am nothing. I‘m like someone who‘s been thrown into the ocean at night,
floating all alone. I reach out, but no one is there. I call out, but no one answers. I
have no connection to anything.‖
― Haruki Murakami, 1Q8

1
SUMMARY
ABSTRACT ..................................................................................................................................................... 4
PHD THESIS OUTLINE ............................................................................................................................... 5
CHAPTER I. GENERAL INTRODUCTION ............................................................................................... 7
1.1. MARINE PROTECTED AREAS (MPAS): ARE THEY WELL DESIGNED? ........................................................ 8
1.2. MORPHOMETRIC AND POPULATION GENETICS IN MPA DESIGN .............................................................. 10
1.3. INTEGRATING MORPHOMETRIC AND GENETIC DATA IN MPA DESIGN .................................................... 11
1.4. PROJECT CONTEXT AND AIMS ......................................................................................................................... 13
CHAPTER II: RESEARCH BIBLIOGRAPHY AND MARINE PROTECTED AREA SAMPLING
DESIGN CRITERIA .................................................................................................................................... 15
2.1. ABSTRACT .......................................................................................................................................................... 16
2.2. INTRODUCTION ................................................................................................................................................. 17
2.3. LITERATURE REVIEW ....................................................................................................................................... 20
2.4. MPA CONNECTIVITY AND SAMPLING DESIGN .............................................................................................. 24
2.4.1. Sampling design ...........................................................................................................................................25
2.4.2. Species selection ...........................................................................................................................................27
2.4.3. Molecular markers ......................................................................................................................................28
2.5. IMPLEMENTATION OF THE SAMPLING DESIGN GUIDELINES ...................................................................... 28
CHAPTER III: MORPHOMETRIC AND GENETIC TOOLS FOR MARINE PROTECTED AREA
MONITORING............................................................................................................................................. 30
3.1. ABSTRACT ...................................................................................................................................................... 31
3.2. INTRODUCTION ................................................................................................................................................. 32
3.2. MATERIAL & METHOD .................................................................................................................................... 33
3.2.1. Field sampling ...............................................................................................................................................33
3.2.2. Species identification by molecular markers .................................................................................34
3.2.3. Morphometric shell characters .............................................................................................................34
3.2.4. Elliptic Fourier Descriptors (EFDs) method ...................................................................................36
3.3. RESULTS ............................................................................................................................................................. 37
3.4.1. Phylogenetics and species identification ..........................................................................................37

2
3.4.2. Morphometric distinction ....................................................................................................................... 37
3.5. DISCUSSION ...................................................................................................................................................... 42
3.6. CONCLUSION ...................................................................................................................................................... 42
3.7. ACKNOWLEDGMENTS ...................................................................................................................................... 43
3.8. SUPPLEMENTARY MATERIALS ........................................................................................................................ 44
CHAPTER IV: GENETIC DIVERSITY AND CONNECTIVITY FOR THE EVALUATION OF
MARINE PROTECTED AREAS ............................................................................................................... 45
4.1. ABSTRACT .......................................................................................................................................................... 46
4.2. INTRODUCTION ................................................................................................................................................. 47
4.3. MATERIALS AND METHODS ............................................................................................................................ 49
4.3.1 Sampling design............................................................................................................................................ 49
4.3.2 DNA extraction and markers amplification .................................................................................... 52
4.3.3 Mitochondrial genetic diversity ............................................................................................................ 53
4.3.4 Microsatellite genetic diversity ............................................................................................................. 53
4.3.5 Genetic differentiation and structure ................................................................................................. 54
4.4. RESULTS ............................................................................................................................................................. 56
4.4.1 Genetic diversity ........................................................................................................................................... 56
4.4.2 Genetic structure and connectivity patterns ................................................................................... 58
4.5. DISCUSSION ....................................................................................................................................................... 65
4.5.1. Patterns of genetic diversity within locations ............................................................................... 65
4.5.2. Patterns of genetic structuring among locations ........................................................................ 66
4.5.3. Genetic connectivity within locations ................................................................................................ 68
4.6. ACKNOWLEDGMENTS ...................................................................................................................................... 70
4.7. SUPPLEMENTARY MATERIALS ........................................................................................................................ 70
CHAPTER V: GUIDELINES FOR THE DESIGN OF MARINE PROTECTED AREAS, USING
GENETIC CONNECTIVITY AND DIVERSITY TOOLS ....................................................................... 75
WHY MONITOR GENETIC CONNECTIVITY AND DIVERSITY .................................................................................. 77
HOW TO MONITOR GENETIC CONNECTIVITY AND DIVERSITY ............................................................................ 78
A CASE STUDY ON FISHES: THE SADDLED SEA BREAM ........................................................................................ 81
A CASE STUDY ON INTERTIDAL INVERTEBRATES: THE LIMPETS ....................................................................... 82
REMARKS ................................................................................................................................................................... 83
3
CHAPTER VI: GENERAL DISCUSSION ................................................................................................. 85
ANNEX: COMMUNICATION AND OUTREACH .................................................................................. 89
SHORT ANIMATION MOVIE ...................................................................................................................................... 90
CONFERENCE: ECSA54, SESIMBRA, PORTUGAL, 12-16 MAY 2014 ............................................................. 92
Population connectivity within and among Mediterranean MPAs: a case study using two
closely related intertidal species (abstract). ...............................................................................................92
Morphometric and genetic distinctness between two closely related species of limpets
(Patella rustica and Patella caerulea) among Marine Protected Areas in the western
Mediterranean sea (poster) ................................................................................................................................93
CONFERENCE: MMMPA, ANCONA, ITALY. 15 - 17 OCTOBER, 2015 ............................................................ 94
Guidelines on genetic connectivity as a tool for assessing the effectiveness of Marine
Protected Areas (abstract) ..................................................................................................................................94
Genetic connectivity as a tool for assessing the effectiveness of Marine Protected Areas.
MMMPA final conference. MMMPA final conference (poster) ............................................................95
REFERENCES .............................................................................................................................................. 96

4
Abstract
Marine Protected Areas (MPAs) were initially created to protect the living,
non-living, cultural and/or historical values from human activities. The Convention
on Biological Diversity (CBD; Earth Summit in Rio de Janeiro on 5 June 1992) has
set a target of protecting 10% of the coastal and marine areas by 2020, which has
led to a rapid increase in the creation of MPAs worldwide. Within this context,
there is a growing concern regarding the number of efficient MPAs. One of the
main issues is that biological or ecological features of marine species as well as
ecosystem processes are not taken into account in MPA design. Deciding criteria
for species management requires considerable information collected from a
number of sources, including morphometric data, genetic data and distributional
data. Morphometric tools are useful to study species taxonomy, or to provide
information about the morphological variability, size and growth of the species,
which is essential for MPA monitoring. Genetic tools can be use to resolve species
taxonomy or population structure, allowing to estimate genetic diversity and
connectivity of populations at different temporal and spatial scales. Both
morphometric and genetic data used in combination provide a powerful tool that
should be considered in MPA assessment. However, the accurate interpretation
and the integration of this information into marine spatial planning is specially
challenging. The aim of this PhD thesis was to develop a protocol for monitoring
Marine Protected Areas by studying the morphology and genetics of two closely
limpet species (Patella rustica and Patella caerulea) across MPAs in the Western
Mediterranean sea. Overall, the results of this thesis provides support the inclusion
of the morphological and genetic tools into management plans, and in the
guidelines for the monitoring to improve and/or maintain MPA health and
effectiveness.

5
PhD thesis outline
In Chapter I, an overall Introduction of the work is provided, raising the
questions: 1) MPAs are well design? 2) Why is important to integrate
morphometric and genetics tools for MPA design? 3) How do we identify and
integrate these tools in MPA design? At the end of the Chapter, I provided the
project context and aims of my PhD thesis.
In Chapter II a review of the literature and state of the art on genetic
connectivity in benthic invertebrates in temperate MPAs was carried out. In this
chapter a conceptual framework for planning effective studies on genetic
connectivity in MPAs network, including general recommendations on sampling
design, key species and molecular markers to use, were provided. I highlighted
the importance of a sampling design that includes protected and non-protected
sites, considering several species and different markers depending on the
temporal and spatial scales needed. The content of this chapter has been
published in Advances in Oceanography and Limnology (Marti-Puig et al., 2013).
In Chapter III, genetic and morphometrics of the two selected sympatric
species Patella caerulea and P. rustica, were investigated in the chosen locations,
which include MPAs and adjacent areas. The aim was to compare morphological
variability across sites and between species. A combination of genetic and
morphometric characters could clearly differentiate the species. Morphometric
methods detected a high morphological variability in Patella caerulea within sites.
Chapter II highlights the importance of combining morphometric and genetic tools
for MPA monitoring. The preliminary results of this study were presented, as a
poster, in the ECSA56 conference (ANNEX) in Sesimbra (Portugal).
In Chapter IV, levels of genetic diversity and structuring of P. caerulea and
P. rustica among and within four MPAs in the western Mediterranean Sea have
been investigated using a multifactorial hierarchical sampling design. For this
purpose, Patella populations were sampled in replicated sites inside and outside
MPAs and analysed using mitochondrial and nuclear markers. This work aimed to
answer specific questions: 1) are there significant differences in genetic variability
inside and outside MPAs?; 2) is there a significant genetic structuring among
populations across MPAs and within them?; 3) are the genetic features of the two

6
species comparable? Mitochondrial marker showed high genetic connectivity over
long term at Mediterranean scale, suggesting that western Mediterranean MPAs
could be studied as a single management unit. Microsatellite DNA revealed
detailed patterns on the genetic structure at MPA scale variable between species
and sites. The results from this chapter put in evidence the importance to use
multi-species and multi-scale approaches for the study of genetic diversity and
connectivity.
In Chapter V, I provide the guidelines for MPA design criteria, integrating
the results obtained in Chapter III and the results obtained by another partner of
the MMMPA project working on fish connectivity. Data generated by all the Work
Packages of the MMMPA project were integrated in the guidelines for MPA design
criteria and for the establishment of a coherent network of MPAs in the
Mediterranean. These guidelines were delivered to the European Union (Marti-
Puig, 2016). The results from Chapter V highlight the importance of genetic
diversity and connectivity studies for the integration into MPA management.
The outcomes in communication and outreach (e.g. creation of a short
animation movie, conference presentations…) carried out during the MMMPA
project are included in the ANNEX.

7
CHAPTER I. GENERAL INTRODUCTION
Marine Protected Area of Tavolara, Sardegna, Italy. Photo source: Patricia Marti-Puig

8
1.1. Marine Protected Areas (MPAs): are they well designed?
Due to the anthropogenic impacts on the ocean during the lasts decades,
marine resources are becoming more and more overexploited. An increase in
human activities and population expansion towards the coast has caused a rapid
degradation of the ocean‘s functions and biodiversity (Lubchenco et al., 2003).
Several studies demonstrate that fishes and other exploited marine populations
have collapsed (Hutchings and Reynolds, 2004; Halpern et al., 2008) and there is
an increasing need to protect and preserve the marine habitats and their
resources.
Marine Protected Areas (MPAs) were initially created to protect the living,
non-living, cultural and/or historic heritage from human activities. Nowadays,
MPAs are the hope to preserve marine biodiversity and ecosystem processes. A
MPA is defined as ―any area of intertidal or subtidal terrain, together with its
overlying water and associated flora, fauna, historical and cultural features, which
has been reserved by law or other effective means to protect part or all of the
enclosed environment‖ (Kelleher, 1996). MPAs have an important effect
preserving the biomass of fishes and other marine fauna and flora, thus
contributing by the spill over effct to the or dissemination of larvae and adults
outside the reserve (Polunin and Roberts, 1993; Russ, 2002).
Figure 1.1. Distribution of Mediterranean MPAs. Relative size of each MPA is shown according to
different class sizes. Source: Abdulla et al., 2009

9
The Convention on Biological Diversity (CBD; Earth Summit in Rio de
Janeiro on 5 June 1992) has set to protect the 10% of the coastal and marine
areas by 2020, which has led to a rapid increase in the creation of MPAs
worldwide. However, we are still far to reach CBD target. For example, in the
Mediterranean Sea, the marine protected and managed areas cover only the 4%
of the entire basin, 0.4% excluding the Pelagos Sanctuary (Figure 1.1). Within this
context, there is a growing concern regarding the number of effective MPAs
(Agardy, 1994; Babcock et al., 2010; Edgar et al., 2014), that should be able to
maintain marine ecosystem functioning and preserve marine species, or if they are
just ―paper MPAs‖.
One of the main issues about MPAs planning and establishment is that
they are not usually designated taking into account the biology and ecology of the
marine species, and their habitats. MPAs are usually designed and managed as
isolated units, which is not enough to ensure the resilience of marine ecosystems,
since most marine species are arranged in metapopulations, connected by the
movement of adults or larvae (Kaunda-Arara and Rose, 2004; Starr et al., 2004).
The selection of the target (e.g. species, habitat, processes) in planning MPA
design are very relevant, as each organism is unique in terms of biology and
ecology. Size, locations and spatial arrangement of MPAs is depending on the
species, set of species or area of study. Marine organisms have a wide range
larval or adult dispersal distances that can vary depending on the species from
meters to 1000km (Palumbi, 2003; Coleman et al., 2011), influencing their
distribution, genetic structure and connectivity patterns (Fig 1.3.; Coleman et al.,
2011, Toonen et al., 2011; Berumen et al., 2012). Well-connected populations
have the potential to enhance the persistence of marine species, contributing to
stabilize ecosystems processes. Export of larvae from source population that can
help the recovery sink populations impacted by disturbances (Hastings and
Botsford, 2006). Design of Marine Protected Areas requires an understanding of
larval transport in and out, whether these areas will be self-seeding, whether they
will import recruits from surrounding exploited areas, and whether they can
exchange recruits to other areas (Palumbi, 2003). Moreover, MPAs are generally
not designed to protect genetic diversity, which is essential for the long term
viability of marine populations, by allowing populations to preserve their adaptive
and evolutionary potential (Bernhardt and Leslie, 2013). Finally, the ability of
species and ecosystems to adapt to changing conditions, is an essential
10
component of ecological resilience. Adaptive capacity will depend on the
phenotypic plasticity, dispersal and evolutionary genetic change (Williams, 2008;
Hoffmann and Sgrò, 2011). All these components are central for MPA assessment
and conservation management strategies, helping to define units of conservation
for designing future Marine Protected Areas and ensure resilience of populations
(Kritzer and Sale, 2004; Pineda et al., 2007; Jones et al., 2009, Gaines et al.,
2010).
1.2. Morphometric and population genetics in MPA design
Deciding location, size and boundaries for protection of marine species
requires considerable information collected from a number of sources, including
morphometric data, genetic data and distributional data. New morphometric and
genetic tools are now available providing several advantages in analysing species
distribution and population connectivity, specially since they have become more
efficient and non-destructive, allowing their application on endangered species and
focal species (Calò et al., 2013, Marti-Puig et al., 2013; Csencsics et al., 2010).
Morphometric tools are useful to study species taxonomy, or to provide
information about the morphological variability, size and growth within species,
which is essential for MPA monitoring. Morphometrics implies quantitative
measurement and analysis of morphological traits, such as size and shape, which
has traditionally been accomplished using manual linear measures. Nowadays,
morphometric methods using digital images offer a new quick and precise tool to
analyse morphometric traits (MacLeod et al., 2000; Rohlf and Marcus, 1993).
These powerful methods offer several advantages rather than traditional methods,
by facilitating better data collection, more effective descriptions of shape, and new
analytical tools (Cadrin and Friedland, 1999, Bookstein, 1997).
Genetic tools can be use to study species taxonomy or the population
structure, providing unique information for marine protection, management, and
spatial planning at different temporal and spatial scales (Pelc et al., 2009). These
tools allow estimating genetic diversity of the populations and their connectivity by
assessing changes and differences in the frequency of the genes (Hedgecock et
al., 2007). Genetic tools have been applied for the evaluation of population

11
connectivity and diversity in a wide variety of marine taxa. Different genetic
markers can be used to estimate genetic structure and connectivity of populations,
depending on the species and the temporal or spatial scale of interest (Selkoe and
Toonen, 2006).
Morphometric and genetic tools can be combined to disentangle species
or populations, when species identification is challenging, e.g. in the case of some
invertebrate species and fish species (Cadrin and Friedland, 1999). The use of
genetic and morphological data also allows the interpretation of patterns of
variability, enabling the investigation of the source of a possible inter-population
variation (Silva et al., 2010).
1.3. Integrating morphometric and genetic data in MPA design
Morphometry can be measured using traditional manual methods and
digital methods (such as landmark or outline methods). Digital morphometric
methods offer the advantage of capturing differences in structures that are not
easily observed by traditional types of measurements. Size and shape of the
organisms can be detected by a semi-automatic identification of the outline of the
organism. Outline methods use empirical functions to represent coordinates of
outline shape (Rohlf and Marcus, 1993). The most common outline method
involves fitting a Fourier series to the point coordinates along the perimeter of a
morphometric feature (Kaesler and Waters, 1972). Fourier Shape Descriptors
(EFDs) are commonly used as multivariate observations for discriminant analysis,
and several studies have successfully used these methods for analysing different
organisms, such as fishes (otoliths shape) and marine invertebrates (reviewed by
Friedland, 1996). Several descriptors related to the identification of the species, of
growth patterns, size and shape, can be used in population monitoring for MPA
management (e.g. González-Wangüemert et al., 2014, Silva et al., 2010).
Genetic markers and indexes allowing the description of the populations
genetic structure and patterns could be used and integrated into MPA design
(Figure 1.2). Mitochondrial DNA (mtDNA), with slow rates of evolution, provides
information at large spatial and long temporal scales, therefore, it can be used to
define genetically distinct populations or marine management units at scale of
networks (Beger et al., 2014). In contrast, microsatellite markers, with high
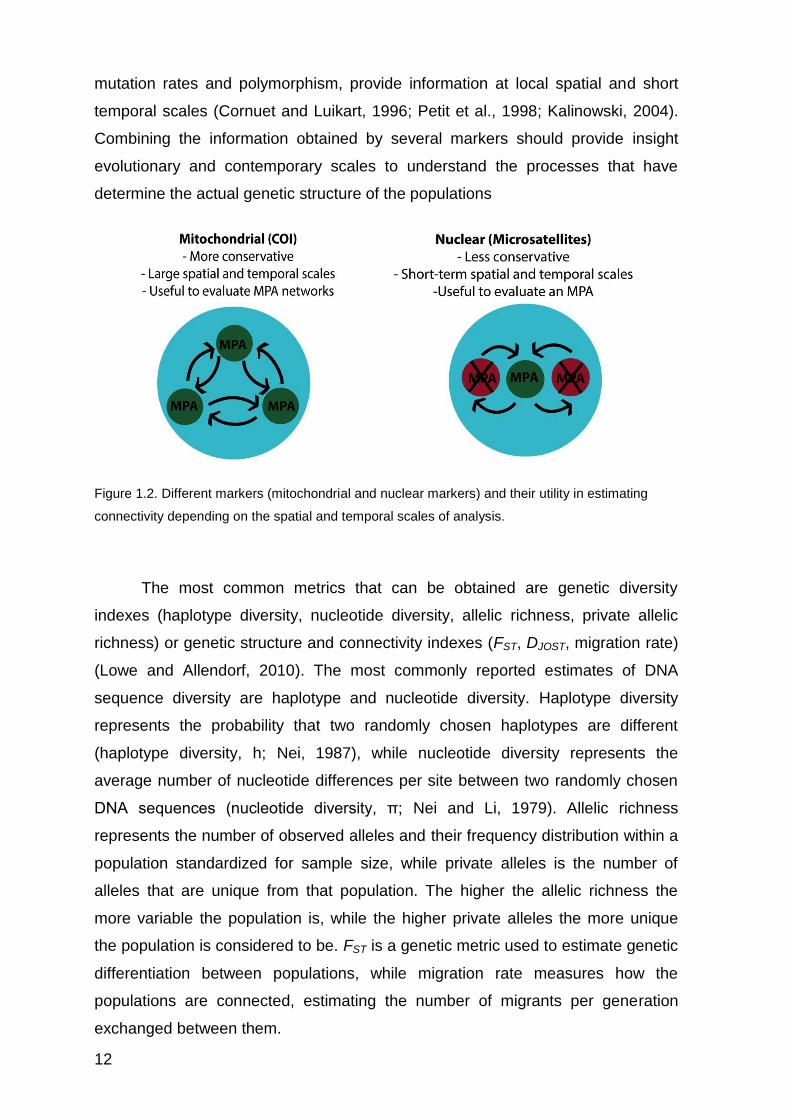
12
mutation rates and polymorphism, provide information at local spatial and short
temporal scales (Cornuet and Luikart, 1996; Petit et al., 1998; Kalinowski, 2004).
Combining the information obtained by several markers should provide insight
evolutionary and contemporary scales to understand the processes that have
determine the actual genetic structure of the populations
Figure 1.2. Different markers (mitochondrial and nuclear markers) and their utility in estimating
connectivity depending on the spatial and temporal scales of analysis.
The most common metrics that can be obtained are genetic diversity
indexes (haplotype diversity, nucleotide diversity, allelic richness, private allelic
richness) or genetic structure and connectivity indexes (FST, DJOST, migration rate)
(Lowe and Allendorf, 2010). The most commonly reported estimates of DNA
sequence diversity are haplotype and nucleotide diversity. Haplotype diversity
represents the probability that two randomly chosen haplotypes are different
(haplotype diversity, h; Nei, 1987), while nucleotide diversity represents the
average number of nucleotide differences per site between two randomly chosen
DNA sequences (nucleotide diversity, π; Nei and Li, 1979). Allelic richness
represents the number of observed alleles and their frequency distribution within a
population standardized for sample size, while private alleles is the number of
alleles that are unique from that population. The higher the allelic richness the
more variable the population is, while the higher private alleles the more unique
the population is considered to be. FST is a genetic metric used to estimate genetic
differentiation between populations, while migration rate measures how the
populations are connected, estimating the number of migrants per generation
exchanged between them.
13
All these tools provide important information about the morphology, and
genetic structure of the populations that should be considered for the MPA design.
However, the accurate interpretation and the integration of this information into
marine spatial planning is specially challenging (Putman and Carbone, 2014).
Moreover, there is a need to develop a protocol able to communicate, in a
comprehensible way, this information to marine policy and management
communities.
1.4. Project context and aims
My PhD project was developed within the European funded project, the
training network for Monitoring Mediterranean Marine Protected Areas (MMMPA;
FP7-PEOPLE-2011-ITN). The aims of the MMMPA project were to train a new
generation of MPA scientists and managers, equipping them with a flexible set of
skills essential within a wide range of professional environments, including public
administration, local authorities, industry and academia, and to improve the
methods for assessing the current status of MPAs in the Mediterranean Sea. To
reach this goal, the project was divided in work packages (WP) to study
biodiversity assessment and ecosystem functioning (WP1), local fisheries
description and management (WP2), biodiversity threats (WP3), socio-economic
assessment (WP4) and integrated coastal zone management (WP5). At the end of
the project guidelines on the application of innovative MPA monitoring approaches
were delivered to the European Union to the Mediterranean MPA managers. My
PhD project was within the WP3 (WP 3.1 - Connectivity among populations of the
genus Patella among Mediterranean Marine Protected Areas).
The aim of this PhD thesis was to develop a protocol to include morphometry
and population genetics in monitoring of Marine Protected Areas. The study
focussed on two closely related limpet species (Patella caerulea Linnaeus, 1758
and Patella rustica Linnaeus, 1758) that were analysed across 4 MPAs in the
Western Mediterranean sea. Patella species were used as key species because:
a) they have a widespread distribution and are relatively easy to collect, b) they
reproduce by planktonic larvae that can be spread over long distances by the
oceanographic currents (Ribeiro, 2008), c) they play a key ecological role in
intertidal habitat (Arrontes et al., 2004, Guerra and Gaudencio, 1986); d) they are
vulnerable to anthropogenic pressures, including trampling, human harvesting,
14
and climate change (Guerra-Garcıa et al., 2004) e) there are available genetic
markers and previous studies in the Mediterranean provide a background on the
population structure of the species (Pérez et al., 2007; Sá‐ Pinto et al., 2010,
Villamor A, 2014, Fauvelot et al., 2009) f) as other marine invertebrates they show
a high morphological variability, challenging species identification and monitoring
(Mauro et al., 2003).
Overall, this thesis provides a guideline to include morphology and genetics
into specific monitoring and management plans that will improve and/or maintain
MPA health and effectiveness.

15
Chapter II: RESEARCH BIBLIOGRAPHY AND MARINE
PROTECTED AREA SAMPLING DESIGN CRITERIA
Publication note: The content of the following chapter has been published:
Patricia Marti-Puig, Federica Costantini, Luca Rugiu, Massimo Ponti & Marco
Abbiati (2013) Patterns of genetic connectivity in invertebrates of temperate MPA
networks, Advances in Oceanography and Limnology, 4:2, 138-149, DOI:
10.1080/19475721.2013.850445
16
2.1. Abstract
Temperate reefs are among the most threatened marine habitats due to
impacts caused by high density of human settlements, coastal development,
pollution, fisheries and tourism. Networks of marine protected areas (MPAs) are
an important tool for ensuring long-term health and conservation of ecological
processes in the marine environment. Design of the MPA network has to be based
on deep understanding of spatial patterns of species distribution, and on the
make-up of connectivity among populations. Most benthic invertebrates are sessile
and/or sedentary in the adult phase, and their dispersal relies mainly on the
gametes and/or larval behaviours. Genetic markers allow us to quantify gene flow
and structuring among populations, and to infer patterns of genetic connectivity.
Based on the information available in the peer-reviewed literature on genetic
connectivity in benthic invertebrates of temperate MPAs, we provide a comment
about the gaps and the needs. Moreover, we propose a rationale to plan and
optimise future studies on this topic. A conceptual framework for planning effective
studies on genetic connectivity in an MPAs network is provided, including general
recommendations on sampling design, key species and molecular markers to use.
Keywords: marine protected areas; temperate biogenic reefs; sampling
design; molecular markers; population genetics

17
2.2. Introduction
Temperate reefs are primary or secondary hard substrata, which include
rocky bottoms, vertical cliffs and a variety of biogenic structures (e.g. oysters and
mussels beds, vermetid and sabellarid reefs, trottoire, coralligenous rims and
banks, deep-sea corals), located in areas with a temperate climate and subjected
to a relatively moderate seasonal changes Spalding et al., 2007. Temperate reefs
support some of the most productive and diverse assemblages Suchanek, 1994
providing habitat, feeding grounds, recruitment and nursery areas for a variety of
invertebrate and vertebrate species. Subtidal biogenic reefs also are hot spots of
biodiversity in many temperate seas (e.g. Mediterranean Sea (Coma et al., 2006;
Coll et al., 2010, temperate Australian waters (Wernberg et al., 2011). Temperate
coastal habitats, similarly to the tropical ones (Roberts et al., 2002; Hughes et al.,
2003; Bellwood et al., 2004), host the majority of world‘s human population, and
are among the most threatened habitats globally due to density of human
settlements, coastal development, pollution, fisheries and tourism (Airoldi and
Beck, 2007; Lotze et al., 2011). However, understanding of the ecological
processes and functioning of temperate marine habitats, as well as their
conservation status, is inadequate (Kennish, 2002; Steneck et al., 2002;
Thompson et al., 2002; Airoldi and Beck, 2007; Lotze et al., 2011).
The International Union for Conservation of Nature (IUCN) defines the
Marine Protected Areas (MPAs) as a ―clearly defined geographical space,
recognized, dedicated and managed, through legal or other effective means, to
achieve the long-term conservation of nature with associated ecosystem services
and cultural values‖. As a rule, they are designed to reduce anthropogenic impacts
that nowadays threat the entire marine realm (Airoldi and Beck, 2007; Baskett et
al., 2007; Gaines et al., 2010; Lotze et al., 2011). MPAs are considered an
effective tool to preserve and restore habitats and biodiversity, re-establish over-
harvested marine resources and to manage fisheries (Claudet et al., 2008;
Claudet et al., 2010; Gaines et al., 2010; Coleman et al., 2011). Although to date
about 7,000 MPAs have been established worldwide, less than 2% of the world
oceans and seas are currently protected and only a small proportion of MPAs are
located in temperate areas (source http://www.mpatlas.org/). Moreover, MPAs are
usually located in coastal or insular areas, and only recently attempts to establish
18
MPAs in the pelagic domain have been made (Guidetti et al., 2013). Networks of
MPAs are widely acknowledged to be an important tool for ensuring the long-term
health and conservation of ecological processes in the marine environment
(Lubchenco et al., 2003). To correctly design a network of MPAs a deep
understanding of spatial patterns of species distribution, focusing on endangered
and threatened taxa (Sala et al., 2002; Roberts et al., 2003), and on the makeup of
genetic connectivity among populations is needed.
The term connectivity has been recently introduced in marine ecology
(Cowen et al., 2000), being related to marine populations. A formal definition of
this term has been provided in 2002, in the special issue ―Open vs. Closed Marine
Populations - Synthesis and Analysis of the Evidence‖ of the Bulletin of Marine
Science: ―the degree to which local larval production results in recruitment to other
populations‖ (Warner and Cowen, 2002). Investigating levels of connectivity
(evolutionary and demographic) allow to: a) define ranges of effective larval
dispersal (Villamor A, 2014) b) understand the supply of larvae and adults into and
out of a MPA (Palumbi, 2003) c) quantify gene flow and assess levels of genetic
diversity. Connectivity ensures the long-term persistence and resilience of
populations under current and future scenarios of anthropogenic change (Kaplan
et al., 2009; Planes et al., 2009). Different methods can be used to measure
connectivity, and each method is best suited to address different ranges of spatial
and temporal scales of variation (Jones et al., 2009). Direct methods, such as
visual observations and mark-recapture, provide the most accurate information on
animal movement over demographic time-scales, but not over evolutionary time
scales (Kool et al., 2013). Moreover, direct methods are affected by small spatial
or seasonal variations in recruitment that may not be informative over larger
spatial or temporal horizons. The majority of the literature on this topic analyses
the importance of connectivity in MPAs network based on commercial and non-
commercial fishes and corals (Charton et al., 2000; Crooks, 2006; Cowen and
Sponaugle, 2009; Kool et al., 2013). However, benthic invertebrates, which include
several habitat formers and ecosystem engineers (e.g. oysters, mussels,
polychaetes, bryozoans, corals), are important species in temperate reefs habitats
since they are conducive to the establishment of the rich species assemblages.
Keystone predators and eroding taxa are shaping the morphology and dynamics
of these habitats (Piraino et al., 2002). Benthic invertebrates usually have sessile
or sedentary adult phase, and their dispersal relies mainly on the gametes and/or

19
on larval behaviours. However, for these species it is not always possible to use
direct method to measure connectivity patterns due to the difficulties in tracking
the larvae in the field, therefore indirect approaches are needed.
Genetic markers, able to discriminate the spatial scales at which populations
can be differentiated into discrete units, allow us inferring on patterns of genetic
connectivity. Genetic connectivity represents the degree to which gene flow affects
evolutionary processes among populations, and genetic structure estimators
provide a proxy of the number of larvae migrating between populations. Recent
studies have shown that larval pelagic duration could be poorly correlated with
genetic structure, which is recording the effective migration between populations
(Kelly and Palumbi, 2010). Gene flow is affected by other factors, such as larval
ecology, life history of the species, stochastic processes in population and
oceanographic conditions (Weersing and Toonen, 2009; Marshall et al., 2010;
Selkoe et al., 2010; Jaquiéry et al., 2011; Basterretxea et al., 2012; Sundelof and
Jonsson, 2012). Genetic connectivity can be estimated by different tools and
genetic markers (e.g. allozymes, mitochondrial DNA, nuclear DNA). Effectiveness
of the genetic tools may vary, depending on the species and on the spatial and
temporal scales of interest (Hellberg et al., 2002; Berumen et al., 2012).
The aim of this work is to summarize the information available in the
literature on genetic connectivity in temperate MPAs with a focus on marine
invertebrates. A survey of the scientific literature has been done based on species,
molecular markers, and spatial scales. Moreover, the gaps in available information
and possible approaches to address these gaps were discussed. Criteria for
planning effective studies to analyse genetic connectivity in MPAs network are
discussed, including the importance of larval connections within an MPA, among
MPAs, and between MPAs and surrounding non-protected areas (Jones et al.,
2009).
20
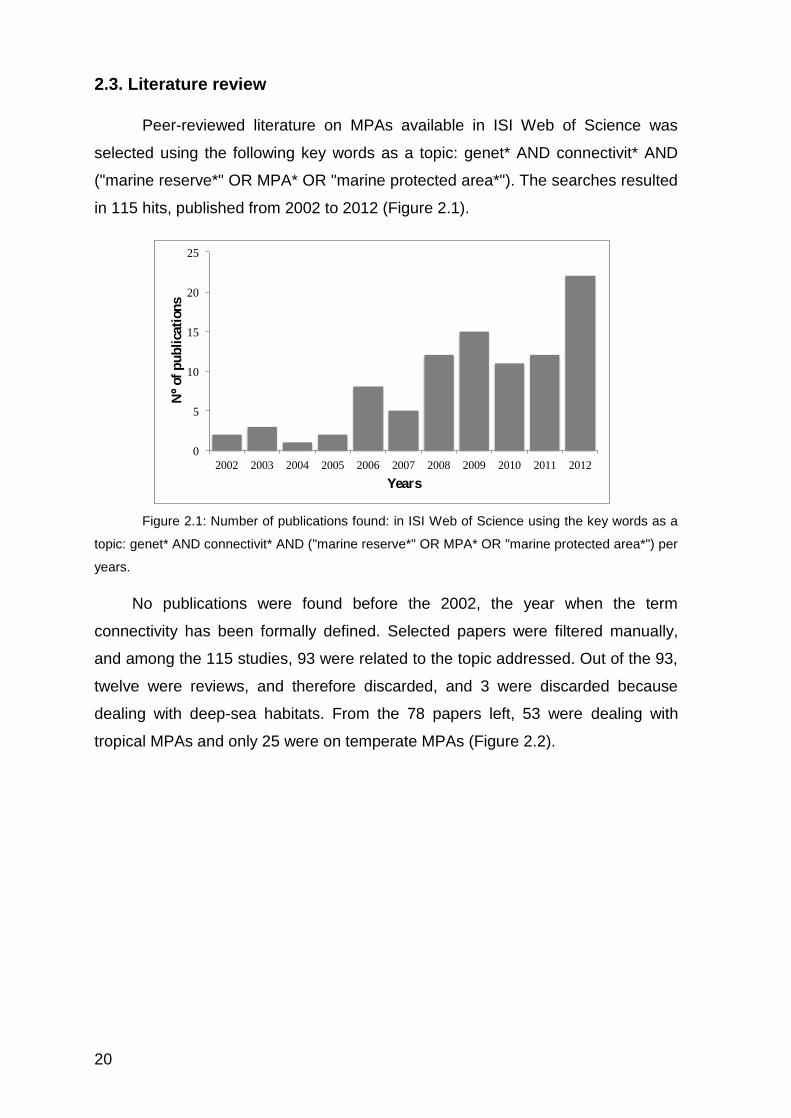
2.3. Literature review
Peer-reviewed literature on MPAs available in ISI Web of Science was
selected using the following key words as a topic: genet* AND connectivit* AND
("marine reserve*" OR MPA* OR "marine protected area*"). The searches resulted
in 115 hits, published from 2002 to 2012 (Figure 2.1).
Figure 2.1: Number of publications found: in ISI Web of Science using the key words as a
topic: genet* AND connectivit* AND ("marine reserve*" OR MPA* OR "marine protected area*") per
years.
No publications were found before the 2002, the year when the term
connectivity has been formally defined. Selected papers were filtered manually,
and among the 115 studies, 93 were related to the topic addressed. Out of the 93,
twelve were reviews, and therefore discarded, and 3 were discarded because
dealing with deep-sea habitats. From the 78 papers left, 53 were dealing with
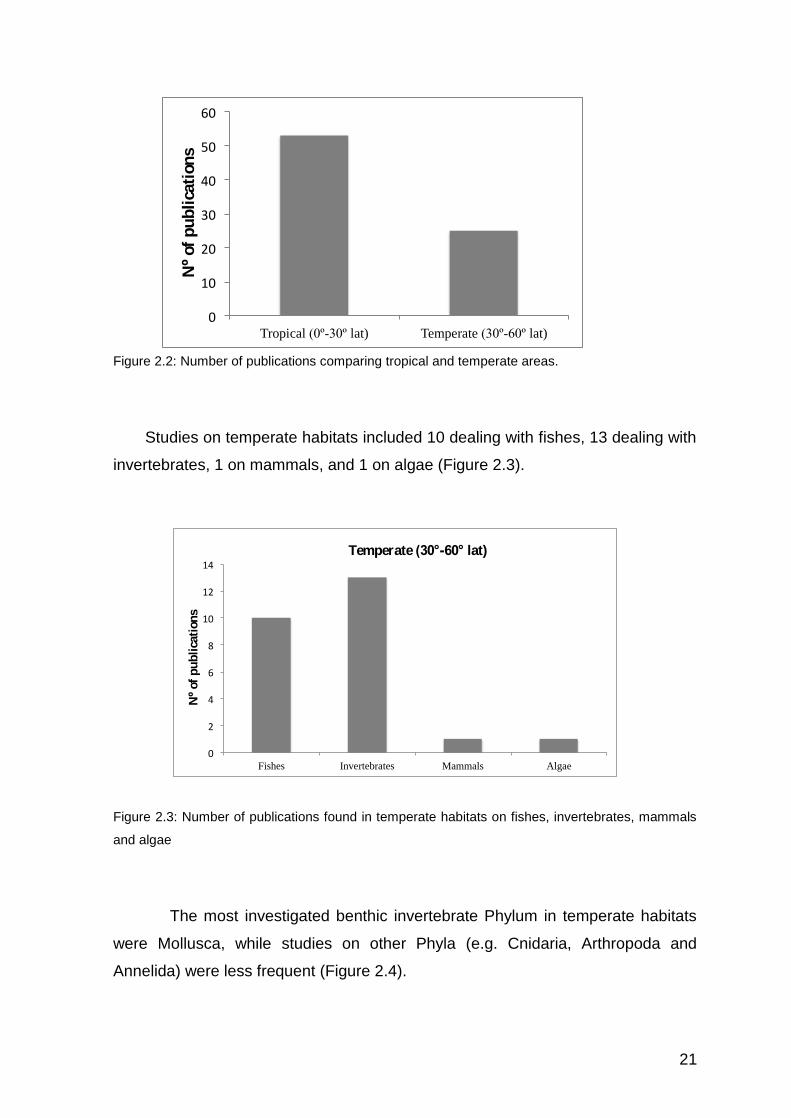
tropical MPAs and only 25 were on temperate MPAs (Figure 2.2).
0
5
10
15
20
25
2002 2003 2004 2005 2006 2007 2008 2009 2010 2011 2012
Nº
of
pub
lica
tions
Years
21
Figure 2.2: Number of publications comparing tropical and temperate areas.
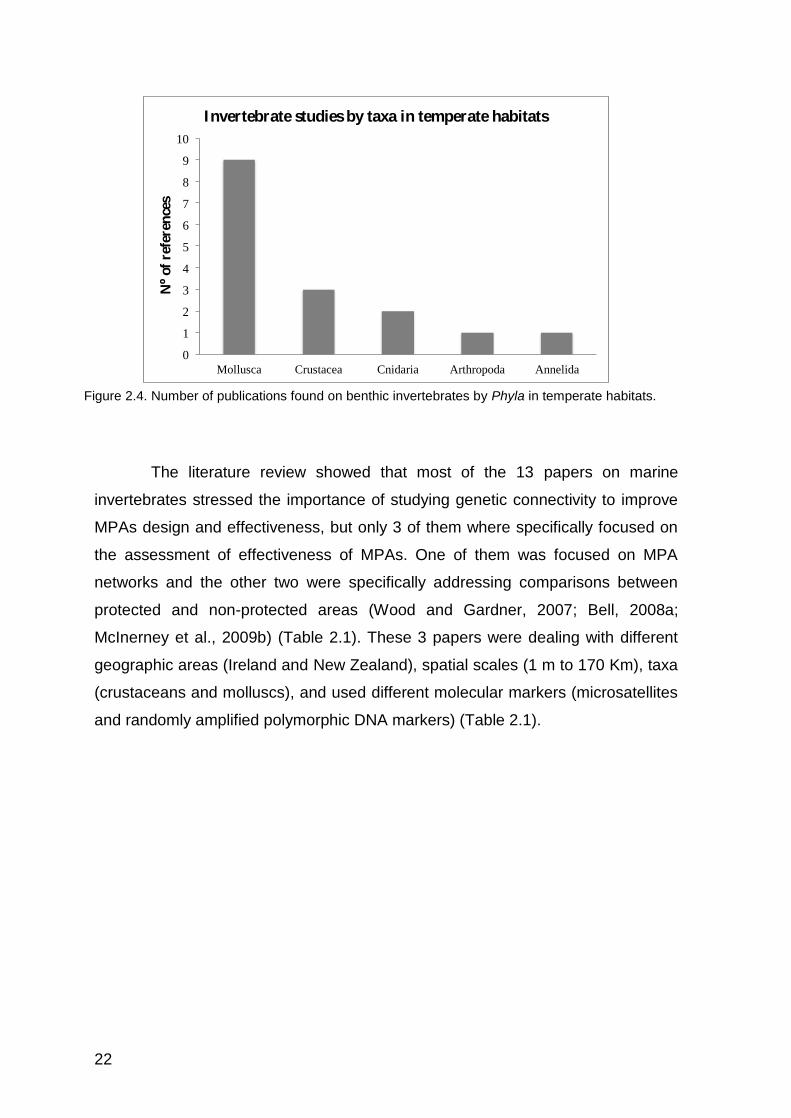
Studies on temperate habitats included 10 dealing with fishes, 13 dealing with
invertebrates, 1 on mammals, and 1 on algae (Figure 2.3).
Figure 2.3: Number of publications found in temperate habitats on fishes, invertebrates, mammals
and algae
The most investigated benthic invertebrate Phylum in temperate habitats
were Mollusca, while studies on other Phyla (e.g. Cnidaria, Arthropoda and
Annelida) were less frequent (Figure 2.4).
0
10
20
30
40
50
60
Tropical (0º-30º lat) Temperate (30º-60º lat)
Nº
of
pu
blica
tion
s
0
2
4
6
8
10
12
14
Fishes Invertebrates Mammals Algae
Nº
of
pu
blica
tions
Temperate (30°-60° lat)
22
Figure 2.4. Number of publications found on benthic invertebrates by Phyla in temperate habitats.
The literature review showed that most of the 13 papers on marine
invertebrates stressed the importance of studying genetic connectivity to improve
MPAs design and effectiveness, but only 3 of them where specifically focused on
the assessment of effectiveness of MPAs. One of them was focused on MPA
networks and the other two were specifically addressing comparisons between
protected and non-protected areas (Wood and Gardner, 2007; Bell, 2008a;
McInerney et al., 2009b) (Table 2.1). These 3 papers were dealing with different
geographic areas (Ireland and New Zealand), spatial scales (1 m to 170 Km), taxa
(crustaceans and molluscs), and used different molecular markers (microsatellites
and randomly amplified polymorphic DNA markers) (Table 2.1).
0
1
2
3
4
5
6
7
8
9
10
Mollusca Crustacea Cnidaria Arthropoda Annelida
Nº
of
refe
ren
ces
Invertebrate studies by taxa in temperate habitats

Species Geographic region MPA sampling
design
Spatial
range
Gleick et al.,
LD
(days)
Genetic
marker Reference
Min Max
Semibalanus
balanoides
Irish Sea, Ireland (Lundy, Skomer MNR and
Inishmean, Inishbofin SAC)
MPAs vs. non-
MPAs
5 80 28-42
1
Microsatellites Bell, 2008a
Nucella lapillus Irish Sea, Ireland (Strangford Lough MNR) MPA vs. non-
MPA
5 8 0 2 Microsatellites Bell, 2008a
Nucella lapillus Irish Sea, Ireland (Strangford Lough MNR) MPA vs. non-
MPA
0.001 170 0 2 Microsatellites McInerney et al.,
2009b
Scutellastra
kermadecensis
SW Pacific Ocean, New Zealand (Kermadec
Islands MR)
MPAs network 0.5 150 4-10 3 RAPDs Wood and
Gardner, 2007
Siphonaria raoulensis SW Pacific Ocean, New Zealand (Kermadec
Islands MR)
MPAs network 1 7 4-10 3 RAPDs Wood and
Gardner, 2007
Table 2.1. Genetic connectivity studies using invertebrate temperate species for the evaluation of MPA design. LD= Larval dispersal; MR=Marine Reserve;
MNR=Marine Natural Reserve; MPA=Marine Protected Areas; RAPDs= Randomly Amplified Polymorphic DNA markers. 1 Larval dispersal based on Dufresne
et al., ; 2 No planktonic larvae dispersal;
3 Estimation of the larval dispersal based on Patella species Dodd, 1957b

Patricia Marti Puig - PhD thesis – March 2016
24
All the species under study were intertidal and differed in reproductive
behaviour and pelagic larval duration (PLD). They ranged from species with no
larval dispersal Bell, 2008; medium PLD, 4 to 10 days (Scutellastra
kermadecensis, Siphonaria raoulensis (Dodd, 1957; Wood and Gardner, 2007;
Bell, 2008b) and long PLD, 28-42 days (Semibalanus balanoides; Dufresne et al., ;
Bell, 2008a). All of them used structured sampling design to test the effectiveness
of MPAs. McInerney McInerney et al., 2009c evaluated the function of the
Strangford Lough Marine Reserve (Ireland) analysing the spatial genetic
structuring of the dogwhelk Nucella lapillus. They included in the sampling design
five populations within the Marine Reserve at least 15 kilometres apart, and two
populations‘ outside the reserve. Similarly, Bell, 2008b analysed connectivity
between MPA and non-MPA populations, where the MPA populations were
situated on island while the non-MPA were on the mainland. Bell revealed a
common pattern for the two species, with lower genetic differentiation found
between adjacent sites on the mainland (no MPA) than between the island MPAs
suggesting that special consideration must be given to the MPA located on
islands, because they may not be well connected with the surrounding
populations. Similarly, Wood and Gardner (2007) examined genetic structuring
and connectivity among populations of 2 intertidal limpets in populations within the
Kermadec Islands Marine Reserve network (Australia) without taking into account
populations outside the reserve.
2.4. MPA connectivity and sampling design
The literature survey showed that most papers dealing with effectiveness
of MPAs in temperate regions using marine invertebrates as target taxa, do not
apply a sampling design structured to test this hypothesis. Mokhtar-Jamai (2011)
studied the genetic structure of the red gorgonian Paramuricea clavata in the
Western Mediterranean, among the regions of Medes, Marseille and North
Corsica. Although these regions are considered as protected areas, their
experiment was not design to formally test the efficiency of MPAs; but provides
25
valuable information to understand genetic structuring in this threatened species
and might be useful for future MPA studies.
Almany et al., 2009 provided general recommendations for the location,
size and spacing of reserves, and considerations for maintaining genetic diversity
based on larval dispersal data. However, they did not provide details on the
structure of the experimental design. To test the effectiveness of MPA and/or a
MPAs network appropriate experimental designs, as well as selection of species
and molecular markers are required.
2.4.1. Sampling design
The primary goal to take into account to develop an effective sampling
design is to clearly formulate the hypothesis to test. In order to have an efficient
MPAs network, each MPA populations has to be supported by larvae that settle
within that reserve‘s boundaries (self-recruitment) to maintain local populations,
while at the same time an exchange of larvae between MPAs (source-sink system)
should occur to maintain genetic diversity (Berumen et al., 2012). To evaluate the
effectiveness of MPAs, connectivity, genetic variability within and between the
MPAs has to be compared. The hypothesis should test if populations from
protected sites have higher levels of genetic variation compared to populations
from unprotected sites, as an expression of more ―healthy conditions‖ Frankham,
2005b, and quantify genetic structuring between MPAs. A comparative study
should allow to ascertain: 1) the role of MPA as ―source‖ of larvae to non-protected
areas (spills over effect), ensuring the replenishment of depleted or declining
populations (demographic connectivity); 2) the relationship between anthropogenic
pressures and the genetic variability of populations (evolutionary connectivity); and
3) MPA size required to support viable populations.
A sampling design set up for the study of an MPA, should be replicated in
other randomly selected MPAs, to be able to generalise the observed patterns and
to avoid confounding effects (Benedetti-Cecchi et al., 2003). A robust comparison
requires selecting sites with similar environmental conditions, considering the
different extent of MPAs and local geography, excluding unusual/isolated sites to
avoid bias while describing connectivity patterns (Hellberg, 1996). In several
studies on genetic structuring sample from a variety of different habitats (e.g.

Patricia Marti Puig - PhD thesis – March 2016
26
caves, walls, shallow, deep, mainland, island) have been merged in a single
analyses, and an ‗a posteriori‘ discussion attributed the observed patterns to site
features, without considering the lack of a specific hypothesis to test and
replication of the considered habitat features. Lack of structure and replication in
the sampling design creates major difficulties in the interpretation of the results,
facilitating the confounding effect. To avoid this problem a correct replication of
each investigated factors is needed.
Demographic structure of populations and environmental variable, such as
currents, tides, temperature, and pollution, are important aspects to consider in the
sampling design. In fact, combining genetic connectivity patterns with
demographic data and knowledge on environmental parameters integrating in a
fine-grained biophysical model should allow elucidating the distribution and
diversity of populations. Di Franco et al., 2012 combined visual observation,
oceanographic models and genetics (microsatellites) in the evaluation of protected
and non-protected areas. Sampling area, number of sampling sites, and distance
between sampling sites will depend primarily on the MPA size and on the species
selected. Recent studies showed a high variation in larval dispersal among marine
species, with larvae recruiting within the source population, while others dispersing
over large distances (10–100s of km; Jones et al., 2009). Scales of genetic
structuring of a species provide tips about the appropriate sampling distances
within and outside MPA. In intertidal limpet species, which have high dispersal
potential and are ubiquitous, distances between sampling sites could range
between 10 and 30 km (Bell, 2008b). In octocoral species, conversely, dispersal
capability is limited and they are patchily distributed, therefore distance between
sampling sites has to be less than 5 km (Hellberg et al., 2002; Mokhtar-Jamai et
al., 2011; Costantini et al., 2013). The number of sampling sites has to be decided
depending on the geographic extension of the study area. Moreover, the sampling
site has to be delimitated to properly characterise the genetic structure of the
population avoiding clones and collection of closely related individuals. For
example, in intertidal gastropods (Bell, 2008b) individuals were collected over 8-10
m apart, while in coral species 1-2 m distances are enough (Costantini et al.,
2007a).
27
2.4.2. Species selection
Marine invertebrates show great species diversity and a variety of life-
history traits, they have a widespread distribution and high abundance per unit
area; therefore they are good model organisms to investigate connectivity
patterns. Among them, benthic species better reflect current gene flow pattern,
since gene flow is mainly mediated by the early life stages (gametes, zygotes,
larvae, juveniles), while adults are fairly stationary. Since patterns in genetic
connectivity differ among species (Coleman et al., 2011), a multispecies approach
would allow investigating the occurrence of patterns of connectivity common to
several species, differing in their biological and ecological features (e.g. Toonen et
al., 2011; Berumen et al., 2012).
Identifying discontinuity zones in genetic structure shared by several
species would allow an objective validation of biogeographic zone and of
geographical evolutionary units. Conversely, lack of common patterns among
species may support occurrence of species-specific barriers to larval dispersal,
which may be related to biological peculiarities (e.g. life history, reproductive
behaviours, larval type, and dispersal) or to the demographic history of the local
population. Only in the last two years studies using a multispecies approach were
carried out. All of them suggested that this innovative approach allow a better
understanding of the evolutionary dynamics of the system as a whole, and
therefore the ability to better scale conservation measures (Kelly and Palumbi,
2010; Toonen et al., 2011; Drew and Barber, 2012) in temperate habitats, and
(Selkoe and Toonen, 2006) in tropical seas, used a large number of marine
species (including cnidarians, gastropods, crustaceans, echinoderms, reef fishes
and marine mammals), revealing patterns of genetic structure undetectable in
single species. In fact, as Drew and Barber (Drew and Barber, 2012) stressed
―selecting a reserve design based on any single species would not adequately
represent the evolutionary and ecological dynamics expressed in the other
species‖. Nevertheless, practical constrains (time and costs) do not allow a
complete analysis of the genetic patterns of the species occurring in the
assemblages, therefore it is important to select species with different ecological
and biological features and living in different habitats (e.g. subtidal vs. intertidal).

Patricia Marti Puig - PhD thesis – March 2016
28
2.4.3. Molecular markers
The choice of the molecular markers is also an important point to consider.
A variety of markers became available in the last decade. The selection of the
suitable marker depends on the species of focus and the spatial and temporal
scales of interest (see as review Hellberg et al., 2002). The most widely used
markers for genetic connectivity studies are microsatellite markers (tandem
repeats of 2–10 base pair nucleotide; e.g. Bell, 2008b; McInerney et al., 2009a)
that for their high polymorphism provide enough variability to define genetic
pattern of connectivity. To date the main problem related to these markers is that
they are species specific and only a limited number, if any, is available for most
species (for example 5 microsatellites in Semibalanas balanoides in Dufresne et
al., 1999; Bell, 2012). In case of multispecies analysis this could lead the choice of
a more ―common‖ molecular marker such as the mitochondrial DNA. The most
common used mitochondrial marker is cytochrome oxidase c subunit 1 Rousset,
2008 gene, since it is one of the most variable regions in the mitochondrial
genome (a part for corals and sponges, see Shearer and Coffroth, 2006). The
combination of both mitochondrial and nuclear (e.g. ITS, microsatellites) provide
the best approach for studying the evolutionary and contemporary gene flow (e.g.
Teske et al., 2010), however it is rarely applicable.
2.5. Implementation of the sampling design guidelines
The present study highlighted how little is known on connectivity among
MPAs in temperate marine habitats. Guidelines for the implementation of effective
sampling designs are needed. The power of multispecies studies and of the use of
markers differing in the evolutionary rates has been stressed. To date, only very
few studies integrated effective sampling design in the assessment of connectivity
among MPA (but see Di Franco et al., 2012 in the Mediterranean Sea and Foster
et al., 2012 in the Caribbean). They are important starting points to take in account
when a new study as to be set up to evaluate the effectiveness of the already
existing marine protected areas.
The Mediterranean Sea contains unique habitats and a variety of endemic
species (Bianchi and Morri, 2000), which conservation is among the priorities in
29
marine sciences. Despite the high number of Mediterranean MPAs, their design
and management is not based on a holistic approach and data on connectivity are
often lacking. International research projects provide an appropriate framework for
the implementation of effective sampling designs, and the Mediterranean could be
a suitable study case to assess genetic variability and population structure across
MPAs through the whole basin. In each MPA a hierarchical sampling design
should be implemented, including replicated sites inside and outside of the MPAs.
Distance among sites depends on the MPA size, the geomorphological and
environmental characteristics, and the target species. Species with different life
history traits and inhabiting different reef zones (e.g. intertidal vs. subtidal, cliffs vs.
caves) should be analysed (e.g. molluscs as Patella in rocky intertidal, gorgonians
as Eunicella in subtidal). Different nucleotidic polymorphic markers (both nuclear
and mitochondrial) have to be used to assess the extent and patterns of gene flow,
as well as the larval dispersal capability. The genetic results together with
ecological, demographical, biological and oceanographic data will be essential in
planning effective MPA networks and management strategies for the conservation
of marine biodiversity.
2.6. Acknowledgements
This research was funded by the European project ‗Training Network for
Monitoring Mediterranean Marine Protected Areas‘ (MMMPA: FP7-PEOPLE-2011-
ITN) [grant number 290056]. PMP was supported by a ‗Marie Curie Training
Network for monitoring Mediterranean Marine Protected Areas‘ (Early stage
researcher). FC was supported by a research fellowship (Assegno di Ricerca) of
the University of Bologna.

Patricia Marti Puig - PhD thesis – March 2016
30
Chapter III: Morphometric and genetic tools for Marine
Protected Area monitoring
Marine Protected Area of Portofino. Photo source: Patricia Marti Puig
Publication note: A modified version of the following chapter is in preparation for
submission: Patricia Marti-Puig, Massimo Ponti, Paolo G. Albano, Federica
Costantini & Marco Abbiati, Morphological and genetic tools for MPA monitoring in
two sympatric limpets (Patella rustica and Patella caerulea) in the Western
Mediterranean MPAs (in prep)
31
3.1. ABSTRACT
Many marine organisms show a high morphological variability, which often
represents a result of the phenotypic plasticity towards different environmental
conditions, such as wave exposure, substrate type and habitat. This variability can
lead to species misidentification using traditional methods, with serious
implications for monitoring activities and application of conservation policies, such
as in the Marine Protected Areas. In the present study, distinction and variability in
morphology of two common limpets, Patella rustica and P. caerulea, was studied
among Marine Protected Areas in the western Mediterranean Sea using genetics
and digital morphometric techniques. Genetic marker COI was used to identify the
species. Morphological variability of the two species was analysed using digital
morphometric shell characters and shape analysis. Morphometric measures and
shape analysis showed high morphological variability in both species, higher in
Patella caerulea. Our results showed that some morphological traits (mean
circularity, ratio height/longest diameter and solidity) and shape descriptors are
useful tools to discriminate and identify variability among and within the species.
Our results underline the importance of combining the use of genetic and digital
morphometric tools for MPA monitoring.
Patricia Marti Puig - PhD thesis – March 2016
32
3.2. Introduction
Many marine organisms show a high morphological variability, which
often represents a result of the phenotypic plasticity towards different
environmental conditions, such as wave exposure, substrate type and habitat
(Padilla, 2013). Phenotypic variability is important because it increase resilience of
populations as conditions change (Watters et al., 2003). However, this variability
can lead to species misidentification with serious implications for monitoring
activities, such as in the Marine Protected Areas, and additional methods should
be used.
Genetic analyses, when markers are available, can be useful tools to
identify species difficult to distinguish morphologically (Hebert et al., 2003). A
segment of the mitochondrial gene cytochrome c oxidase subunit I (Rousset,
2008) is the most commonly used barcode region in species identification of many
invertebrates (Kress and Erickson, 2008). COI has been already used to
discriminate among molluscs species and in particular Patella species (Mauro et
al., 2003; Sá-Pinto et al., 2005; Fauvelot et al., 2009). However, species
identification based on only few morphological characters or on a single molecular
marker, have a risk for misidentification which can raise conservation risks (Will et
al., 2005; Zachos et al., 2013).
Digital morphometric methods offer a good alternative to traditional methods
to select proper characters to identify species. These powerful techniques can
capture differences in structures that are not easily observed through traditional
types of measurements or by the naked eye. Digital images can be automatically
analysed using a computer softare (e.g. ImageJ) in order to measure the size of
the organism by a semi-automatic identification of the outline. This method have
been successfully used to disentangle the intraspecific variability and phylogeny of
a wide range of species, including shell morphology in mollusks (e.g. Kotsakiozi et
al., 2013). Additionally, if there is the need to capture much higher proportion of
the morphological information, geometric morphometric tools such as analysis
based on Fourier Shape Descriptors (EFDs) offer the possibility to analyse and
compare morphological shape independently of the size (Kuhl and Giardina, 1982;
Crampton, 1995; Van Bocxlaer and Schultheiß, 2010). EFDs can delineate any
form of two-dimensional shape with a closed contour and have been previously
used in other gastropod species for studying the shell shape (Williams et al., 2012;
33
Puillandre et al., 2009; de Aranzamendi et al., 2010; Costa et al., 2010; Van
Bocxlaer and Schultheiß, 2010; González-Wevar et al., 2011; Ramajo et al., 2013
). EFDs offer several important advantages, such as the invariance with respect to
scale, rotation and starting position of chain coding contour tracing (Iwata and
Ukai, 2002). Moreover, it does not require landmarks and offers the possibility to
visual size shape variation that might be difficult to describe (Hiraoka et al., 2004).
Limpets, as those of the genus Patella, often show a high phenotypic
variability and plasticity related to environmental conditions (Tlig-Zouari et al.,
2011). In some Atlantic and Mediterranean localities, it is known that species
belonging to Patella genus exhibit such a wide variability in shell coloration and
morphology that even an experienced observer can be confuse (Moore, 1934;
Evans, 1953; Bacci and Sella, 1970). Patella caerulea L. 1758 and Patella rustica
L. 1758 are the most common Mediterranean species of the genus. They usually
occur sympatrically in different zone on the Mediterranean rocky shores
(Bannister, 1975). Genetic analyses along with morphometric methods may allow
to disentangle between morphologically similar species and to evaluate the
morphological plasticity in relation to the environmental variability.
The aim of this research was to evaluate the distinction and variability of
two sympatric limpets (Patella rustica Linnaeus 1758 and Patella caerulea
Linnaeus 1758) in four western Mediterranean MPAs using different morphometric
and genetic tools, which can be applied for MPA monitoring in the field.
3.2. Material & Method
3.2.1. Field sampling
Limpet specimens, possibly belonging to Patella rustica and P. caerulea,
were collected in 2 sites along 4 MPAs in the western Mediterranean coast: Cabo
de Palos (Spain), Port-Cros (France), Portofino and Tavolara (Italy). At each site
at least 30 individuals for each putative species were carefully collected, avoiding
breaking the shells, within an area of 100 m2 in the rocky intertidal habitat.
Samples were preserved in 90% ethanol and maintained at 4 °C until processing.
After samples had been taken for DNA extraction, each shell was cleaned by
removing the remaining tissue and properly labelled for morphometric analysis.
Patricia Marti Puig - PhD thesis – March 2016
34
3.2.2. Species identification by molecular markers
About 2 g of tissue from the foot of the mollusc was used for DNA extraction
using the protocol REDExtract-N-Amp kit (Sigma–Aldrich). Amplification of a
portion of 430 bp of the mitochondrial COI was carried out with universal primers
(Folmer et al., 1994) in a final volume of 25 μl consisting of 4 μl of MgCl2 25 mM, 5
μl of buffer 10X, 0.5 μl dNTP 10 mM, 0.5 μl of each primer 10 μmol, 0.2 of Taq
polymerase (Promega) and 2.5 μl of template DNA. Polymerase chain reaction
(PCR) was performed in a thermal cycler (SimpliAmp™ Thermal Cycler) as
follows: 94 °C for 3 min, 25 cycles at 94 °C 45 min, annealing at 48 °C for 1.5 min,
extension at 72 °C for 2 min and with final elongation at 72 °C for 5 min. PCR
products were purified and sequenced by Macrogen Inc. Sequences were
checked manually, aligned and edited using the software Geneious Pro 5.3.
Sequences were blasted in genbank.
A phylogenetic tree was produced with the 203 COI sequences with the
software Geneoius pro using Bayesian inference as implemented in MrBayes
(Huelsenbeck and Ronquist, 2001). Substitution Model used was HKY85 with a
Chain length of 1.100,000, burn-in Length 100,000 and subsampling frequency of
200. Three COI sequences of Patella aspera (Röding, 1798) was used as an out-
group (EF462968)
3.2.3. Morphometric shell characters
Only shells that were in good shape (not broken, n = 200) were used for
morphometric analyses. Shell height (H) was measured using a digital calliper with
a precision of 0.001 mm. Digital images of the shells were acquired on a white
background. Photographs of the specimens were taken with an Olympus SP-350
camera using the following settings: metering in manual (1/30 F 8.0), Focus: S-
macro, Zoom in max wide-angle, ISO: 50, with an image size of 3264 × 2448
pixels.
Shell shape and size parameters were calculated by digitalizing the outline
using the software ImageJ (http://imagej.nih.gov/ij/). Measured and calculated
shape descriptors were: Area (A), Major axis and Minor axis of the fitting elipse,
Maximum Diameter or Feret‘s diameter (Dmax), Aspect ratio (AR = Major
35
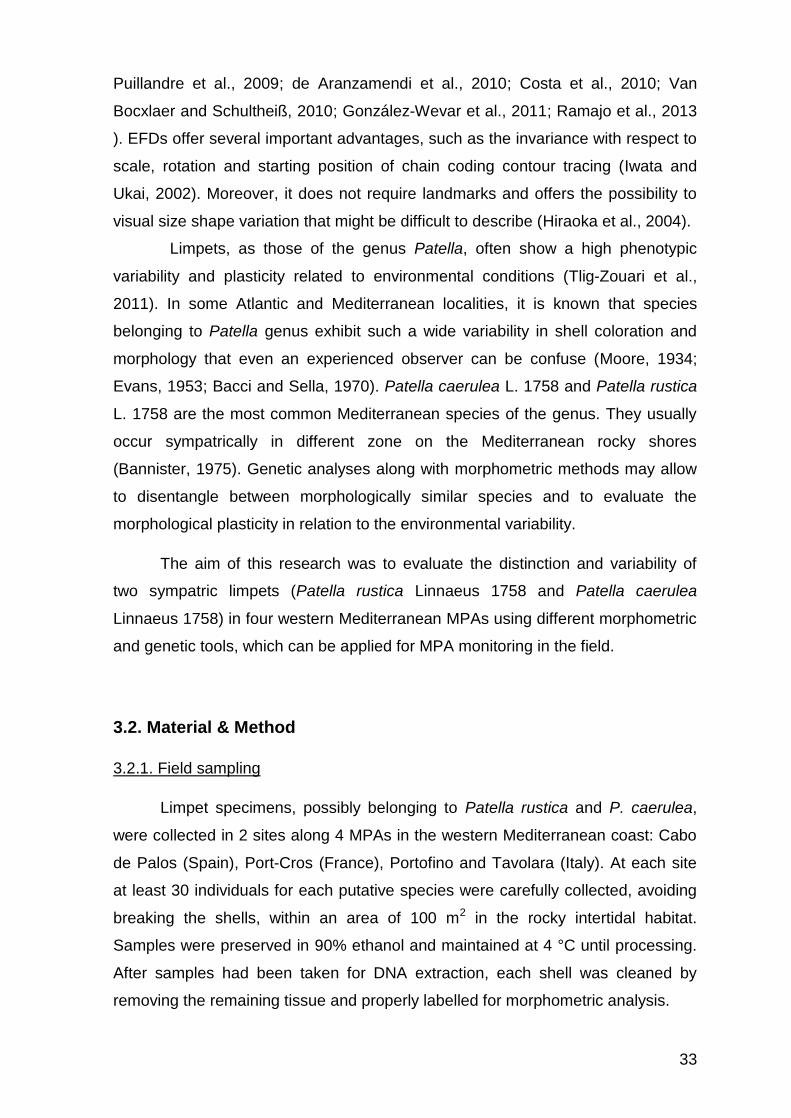
Axis/Minor Axis), Roundness (ROUND) which is calculated with the formula 4 x
(A/𝜋i x Major Axis2) and Solidity (SOL) which is a measure of how ―ruffled‖ the
borders are (Ar/Convex area) (Figure 1). Height/Area (H/A), Height/Maximum
Diameter (H/MDmax) were also calculated to know the proportion which is
independent of the size of the shell
Figure 3.1. Example of some descriptors calculated with image J software.
The morphometric measures relatively of the size of the shells (Area and
Major) were compared among protected and non-protected sites. An ANOVA was
performed comparing Area and Major of each species respect to the protection
using the software R. Factor Protection (nested in Site and MPA) were analysed
for each variable. Additional morphometric measures (AR, H/A, H/MDmax, ROUND
and SOL) were compared between species, among sites within locations for each
species. Differences in mean values were tested with an univariate permutational
analysis of variance (PERMANOVA; Anderson and Robinson, 2001, Anderson
and Braak, 2003) based on Euclidean distance of untransformed data. Factors
Species (Fixed), Location (Random) and site (nested in Location, Random) were
analysed for each variable. Significant biometric measurements between species
were analysed by Principal Component Analysis (PCA) with the software R
(Venables and Smith, 2005).

Patricia Marti Puig - PhD thesis – March 2016
36
3.2.4. Elliptic Fourier Descriptors (EFDs) method
The same digital images as for morphometric measures were used for the
EFD approach. Shells were always positioned in the same orientation. Photos
were edited in Adobe Photoshop and then converted to MS Windows bitmap. A
series of outline shape analyses were performed using the SHAPE software
package (v. 1.3) (Iwata and Ukai, 2002). Digital images were binary-encoded to
produce a closed curve. Histogram and Ero Dil Filter were manually adjusted in
order to adequately capture the contour of the shell. A chain-code of contour of
each shell was created automatically using SHAPE-ChainCoder (Freeman, 1974).
The coefficients of EFDs were calculated by discrete Fourier transformation from
chain-code (Kuhl and Giardina, 1982) using SHAPE-Chc2Nef. Fourier
reconstructions using increasing numbers of harmonics, compared to the original
outline, was used to estimate that 10 harmonics were sufficient to reconstruct the
outlines with high accuracy. EFDs were mathematically normalized to be invariant
with respect to scale, rotation or location and starting position of chain coding
contour tracing in accordance with the procedures suggested by Kuhl and
Giardina, 1982. Normalization was based on the longest radius and outlines were
aligned in Chc2Nef. A principal component analysis of the variance-covariance
matrix from the EFDs coefficients was performed using SHAPE-PrinComp to
summarize the information contained in the normalized EFD coefficients (Rohlf
and Archie, 1984). The shape variation accounted for by each principal component
was visualized using SHAPE-PrinPrint using the method of Furuta et al., 1995.
The first 5 PCA scores (which explained at least 5% of the variability) were used
as shape descriptors in multivariate analysis of variance (MANOVA) and
discriminant function analysis (DFA) to assess for shape differences between
species. The variation explained by the first two principal components was plotted
using an R routine (Venables and Smith, 2005).
Shape descriptors were analysed with a multivariate analysis of variance
(MANOVA) using the first 5 PCA scores from the EFD results. MANOVA was
performed with R with the package vegan with Random Forrest distance with
10000 permutations (Venables and Smith, ). A linear model was calculated using
the PC scores in respect to the species per site (nested in location).

37
3.3. Results
3.4.1. Phylogenetics and species identification
A phylogenetic tree of the individuals is shown in Figure 3.2. The
phylogenetic analysis showed that the individuals collected belonged to three
genetic clusters with 100 of bootstrap probability. All genetic sequences were
blasted in Genbank and the three genetic groups were identifed as Patella
caerulea (n=99), Patella rustica (n=101) and Patella aspera (n=3) with an
accurancy of more than 99%. There were not relationship found between genetic
sub-clusters and geographic location of the species.
Figure 3.2. Bayesian phylogenetic tree of 200 individuals of P. caerulea and P. rustica. The species
P. aspera is shown as an outgroup. Numbers correspond to the bootstrap values.
3.4.2. Morphometric distinction
The result of the PERMANOVA analyses using the morphometric measures
is represented in Table 3.1. The parameters H/MDmax and Solidity are the best to
discriminate both species. Solidity and H/A are able to discriminate the species
within sites.

Patricia Marti Puig - PhD thesis – March 2016
38
A PCA with the significant shape descriptors (H/A, H/MDmax and SOL) is
represented in Figure 3.3. The PCA also showed that H/A, H/MD and SOL were
good shape descriptors to discriminate the species. Average measurements of
H/MD and Solidity per sites are represented in S3.1. Solidity and H/A are higher in
P. rustica respect to P. caerulea (S3.1).
Figure 3.3: PCA with the significant shape descriptors (H/A, H/MDmax and SOL).

Species Sp x Lo Sp x Si (Lo) Res
MS
Pseudo-
F
P(perm) MS Pseudo-
F
P(perm) MS Pseudo-F P(perm) MS
AR 0.004 1.132 0.357 ns 0.004 2.146 0.238 ns 0.002 0.607 0.662 ns 0.003
H/A 0.003 9.490 0.061 ns 0.000 1.169 0.424 ns 0.000 8.758 0.000 *** 0.000
H/MD 0.339 40.739 0.021 *** 0.008 6.400 0.055 * 0.001 1.517 0.198 ns 0.001
ROUND 0.001 0.622 0.468 ns 0.002 2.910 0.167 ns 0.001 0.607 0.655 ns 0.001
SOL 0.009 12.405 0.059 * 0.001 2.452 0.199 ns 0.000 3.183 0.015 * 0.000
Table 3.1.Summary of PERMANOVA analyses using the morphometric measures of Aspect Ratio (AR), Roundness (ROUND), Height/Area (H/A),
Height/Maximum Diameter (H/Dmax) and Solidity (SOL). *** high significance (p<0.0001), **medium significance (p<0.001), *low significance (p<0.01). Ns: not
significant.
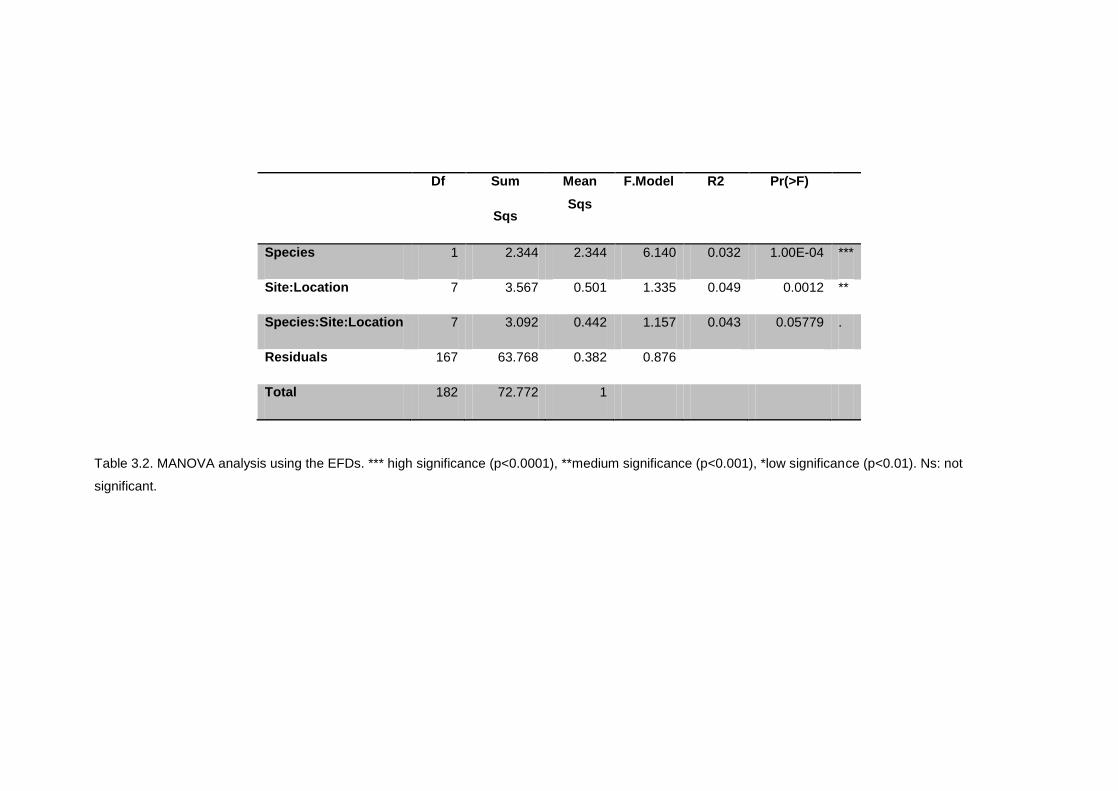
Df Sum
Sqs
Mean
Sqs
F.Model R2 Pr(>F)
Species 1 2.344 2.344 6.140 0.032 1.00E-04 ***
Site:Location 7 3.567 0.501 1.335 0.049 0.0012 **
Species:Site:Location 7 3.092 0.442 1.157 0.043 0.05779 .
Residuals 167 63.768 0.382 0.876
Total 182 72.772 1
Table 3.2. MANOVA analysis using the EFDs. *** high significance (p<0.0001), **medium significance (p<0.001), *low significance (p<0.01). Ns: not
significant.
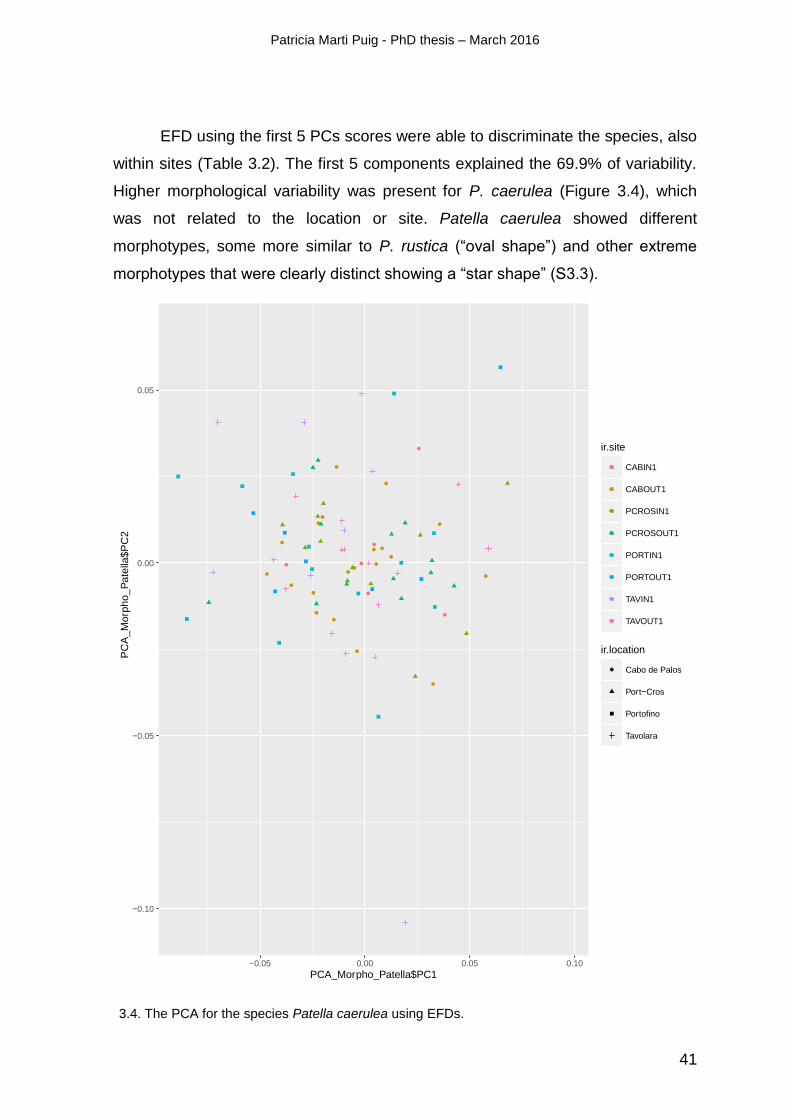
Patricia Marti Puig - PhD thesis – March 2016
41
EFD using the first 5 PCs scores were able to discriminate the species, also
within sites (Table 3.2). The first 5 components explained the 69.9% of variability.
Higher morphological variability was present for P. caerulea (Figure 3.4), which
was not related to the location or site. Patella caerulea showed different
morphotypes, some more similar to P. rustica (―oval shape‖) and other extreme
morphotypes that were clearly distinct showing a ―star shape‖ (S3.3).
3.4. The PCA for the species Patella caerulea using EFDs.
−0.10
−0.05
0.00
0.05
−0.05 0.00 0.05 0.10
PCA_Morpho_Patella$PC1
PC
A_
Morp
ho_
Pate
lla$
PC
2
ir.site
CABIN1
CABOUT1
PCROSIN1
PCROSOUT1
PORTIN1
PORTOUT1
TAVIN1
TAVOUT1
ir.location
Cabo de Palos
Port−Cros
Portofino
Tavolara

42
3.5. Discussion
In this study genetics with morphology were studied in order to discriminate
and identify the morphological variability of the two species P. caerulea and P.
rustica. Both genetic and morphometric methods were useful to distinguish the
species. The morphometric measures H/A, H/Dmax and SOL were significantly
different between species, which means that P. rustica can be distinguished by P.
caerulea because it is usually more round and has a higher height in respect to the
area or the maximum diameter. A previous study carried out along the Sicily
coasts on the genetic and morphological differences among Patella rustica, Patella
caerulea and Patella aspera was clearly able to distinguish genetically between
species but discriminant analysis of simple morphometric shell characters (shell
length, shell width and shell height) failed to discriminate the species
morphologically (Mauro et al., 2003). This is easily understandable by considering
that the measures used in this study were not morphometric ratios but were
absolute measures that depend on the age and growth rate of individuals. In the
present study morphometric shell measures independent by the whole shell size
were used.
EFDs descriptors were also able to discriminate the species, showing a
higher variability in shell shape in P. caerulea. Williams et al. (2012) was also able
to distinguish between two closely related species of the gastropod Lunella using
EFDs and genetic methods. EFDs were also useful to identify the morphological
variability and shape types of P. caerulea. These morphological variability could be
explained by the environmental heterogeneity of the habitat (Watters et al., 2003).
3.6. Conclusion
Despite the morphological differences among species appeared consistent,
a large local morphological variability was found. These results underline the
importance of the use of morphometric and shape analysis approaches when
taxonomic identification is challenging and to identify and quantify morphological

Patricia Marti Puig - PhD thesis – March 2016
43
variability. These tools have the potential to be used in the field for future MPA
monitoring, were often the identification must be done without specimens
withdrawal and when there is the need to quantify variations size and shape of the
individuals. Further understanding of the importance of morphological and genetic
variability on adaptability and species resilience could help to guide future
conservation strategies.
3.7. Acknowledgments
Sampling was done in accordance with national laws, and authorisations were
granted by local MPAs authorities. This study did not involve endangered or
protected species. This research was funded by the European project ‗Training
Network for Monitoring Mediterranean Marine Protected Areas‘ (MMMPA: FP7-
PEOPLE-2011-ITN; grant number 290056). Involved MPAs were associated
partner of the MMMPA projects. PMP was supported by the MMPA project, as
early stage researcher, and this study is part of her PhD. AV was supported by a
research fellowship (Assegno di Ricerca) of the University of Bologna and 2010-11
PRIN project prot. 2010Z8HJ5M -Coastal bioconstructions: structures, functions,
and management. Thanks to Augusto Navone, Jose Antonio García-Chartón,
Ramón García, José Pereguiñez, Marco Palma and Ubaldo Pantaleo for their
assistance during the sampling.

44
3.8. Supplementary materials
Figure S3.1. H/Dmax (a) and Solidity mean (b). FAROPAL=Faro Cabo de Palos,
CALBLA=Calblanque, PCHIA=Punta Chiappa, LEV=Levante, COBE= Corallina Beach, CAL=La
calleta).
Eigenvalue Proportion(%) Cumulative(%) >
1/37
Prin1 1.20E-03 29.8986 29.8986 *
Prin2 5.51E-04 13.7734 43.6721 *
Prin3 4.63E-04 11.5849 55.257 *
Prin4 3.09E-04 7.7317 62.9887 *
Prin5 2.76E-04 6.8979 69.8867 *
Prin6 1.81E-04 4.52 74.4067 *
Prin7 1.46E-04 3.6408 78.0475 *
Prin8 1.27E-04 3.1878 81.2353 *
Prin9 1.14E-04 2.847 84.0823 *
S3.2. Eigen values of EFDs and their proportion
S3.3. Examples of shapes generated with EFDs
Patricia Marti Puig - PhD thesis – March 2016
45
CHAPTER IV: GENETIC DIVERSITY AND CONNECTIVITY FOR
THE EVALUATION OF MARINE PROTECTED AREAS
Cabo de Palos Marine Protected Area. Photo source: Patricia Marti-Puig
Publication note: A modified version of the following chapter is in already
submitted in the journal Marine Environmental Research: Patricia Marti-Puig,
Federica Costantini, Massimo Ponti, Adriana Villamor, Marco Abbiati. “Genetic
diversity and connectivity in two intertidal limpets across Marine Protected Areas in
north-western Mediterranean”. Marine Environmental Research (submitted)

46
4.1. Abstract
Marine Protected Areas (MPAs) are intended to protect species diversity and
ensure persistence of species. For achieving this purpose, MPAs should be
effective in terms of maintaining genetic diversity and connectivity at different
spatial-temporal scales. Genetic variability and population connectivity of two
widely distributed limpets (Patella caerulea and P. rustica) were analysed inside
and outside four MPAs in the western Mediterranean Sea using mitochondrial and
microsatellite markers. No effect of protection on genetic variability was observed
in either species. The mitochondrial marker revealed limited genetic structure
among MPAs in the north-western Mediterranean for both species. Within each
location, different patterns of genetic structure and connectivity were observed
depending on the species and local hydrodynamic features. The genetic
monitoring presented, provided estimates of connectivity useful to assess MPAs
effectiveness and should be included into the monitoring and spatial management
plans of MPAs.
Keywords: genetics; gene flow; dispersion; life history; spatial scale; Marine
Protected Areas; management; Mollusca; western Mediterranean Sea
Patricia Marti Puig - PhD thesis – March 2016
47
4.2. Introduction
Marine Protected Areas (MPAs) are conservation zones that aim to
preserve the environment and maintain species diversity, which are threatened by
overexploitation, pollution and other human disturbance sources (Salm et al.,
2000). A well-designed MPA network should, ideally, ensure to maintain
population genetic diversity within MPAs (Frankham, 2005a; Bouzat, 2010) and
enhance connectivity (by gametes, larvae or adult dispersal) within protected
areas, between them and in adjacent habitats (Crowder et al., 2000; Miller and
Ayre, 2008; Jones et al., 2009; Planes et al., 2009). Connectivity and genetic
diversity, promoted by exchange of individuals between populations, warrant
resilience from disturbance and allow to buffer species against risks of local
extinctions (Almany et al., 2009). Following disturbance, survivor populations
might show reduced viability (through genetic drift and inbreeding), reducing their
genetic diversity, their evolutionary potential and their local larval output with
consequences for their productivity, growth, stability and interaction with
surrounding populations. In this scenario, connectivity with other populations, as
larval inputs, can facilitate their recovery. Therefore, understanding diversity and
connectivity patterns together with the identification of potential source and sink
populations are important aspects to determine the optimal locations and spacing
between MPA, and to develop adequate and specific monitoring and action plans
(Crowder et al., 2000; Sala et al., 2002).
Despite the protection of the habitats is at the centre of recent international
directives (e.g. the European Marine Strategy Framework Directive, 2008/56/EC),
too often the MPAs' conservation policies are exclusively addressed to protect
commercial species or those listed in international biodiversity conventions, in the
hope that this is enough to preserve the entire habitat (Claudet et al., 2008;
Claudet et al., 2010; Gaines et al., 2010). However, attention should be also
addressed to those species that, although not explicitly protected, play a key role
in structuring local assemblages, as many intertidal invertebrates. Few studies
have attempted to determine whether MPAs are able to conserve genetic diversity
of benthic intertidal species and whether they are effective in promoting
connectivity (e.g. Bell, 2008a; McInerney et al., 2009a; Munguía-Vega et al.,

48
2015). Those studies demonstrate that marine reserves located around islands
have limited connectivity compared to mainland (Bell, 2008a), that mesoscale
topographic and hydrographic features drive patterns of intra-specific genetic
diversity (McInerney et al., 2009b), and that management decisions may be
capable of increasing or decreasing genetic diversity of exploited species over
relatively short time scales (Munguía-Vega et al., 2015).
Among intertidal invertebrates, limpets deserve particular attention, being
grazers able to control rocky shore communities (e.g. Menconi et al., 1999;
Benedetti-Cecchi, 2001; Underwood, 2000; Coleman et al., 2006; Burgos-Rubio et
al., 2015). These species are potentially threatened by overharvesting both as
local delicacy and as bait for fishing, but also by trampling, coastal destruction and
pollution (Keough and Quinn, 1998; Guerra-Garcıa et al., 2004; Pinn and Rodgers,
2005; Fenberg and Roy, 2012). The decline of their populations can lead to a wide
range of trophic cascade effects (Bosman et al., 1987).
In the Mediterranean Sea Patella caerulea Linnaeus, 1758 and Patella
rustica Linnaeus, 1758 are the most common intertidal rocky shores limpets.
These species can be found at different densities, which may depend on
environmental factors such as wave exposure, tidal level, type of substrate and
topography but also on natural and anthropic pressures (Davenport and
Davenport, 2006). They play a key ecological role in the intertidal habitat, grazing
on rocky shores and allowing the control of algal grow and influencing the
abundance of other animals species (e.g. barnacles; Arrontes et al., 2004).
Previous studies using mitochondrial and microsatellite markers provided
some background information on the genetic structure of P. caerulea and P.
rustica, indicating a high genetic diversity and significant differentiation between
western and eastern Mediterranean Sea in both species (Sá‐ Pinto et al., 2010;
Villamor A, 2014).
In the present study, the levels of genetic diversity and structuring of P.
caerulea and P. rustica among and within four MPAs in the western Mediterranean
Sea has been investigated using a multifactorial hierarchical sampling design. For
this purpose, limpet populations were sampled in replicated sites inside and
outside MPAs and analysed using mitochondrial and nuclear markers. This work
aimed to answer specific questions: 1) are there significant differences in genetic

Patricia Marti Puig - PhD thesis – March 2016
49
variability inside and outside MPAs?; 2) is there a significant genetic structuring
among populations across MPAs and within them?; 3) are the genetic features of
the two species comparable?
4.3. Materials and methods
4.3.1 Sampling design
The genetic structure of Patella caerulea and P. rustica within and across
Marine Protected Areas (MPAs) have been analysed using a multi-scale sampling
design. Four locations where MPAs have been established were randomly
selected in the western Mediterranean Sea (Figure 1): Cabo de Palos (Spain),
Port Cros (France), Tavolara (Italy) and Portofino (Italy). Studied MPAs differed in
date of establishment and size (Table 4.1).
Figure 4.1. Study locations in the western Mediterranean Sea. Grey arrows represent the mean surface
circulation (Modified Atlantic Water) according to Millot (1999)): continue lines: more or less steady
paths; dashed lines: mesoscale currents throughout the year; dotted lines: wind-induced
mesoscale eddies; cross markers: the North Balearic Front (basins names according to López
García et al. (1994)); map in Mercator projection, datum WGS 84).
50
In each location samples were collected in two sites inside (IN) and two sites
outside (OUT) the MPA (Table 4.1). Sites were randomly selected about 20 km
apart from each other (McInerney et al., 2009b). In each site, up to 30 specimens
of Patella caerulea and of P. rustica were collected within an area of approximately
100 m2 in the intertidal habitat. P. caerulea was more abundant on sheltered lower
intertidal shores, while P. rustica was mainly found on exposed rocky shores in the
upper intertidal. Collected samples were preserved in 90% ethanol and maintained
at 4 °C until processing.
Two sites per location (one IN and one OUT of the MPA, labelled 1 in Table
4.1) were analysed using the mitochondrial COI marker to assess regional
patterns of genetic structure. All the four sites per location were analysed by
microsatellite nuclear markers.
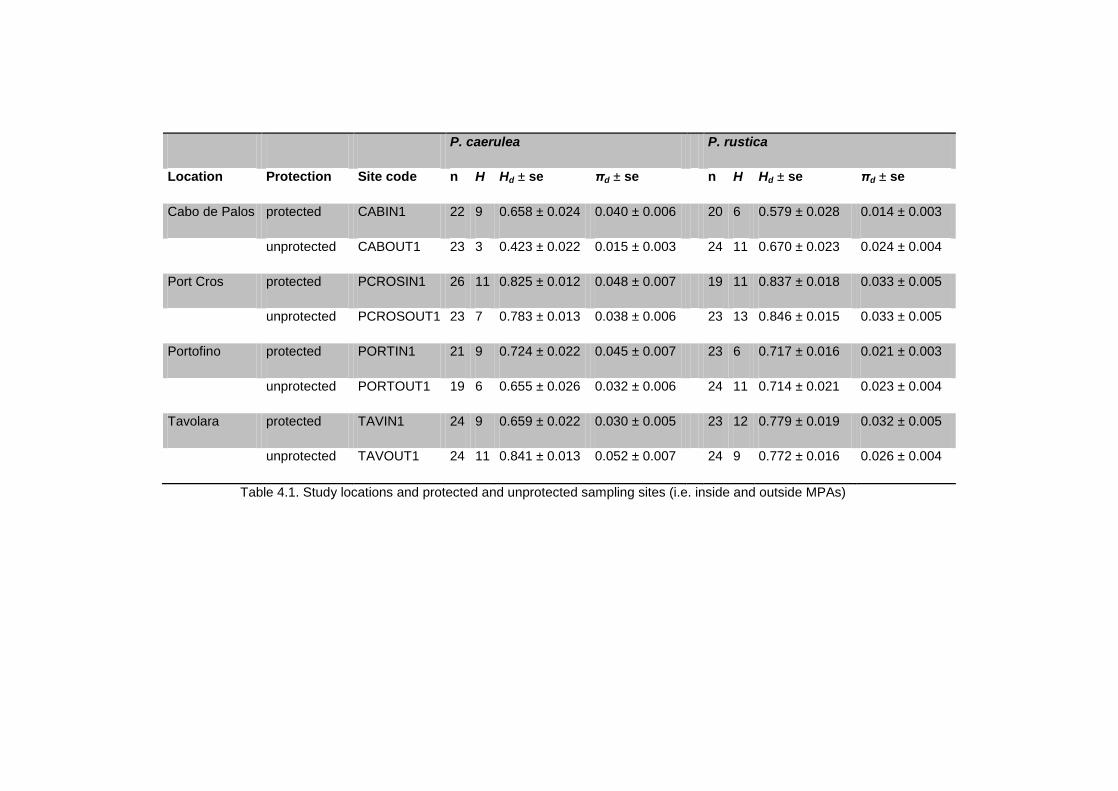
P. caerulea P. rustica
Location Protection Site code n H Hd ± se πd ± se
n H Hd ± se πd ± se
Cabo de Palos protected CABIN1 22 9 0.658 ± 0.024 0.040 ± 0.006 20 6 0.579 ± 0.028 0.014 ± 0.003
unprotected CABOUT1 23 3 0.423 ± 0.022 0.015 ± 0.003
24 11 0.670 ± 0.023 0.024 ± 0.004
Port Cros protected PCROSIN1 26 11 0.825 ± 0.012 0.048 ± 0.007 19 11 0.837 ± 0.018 0.033 ± 0.005
unprotected PCROSOUT1 23 7 0.783 ± 0.013 0.038 ± 0.006
23 13 0.846 ± 0.015 0.033 ± 0.005
Portofino protected PORTIN1 21 9 0.724 ± 0.022 0.045 ± 0.007 23 6 0.717 ± 0.016 0.021 ± 0.003
unprotected PORTOUT1 19 6 0.655 ± 0.026 0.032 ± 0.006
24 11 0.714 ± 0.021 0.023 ± 0.004
Tavolara protected TAVIN1 24 9 0.659 ± 0.022 0.030 ± 0.005 23 12 0.779 ± 0.019 0.032 ± 0.005
unprotected TAVOUT1 24 11 0.841 ± 0.013 0.052 ± 0.007 24 9 0.772 ± 0.016 0.026 ± 0.004
Table 4.1. Study locations and protected and unprotected sampling sites (i.e. inside and outside MPAs)

52
4.3.2 DNA extraction and markers amplification
About 2 g of tissue from the foot of the limpet were used for DNA extraction
using the protocol REDExtract-N-Amp kit (Sigma–Aldrich).
Amplification of 430 bp of the mitochondrial COI was carried out with
universal primers (Folmer et al., 1994) in a final volume of 25 μl consisting of 4 μl
of MgCl2 25 mM, 5 μl of buffer 10X, 0.5 μl dNTP 10 mM, 0.5 μl of each primer 10
μmol, 0.2 μl of Taq polymerase (Promega) and about 30 ng of template DNA.
Polymerase chain reaction (PCR) was done in a thermal cycler (SimpliAmp™
Thermal Cycler) as follows: 94 °C for 3 min, 25 cycles at 94 °C 45 sec, annealing
at 48 °C for 1.5 min, extension at 72 °C for 2 min and with final elongation at 72 °C
for 5 min. PCR products were purified and sequenced by Macrogen Inc.
Sequences were checked manually, aligned and edited using the software
Geneious Pro 5.3.
Six microsatellite loci were used to analyse P. caerulea: four species-
specific loci (Pc11, Pc36, Pc73, Pc38; Fauvelot et al. (2012)), and two loci
developed for P. rustica (Pru5 and Pru15; Pérez et al. (2008)). P. rustica was
analysed using 5 microsatellite loci: three species-specific loci (Pru5, Pru15, and
Pru8; Pérez et al. (2008)), and two loci developed for P. caerulea (Pc11 and Pc38;
Fauvelot et al. (2012)). Multiplexed amplifications were done on P. caerulea with
the loci Pc11, Pc36, Pc73, Pc38, and on P. rustica with loci Pc11, Pru5 and Pru15,
using the protocols described by the manufacturer (Qiagen Multiplex PCR). Single
locus amplifications were done in a volume of 25 µl, consisting of 4 µl of buffer 5x,
1.5 µl of MgCl2 25 mM, 0.5 µl of each forward and reverse primers 10 mM, 0.5 µl
of dNTPS 10 mM, one unit of Taq and 2.5 µl of template DNA 1:40 (30 ng
template DNA). The protocol was: 5 min at 94 °C, followed by 30 cycles of 1 min at
94 °C, 40 s at a locus specific annealing temperature (Pérez et al., 2008; Fauvelot
et al., 2012), 1 min at 72 °C and a final elongation of 72 °C for 10 min. PCR
products were purified and genotyped by Macrogen Inc. Allele sizing was done
with the software Peak Scanner (Life Technologies).

Patricia Marti Puig - PhD thesis – March 2016
53
4.3.3 Mitochondrial genetic diversity
For each species and site, number of haplotypes (H), haplotype (Hd) and
nucleotide (πd) diversity were calculated using the software DnaSP v. 4.50.3
(Rozas et al., 2003). Differences in mean haplotype and nucleotide diversity
among locations (4 random levels, two sites each) and between IN and OUT MPA
(2 fixed levels: IN and OUT; four sites each) were tested by two-way analysis of
variance (ANOVA, α = 0.05; Philippart et al., 2011, Underwood, 1996). Cochran‘s
C test was used to check the homogeneity of variances and data transformations
were not required. These tests were done using the software GMAV-5 for
Windows.
4.3.4 Microsatellite genetic diversity
Observed heterozygosity (Ho), expected heterozygosity (He) and inbreeding
coefficient Gleick et al., were calculated per site across all microsatellite loci with
GENETIX software package v. 4.05 (Belkhir et al., 2004). Rarefied allele richness
(Ar) and private allelic richness (pAr) were calculated after controlling for
differences in sample size, using a rarefaction approach implemented in the
software HP-RARE 1.1, Kalinowski, 2005. The software GENEPOP (web version
http://genepop.curtin.edu.au/; Raymond and Rousset, 1995; Rousset, 2008) was
used to test for departures from Hardy-Weinberg equilibrium Schleuning et al.,
and linkage disequilibrium (LD). The presence of null alleles was examined by
estimating null allele frequencies for each locus and sample following the
Expectation Maximization (EM) algorithm of Dempster et al., using FREENA
(Chapuis and Estoup, 2007).
Effects of locations, IN vs. OUT MPA and sites on genetic diversity indices (Ar,
pAr, He and FIS) were tested by a three-way mixed ANOVA using the software
GMAV-5 for Windows Folmer et al., 1994; Underwood, 1996). Homogeneity of
variances was tested using Cochran‘s C test, and only pAr values have been
transformed as square root.
54
4.3.5 Genetic differentiation and structure
Relationships between the mitochondrial haplotypes were visualized in unrooted
haplotype networks, calculated by median joining algorithm with the software
NETWORK v. 4.6.1.1 (Bandelt et al., 1999). Loops were solved using the criteria
of abundance, origin and least changes.
For the COI data sets, genetic differentiation among sites were estimated
with Wright‘s fixation index Kotsakiozi et al., as implemented in the software
ARLEQUIN v. 3.1 (Excoffier et al., 1992) with 10,000 permutations.
Regarding to the microsatellite data sets genetic divergences among all
sites were estimated using the FST estimates of Weir (1996)). Since null alleles
were found (see ―Results‖) FST estimates were also calculated following the ENA
method described in Chapuis and Estoup, . The significance of pairwise
genotyping differentiation between populations was tested using Fisher‘s exact
tests based on Markov chain procedures in GENEPOP v.3.4 (Raymond and
Rousset, 1995). P-values were corrected following the False Discovering Rate
(FDR) correction for multiple comparisons (Benjamini and Hochberg, 1995).
Moreover, to overcome some of the shortcomings of conventional FST statistic
(e.g. FST tends to underestimate differentiation when heterozygosity is high; Jost,
2008) the pairwise population differentiation were also performed using the D
estimator (Dest; Jost, 2008) computed with the programme GENODIVE 2.0b27
(Meirmans, 2014). Overall estimates of Dest, were calculated from individual loci
using a harmonic mean approximation. A Mantel test was performed to compare
pairwise-population matrices (FST vs. Dest) with 10,000 permutations, using the
statistical software R (R Core Team, 2014).
An analysis of molecular variance (AMOVA; Excoffier et al., 1992)
implemented in ARLEQUIN was conducted to examine the partition of the genetic
variance among locations. Then, within each location, AMOVAs were performed
grouping sites IN and OUT MPA.
Occurrence of isolation by distance patterns were tested with a Mantel test
(Mantel, 1967) (testing the correlation between geographical distances and the
pairwise FST matrixes) with 10,000 permutations, using the statistical software R
(R Core Team, 2014; packages: ―adegenet‖, ―pegas‖, ―ecodist). Geographical
Patricia Marti Puig - PhD thesis – March 2016
55
distance was estimated using an R script that calculates the shortest distance
between two points taking into account the coastline (packages: ―raster‖,
―gdistance‖, ―rgdal‖, "poppr").
At north-western Mediterranean scale and for each location an assignment
test was done for the microsatellite data to provide likelihood values to the
possible numbers of homogeneous genetic clusters (K) (software STRUCTURE v.
2.3.3; Pritchard et al., 2000; Falush et al., 2003). Simulations included 50,000
generations and 100,000 Markov Chain Monte Carlo (MCMC) steps under the
admixture model (Falush et al., 2003), with 20 iterations for each K value. Because
sampling location information set as prior information can assist clustering for data
sets with weak structure (Hubisz et al., 2009), the LOCPRIOR option was used.
The most likely number of genetic clusters was determined following the
Evanno‘s procedure (Evanno et al., 2005) as implemented in the web-based
software Structure Harvester (Earl and BM, 2012) and checking for the lowest
standard deviation of the mean.
STRUCTURE plots were created with CLUMPAK (Kopelman et al., 2015),
which compares all runs at each value of K to identify optimal clustering scenarios
and uses DISTRUCT (Rosenberg, 2004) to create resulting figures.
For each STRUCTURE analysis, two independent simulations with different
starting seeds were performed for each assignment test to assess convergence of
the results
The amount and direction of gene flow over the last several generations
among sites within locations was estimated by performing a Bayesian-based
analysis. MIGRATE-n v.3.6 was used to estimate theta (Θ) and the mutation
scaled migration rate M based on microsatellite data (Beerli and Felsenstein,
2001). Theta is defined as 4Neμ for a diploid system with nuclear microsatellite
loci, where Ne is the effective population size and μ is the mutation rate per
generation and site. M is defined as m/μ, representing the relative contribution of
immigration and mutation to the variability brought into the population, whereas m
is the fraction of new immigrants found in the population per generation. Numbers
of migrants is then defined as M multiplies Θ.

56
4.4. Results
4.4.1 Genetic diversity
COI
In Patella caerulea 34 COI haplotypes were obtained from up to 29 variable
nucleotide positions. Haplotype diversity (Hd) ranged between 0.423 ± 0.022
(standard error) and 0.841 ± 0.013. Nucleotide diversity (πd) ranged between and
0.015 ± 0.003 and 0.052 ± 0.007 (Table 2). Mean πd and Hd indices were not
significantly different among locations (ANOVA: πd p = 0.671 and Hd p = 0.233)
and IN vs. OUT MPAs (ANOVA: πd p = 0.470 and Hd p = 0.698).
In P. rustica mitochondrial COI showed 57 different haplotypes due to 48
polymorphic nucleotide positions. Haplotype diversity (Hd) ranged between 0.579 ±
0.028 and 0.846 ± 0.015, while nucleotide diversity (πd) ranged between and
0.014 ± 0.003 and 0.033 ± 0.005 (Table 2). Mean πd and Hd indices were
significantly different among locations (ANOVA: πd p = 0.006 and Hd p = 0.011)
but not between IN and OUT MPAs (ANOVA: πd p = 0.776 and Hd p = 0.748).
Microsatellites
No linkage disequilibrium was detected in any case (data not shown).
Diversity indices in P. caerulea showed that allelic richness (Ar) ranged between
3.479 ± 0.202 in PORTOUT2 to 4.512 ± 0.069 in TAVIN2, while private allelic
richness (pAr) ranged between 0.122 ± 0.051 in CABOUT2 to 0.374 ± 0.038 in
PCROSOUT2. Observed heterozygosity (Ho) ranged between 0.367 ± 0.039 in
PORTIN2 to 0.603 ± 0.055 in PCROSOUT1, while expected heterozygosity (He)
ranged from 0.669 ± 0.214 in PORTOUT2 to 0.859 ± 0.028 in TAVIN2.
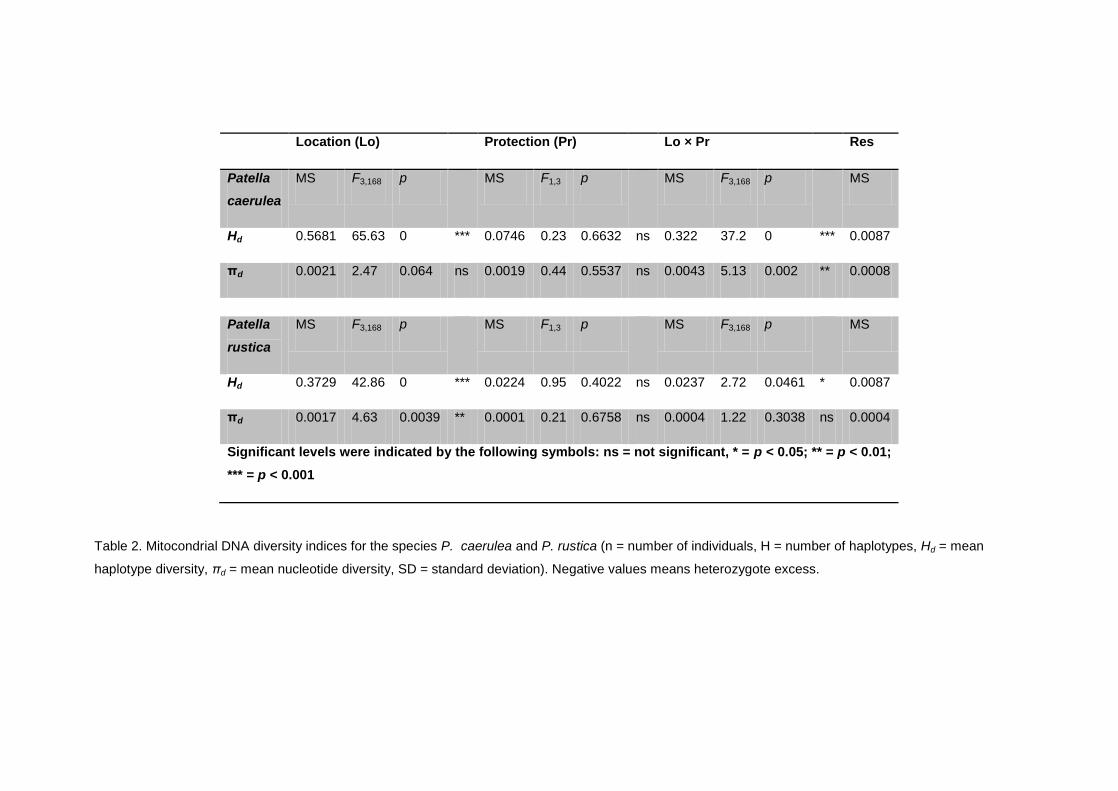
Location (Lo) Protection (Pr) Lo × Pr Res
Patella
caerulea
MS F3,168 p MS F1,3 p MS F3,168 p MS
Hd 0.5681 65.63 0 *** 0.0746 0.23 0.6632 ns 0.322 37.2 0 *** 0.0087
πd 0.0021 2.47 0.064 ns 0.0019 0.44 0.5537 ns 0.0043 5.13 0.002 ** 0.0008
Patella
rustica
MS F3,168 p MS F1,3 p MS F3,168 p MS
Hd 0.3729 42.86 0 *** 0.0224 0.95 0.4022 ns 0.0237 2.72 0.0461 * 0.0087
πd 0.0017 4.63 0.0039 ** 0.0001 0.21 0.6758 ns 0.0004 1.22 0.3038 ns 0.0004
Significant levels were indicated by the following symbols: ns = not significant, * = p < 0.05; ** = p < 0.01;
*** = p < 0.001
Table 2. Mitocondrial DNA diversity indices for the species P. caerulea and P. rustica (n = number of individuals, H = number of haplotypes, Hd = mean
haplotype diversity, πd = mean nucleotide diversity, SD = standard deviation). Negative values means heterozygote excess.

58
Highly significant multilocus deviations from HW proportions were observed
in all samples after FDR corrections (Table 4.3). Multilocus estimates of FIS ranged
from 0.249 ± 0.062 (PORTIN2) to 0.557 ± 0.067 (CABIN1), showing in all cases
heterozygote deficiencies. Heterozygote deficit could be related to the presence of
null alleles. Estimated null allele frequencies (r) across samples ranged between
0.012 ± 0.019 (Pru15) to 0.323 ± 0.066 (Pc36).
In the case of P. rustica, allelic richness ranged between 2.823 ± 0.173 in
PORTOUT2 to 3.487 ± 0.114 in PCROSIN2, while private allelic richness ranged
between 0.150 ± 0.008 in PORTOUT1 to 0.618 ± 0.042 in TAVOUT2. Observed
heterozygosity ranged between 0.348 ± 0.038 in TAVIN2 to 0.690 ± 0.067 in
TAVIN1, while expected heterozygosity ranged from 0.634 ± 0.230 in PORTOUT2
to 0.751 ± 0.016 in CABIN1. Significant deviations from HW equilibrium were
observed in all samples and at all microsatellites loci expressed as heterozygosity
deficiency. In fact, all the FIS values are high and positive and ranged from 0.404 ±
0.046 (TAVOUT1) to 0.501 ± 0.084 in CABIN2 and PORTOUT2 (Table 4.4).
Estimated null allele frequencies (r) across samples ranged between 0.040 ±
0.061 (Pc11) to 0.257 ± 0.060 (Pru5).
For both species, ANOVA tests on microsatellite diversity indices did not
reveal significant differences among locations and IN vs. OUT MPAs (Table S.4.1,
Supplementary content).
4.4.2 Genetic structure and connectivity patterns
The haplotype network of Patella caerulea presented a star-like shape, with
three main haplotypes (H34, H18, H10) present in all sites (except for H10 in
CABOUT1), and several private and low frequency haplotypes (Figure 4.2a).
Pairwise FST showed significant genetic differentiation between CABOUT1 and
PCROSIN1 and between CABOUT1 and PORTOUT1 after FDR correction (FST =
0.057, p = 0.0098 and FST = 0.1121 p = 0.0013, respectively; Table 4.5).
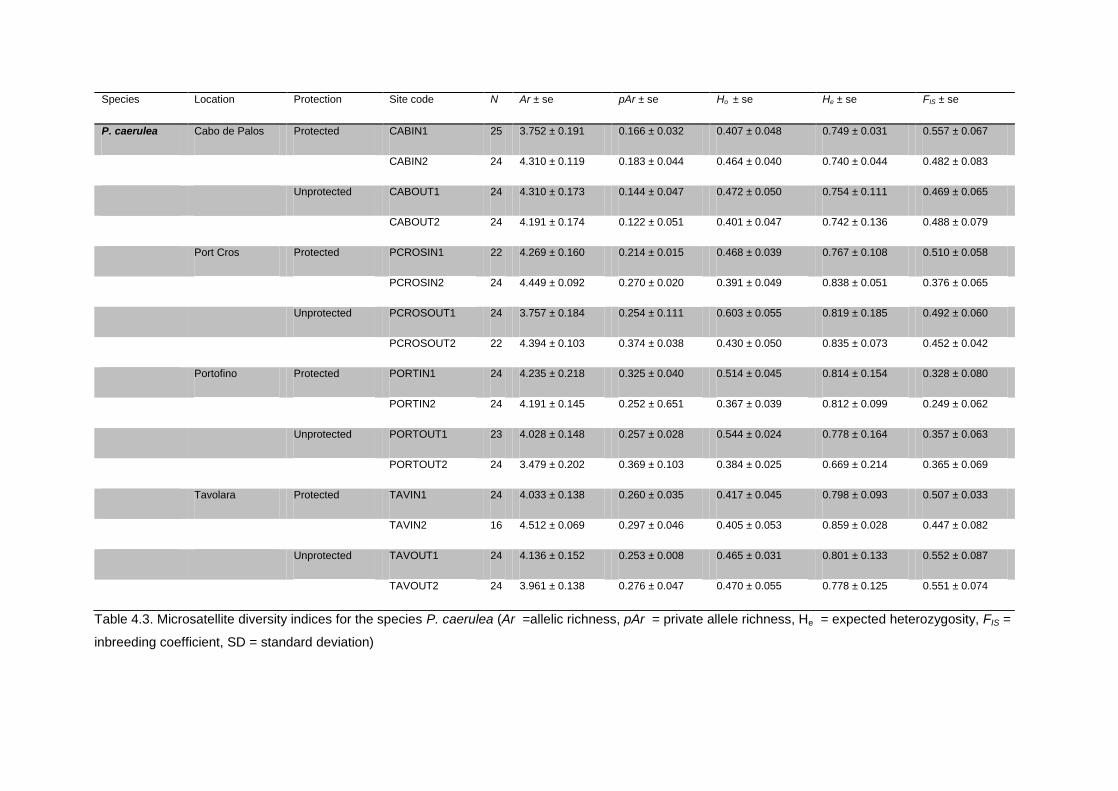
Table 4.3. Microsatellite diversity indices for the species P. caerulea (Ar =allelic richness, pAr = private allele richness, He = expected heterozygosity, FIS =
inbreeding coefficient, SD = standard deviation)
Species Location Protection Site code N Ar ± se pAr ± se Ho ± se He ± se FIS ± se
P. caerulea Cabo de Palos Protected CABIN1 25 3.752 ± 0.191 0.166 ± 0.032 0.407 ± 0.048 0.749 ± 0.031 0.557 ± 0.067
CABIN2 24 4.310 ± 0.119 0.183 ± 0.044 0.464 ± 0.040 0.740 ± 0.044 0.482 ± 0.083
Unprotected CABOUT1 24 4.310 ± 0.173 0.144 ± 0.047 0.472 ± 0.050 0.754 ± 0.111 0.469 ± 0.065
CABOUT2 24 4.191 ± 0.174 0.122 ± 0.051 0.401 ± 0.047 0.742 ± 0.136 0.488 ± 0.079
Port Cros Protected PCROSIN1 22 4.269 ± 0.160 0.214 ± 0.015 0.468 ± 0.039 0.767 ± 0.108 0.510 ± 0.058
PCROSIN2 24 4.449 ± 0.092 0.270 ± 0.020 0.391 ± 0.049 0.838 ± 0.051 0.376 ± 0.065
Unprotected PCROSOUT1 24 3.757 ± 0.184 0.254 ± 0.111 0.603 ± 0.055 0.819 ± 0.185 0.492 ± 0.060
PCROSOUT2 22 4.394 ± 0.103 0.374 ± 0.038 0.430 ± 0.050 0.835 ± 0.073 0.452 ± 0.042
Portofino Protected PORTIN1 24 4.235 ± 0.218 0.325 ± 0.040 0.514 ± 0.045 0.814 ± 0.154 0.328 ± 0.080
PORTIN2 24 4.191 ± 0.145 0.252 ± 0.651 0.367 ± 0.039 0.812 ± 0.099 0.249 ± 0.062
Unprotected PORTOUT1 23 4.028 ± 0.148 0.257 ± 0.028 0.544 ± 0.024 0.778 ± 0.164 0.357 ± 0.063
PORTOUT2 24 3.479 ± 0.202 0.369 ± 0.103 0.384 ± 0.025 0.669 ± 0.214 0.365 ± 0.069
Tavolara Protected TAVIN1 24 4.033 ± 0.138 0.260 ± 0.035 0.417 ± 0.045 0.798 ± 0.093 0.507 ± 0.033
TAVIN2 16 4.512 ± 0.069 0.297 ± 0.046 0.405 ± 0.053 0.859 ± 0.028 0.447 ± 0.082
Unprotected TAVOUT1 24 4.136 ± 0.152 0.253 ± 0.008 0.465 ± 0.031 0.801 ± 0.133 0.552 ± 0.087
TAVOUT2 24 3.961 ± 0.138 0.276 ± 0.047 0.470 ± 0.055 0.778 ± 0.125 0.551 ± 0.074

Table 4.4. Microsatellite diversity indices for the species P. rustica (Ar =allelic richness, pAr = private allele richness, He = expected heterozygosity, FIS =
inbreeding coefficient, SD = standard deviation)
Species Location Protection Site code N Ar ± se pAr ± se Ho ± se He ± se FIS ± se
P. rustica Cabo de Palos Protected CABIN1 25 3.318 ± 0.082 0.525 ± 0.073 0.420 ± 0.054 0.751 ± 0.016 0.466 ± 0.065
CABIN2 24 2.911 ± 0.118 0.477 ± 0.079 0.388 ± 0.055 0.686 ± 0.162 0.501 ± 0.084
Unprotected CABOUT1 24 3.048 ± 0.108 0.588 ± 0.021 0.399 ± 0.042 0.704 ± 0.143 0.488 ± 0.053
CABOUT2 24 2.968 ± 0.129 0.374 ± 0.191 0.399 ± 0.058 0.672 ± 0.188 0.442 ± 0.093
Port Cros Protected PCROSIN1 22 3.037 ± 0.065 0.332 ± 0.028 0.509 ± 0.058 0.643 ± 0.090 0.457 ± 0.080
PCROSIN2 24 3.487 ± 0.114 0.386 ± 0.072 0.367 ± 0.024 0.649 ± 0.113 0.436 ± 0.025
Unprotected PCROSOUT1 24 2.876 ± 0.065 0.355 ± 0.016 0.558 ± 0.054 0.673 ± 0.090 0.442 ± 0.075
PCROSOUT2 22 3.056 ± 0.077 0.252 ± 0.145 0.465 ± 0.053 0.678 ± 0.087 0.438 ± 0.080
Portofino Protected PORTIN1 24 3.077 ± 0.016 0.268 ± 0.038 0.565 ± 0.031 0.700 ± 0.127 0.499 ± 0.059
PORTIN2 24 3.077 ± 0.085 0.265 ± 0.045 0.448 ± 0.057 0.706 ± 0.092 0.486 ± 0.101
Unprotected PORTOUT1 23 3.231 ± 0.086 0.150 ± 0.008 0.447 ± 0.020 0.744 ± 0.045 0.454 ± 0.103
PORTOUT2 24 2.823 ± 0.173 0.186 ± 0.117 0.559 ± 0.045 0.634 ± 0.230 0.501 ± 0.089
Tavolara Protected TAVIN1 24 3.010 ± 0.129 0.597 ± 0.043 0.690 ± 0.067 0.686 ± 0.187 0.486 ± 0.097
TAVIN2 16 3.182 ± 0.147 0.593 ± 0.054 0.348 ± 0.038 0.707 ± 0.134 0.409 ± 0.053
Unprotected TAVOUT1 24 3.181 ± 0.057 0.590 ± 0.045 0.597 ± 0.036 0.731 ± 0.077 0.404 ± 0.046
TAVOUT2 24 3.123 ± 0.119 0.618 ± 0.042 0.545 ± 0.053 0.716 ± 0.135 0.436 ± 0.082

CABIN1 CABOUT1 PCROSIN1 PCROSOUT1 TAVIN1 TAVOUT1 PORTIN1 PORTOUT1
CABIN1 0.0137 -0.015 0.0248 0.0415* 0.0878* 0.0453* -0.0038
CABOUT1 0.0068 -0.015 -0.0106 -0.0121 0.002 -0.0104 -0.0126
PCROSIN1 0.0137 0.0573* -0.018 -0.0257 -0.0215 -0.0059 0.0011
PCROSOUT1 0.0212 0.0029 0.0016 -0.013 -0.0037 -0.0094 -0.0094
TAVIN1 -0.0107 -0.0178 0.0209 0.0049 -0.0171 -0.0106 0.0009
TAVOUT1 0.0031 0.0096 -0.0085 -0.0164 -0.0022 0.0018 0.0296
PORTIN1 -0.0056 0.0424 -0.0175 0.0071 0.0204 -0.0067 0.0097
PORTOUT1 0.0048 0.1121* -0.0193 0.0527 0.0453 0.0204 -0.0185
Table 4.5. Mitochondrial genetic differentiation Kotsakiozi et al., among sites for each species. Upper right represents the FST values for P. rustica whereas
down left represents the FST values for P. caerulea. Significant values after FDR correction (p =0.013) are represented with *. Negative values means
heterozygote excess.

62
In the haplotype network of P. rustica, two central haplotypes (H35 and H51)
separated by one single mutation step and surrounded by several low frequency
haplotypes, were found in all sites (Figure 2b). FST values were low but significant
between CABIN1-PORTIN1 (FST = 0.0453, p = 0.010), CABIN1-TAVIN1 and
CABIN1-TAVOUT1 (FST = 0.0415; p = 0.011 and FST = 0.0888; p = 0.004,
respectively; Table 4.4).
Figure 4.2. Unrooted mitochondrial haplotype network of the two species: P. caerulea (a) and P.
rustica (b). Colours represent the sampling sites analysed. All haplotypes differ for 1 mutational
step, except for the one of the red line with 2 mutational steps. Mv1 and mv2 represent median
vectors.

Patricia Marti Puig - PhD thesis – March 2016
63
In both species, patterns of mitochondrial differentiation were not explained
by the isolation by distance model, and the analysis of molecular variance
(AMOVA) did not reveal any significant pattern of differentiation among locations
or inside and outside MPA.
Pairwise FST values according to microsatellite loci in P. caerulea ranged
from 0.000 to 0.124. In spite of this, 97 out of 120 pairwise FST values were
significant after FDR correction (Table S.2, Supplementary content). Pairwise FST
in P. rustica showed comparable values ranging from 0.000 to 0.136 (Table S.3,
Supplementary content) and 96 out of 120 pairwise values were significant after
FDR.
FST estimates, as well as ENA FST estimates, of the microsatellite dataset
gave similar results (P. caerulea: global FST = 0.039, global ENA FST = 0.034; P.
rustica: global FST = 0.061, global ENA FST = 0.055). Overall, higher values of
genetic differentiation were observed using Dest, rather than FST (Table S.2 and
Table S.3, Supplementary content). Both estimators of population-pairwise
differentiation were strongly correlated as shown by the Mantel test (r = 0.848, P <
0.001 for P. caerulea and r = 0.942, p < 0.001 for P. rustica).
According to AMOVA, genetic variance did not partition significantly among
locations (p = 0.478 for P. caerulea and p = 0.097 for P. rustica) and more than
90% of the total variance was observed within sites.
Patterns of nuclear genetic differentiation were not explained by the
isolation by distance model in P. caerulea (p = 0.654), while a slight significant
correlation was observed in P. rustica (p = 0.022).
For P. caerulea the Bayesian clustering analysis including all the sites
detected as optimal K, K = 2 nonetheless with certain levels of admixture between
the two genetic clusters due to similar estimated proportion of membership of all
the site to each of the 2 clusters (data not shown).
For P. rustica the Bayesian clustering analysis including all the sites
detected as optimal K, K=4. Despite K=4, Structure plot seem differentiate CAB
and PCROS locations from PORT and TAV (data not shown).

64
Within each location for both species, no significant effect IN and OUT MPA
on the patterns of variation were observed according to AMOVAs (all p > 0.05).
For P. caerulea, no significant correlation was observed between genetic
structuring and geographical distance within each location (P > 0.05). In P. rustica
a pattern of isolation by distance was observed only among the sites of Port Cros
in P. rustica (p = 0.03).
Even if with some differences, clustering of individuals for both species
evidenced the presence of two genetic pools: one including individuals from IN1
and OUT1, and another including individual from IN2 and OUT2 in PCROS, CAB
and TAV (Figure 4.3; Table S.4.4, Supplementary content). Nevertheless in P.
caerulea the PCROSIN2 and TAVIN2 (located on the island) present individuals
belonging to one unique cluster. Moreover, also PORTIN2 present an exclusive
gene pool that differentiates this site from the others (Figure 4.3; Table S.4.4,
Supplementary content).
Figure 4.3. Results of the Structure analysis for P. caerulea in Port-Cros (a), Portofino (b), Cabo de
Palos (c), and Tavolara (d) locations. Number represents the migration in round percentage. MPAs
boundaries obtained from the World Database on Protected Areas; Mercator projection, Datum
WGS 84.
Patricia Marti Puig - PhD thesis – March 2016
65
Bayesian-based analysis using Migrate-n revealed that values of M were > 1
in all populations of both species, meaning that the effect of migration (m) is larger
than the effect of mutation (μ). Moreover, migration was found to be almost bi-
directional among sites within location. Nevertheless, P. caerulea showed a higher
numbers of migrants compared to P. rustica in every location (Table S.4.5,
Supplementary content).
4.5. Discussion
This study has analysed patterns of genetic variability and structuring in two
Patella species across the north-western Mediterranean Sea, and inside and
outside Marine Protected Areas. The three major results were: i) no significant
differences on genetic diversity IN and OUT MPAs; ii) low genetic structure along
the north-western Mediterranean coast in both species based on mitochondrial
marker; iii) differences in patterns of genetic structure and connectivity within
locations depending on species and local hydrodynamic features.
4.5.1. Patterns of genetic diversity within locations
Up to date only few studies have specifically studied patterns of genetic
variability in populations inside and outside Marine Protected Areas in temperate
benthic species (Bell, 2008a; McInerney et al., 2009b; Marti-Puig et al., 2013 for a
review). For example in one of these studies made on the overfished and
threatened pink abalone, an effect of protection on allelic diversity were observed
(Munguía-Vega et al., 2015). In the two investigated Patella species no significant
differences on genetic variability were observed for mitochondrial markers IN and
OUT MPAs. No differences in genetic variability were detected neither according
to the hyper-variable microsatellite markers, even if they have been effective in
detecting variation in genetic diversity between populations of P. caerulea on
natural and nearby artificial habitats (Fauvelot et al., 2009). In Tavolara–Punta
Coda Cavallo, no significant variability within and outside MPA were observed not
only in terms of genetic diversity but also in terms of abundance of individuals
66
(Ceccherelli et al., 2011). In fact, Ceccherelli et al. (2011) found that the rocky-
shore gastropod assemblages were significantly influenced by the geographical
siting of the locations (see also 4.5.3 paragraph).
These results could be related to the widespread distribution of Patella
species and their high population density. Nevertheless, comparing the population
density of Patella species inside and outside the other MPAs could provide data to
support this hypothesis.
High heterozygosity deficiencies related to the presence of null alleles is a
widespread phenomenon in Mollusca microsatellites (e.g. Pérez et al., 2007;
Fauvelot et al., 2009). In the species and locations studied here, null allele
frequencies observed were comparable to those obtained in previous studies
(0.06-0.50 in P. caerulea (Fauvelot et al., 2009), 0.13-0.22 in P. rustica (Ribeiro,
2008). The high correlation between the two different estimators of genetic
differentiation, the similar values of global estimates, and pairwise estimates
assuming the presence of null alleles, suggest that the large heterozygote
deficiencies may partially be due to a Wahlund effect, a common feature in limpets
(Fauvelot et al., 2009). This seems also supported by the chaotic genetic structure
observed at large scales (see paragraph 4.5.2).
4.5.2. Patterns of genetic structuring among locations
In both Patella species significant mitochondrial genetic differentiation was
found between samples from Cabo de Palos and the other locations. FST
estimates were low compared to those observed across known barriers to gene
flow, as for P. caerulea across the Tyrrhenian and Ionian boundary (Villamor A,
2014) and for P. rustica across the Atlantic-Mediterranean transition (Sá‐ Pinto et
al., 2010).
A study on the congeneric P. ulyssiponensis Gmelin, 1791 showed
significant COI genetic differentiation between the north-western Mediterranean
and the Alboran Sea (Cossu et al., 2015). In our case, genetic differentiation was
observed nearer to the North Balearic front (Galarza et al., 2009; Schunter et al.,
2011; Rossi et al., 2014). The Balearic basin is a transition zone between the
Liguro-Provençal and the Algerian basins, which are characterised by contrasting

Patricia Marti Puig - PhD thesis – March 2016
67
dynamic regimes and highly variable hydrological conditions (López García et al.,
1994). The North Balearic front is known to act as a semi-permanent
oceanographic barrier (Bouffard et al., 2010; Rossi et al., 2014) affecting genetic
diversity and structuring of marine invertebrates (Costantini et al., 2007a; Mokhtar-
Jamai et al., 2011). Observed genetic structuring could be related to long-term
historical and oceanic processes, as suggested by the absence of a relationship
between genetic diversity and geographical distance between locations. Extending
the investigation in the Balearic transition region (e.g. Cabo de Palos, Medes
Islands, Mallorca Island) to other invertebrates would allow testing this hypothesis.
The importance of oceanic processes in determining the genetic makeup
of the two species of Patella in the north-western Mediterranean was also
confirmed by the structure shown by the hypervariable markers. Overall, using
microsatellite data, the pattern of distribution of genetic variability (as shown in
FST, Dest, AMOVA and IBD analyses) showed a pattern of chaotic genetic
patchiness in P. caerulea and a slight isolation by distance pattern in P. rustica.
These differences could be explained by differences in the life history of the two
species (see paragraph 4.3). Both genetic differentiation estimators gave
consistent results albeit with low values of FST compared to those obtained using
the actual measure of differentiation (Dest). Global FST estimates were higher than
those obtained for P. caerulea and P. rustica sampled in the Adriatic Sea and the
Eastern Atlantic Ocean, respectively (Fauvelot et al., 2009; Ribeiro et al., 2010).
These discrepancies could be related to the high number of hydrodynamic
provinces in which is divided the north-western Mediterranean, compared to the
main and unidirectional currents flowing along the Atlantic coast of Iberia (Rossi et
al., 2014). These hydrodynamic provinces are delimited by intense oceanic
mesoscale structures such as jets, meanders, fronts and eddies that could affect
the genetic structure of the populations. The geological history of the Adriatic Sea
and its recent colonization after the Würm glaciation (~ 10,000 years ago) could
also explain the differences observed in the genetic pattern of north-western
Mediterranean P. caerulea populations compared to the Adriatic ones.
68
4.5.3. Genetic connectivity within locations
Microsatellites revealed low and complex patterns of genetic structuring
within locations at spatial scales of thousands of meters. Nevertheless, an effect of
migration among sites was also observed. Local currents are most likely to
influence small-scale genetic connectivity. Indeed, in most of the locations
migration patterns seem to follow the local surface currents. In Portofino the
westward migration is in accordance with the direction of the main current, but also
the high genetic differences in PORTIN2 observed in P. caerulea and the
separation between the eastern and western part of Portofino Cape observed in P.
rustica are supported by models of local circulation (Doglioli et al., 2004).
Dissimilarities in the connectivity patterns between P. caerulea and P.
rustica at local scales may be driven by their population dynamics (e.g. density,
age structure, sex ratio), life history traits (e.g. growth rate, fecundity, feeding), and
competitive interactions with other species. On western Mediterranean rocky
shores, limpets‘ distribution and abundance may change following seasonality and
micro-scale topographic features (e.g. presence of crevices, slope of the
substrate, wave exposure; Benedetti-Cecchi, 2001; Vaselli et al., 2008). As a
consequence, limpets may alternate sharp reduction of population size with rapid
increase in the number of individuals.
Closely related marine invertebrate species often display differences in
patterns of genetic structuring (Kyle and Boulding, 2000; Becker et al., 2007). This
variability has been related to the estimated levels of gene flow, and attributed to
differences pelagic larval duration. Little is known about the reproductive biology of
limpets however, along the Atlantic coast of Portugal, P. rustica, spawns once
from September-October to December-January (Ribeiro, 2008), whereas P.
caerulea has a longer reproductive period, with several spawning events occurring
from September to April (Dodd, 1957; Bacci and Sella, 1970). According to this,
limited larval output can be attributed to P. rustica (Ribeiro, 2008) compared to P.
caerulea (Dodd, 1957; Côrte-Real et al., 1996; Sá‐ Pinto et al., 2010; Fauvelot et
al., 2009), that could partially explain the differences observed in terms of diversity
and differentiation.
Three of the investigated locations (with the exception of Portofino)
included a sampling site on a protected island (i.e. CABIN2, PCROSIN2 and
Patricia Marti Puig - PhD thesis – March 2016
69
TAVIN2; Figure 3 and Figure 4). For P. caerulea, patterns of genetic structuring
within locations showed that populations sampled on islands were more isolated
from the nearby mainland populations. This genetic differentiation between
mainland and island populations were also observed in terms of large
dissimilarities of abundance in other north-western Mediterranean locations
(Benedetti-Cecchi et al., 2003) and within Tavolara– Punta Coda Cavallo MPA
(Ceccherelli et al., 2011). These differences could be related to the intrinsic
differences in the relevant processes operating in the two environments and to
stochastic recruitment processes has already been described (Benedetti-Cecchi et
al., 2003; Ceccherelli et al., 2011).
Genetic differentiation between the islands and the mainland has been
described in two sessile and sedentary intertidal invertebrates: Semibalanus
balanoides and Nucella lapillus (Bell, 2008b) observed that populations inhabiting
islands are genetically differentiated from those on the nearby mainland,
suggesting that larval flow from mainland to island sites may not be effective,
compared to the larval flow among mainland populations.
Only few studies have been able to provide empirical evidence of
effectiveness of MPAs in preserving genetic diversity and connectivity. Indeed a
major goal for marine conservation policies is to establish networks of MPA,
capable of maintaining and enhancing species resilience and ecosystem
processes. High regional scale connectivity found in Patella species along the
coasts of the western Mediterranean Sea, suggests that the established MPAs
may potentially act as an effective network supporting long-term conservation at
least for these species. Genetic monitoring through time (Schwartz et al., 2007)
combined with demographic modelling would provide a powerful tool for
monitoring and managing MPAs, based on empirical evidences of their
effectiveness and limitations. This approach has been successfully implemented in
assessment of management and conservation in the Indo-Pacific (Christianen et
al., 2014). The present study could provide a starting point to include the genetic
approach into the management of Mediterranean Marine Protected Areas.
70
4.6. Acknowledgments
Sampling was done in accordance with national laws, and authorizations
were granted by local MPAs authorities. This study did not involve endangered or
protected species. This research was funded by the European project ‗Training
Network for Monitoring Mediterranean Marine Protected Areas‘ (MMMPA: FP7-
PEOPLE-2011-ITN; grant number 290056). Involved MPAs were associated
partner of the MMMPA projects. PMP was supported by the MMPA project, as
early stage researcher, and this study is part of her PhD. AV was supported by a
research fellowship (Assegno di Ricerca) of the University of Bologna and 2010-11
PRIN project prot. 2010Z8HJ5M -Coastal bioconstructions: structures, functions,
and management. Thanks to Roberto Buonomo and PopGen CCMAR discussion
group for the Geographical distance R script. Thanks to Augusto Navone, Jose
Antonio García-Chartón, Ramón García, José Pereguiñez, Marco Palma and
Ubaldo Pantaleo for their assistance during the sampling.
4.7. Supplementary materials

Table S4.1. Summary of ANOVA tests on rarefied allele richness (Ar), private allelic richness (pAr), expected heterozygosity (He) and inbreeding coefficient
Gleick et al., in Patella caerulea and Patella rustica according to location, protection and site factors. pAr values were transformed by square root and
Cochran‘s C tests were not significant after transformations.
Location (Lo) Protection (Pr) Lo × Pr Site (Lo × Pr) Res
Patella caerulea MS F3,8 or 88 (*) p MS F1,3 p MS F3,8 or 88 (*) p MS F8,80 p MS
Ar 0.4096 0.7427 0.5295 ns 0.5654 2.5118 0.2112 ns 0.2251 0.4081 0.7475 ns pooled ns 0.5515
pAr 0.093 2.049 0.1128 ns 0.0001 0.0069 0.939 ns 0.0131 0.2886 0.8335 ns pooled ns 0.0454
He 0.0101 0.7788 0.5089 ns 0.0143 1.4612 0.3133 ns 0.0098 0.7593 0.5199 ns pooled ns 0.0129
Fis 0.0144 0.1375 0.9374 ns 0.0024 0.4141 0.5657 ns 0.0057 0.0543 0.9832 ns pooled ns 0.1045
Patella rustica MS F3,8 or 72 (*) p MS F1,3 p MS F3,8 or 72 (*) p MS F8,64 p MS
Ar 0.0265 0.1033 0.9579 ns 0.1974 1.8084 0.2713 ns 0.1092 0.4255 0.7353 ns pooled ns 0.2566
pAr 0.0209 0.1522 0.9254 ns 0.0612 7.2464 0.0743 ns 0.0084 0.0616 0.9786 ns 0.137 1.6328 0.1331 ns 0.0839
He 0.0026 0.2239 0.8795 ns 0.0049 0.7984 0.4374 ns 0.0062 0.5226 0.6681 ns pooled ns 0.0118
Fis 0.1459 1.1546 0.3331 ns 0.0748 3.3975 0.1625 ns 0.022 0.1742 0.9136 ns pooled ns 0.1264
Significant levels were indicated by the following symbols: ns = not significant, * = p < 0.05; ** = p < 0.01; *** = p < 0.001
(*) if nested factor is pooled, the denominator is the residual
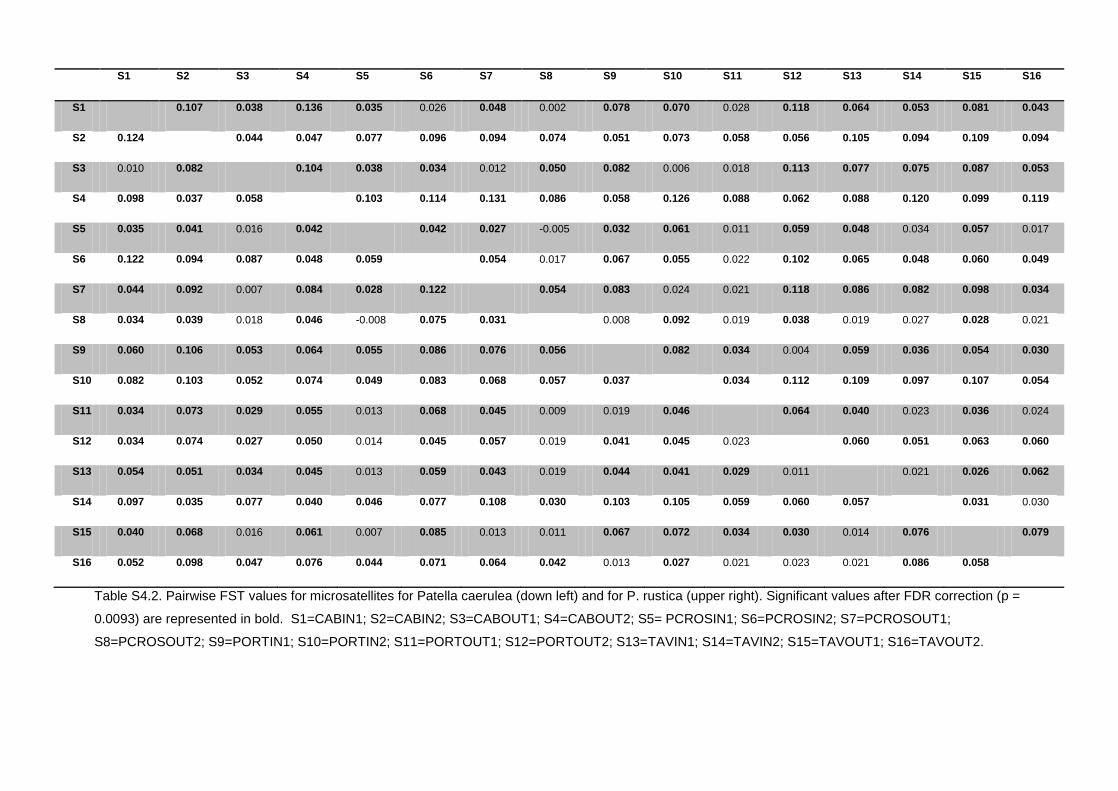
Table S4.2. Pairwise FST values for microsatellites for Patella caerulea (down left) and for P. rustica (upper right). Significant values after FDR correction (p =
0.0093) are represented in bold. S1=CABIN1; S2=CABIN2; S3=CABOUT1; S4=CABOUT2; S5= PCROSIN1; S6=PCROSIN2; S7=PCROSOUT1;
S8=PCROSOUT2; S9=PORTIN1; S10=PORTIN2; S11=PORTOUT1; S12=PORTOUT2; S13=TAVIN1; S14=TAVIN2; S15=TAVOUT1; S16=TAVOUT2.
S1 S2 S3 S4 S5 S6 S7 S8 S9 S10 S11 S12 S13 S14 S15 S16
S1 0.107 0.038 0.136 0.035 0.026 0.048 0.002 0.078 0.070 0.028 0.118 0.064 0.053 0.081 0.043
S2 0.124 0.044 0.047 0.077 0.096 0.094 0.074 0.051 0.073 0.058 0.056 0.105 0.094 0.109 0.094
S3 0.010 0.082 0.104 0.038 0.034 0.012 0.050 0.082 0.006 0.018 0.113 0.077 0.075 0.087 0.053
S4 0.098 0.037 0.058 0.103 0.114 0.131 0.086 0.058 0.126 0.088 0.062 0.088 0.120 0.099 0.119
S5 0.035 0.041 0.016 0.042 0.042 0.027 -0.005 0.032 0.061 0.011 0.059 0.048 0.034 0.057 0.017
S6 0.122 0.094 0.087 0.048 0.059 0.054 0.017 0.067 0.055 0.022 0.102 0.065 0.048 0.060 0.049
S7 0.044 0.092 0.007 0.084 0.028 0.122 0.054 0.083 0.024 0.021 0.118 0.086 0.082 0.098 0.034
S8 0.034 0.039 0.018 0.046 -0.008 0.075 0.031 0.008 0.092 0.019 0.038 0.019 0.027 0.028 0.021
S9 0.060 0.106 0.053 0.064 0.055 0.086 0.076 0.056 0.082 0.034 0.004 0.059 0.036 0.054 0.030
S10 0.082 0.103 0.052 0.074 0.049 0.083 0.068 0.057 0.037 0.034 0.112 0.109 0.097 0.107 0.054
S11 0.034 0.073 0.029 0.055 0.013 0.068 0.045 0.009 0.019 0.046 0.064 0.040 0.023 0.036 0.024
S12 0.034 0.074 0.027 0.050 0.014 0.045 0.057 0.019 0.041 0.045 0.023 0.060 0.051 0.063 0.060
S13 0.054 0.051 0.034 0.045 0.013 0.059 0.043 0.019 0.044 0.041 0.029 0.011 0.021 0.026 0.062
S14 0.097 0.035 0.077 0.040 0.046 0.077 0.108 0.030 0.103 0.105 0.059 0.060 0.057 0.031 0.030
S15 0.040 0.068 0.016 0.061 0.007 0.085 0.013 0.011 0.067 0.072 0.034 0.030 0.014 0.076 0.079
S16 0.052 0.098 0.047 0.076 0.044 0.071 0.064 0.042 0.013 0.027 0.021 0.023 0.021 0.086 0.058
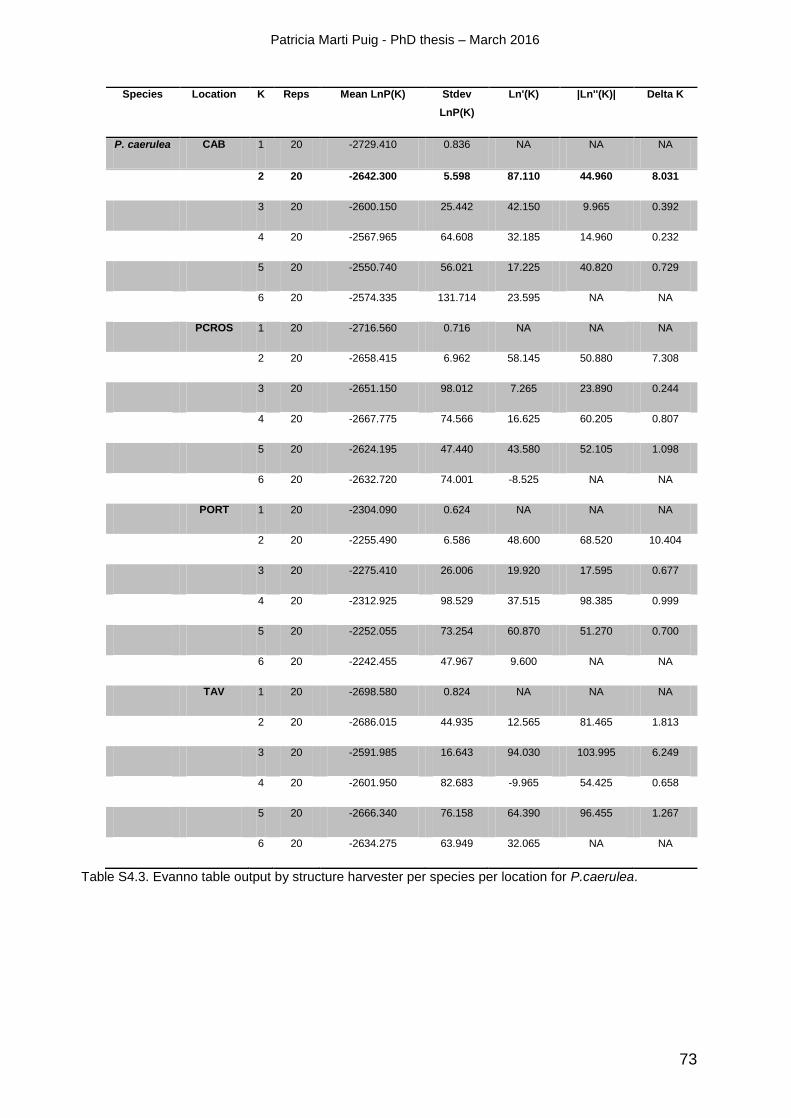
Patricia Marti Puig - PhD thesis – March 2016
73
Species Location K Reps Mean LnP(K) Stdev
LnP(K)
Ln'(K) |Ln''(K)| Delta K
P. caerulea CAB 1 20 -2729.410 0.836 NA NA NA
2 20 -2642.300 5.598 87.110 44.960 8.031
3 20 -2600.150 25.442 42.150 9.965 0.392
4 20 -2567.965 64.608 32.185 14.960 0.232
5 20 -2550.740 56.021 17.225 40.820 0.729
6 20 -2574.335 131.714 23.595 NA NA
PCROS 1 20 -2716.560 0.716 NA NA NA
2 20 -2658.415 6.962 58.145 50.880 7.308
3 20 -2651.150 98.012 7.265 23.890 0.244
4 20 -2667.775 74.566 16.625 60.205 0.807
5 20 -2624.195 47.440 43.580 52.105 1.098
6 20 -2632.720 74.001 -8.525 NA NA
PORT 1 20 -2304.090 0.624 NA NA NA
2 20 -2255.490 6.586 48.600 68.520 10.404
3 20 -2275.410 26.006 19.920 17.595 0.677
4 20 -2312.925 98.529 37.515 98.385 0.999
5 20 -2252.055 73.254 60.870 51.270 0.700
6 20 -2242.455 47.967 9.600 NA NA
TAV 1 20 -2698.580 0.824 NA NA NA
2 20 -2686.015 44.935 12.565 81.465 1.813
3 20 -2591.985 16.643 94.030 103.995 6.249
4 20 -2601.950 82.683 -9.965 54.425 0.658
5 20 -2666.340 76.158 64.390 96.455 1.267
6 20 -2634.275 63.949 32.065 NA NA
Table S4.3. Evanno table output by structure harvester per species per location for P.caerulea.
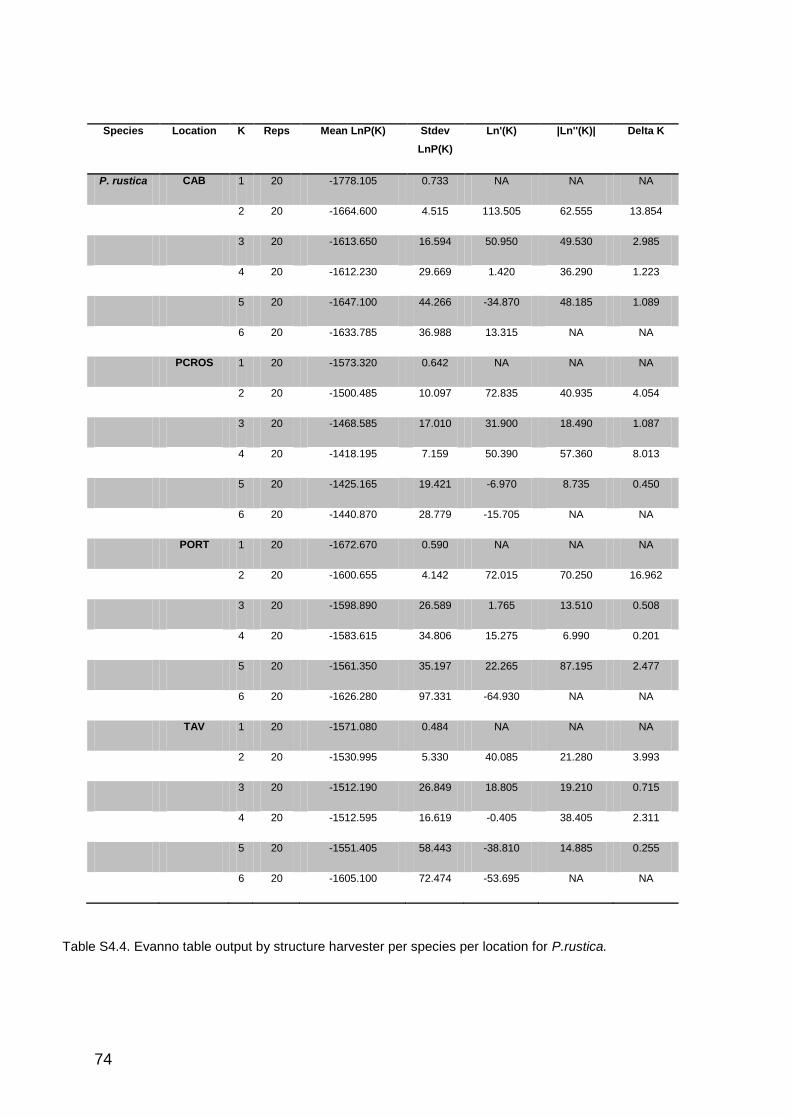
74
Species Location K Reps Mean LnP(K) Stdev
LnP(K)
Ln'(K) |Ln''(K)| Delta K
P. rustica CAB 1 20 -1778.105 0.733 NA NA NA
2 20 -1664.600 4.515 113.505 62.555 13.854
3 20 -1613.650 16.594 50.950 49.530 2.985
4 20 -1612.230 29.669 1.420 36.290 1.223
5 20 -1647.100 44.266 -34.870 48.185 1.089
6 20 -1633.785 36.988 13.315 NA NA
PCROS 1 20 -1573.320 0.642 NA NA NA
2 20 -1500.485 10.097 72.835 40.935 4.054
3 20 -1468.585 17.010 31.900 18.490 1.087
4 20 -1418.195 7.159 50.390 57.360 8.013
5 20 -1425.165 19.421 -6.970 8.735 0.450
6 20 -1440.870 28.779 -15.705 NA NA
PORT 1 20 -1672.670 0.590 NA NA NA
2 20 -1600.655 4.142 72.015 70.250 16.962
3 20 -1598.890 26.589 1.765 13.510 0.508
4 20 -1583.615 34.806 15.275 6.990 0.201
5 20 -1561.350 35.197 22.265 87.195 2.477
6 20 -1626.280 97.331 -64.930 NA NA
TAV 1 20 -1571.080 0.484 NA NA NA
2 20 -1530.995 5.330 40.085 21.280 3.993
3 20 -1512.190 26.849 18.805 19.210 0.715
4 20 -1512.595 16.619 -0.405 38.405 2.311
5 20 -1551.405 58.443 -38.810 14.885 0.255
6 20 -1605.100 72.474 -53.695 NA NA
Table S4.4. Evanno table output by structure harvester per species per location for P.rustica.
Patricia Marti Puig - PhD thesis – March 2016
75
CHAPTER V: GUIDELINES FOR THE DESIGN OF MARINE
PROTECTED AREAS, USING GENETIC CONNECTIVITY AND
DIVERSITY TOOLS
Publication note: The content of the following chapter has been published as:
Marti-Puig, P., Calò, A., Costantini, F., Villamor, A., Abbiati, M., Ponti, M., García-
Charton, J.A., 2016. Genetic connectivity and diversity as a tool to assess the
effectiveness of Marine Protected Areas, in: MMMPA Supervisory Board (Ed.),
Monitoring Mediterranean Marine Protected Areas: A set of guidelines to support
the development of management plans. Deliverable of the MMMPA European
project (FP7-PEOPLE-2011-ITN g.a. no.: 290056), Ancona, pp. 81-87.

76

Patricia Marti Puig - PhD thesis – March 2016
77
Why monitor genetic connectivity and diversity
The design and management of Marine Protected Areas (MPAs) and MPA
networks should consider spatial patterns of species distribution and connectivity
among populations (Green et al., 2014). Connectivity is the exchange of
individuals among populations through the passive transport and/or active
movement of individuals at whatever life stage (i.e. gametes, larvae, juveniles,
sub-adults and adults) (Cowen and Sponaugle, 2009). Beside its importance in
MPA design, connectivity is a fundamental aspect to consider when evaluating the
status of existing MPAs and their ability to participate in an effective network, since
well-connected and highly diverse populations are more resilient to environmental
changes and less subjected to face local extinctions (Kaplan et al., 2009; Planes
S, 2009) (Figure 5.1).
Figure 5.1: Effect of connectivity and genetic diversity on the resilience of local populations.
From this perspective, the investigation of connectivity patterns can be used
as a management tool, providing information on: Villamor A, 2014 the portion of
individuals coming from protected populations retained within MPA borders,
allowing assessment of the level of self-sustainment of populations living inside
the MPA; (Villamor A, 2014). the amount of individuals exported from protected
populations toward unprotected areas, that gives an estimate of the ability of a
MPA to supply outer unprotected locations (Gleick et al., 2010). The strength and
direction of the connections between a MPA and the other MPAs that indicates if a
MPA is acting as a ‗source‘ and/or ‗sink‘ of propagules (i.e. eggs and larvae). All
78
this information can help managers assess the status of their MPAs, and to
address specific management issues in order to improve and/or maintain MPA
health and effectiveness.
Monitoring genetic connectivity in MPAs is important because allows to:
● Assess the level of self-sustainability of populations living inside the MPA.
● Estimate the ability of an MPA to supply outer fished locations.
● Know if a MPA is acting as a ‗source‘ and/or ‗sink‘ of propagules.
How to monitor genetic connectivity and diversity
Different methods can be used to assess connectivity patterns between
populations of marine organisms: e.g. biophysical larval dispersal models, genetic
analyses, chemical analysis of carbonatic structures (such as fish otoliths). Each
method has its advantages and disadvantages and none are flawless for
assessing connectivity patterns (Calò et al., 2013, Jones et al., 2009). However, in
the context of MPA monitoring, genetic tools could be preferable as they permit
assessment of connectivity patterns at different temporal and spatial scales, and
are possibly non-lethal, allowing their application on endangered species and focal
species (Calò et al., 2013, Marti-Puig et al., 2013). Moreover, they can be used to
investigate diversity and connectivity patterns in a huge variety of marine
organisms with standard approaches equally valid for all animal or plant taxa.
A general approach for the monitoring of connectivity patterns should take
into account the characteristics of the monitored MPA but also a series of aspects
that would allow us to have a representative sampling design (Figure 2). From this
perspective, the number of sampling sites should be defined depending on the
geographic extension of the study area. The distance among sites would depend
on the MPA size, the geomorphological and environmental characteristics, and the
target species (Marti-Puig et al., 2013). A replicated design with selection of two or
more site inside and outside the MPA in order to evaluate MPA effectiveness.
Specifically, for genetic analysis, at each site, 20-30 individuals per species should
be collected, for instance, within an area of approximately 100 m., separated from
1-10 m apart in the case of sessile individuals or sampling from different shoals in

Patricia Marti Puig - PhD thesis – March 2016
79
the case of fishes, in order to avoid clones or collection of closely related
specimens (Bell, 2008a, Costantini et al., 2007a). A small amount of tissue is
enough for genetic analysis, which usually can be extracted without harming or
killing the individual. Samples should be preserved in 90% ethanol and maintained
at 4 ºC until processing. Cost per unit area would depend on the species selected
for the monitoring, and the type of analysis needed. Samples could be extracted
and sent to a sequence facility with a relatively low cost (DNA sequencing cost
around 200€ for 96 samples). Moreover, nowadays genetics is evolving very fast,
and cheaper and faster analysis such as next generation sequencing are available
(Csencsics et al., 2010).
Since connectivity patterns differ among species (Coleman et al., 2011),
several species should be selected to better address MPA management issues
(Marti-Puig et al., 2013), as well as, additional information, such as oceanographic
current data and demographic data, should be integrated in connectivity studies, in
order to better interpret the results.
Figure 5.2: Schematic standard approach for gathering data on genetic connectivity and integrate
them for the development of marine conservation strategies.
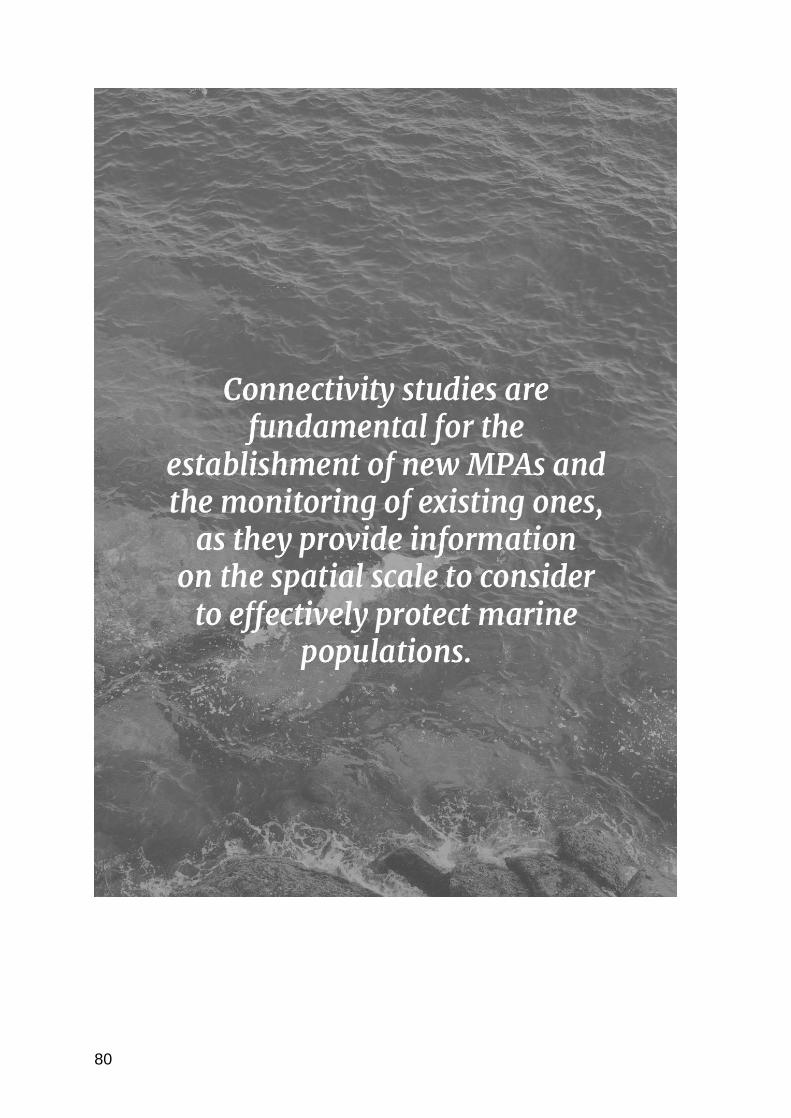
80

Patricia Marti Puig - PhD thesis – March 2016
81
A case study on fishes: the saddled sea bream
The saddled sea bream (Oblada melanura) is an economically important
species, widely distributed in Mediterranean coastal ecosystems. Although
generally protected within Mediterranean MPAs, population genetic patterns of this
species are currently unknown in the Western Mediterranean Sea. With this aim,
the genetic structure of the saddled sea bream and the level of genetic
connectivity between protected and unprotected populations was investigated,
using a set of 11 microsatellite loci. Spatial patterns of population differentiation
were assessed locally (50-100 km) and regionally (500- 1000 km), considering
three MPAs of the Western Mediterranean Sea. All values of population
differentiation (FST and Jost‘s D) were non-significant after Bonferroni correction,
indicating that, at a relatively local spatial scale, protected populations were in
general well connected with non-protected ones. On the other hand, at the
regional scale, statistical analyses (i.e. discriminant analysis of principal
components, AMOVA and STRUCTURE) revealed the presence of a subtle
population structure that reflects the main oceanographic features (currents and
barriers) of the study area (Figure 5.3).
This genetic pattern (population divergence in presence of high gene flow)
could be a consequence of different processes acting at different spatial and
temporal scales among which species dispersal capacity, the presence of admixed
populations or large population size could play a major role. These results may
have important implications for the conservation biology and fisheries
management of saddled sea bream like other coastal fish, as spatial variability in
connectivity patterns may promote long-term stability of fish populations. From this
perspective, multi-scale patterns of genetic connectivity should be taken into
account when future MPAs will be established in the western Mediterranean Sea,
implementing the existing network.

82
Figure 5.3: Study area and species. Down-right, scatterplot from DAPC analysis with
information on original sampling locations.
A case study on intertidal invertebrates: the limpets
Limpets have a key ecological role in structuring rocky intertidal
assemblages. Therefore their conservation is essential to protect these
communities. Genetic variability and population connectivity of two widely
distributed limpets (Patella caerulea and P. rustica) were analysed inside and
outside four MPAs in the western Mediterranean Sea using mitochondrial and
microsatellite markers. No effect of protection on genetic variability was observed
in either species (Figure 5.4).
Mitochondrial marker reveals for both species limited genetic structure
among MPAs in the north-western Mediterranean. Within each location, different
patterns of genetic structure and connectivity were observed depending on the
species and local hydrodynamic features (Figure 4). These and future genetic
connectivity studies will help to MPA managers for the design of MPAs in order to
enhance connectivity and genetic diversity that will increase the resilience of
marine populations.
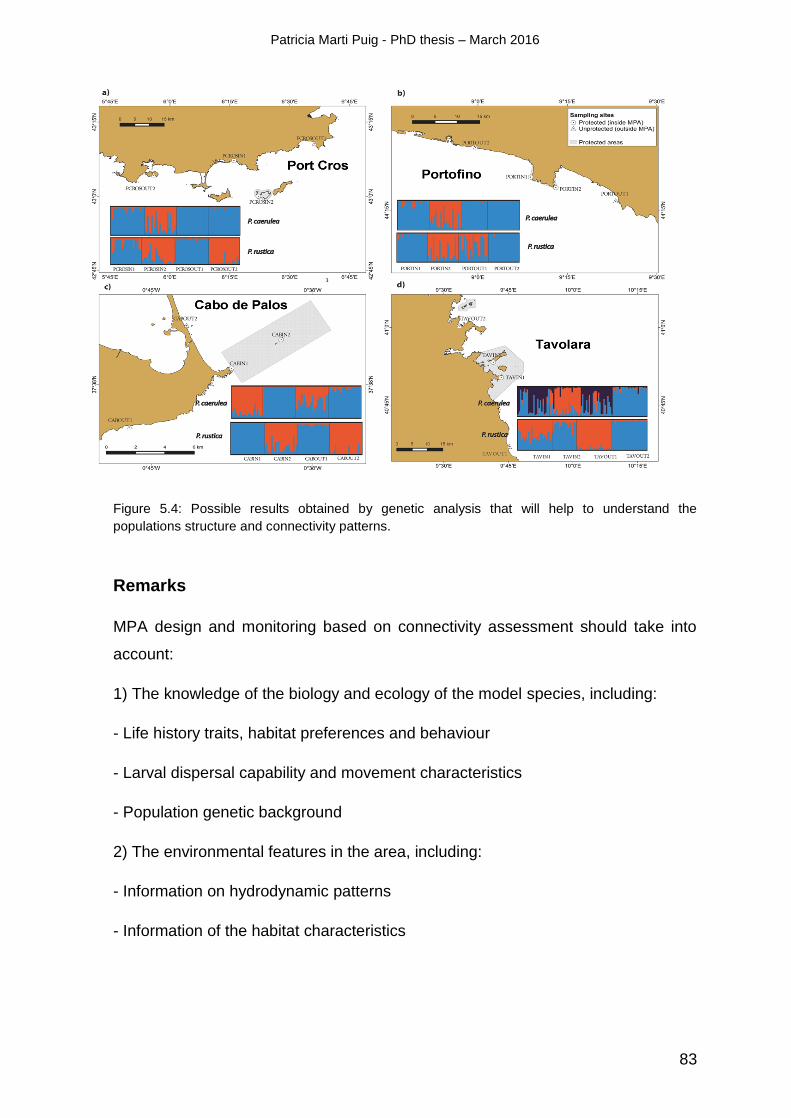
Patricia Marti Puig - PhD thesis – March 2016
83
Figure 5.4: Possible results obtained by genetic analysis that will help to understand the
populations structure and connectivity patterns.
Remarks
MPA design and monitoring based on connectivity assessment should take into
account:
1) The knowledge of the biology and ecology of the model species, including:
- Life history traits, habitat preferences and behaviour
- Larval dispersal capability and movement characteristics
- Population genetic background
2) The environmental features in the area, including:
- Information on hydrodynamic patterns
- Information of the habitat characteristics
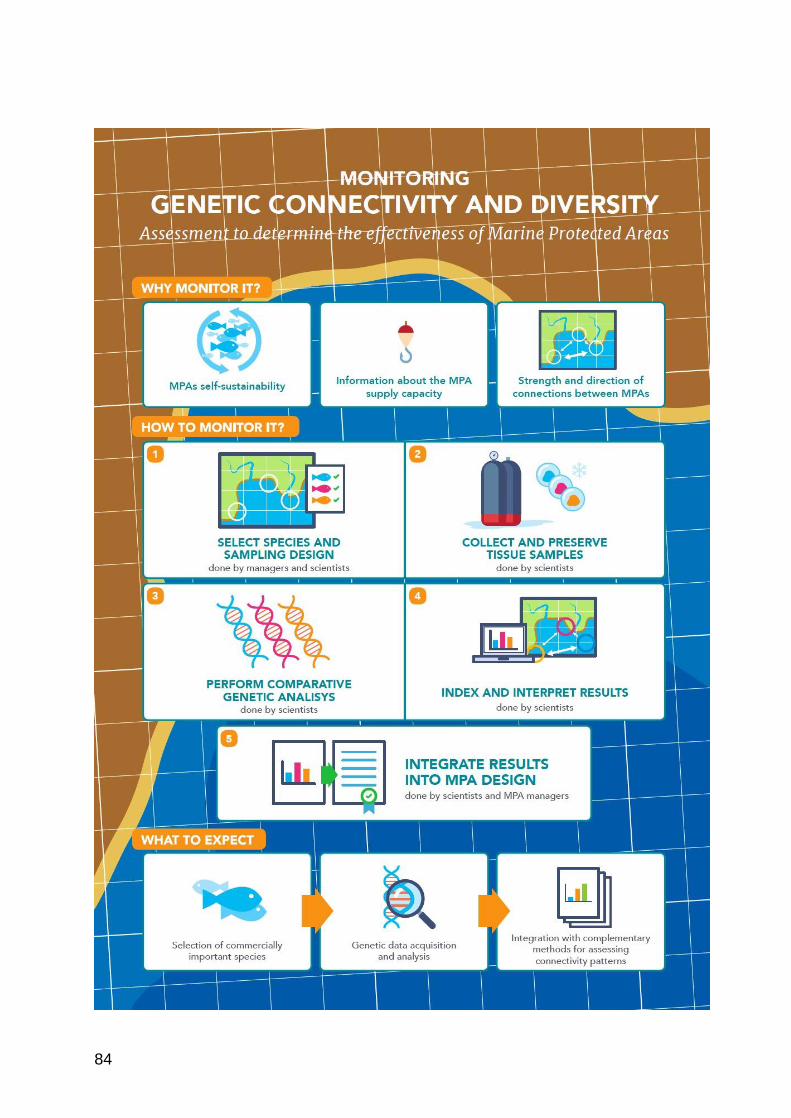
84
Patricia Marti Puig - PhD thesis – March 2016
85
CHAPTER VI: GENERAL DISCUSSION
Port-Cros Marine Protected Area. Photo source: Patricia Marti-Puig

86
Over the past decades, due to the overexploitation of marine resources,
there is an increasing need to regulate human activities and reach conservation
objectives through the establishment of effective Marine Protected Areas (MPAs)
(Agardy, 1994; Gaines et al., 2010). One of the main issues is that MPAs are not
usually designated to take in account the biology or ecology of the marine species
and their habitats. Deciding boundaries for management requires considerable
information collected from a number of sources, including information about the
diversity of the populations and how populations are connected within and beyond
these boundaries. There is a need to develop and integrate adequate tools that
can be applied and implemented to monitor MPA effectiveness. Within this
context, the aim of this thesis was to develop a protocol for monitoring Marine
Protected Areas by studying the morphology and genetics of two closely limpet
species (Patella rustica and Patella caerulea) across MPAs in the Western
Mediterranean sea.
In this thesis, I examined the steps needed to develop a sound monitoring:
from the sampling design criteria, to morphological traits analysis, estimation of
genetic diversity and connectivity, the potential integration of them into the MPA
design. There are several considerations that MPA managers need to take into
account when monitoring MPAs or MPA networks: 1) there is a need of planning
effective studies for evaluating MPAs, requiring a sampling design that includes
comparisons between protected and non-protected sites, comprising several
species and different habitats; 2) genetic and morphometric tools need to be
combined when species identification is challenging and to monitor morphological
variability; 3) different genetic markers should be used (e.g. mitochondrial,
microsatellites) to assess genetic structure and connectivity patterns at different
temporal and spatial scales 4) it is necessary to integrate these tools into all the
steps of MPA planning: from initial design to final monitoring of the effectiveness.
This thesis showed that morphometric and genetic tools are useful for
identifying species, species variability and to evaluate structure and connectivity
between and within MPAs. It also showed that biological patterns are different
even between closely related species and also they depend strongly on the
environment characteristics. Therefore, management needs should be studied on

Patricia Marti Puig - PhD thesis – March 2016
87
a case by case basis, according to the conservation objectives of the MPA and the
particular characteristics of the species of interest and habitat to be preserved.
Nonetheless, this information has to be adequately integrated along with other
data such as other social, economic and biological data (Marti-Puig, ). Similar
studies over long term have important implications, as climate change is expected
to influence pelagic larval dispersal, and thus, connectivity patterns among marine
populations (Andrello et al., 2015). Further challenges are to communicate
effectively to Marine Protected Area managers the interpretation, integration and
visualisation of these results.
Overall, this thesis provides a guideline for using morphometric and genetic
tools to assess status of Marine Protected Area, and will help managers to
address specific management issues in order to improve and/or maintain MPA
health and effectiveness.

88

Patricia Marti Puig - PhD thesis – March 2016
89
ANNEX: COMMUNICATION AND OUTREACH
ECSA54 conference. Foto source: http://www.mmmpa.eu/conferences.asp
In this Annex I included:
- Short animation movie
- Conference: ECSA54, Sesimbra, Portugal, 12-16 May 2014
- Conference: MMMPA, Ancona, Italy. 15 - 17 October, 2015
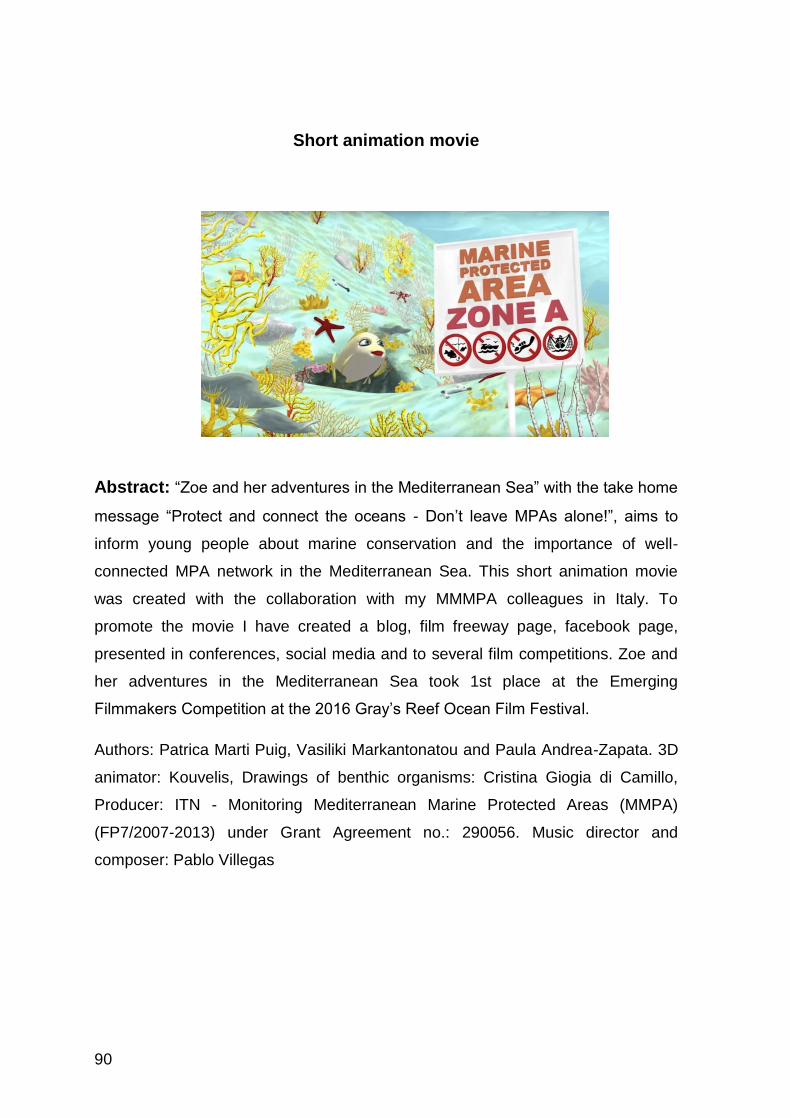
90
Short animation movie
Abstract: ―Zoe and her adventures in the Mediterranean Sea‖ with the take home
message ―Protect and connect the oceans - Don‘t leave MPAs alone!‖, aims to
inform young people about marine conservation and the importance of well-
connected MPA network in the Mediterranean Sea. This short animation movie
was created with the collaboration with my MMMPA colleagues in Italy. To
promote the movie I have created a blog, film freeway page, facebook page,
presented in conferences, social media and to several film competitions. Zoe and
her adventures in the Mediterranean Sea took 1st place at the Emerging
Filmmakers Competition at the 2016 Gray‘s Reef Ocean Film Festival.
Authors: Patrica Marti Puig, Vasiliki Markantonatou and Paula Andrea-Zapata. 3D
animator: Kouvelis, Drawings of benthic organisms: Cristina Giogia di Camillo,
Producer: ITN - Monitoring Mediterranean Marine Protected Areas (MMPA)
(FP7/2007-2013) under Grant Agreement no.: 290056. Music director and
composer: Pablo Villegas
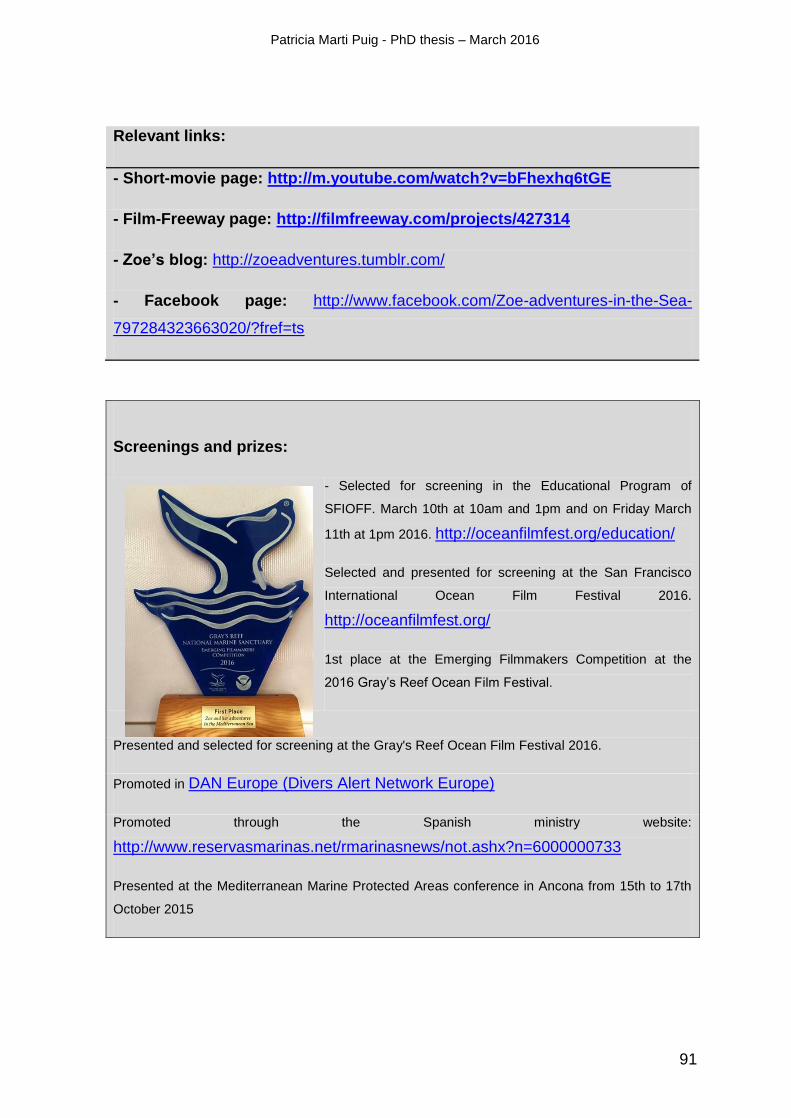
Patricia Marti Puig - PhD thesis – March 2016
91
Relevant links:
- Short-movie page: http://m.youtube.com/watch?v=bFhexhq6tGE
- Film-Freeway page: http://filmfreeway.com/projects/427314
- Zoe’s blog: http://zoeadventures.tumblr.com/
- Facebook page: http://www.facebook.com/Zoe-adventures-in-the-Sea-
797284323663020/?fref=ts
Screenings and prizes:
- Selected for screening in the Educational Program of
SFIOFF. March 10th at 10am and 1pm and on Friday March
11th at 1pm 2016. http://oceanfilmfest.org/education/
Selected and presented for screening at the San Francisco
International Ocean Film Festival 2016.
http://oceanfilmfest.org/
1st place at the Emerging Filmmakers Competition at the
2016 Gray‘s Reef Ocean Film Festival.
Presented and selected for screening at the Gray's Reef Ocean Film Festival 2016.
Promoted in DAN Europe (Divers Alert Network Europe)
Promoted through the Spanish ministry website:
http://www.reservasmarinas.net/rmarinasnews/not.ashx?n=6000000733
Presented at the Mediterranean Marine Protected Areas conference in Ancona from 15th to 17th
October 2015

92
Conference: ECSA54, Sesimbra, Portugal, 12-16 May 2014
Population connectivity within and among Mediterranean MPAs: a case study
using two closely related intertidal species (abstract).
P. Marti-Puig1, M. Ponti
1, F. Costantini
1, A. Villamor
1, M. Abbiati
1,2
1 BiGeA & CIRSA, Università di Bologna, UO CoNISMa, Via S. Alberto 163, 48123 Ravenna, Italy.
2 ISMAR, Consiglio Nazionale delle Ricerche - Istituto di Scienze Marine, Bologna, Italy.
Marine Protected Areas (MPAs) networks should be designed to protect species
diversity and ensure long-term persistence of species. For achieving this purpose,
MPAs should be efficient in terms of maintaining genetic diversity and connectivity
at different spatio-temporal scales. Here, the efficiency of four western
Mediterranean MPAs (Cabo de Palos, Port-Cros, Tavolara and Portofino) was
assessed comparing the genetic variability of two widely distributed congeneric
species of limpets (Patella caerulea and Patella rustica) in protected and nearby
non-protected sites. Mitochondrial cytochrome oxidase c subunit 1 region was
used for evaluating the connectivity among MPAs whereas the more variable
microsatellite markers were used for evaluating connectivity patterns within and
around each MPA. Genetic diversity differed among protected and non-protected
sites for both species, with higher extent for P. caerulea. However, this "MPA
effect" was not consistent in all locations. At geographic level, both species
showed high genetic connectivity between Port-Cros, Tavolara and Portofino
locations (including MPA and surrounding sites) with slight significant genetic
differentiation with the most south-western location (Cabo de Palos). At local MPA
level, no protection effect was observed in genetic diversity. Moreover within each
MPA, different patterns of genetic structure and connectivity were observed
depending on species and local environmental features. The results of this study
suggest that multi-species and multi-scale management approaches are needed
to evaluate the efficiency of MPAs.

Patricia Marti Puig - PhD thesis – March 2016
93
Morphometric and genetic distinctness between two closely related species of
limpets (Patella rustica and Patella caerulea) among Marine Protected Areas in
the western Mediterranean sea (poster)
94
Conference: MMMPA, Ancona, Italy. 15 - 17 October, 2015
Guidelines on genetic connectivity as a tool for assessing the effectiveness of
Marine Protected Areas (abstract)
P. Marti-Puig1, A. Calò
2, F. Costantini
1, A. Villamor
1, M. Abbiati
1, M. Ponti
1, J. A. García-Charton
2
1 BiGeA & CIRSA, Università di Bologna, Ravenna, Italy. * E-mail: [email protected]
2 Department of Ecology and Hydrology, Universidad de Murcia, Murcia, Spain.
The design and management of Marine Protected Areas (MPAs) and MPA
networks should take into account the spatial distribution patterns and connectivity
among populations of the target species, as a key element in biological
conservation. Connectivity is the exchange of individuals among populations
through the passive transport and/or active movement of individuals at whatever
life stage. Well-connected and highly diverse populations are more resilient to
natural and anthropogenic environmental impacts. In the context of MPA
monitoring, genetic analyses are considered a powerful tool for assessing
population diversity and connectivity patterns at different temporal and spatial
scales. In this poster presentation the guidelines to apply genetic analyses as a
monitoring tool for MPAs are presented. Two case studies in which genetics tools
were used to assess connectivity patterns between protected and unprotected
areas in the Western Mediterranean Sea were provided. In these case studies,
two widely distributed intertidal limpets, Patella rustica and Patella caerulea, and a
commercially renowned coastal fish, the saddled sea bream Oblada melanura,
were considered. The results of these studies provide MPA managers with good
examples on how to apply these guidelines and obtain the information needed to
address specific species conservation issues.

Patricia Marti Puig - PhD thesis – March 2016
95
Genetic connectivity as a tool for assessing the effectiveness of Marine Protected
Areas. MMMPA final conference. MMMPA final conference (poster)

96
References
Abdulla, A., Gomei, M., Hyrenbach, D., Notarbartolo-di-Sciara, G., Agardy, T., 2009. Challenges facing a network of representative marine protected areas in the Mediterranean: prioritizing the protection of underrepresented habitats. ICES Journal of Marine Science: Journal du Conseil 66, 22-28.
Agardy, M.T., 1994. Advances in marine conservation: the role of marine protected areas. Trends in Ecology & Evolution 9, 267-270.
Airoldi, L., Beck, M.W., 2007. Loss, status and trends for coastal marine habitats of Europe. Oceanogr Mar Biol 45, 345-405.
Almany, G.R., Connolly, S.R., Heath, D.D., Hogan, J.D., Jones, G.P., McCook, L.J., Mills, M., Pressey, R.L., Williamson, D.H., 2009. Connectivity, biodiversity conservation and the design of marine reserve networks for coral reefs. Coral Reefs 28, 339-351.
Andrello, M., Jacobi, M.N., Manel, S., Thuiller, W., Mouillot, D., 2015. Extending networks of protected areas to optimize connectivity and population growth rate. Ecography 38, 273-282.
Arrontes, J., Arenas, F., Fernandez, C., Rico, J., Oliveros, J., Martinez, B., Viejo, R., Alvarez, D., 2004. Effect of grazing by limpets on mid-shore species assemblages in northern Spain. Marine Ecology Progress Series 277, 117-133.
Babcock, R., Shears, N., Alcala, A., Barrett, N., Edgar, G., Lafferty, K., McClanahan, T., Russ, G., 2010. Decadal trends in marine reserves reveal differential rates of change in direct and indirect effects. Proceedings of the National Academy of Sciences 107, 18256-18261.
Bacci, G., Sella, G., 1970. Correlations between characters and environmental conditions in Patella of the coerulea group. Pubblicazioni della Stazione Zoologica di Napoli 38, 1-17.
Bannister, J., 1975. Shell parameters in relation to zonation in Mediterranean limpets. Marine biology 31, 63-67.
Baskett, M.L., Micheli, F., Levin, S.A., 2007. Designing marine reserves for interacting species: insights from theory. Biological Conservation 137, 163-179.
Basterretxea, G., Jordi, A., CATALÁN, I.A., Sabatés, A., 2012. Model‐ based assessment of local‐ scale fish larval connectivity in a network of marine protected areas. Fisheries Oceanography 21, 291-306.
Becker, B.J., Levin, L.A., Fodrie, F.J., McMillan, P.A., 2007. Complex larval connectivity patterns among marine invertebrate populations. Proceedings of the National Academy of Sciences 104, 3267-3272.
Beger, M., Selkoe, K.A., Treml, E., Barber, P.H., von der Heyden, S., Crandall, E.D., Toonen, R.J., Riginos, C., 2014. Evolving coral reef conservation with genetic information. Bulletin of Marine Science 90, 159-185.
Belkhir, K., Borsa, P., Chikhi, L., Raufaste, N., Bonhomme, F., 2004. GENETIX 4.05, Population genetics software for Windows TM. Université de Montpellier II. Montpellier.
Bell, J.J., 2008a. Connectivity between island Marine Protected Areas and the mainland. Biological Conservation 141, 2807-2820.

Patricia Marti Puig - PhD thesis – March 2016
97
Bell, J.J., 2008b. Similarity in connectivity patterns for two gastropod species lacking pelagic larvae. Marine Ecology Progress Series 357, 185-194.
Bell, J.J., 2012. High connectivity between sea lough populations of a planktonic larval disperser with the adjacent open coast. Marine Ecology-an Evolutionary Perspective 33, 516-521.
Bellwood, D., Hughes, T., Folke, C., Nyström, M., 2004. Confronting the coral reef crisis. Nature 429, 827-833.
Benedetti-Cecchi, L., 2001. Variability in abundance of algae and invertebrates at different spatial scales on rocky sea shores. Marine Ecology Progress Series 215, e92.
Benedetti-Cecchi, L., Maggi, E., Bertocci, I., Vaselli, S., Micheli, F., Osio, G., Cinelli, F., 2003. Variation in rocky shore assemblages in the northwestern Mediterranean: contrasts between islands and the mainland. Journal of Experimental Marine Biology and Ecology 293, 193-215.
Benjamini, Y., Hochberg, Y., 1995. Controlling the false discovery rate: a practical and powerful approach to multiple testing. Journal of the Royal Statistical Society. Series B (Methodological), 289-300.
Bernhardt, J.R., Leslie, H.M., 2013. Resilience to climate change in coastal marine ecosystems. Marine Science 5.
Berumen, M.L., Almany, G.R., Planes, S., Jones, G.P., Saenz-Agudelo, P., Thorrold, S.R., 2012. Persistence of self-recruitment and patterns of larval connectivity in a marine protected area network. Ecology and Evolution 2, 444-452.
Bianchi, C., Morri, C., 2000. Marine biodiversity of the Mediterranean Sea: situation, problems and prospects for future research. Marine Pollution Bulletin 40, 367-376.
Bookstein, F.L., 1997. Landmark methods for forms without landmarks: morphometrics of group differences in outline shape. Medical image analysis 1, 225-243.
Bosman, A., Hockey, P., Siegfried, W., 1987. The influence of coastal upwelling on the functional structure of rocky intertidal communities. Oecologia 72, 226-232.
Bouffard, J., Pascual, A., Ruiz, S., Faugère, Y., Tintoré, J., 2010. Coastal and mesoscale dynamics characterization using altimetry and gliders: A case study in the Balearic Sea. Journal of Geophysical Research: Oceans 115.
Bouzat, J.L., 2010. Conservation genetics of population bottlenecks: the role of chance, selection, and history. Conservation Genetics 11, 463-478.
Burgos-Rubio, V., De la Rosa, J., Altamirano, M., Espinosa, F., 2015. The role of patellid limpets as omnivorous grazers: a new insight into intertidal ecology. Marine Biology 162, 2093-2106.
Cadrin, S.X., Friedland, K.D., 1999. The utility of image processing techniques for morphometric analysis and stock identification. Fisheries Research 43, 129-139.
Calò, A., Félix-Hackradt, F.C., Garcia, J., Hackradt, C.W., Rocklin, D., Treviño Otón, J., Charton, J.A.G., 2013. A review of methods to assess connectivity and dispersal between fish populations in the Mediterranean Sea. Advances in Oceanography and Limnology 4, 150-175.
Ceccherelli, G., Pinna, S., Navone, A., Sechi, N., 2011. Influence of Geographical Siting and Protection on Rocky-Shore Gastropod Distribution at a Western Mediterranean Marine Protected Area. Journal of Coastal Research 27, 882-889.

98
Chapuis, M.-P., Estoup, A., 2007. Microsatellite null alleles and estimation of population differentiation. Molecular biology and evolution 24, 621-631.
Charton, J.G., Williams, I., Ruzafa, A.P., Milazzo, M., Chemello, R., Marcos, C., Kitsos, M., Koukouras, A., Riggio, S., 2000. Evaluating the ecological effects of Mediterranean marine protected areas: habitat, scale and the natural variability of ecosystems. Environmental conservation 27, 159-178.
Christianen, M.J., Herman, P.M., Bouma, T.J., Lamers, L.P., van Katwijk, M.M., van der Heide, T., Mumby, P.J., Silliman, B.R., Engelhard, S.L., van de Kerk, M., 2014. Habitat collapse due to overgrazing threatens turtle conservation in marine protected areas. Proceedings of the Royal Society of London B: Biological Sciences 281, 20132890.
Claudet, J., Osenberg, C.W., Benedetti-Cecchi, L., Domenici, P., Garcia-Charton, J.A., Perez-Ruzafa, A., Badalamenti, F., Bayle-Sempere, J., Brito, A., Bulleri, F., Culioli, J.M., Dimech, M., Falcon, J.M., Guala, I., Milazzo, M., Sanchez-Meca, J., Somerfield, P.J., Stobart, B., Vandeperre, F., Valle, C., Planes, S., 2008. Marine reserves: size and age do matter. Ecol Lett 11, 481-489.
Claudet, J., Osenberg, C.W., Domenici, P., Badalamenti, F., Milazzo, M., Falcon, J.M., Bertocci, I., Benedetti-Cecchi, L., Garcia-Charton, J.A., Goni, R., Borg, J.A., Forcada, A., De Lucia, G.A., Perez-Ruzafa, A., Afonso, P., Brito, A., Guala, I., Le Direach, L., Sanchez-Jerez, P., Somerfield, P.J., Planes, S., 2010. Marine reserves: fish life history and ecological traits matter. Ecol Appl 20, 830-839.
Coleman, M.A., Chambers, J., Knott, N.A., Malcolm, H.A., Harasti, D., Jordan, A., Kelaher, B.P., 2011. Connectivity within and among a Network of Temperate Marine Reserves. PloS one 6, e20168.
Coleman, R.A., Underwood, A.J., Benedetti-Cecchi, L., Åberg, P., Arenas, F., Arrontes, J., Castro, J., Hartnoll, R.G., Jenkins, S.R., Paula, J., 2006. A continental scale evaluation of the role of limpet grazing on rocky shores. Oecologia 147, 556-564.
Coll, M., Piroddi, C., Steenbeek, J., Kaschner, K., Lasram, F.B., Aguzzi, J., Ballesteros, E., Bianchi, C.N., Corbera, J., Dailianis, T., Danovaro, R., Estrada, M., Froglia, C., Galil, B.S., Gasol, J.M., Gertwagen, R., Gil, J., Guilhaumon, F., Kesner-Reyes, K., Kitsos, M.S., Koukouras, A., Lampadariou, N., Laxamana, E., de la Cuadra, C.M.L.F., Lotze, H.K., Martin, D., Mouillot, D., Oro, D., Raicevich, S., Rius-Barile, J., Saiz-Salinas, J.I., San Vicente, C., Somot, S., Templado, J., Turon, X., Vafidis, D., Villanueva, R., Voultsiadou, E., 2010. The Biodiversity of the Mediterranean Sea: Estimates, Patterns, and Threats. Plos One 5.
Coma, R., Linares, C., Ribes, M., Diaz, D., Garrabou, J., Ballesteros, E., 2006. Consequences of a mass mortality in populations of Eunicella singularis (Cnidaria: Octorallia) in Menorca (NW Mediterranean).
Cornuet, J.M., Luikart, G., 1996. Description and power analysis of two tests for detecting recent population bottlenecks from allele frequency data. Genetics 144, 2001-2014.
Côrte-Real, H., Macaulay, V., Richards, M.B., Hariti, G., Issad, M., CAMBON‐THOMSEN, A., Papiha, S., Bertranpetit, J., Sykes, B., 1996. Genetic diversity in the Iberian Peninsula determined from mitochondrial sequence analysis. Annals of human genetics 60, 331-350.
Cossu, P., Dedola, G.L., Scarpa, F., Sanna, D., Lai, T., Maltagliati, F., Curini-Galletti, M., Casu, M., 2015. Patterns of spatial genetic variation in Patella
Patricia Marti Puig - PhD thesis – March 2016
99
ulyssiponensis: insights from the western Mediterranean marine ecoregion. Hydrobiologia 755, 39-55.
Costa, M., Richter, A., Koivunen, V., 2010. Unified array manifold decomposition based on spherical harmonics and 2-D Fourier basis. Signal Processing, IEEE Transactions on 58, 4634-4645.
Costantini, F., Carlesi, L., Abbiati, M., 2013. Quantifying spatial genetic structuring in mesophotic populations of the precious coral Corallium rubrum. PloS one 8, e61546.
Costantini, F., Fauvelot, C., Abbiati, M., 2007a. Fine-scale genetic structuring in Corallium rubrum: evidence of inbreeding and limited effective larval dispersal. Marine Ecology Progress Series 340, 109-119.
Cowen, R.K., Lwiza, K.M., Sponaugle, S., Paris, C.B., Olson, D.B., 2000. Connectivity of marine populations: open or closed? Science 287, 857-859.
Cowen, R.K., Sponaugle, S., 2009. Larval dispersal and marine population connectivity. Annual Review of Marine Science 1, 443-466.
Crampton, J., 1995. Elliptic Fourier shape analysis of fossil bivalves: some practical considerations. Lethaia 28, 179-186.
Crooks, K.R., 2006. Connectivity conservation. Cambridge University Press. Crowder, L.B., Lyman, S., Figueira, W., Priddy, J., 2000. Source-sink population
dynamics and the problem of siting marine reserves. Bulletin of Marine Science 66, 799-820.
Csencsics, D., Brodbeck, S., Holderegger, R., 2010. Cost-effective, species-specific microsatellite development for the endangered dwarf bulrush (Typha minima) using next-generation sequencing technology. Journal of Heredity, esq069.
Davenport, J., Davenport, J.L., 2006. The impact of tourism and personal leisure transport on coastal environments: a review. Estuarine, Coastal and Shelf Science 67, 280-292.
de Aranzamendi, M.C., Martínez, J.J., Sahade, R., 2010. Shape differentiation and characterization in the two morphotypes of the Antarctic limpet Nacella concinna using Elliptic Fourier analysis of shells. Polar biology 33, 1163-1170.
Dempster, A.P., Laird, N.M., Rubin, D.B., 1977. Maximum likelihood from incomplete data via the EM algorithm. Journal of the royal statistical society. Series B (methodological), 1-38.
Di Franco, A., Coppini, G., Pujolar, J.M., De Leo, G.A., Gatto, M., Lyubartsev, V., Melia, P., Zane, L., Guidetti, P., 2012. Assessing Dispersal Patterns of Fish Propagules from an Effective Mediterranean Marine Protected Area. Plos One 7.
Dodd, J., 1957. Artificial fertilization, larval development and metamorphosis in Patella vulgata L. and Patella caerulea L. Pubblicazioni della Stazione Zoologica di Napoli 29, 172-185.
Doglioli, A.M., Griffa, A., Magaldi, M.G., 2004. Numerical study of a coastal current on a steep slope in presence of a cape: The case of the Promontorio di Portofino. Journal of Geophysical Research: Oceans 109.
Drew, J.A., Barber, P.H., 2012. Comparative Phylogeography in Fijian Coral Reef Fishes: A Multi-Taxa Approach towards Marine Reserve Design. Plos One 7.
Dufresne, F., Bourget, E., Bernatchez, L., 2002. Differential patterns of spatial divergence in microsatellite and allozyme alleles: further evidence for

100
locus‐ specific selection in the acorn barnacle, Semibalanus balanoides? Molecular Ecology 11, 113-123.
Dufresne, F., Parent, M., Bernatchez, L., 1999. Isolation and characterization of microsatellite markers in the acorn barnacle Semibalanus balanoides. Mol Ecol 8, 1558-1559.
Earl, D.A., BM, v., 2012. STRUCTURE HARVESTER: a website and program for visualizing STRUCTURE output and implementing the Evanno method. Conservation genetics resources 4, 359-361.
Edgar, G.J., Stuart-Smith, R.D., Willis, T.J., Kininmonth, S., Baker, S.C., Banks, S., Barrett, N.S., Becerro, M.A., Bernard, A.T., Berkhout, J., 2014. Global conservation outcomes depend on marine protected areas with five key features. Nature 506, 216-220.
Evanno, G., Regnaut, S., Goudet, J., 2005. Detecting the number of clusters of individuals using the software STRUCTURE: a simulation study. Molecular ecology 14, 2611-2620.
Evans, R.G., 1953. Studies on the biology of British limpets—the genus Patella on the south coast of England, Proceedings of the Zoological Society of London. Wiley Online Library, pp. 357-376.
Excoffier, L., Smouse, P.E., Quattro, J.M., 1992. Analysis of molecular variance inferred from metric distances among DNA haplotypes: application to human mitochondrial DNA restriction data. Genetics 131, 479-491.
Falush, D., Stephens, M., Pritchard, J.K., 2003. Inference of population structure using multilocus genotype data: linked loci and correlated allele frequencies. Genetics 164, 1567-1587.
Fauvelot, C., Bertozzi, F., Costantini, F., Airoldi, L., Abbiati, M., 2009. Lower genetic diversity in the limpet Patella caerulea on urban coastal structures compared to natural rocky habitats. Marine Biology 156, 2313-2323.
Fauvelot, C., Costantini, F., Virgilio, M., Abbiati, M., 2012. Do artificial structures alter marine invertebrate genetic makeup? Marine biology 159, 2797-2807.
Fenberg, P.B., Roy, K., 2012. Anthropogenic harvesting pressure and changes in life history: insights from a rocky intertidal limpet. The American Naturalist 180, 200-210.
Foster, N.L., Paris, C.B., KOOL, J.T., Baums, I.B., Stevens, J.R., Sanchez, J.A., Bastidas, C., Agudelo, C., Bush, P., Day, O., 2012. Connectivity of Caribbean coral populations: complementary insights from empirical and modelled gene flow. Mol Ecol 21, 1143-1157.
Frankham, R., 2005a. Genetics and extinction. Biological conservation 126, 131-140.
Freeman, H., 1974. Computer processing of line-drawing images. ACM Computing Surveys (CSUR) 6, 57-97.
Friedland, K., 1996. Analyses of calcified structures–Fourier shape analysis. ICES CM 1000, 1.
Gaines, S.D., White, C., Carr, M.H., Palumbi, S.R., 2010. Designing marine reserve networks for both conservation and fisheries management. Proceedings of the National Academy of Sciences 107, 18286-18293.
Galarza, J.A., Carreras-Carbonell, J., Macpherson, E., Pascual, M., Roques, S., Turner, G.F., Rico, C., 2009. The influence of oceanographic fronts and early-life-history traits on connectivity among littoral fish species. Proceedings of the National Academy of Sciences 106, 1473-1478.
Patricia Marti Puig - PhD thesis – March 2016
101
Gleick, P.H., Adams, R., Amasino, R., Anders, E., Anderson, D., Anderson, W., Anselin, L., Arroyo, M., Asfaw, B., Ayala, F., 2010. Climate change and the integrity of science. Science 328, 689-690.
González-Wangüemert, M., Aydin, M., Conand, C., 2014. Assessment of sea cucumber populations from the Aegean Sea (Turkey): First insights to sustainable management of new fisheries. Ocean & Coastal Management 92, 87-94.
González-Wevar, C., Nakano, T., Cañete, J., Poulin, E., 2011. Concerted genetic, morphological and ecological diversification in Nacella limpets in the Magellanic Province. Molecular Ecology 20, 1936-1951.
Green, A.L., Maypa, A.P., Almany, G.R., Rhodes, K.L., Weeks, R., Abesamis, R.A., Gleason, M.G., Mumby, P.J., White, A.T., 2014. Larval dispersal and movement patterns of coral reef fishes, and implications for marine reserve network design. Biological Reviews.
Guerra, M.T., Gaudencio, M.J., 1986. Aspects of the ecology of Patella spp. on the Portuguese coast. Hydrobiologia 142, 57-69.
Guerra-Garcıa, J.M., Corzo, J., Espinosa, F., Garcıa-Gomez, J.C., 2004. Assessing habitat use of the endangered marine mollusc Patella ferruginea (Gastropoda, Patellidae) in northern Africa: preliminary results and implications for conservation. Biological conservation 116, 319-326.
Guidetti, P., Notarbartolo‐ Di‐ Sciara, G., Agardy, T., 2013. Integrating pelagic and coastal MPAs into large‐ scale ecosystem‐ wide management. Aquatic Conservation: Marine and Freshwater Ecosystems 23, 179-182.
Halpern, B.S., Walbridge, S., Selkoe, K.A., Kappel, C.V., Micheli, F., D'Agrosa, C., Bruno, J.F., Casey, K.S., Ebert, C., Fox, H.E., 2008. A global map of human impact on marine ecosystems. Science 319, 948-952.
Hastings, A., Botsford, L.W., 2006. Persistence of spatial populations depends on returning home. Proceedings of the National Academy of Sciences 103, 6067-6072.
Hebert, P.D.N., Cywinska, A., Ball, S.L., deWaard, J.R., 2003. Biological identifications through DNA barcodes. Proceedings of the Royal Society of London Series B, 313–321.
Hedgecock, D., Barber, P.H., Edmands, S., 2007. Genetic approaches to measuring connectivity. Oceanography-Washington DC-Oceanography society 20, 70.
Hellberg, M.E., 1996. Dependence of gene flow on geographic distance in two solitary corals with different larval dispersal capabilities. Evolution, 1167-1175.
Hellberg, M.E., Burton, R.S., Neigel, J.E., Palumbi, S.R., 2002. Genetic assessment of connectivity among marine populations. Bulletin of marine science 70, 273-290.
Hiraoka, Y., Kuramoto, N., Center, F.T.B., 2004. Identification of Rhus succedanea L. Cultivars Using Elliptic Fourier Descriptors Based on Fruit Shape. Silvae Genetica 53, 221-226.
Hoffmann, A.A., Sgrò, C.M., 2011. Climate change and evolutionary adaptation. Nature 470, 479-485.
Hubisz, M.J., Falush, D., Stephens, M., Pritchard, J.K., 2009. Inferring weak population structure with the assistance of sample group information. Molecular ecology resources 9, 1322-1332.
Hughes, T.P., Baird, A.H., Bellwood, D.R., Card, M., Connolly, S.R., Folke, C., Grosberg, R., Hoegh-Guldberg, O., Jackson, J., Kleypas, J., 2003. Climate
102
change, human impacts, and the resilience of coral reefs. Science 301, 929-933.
Hutchings, J.A., Reynolds, J.D., 2004. Marine fish population collapses: consequences for recovery and extinction risk. BioScience 54, 297-309.
Iwata, H., Ukai, Y., 2002. SHAPE: a computer program package for quantitative evaluation of biological shapes based on elliptic Fourier descriptors. Journal of Heredity 93, 384-385.
Jaquiéry, J., Broquet, T., Hirzel, A., Yearsley, J., Perrin, N., 2011. Inferring landscape effects on dispersal from genetic distances: how far can we go? Mol Ecol 20, 692-705.
Jones, G.P., Almany, G.R., Russ, G.R., Sale, P.F., Steneck, R.S., van Oppen, M.J.H., Willis, B.L., 2009. Larval retention and connectivity among populations of corals and reef fishes: history, advances and challenges. Coral Reefs 28, 307-325.
Jost, L., 2008. GST and its relatives do not measure differentiation. Molecular Ecology 17, 4015-4026.
Kaesler, R.L., Waters, J.A., 1972. Fourier analysis of the ostracode margin. Geological Society of America Bulletin 83, 1169-1178.
Kalinowski, S.T., 2004. Counting alleles with rarefaction: private alleles and hierarchical sampling designs. Conservation Genetics 5, 539-543.
Kaplan, D.M., Botsford, L.W., O'Farrell, M.R., Gaines, S.D., Jorgensen, S., 2009. Model-based assessment of persistence in proposed marine protected area designs. Ecological Applications 19, 433-448.
Kaunda-Arara, B., Rose, G.A., 2004. Effects of marine reef National Parks on fishery CPUE in coastal Kenya. Biological Conservation 118, 1-13.
Kelleher, G., 1996. A global representative system of marine protected areas. Ocean & coastal management 32, 123-126.
Kelly, R.P., Palumbi, S.R., 2010. Genetic Structure Among 50 Species of the Northeastern Pacific Rocky Intertidal Community. Plos One 5.
Kennish, M.J., 2002. Environmental threats and environmental future of estuaries. Environmental conservation 29, 78-107.
Keough, M.J., Quinn, G., 1998. Effects of periodic disturbances from trampling onrocky intertidal algal beds. Ecological Applications 8, 141-161.
Kool, J.T., Moilanen, A., Treml, E.A., 2013. Population connectivity: recent advances and new perspectives. Landscape Ecology 28, 165-185.
Kopelman, N.M., Mayzel, J., Jakobsson, M., Rosenberg, N.A., Mayrose, I., 2015. Clumpak: a program for identifying clustering modes and packaging population structure inferences across K. Molecular ecology resources 15, 1179-1191.
Kotsakiozi, P., Rigal, F., Valakos, E.D., Parmakelis, A., 2013. Disentangling the effects of intraspecies variability, phylogeny, space, and climate on the evolution of shell morphology in endemic Greek land snails of the genus Codringtonia. Biological Journal of the Linnean Society 110, 796-813.
Kress, W.J., Erickson, D.L., 2008. DNA barcodes: genes, genomics, and bioinformatics. Proceedings of the National Academy of Sciences 105, 2761-2762.
Kritzer, J.P., Sale, P.F., 2004. Metapopulation ecology in the sea: from Levins' model to marine ecology and fisheries science. Fish and Fisheries 5, 131-140.
Kuhl, F.P., Giardina, C.R., 1982. Elliptic Fourier features of a closed contour. Computer graphics and image processing 18, 236-258.
Patricia Marti Puig - PhD thesis – March 2016
103
Kyle, C., Boulding, E., 2000. Comparative population genetic structure of marine gastropods (Littorina spp.) with and without pelagic larval dispersal. Marine Biology 137, 835-845.
Lotze, H.K., Coll, M., Magera, A.M., Ward-Paige, C., Airoldi, L., 2011. Recovery of marine animal populations and ecosystems. Trends in Ecology & Evolution 26, 595-605.
Lowe, W.H., Allendorf, F.W., 2010. What can genetics tell us about population connectivity? Molecular Ecology 19, 3038-3051.
Lubchenco, J., Palumbi, S.R., Gaines, S.D., Andelman, S., 2003. Plugging a hole in the ocean: the emerging science of marine reserves 1. Ecological applications 13, 3-7.
MacLeod, N., Ortiz, N., Fefferman, N., Clyde, W., Schulter, C., MacLean, J., 2000. Phenotypic response of foraminifera to episodes of global environmental change. Biotic response to global environmental change: the last 145, 51-78.
Marshall, D., Monro, K., Bode, M., Keough, M., Swearer, S., 2010. Phenotype–environment mismatches reduce connectivity in the sea. Ecol Lett 13, 128-140.
Marti-Puig, P., Calò, A., Costantini, F., Villamor, A., Abbiati, M., Ponti, M., García-Charton, J.A., 2016. Genetic connectivity and diversity as a tool to assess the effectiveness of Marine Protected Areas. in: MMMPA Supervisory Board (Ed.), Monitoring Mediterranean Marine Protected Areas: A set of guidelines to support the development of management plans. Deliverable of the MMMPA European project (FP7-PEOPLE-2011-ITN g.a. no.: 290056), Ancona, pp. 81-87.
Marti-Puig, P., Costantini, F., Rugiu, L., Ponti, M., Abbiati, M., 2013. Patterns of genetic connectivity in invertebrates of temperate MPA networks. Advances in Oceanography and Limnology 4, 138-149.
Mauro, A., Arculeo, M., Parrinello, N., 2003. Morphological and molecular tools in identifying the Mediterranean limpets Patella caerulea, Patella aspera and Patella rustica. Journal of Experimental Marine Biology and Ecology 295, 131-143.
McInerney, C.E., Allcock, A.L., Johnson, M.P., Prodohl, P.A., 2009a. Characterization of polymorphic microsatellites for the rough periwinkle gastropod, Littorina saxatilis (Olivi, 1792) and their cross-amplification in four congeners. Conservation Genetics 10, 1989-1992.
McInerney, C.E., Allcock, A.L., Johnson, M.P., Prodohl, P.A., 2009b. Understanding marine reserve function in a seascape genetics context: Nucella lapillus in Strangford Lough (Northern Ireland) as an example. Aquatic Biology 7, 45-58.
Meirmans, P.G., 2014. Non-convergence in Bayesian estimation of migration rates. Molecular Ecology Resources 14, 726-733.
Menconi, M., Benedetti-Cecchi, L., Cinelli, F., 1999. Spatial and temporal variability in the distribution of algae and invertebrates on rocky shores in the northwest Mediterranean. Journal of Experimental Marine Biology and Ecology 233, 1-23.
Miller, K.J., Ayre, D.J., 2008. Protection of genetic diversity and maintenance of connectivity among reef corals within marine protected areas. Conservation Biology 22, 1245-1254.
Mokhtar-Jamai, K., Pascual, M., Ledoux, J.B., Coma, R., Feral, J.P., Garrabou, J., Aurelle, D., 2011. From global to local genetic structuring in the red
104
gorgonian Paramuricea clavata: the interplay between oceanographic conditions and limited larval dispersal. Molecular Ecology 20, 3291-3305.
Moore, H.B., 1934. The relation of shell growth to environment in Patella yulgata. Journal of Molluscan Studies 21, 217-222.
Munguía-Vega, A., Sáenz-Arroyo, A., Greenley, A.P., Espinoza-Montes, J.A., Palumbi, S.R., Rossetto, M., Micheli, F., 2015. Marine reserves help preserve genetic diversity after impacts derived from climate variability: Lessons from the pink abalone in Baja California. Global Ecology and Conservation 4, 264-276.
Nei, M., 1987. Molecular evolutionary genetics. Columbia university press. Nei, M., Li, W.-H., 1979. Mathematical model for studying genetic variation in
terms of restriction endonucleases. Proceedings of the National Academy of Sciences 76, 5269-5273.
Padilla, D.K., Savedo, M.M., , 2013. A systematic review of phenotypic plasticity in marine invertebrate and plant systems. Advances in Marine Biology Vol 65, pp. 67-94.
Palumbi, S.R., 2003. Population genetics, demographic connectivity, and the design of marine reserves. Ecological applications 13, 146-158.
Pelc, R., Warner, R., Gaines, S., 2009. Geographical patterns of genetic structure in marine species with contrasting life histories. Journal of Biogeography 36, 1881-1890.
Pérez, M., Branco, M., Llavona, A., Ribeiro, P., Santos, A., Hawkins, S., Dávila, J., Presa, P., Alexandrino, P., 2007. Development of microsatellite loci for the black-footed limpet, Patella depressa, and cross-amplification in two other Patella species. Conservation Genetics 8, 739-742.
Pérez, M., Llavona, A., Presa, P., Ribeiro, P., Hawkins, S., Santos, A., Alexandrino, P., 2008. New polymorphic microsatellite markers for the limpet Patella rustica and cross‐ priming testing in four Patella species. Molecular ecology resources 8, 926-929.
Petit, R.J., El Mousadik, A., Pons, O., 1998. Identifying populations for conservation on the basis of genetic markers. Conservation biology 12, 844-855.
Philippart, C.J., Anadón, R., Danovaro, R., Dippner, J.W., Drinkwater, K.F., Hawkins, S.J., Oguz, T., O'Sullivan, G., Reid, P.C., 2011. Impacts of climate change on European marine ecosystems: observations, expectations and indicators. Journal of Experimental Marine Biology and Ecology 400, 52-69.
Pineda, J., Hare, J.A., Sponaungle, S., 2007. Larval transport and dispersal in the coastal ocean and consequences for population connectivity.
Pinn, E.H., Rodgers, M., 2005. The influence of visitors on intertidal biodiversity. Journal of the Marine Biological Association of the United Kingdom 85, 263-268.
Piraino, S., Fanelli, G., Boero, F., 2002. Variability of species' roles in marine communities: change of paradigms for conservation priorities. Marine Biology 140, 1067-1074.
Planes S, J.G., Thorrold SR 2009. Larval dispersal connects fish populations in a network of marine protected areas. Proceedings of the National Academy of Sciences 105, 5693-5697.
Planes, S., Jones, G.P., Thorrold, S.R., 2009. Larval dispersal connects fish populations in a network of marine protected areas. Proceedings of the National Academy of Sciences 106, 5693-5697.
Patricia Marti Puig - PhD thesis – March 2016
105
Polunin, N., Roberts, C., 1993. Greater biomass and value of target coral-reef fishes in two small Caribbean marine reserves. Marine Ecology-Progress Series 100, 167-167.
Puillandre, N., Baylac, M., Boisselier, M.-C., Cruaud, C., Samadi, S., 2009. An integrative approach to species delimitation in Benthomangelia (Mollusca: Conoidea). Biological Journal of the Linnean Society 96, 696-708.
Putman, A.I., Carbone, I., 2014. Challenges in analysis and interpretation of microsatellite data for population genetic studies. Ecology and evolution 4, 4399-4428.
Ramajo, L., Baltanás, Á., Torres, R., Manríquez, P.H., Rodriguez-Navarro, A., Lagos, N.A., 2013. Geographical variation in shell morphology of juvenile snails (Concholepas concholepas) along the physical–chemical gradient of the Chilean coast. Journal of the Marine Biological Association of the United Kingdom 93, 2167-2176.
Ribeiro, P.M.d.A., 2008. Dispersal and connectivity of northeastern Atlantic patellid limpets: a multidisciplinary approach. University of Southampton.
Roberts, C.M., Andelman, S., Branch, G., Bustamante, R.H., Carlos Castilla, J., Dugan, J., Halpern, B.S., Lafferty, K.D., Leslie, H., Lubchenco, J., 2003. Ecological criteria for evaluating candidate sites for marine reserves. Ecological applications 13, 199-214.
Roberts, C.M., McClean, C.J., Veron, J.E., Hawkins, J.P., Allen, G.R., McAllister, D.E., Mittermeier, C.G., Schueler, F.W., Spalding, M., Wells, F., 2002. Marine biodiversity hotspots and conservation priorities for tropical reefs. Science 295, 1280-1284.
Rohlf, F.J., Archie, J.W., 1984. A comparison of Fourier methods for the description of wing shape in mosquitoes (Diptera: Culicidae). Systematic Biology 33, 302-317.
Rohlf, F.J., Marcus, L.F., 1993. A revolution morphometrics. Trends in Ecology & Evolution 8, 129-132.
Rosenberg, N.A., 2004. DISTRUCT: a program for the graphical display of population structure. Molecular Ecology Notes 4, 137-138.
Rossi, V., Ser‐ Giacomi, E., López, C., Hernández‐ García, E., 2014. Hydrodynamic provinces and oceanic connectivity from a transport network help designing marine reserves. Geophysical Research Letters 41, 2883-2891.
Rousset, F., 2008. genepop‘007: a complete re‐ implementation of the genepop software for Windows and Linux. Molecular ecology resources 8, 103-106.
Russ, G.R., 2002. Yet another review of marine reserves as reef fishery management tools. Coral reef fishes: dynamics and diversity in a complex ecosystem. Academic Press, San Diego, California, USA, 421-443.
Sá-Pinto, A., Branco, M., Harris, D.J., Alexandrino, P., 2005. Phylogeny and phylogeography of the genus Patella based on mitochondrial DNA sequence data. Journal of Experimental Marine Biology and Ecology 325, 95-110.
Sá‐ Pinto, A., Baird, S.J., Pinho, C., Alexandrino, P., Branco, M., 2010. A three‐way contact zone between forms of Patella rustica (Mollusca: Patellidae) in the central Mediterranean Sea. Biological Journal of the Linnean Society 100, 154-169.
Sala, E., Aburto-Oropeza, O., Paredes, G., Parra, I., Barrera, J.C., Dayton, P.K., 2002. A general model for designing networks of marine reserves. Science 298, 1991-1993.

106
Salm, R.V., Clark, J.R., Siirila, E., 2000. Marine and coastal protected areas: a guide for planners and managers. IUCN.
Schunter, C., Carreras-Carbonell, J., Planes, S., Sala, E., Ballesteros, E., Zabala, M., Harmelin, J.G., Harmelin-Vivien, M., Macpherson, E., Pascual, M., 2011. Genetic connectivity patterns in an endangered species: The dusky grouper (Epinephelus marginatus). Journal of Experimental Marine Biology and Ecology 401, 126-133.
Schwartz, M.K., Luikart, G., Waples, R.S., 2007. Genetic monitoring as a promising tool for conservation and management. Trends in ecology & evolution 22, 25-33.
Selkoe, K.A., Toonen, R.J., 2006. Microsatellites for ecologists: a practical guide to using and evaluating microsatellite markers. Ecology letters 9, 615-629.
Selkoe, K.A., Watson, J.R., White, C., Horin, T.B., Iacchei, M., Mitarai, S., Siegel, D.A., Gaines, S.D., Toonen, R.J., 2010. Taking the chaos out of genetic patchiness: seascape genetics reveals ecological and oceanographic drivers of genetic patterns in three temperate reef species. Mol Ecol 19, 3708-3726.
Silva, I.C., Mesquita, N., Paula, J., 2010. Lack of population structure in the fiddler crab Uca annulipes along an East African latitudinal gradient: genetic and morphometric evidence. Marine Biology 157, 1113-1126.
Starr, R.M., O'Connell, V., Ralston, S., 2004. Movements of lingcod (Ophiodon elongatus) in southeast Alaska: potential for increased conservation and yield from marine reserves. Canadian Journal of Fisheries and Aquatic Sciences 61, 1083-1094.
Steneck, R.S., Graham, M.H., Bourque, B.J., Corbett, D., Erlandson, J.M., Estes, J.A., Tegner, M.J., 2002. Kelp forest ecosystems: biodiversity, stability, resilience and future. Environmental conservation 29, 436-459.
Sundelof, A., Jonsson, P.R., 2012. Larval dispersal and vertical migration behaviour - a simulation study for short dispersal times. Marine Ecology-an Evolutionary Perspective 33, 183-193.
Teske, P.R., Forget, F.R.G., Cowley, P.D., von der Heyden, S., Beheregaray, L.B., 2010. Connectivity between marine reserves and exploited areas in the philopatric reef fish Chrysoblephus laticeps (Teleostei: Sparidae). Marine Biology 157, 2029-2042.
Thompson, R., Crowe, T., Hawkins, S., 2002. Rocky intertidal communities: past environmental changes, present status and predictions for the next 25 years. Environmental Conservation 29, 168-191.
Tlig-Zouari, S., Rabaoui, L., Fguiri, H., Diawara, M., Ben Hassine, O.K., 2011. Morphometric characterization of the limpet Patella ferruginea along the Tunisian coasts. CBM-Cahiers de Biologie Marine 52, 269.
Toonen, R.J., Andrews, K.R., Baums, I.B., Bird, C.E., Concepcion, G.T., Daly-Engel, T.S., Eble, J.A., Faucci, A., Gaither, M.R., Iacchei, M., 2011. Defining boundaries for ecosystem-based management: a multispecies case study of marine connectivity across the Hawaiian Archipelago. Journal of Marine Biology 2011.
Underwood, A., 2000. Experimental ecology of rocky intertidal habitats: what are we learning? Journal of Experimental Marine Biology and Ecology 250, 51-76.
Underwood, A.J., 1996. Experiments in ecology: their logical design and interpretation using analysis of variance. Cambridge University Press.
Patricia Marti Puig - PhD thesis – March 2016
107
Van Bocxlaer, B., Schultheiß, R., 2010. Comparison of morphometric techniques for shapes with few homologous landmarks based on machine-learning approaches to biological discrimination. Paleobiology 36, 497-515.
Vaselli, S., Bertocci, I., Maggi, E., Benedetti-Cecchi, L., 2008. Assessing the consequences of sea level rise: effects of changes in the slope of the substratum on sessile assemblages of rocky seashores. Marine Ecology Progress Series 368, 9-22.
Venables, W.N., Smith, D.M., 2005. the R development core team. An Introduction to R. Notes on R: A Programming Environment for Data Analysis and Graphics.
Villamor A, C.F., Abbiati M (2014), 2014. Genetic Structuring across Marine Biogeographic Boundaries in Rocky Shore Invertebrates. PloS One.
Warner, R.R., Cowen, R.K., 2002. Local retention of production in marine populations: evidence, mechanisms, and consequences. Bulletin of Marine Science 70, 245-249.
Watters, J.V., Lema, S.C., Nevitt, G.A., 2003. Phenotype management: a new approach to habitat restoration. Biological Conservation 112, 435-445.
Weersing, K., Toonen, R.J., 2009. Population genetics, larval dispersal, and connectivity in marine systems. Marine Ecology Progress Series 393, 1-12.
Wernberg, T., Russell, B.D., Moore, P.J., Ling, S.D., Smale, D.A., Campbell, A., Coleman, M.A., Steinberg, P.D., Kendrick, G.A., Connell, S.D., 2011. Impacts of climate change in a global hotspot for temperate marine biodiversity and ocean warming. Journal of Experimental Marine Biology and Ecology 400, 7-16.
Will, K.W., Mishler, B.D., Wheeler, Q.D., 2005. The perils of DNA barcoding and the need for integrative taxonomy. Systematic biology 54, 844-851.
Williams, G.C., 2008. Adaptation and natural selection: a critique of some current evolutionary thought. Princeton University Press.
Williams, S.T., Hall, A., Kuklinski, P., 2012. Unraveling Cryptic Diversity in the Indo-West Pacific Gastropod Genus Lunella (Turbinidae) using Elliptic Fourier Analysis*. American Malacological Bulletin 30, 189-206.
Wood, A.R., Gardner, J.P.A., 2007. Small spatial scale population genetic structure in two limpet species endemic to the Kermadec Islands, New Zealand. Marine Ecology Progress Series 349, 159-170.
Zachos, F.E., Apollonio, M., Bärmann, E.V., Festa-Bianchet, M., Göhlich, U., Habel, J.C., Haring, E., Kruckenhauser, L., Lovari, S., McDevitt, A.D., 2013. Species inflation and taxonomic artefacts—A critical comment on recent trends in mammalian classification. Mammalian Biology-Zeitschrift für Säugetierkunde 78, 1-6.