Biodiesel production from castor oil: ANN modeling and ... · RESEARCH ARTICLE Biodiesel production...
10
RESEARCH ARTICLE Biodiesel production from castor oil: ANN modeling and kinetic parameter estimation Atiya Banerjee 1 • Devyani Varshney 1 • Surendra Kumar 1 • Payal Chaudhary 2 • V. K. Gupta 3 Received: 3 February 2015 / Accepted: 22 April 2017 / Published online: 18 May 2017 Ó The Author(s) 2017. This article is an open access publication Abstract This research work concerns with the transes- terification of castor oil with methanol to form biodiesel. As the free fatty acid content in castor oil is more than 1%, an acid catalyst namely, H 2 SO 4 has been used for esteri- fication. The experimental conditions were determined using central composite design method and the experi- ments were conducted in a 2 L working volume fully controlled reactor. The input conditions namely, catalyst concentration, methanol to oil molar ratio and temperature were varied, and % fatty acid methyl ester (FAME) content was determined. Based upon the experimental data, an ANN model has been developed which is used to predict %FAME yield for a given set of input conditions. The experimental data and the data predicted by the ANN model have been used to estimate the rate constants of a kinetic model. The ANN model predicts the % FAME yield within ±8% deviation, and the developed kinetic model shows successfully the effect of methanol to oil molar ratio on % FAME yield at 60 °C and 3% (v/v) catalyst loading. Keywords ANN Castor oil Biodiesel Parameter estimation Differential equation model Introduction Global energy consumption has been steadily increasing since the beginning of the millennium and its demand is expected to rise in the coming times. Thus, the general awareness about alternative energy sources has increased manifold, which have a lower impact on the environment as a whole [1]. Sustainable sources of energy are to be explored and used to decrease the overall dependence on available primary sources of energy (fossil fuels) [2]. In this context, biodiesel appears to be a feasible option as its usage renders a reduction of above 90% in emissions of total non-combusted hydrocarbons [3]. An excellent review has been published [4] describing various veg- etable oil feedstock sources used for producing biodiesel. Biodiesel is mostly produced from the edible sources such as sunflower [5], soybean [6], and rapeseed [7]. This practice is not favorable towards sustainability because of the fact that it is competitive with food and would increase the cost of both edible oil and biodiesel [8]. Therefore, non-edible oils are preferred for this purpose. Castor oil is one of the most promising non- edible sources for the production of biodiesel [9]. Con- ventional in situ transesterification of castor oil seeds has been performed by Hincapie et al. [10]. Several catalysts such as KOH, NaOH, KOCH 3 , HCl, etc. [11] have been tried in its transesterification with ethanol. Reduction in viscosity of castor methyl and ethyl ester blends have been studied [12]. Kinetics of this process has been investigated [13–17] by varying the alcohol to oil molar ratio as well as the temperature. In one such process [18], methanol to oil ratio was varied from 50:1 to 250:1 and temperature from 35 to 65 °C. Optimization of castor oil transesterification reaction to produce biodiesel has been reported by many authors, but optimization of & Surendra Kumar [email protected] 1 Department of Chemical Engineering, Indian Institute of Technology Roorkee, Roorkee, Uttarakhand 247667, India 2 Centre for Transportation Systems, Indian Institute of Technology Roorkee, Roorkee, Uttarakhand 247667, India 3 Department of Chemistry, Indian Institute of Technology Roorkee, Roorkee, Uttarakhand 247667, India 123 Int J Ind Chem (2017) 8:253–262 DOI 10.1007/s40090-017-0122-3
-
Upload
dinhkhuong -
Category
Documents
-
view
218 -
download
0
Transcript of Biodiesel production from castor oil: ANN modeling and ... · RESEARCH ARTICLE Biodiesel production...

RESEARCH ARTICLE
Biodiesel production from castor oil: ANN modeling and kineticparameter estimation
Atiya Banerjee1 • Devyani Varshney1 • Surendra Kumar1 • Payal Chaudhary2 •
V. K. Gupta3
Received: 3 February 2015 / Accepted: 22 April 2017 / Published online: 18 May 2017
� The Author(s) 2017. This article is an open access publication
Abstract This research work concerns with the transes-
terification of castor oil with methanol to form biodiesel.
As the free fatty acid content in castor oil is more than 1%,
an acid catalyst namely, H2SO4 has been used for esteri-
fication. The experimental conditions were determined
using central composite design method and the experi-
ments were conducted in a 2 L working volume fully
controlled reactor. The input conditions namely, catalyst
concentration, methanol to oil molar ratio and temperature
were varied, and % fatty acid methyl ester (FAME) content
was determined. Based upon the experimental data, an
ANN model has been developed which is used to predict
%FAME yield for a given set of input conditions. The
experimental data and the data predicted by the ANN
model have been used to estimate the rate constants of a
kinetic model. The ANN model predicts the % FAME yield
within ±8% deviation, and the developed kinetic model
shows successfully the effect of methanol to oil molar ratio
on % FAME yield at 60 �C and 3% (v/v) catalyst loading.
Keywords ANN � Castor oil � Biodiesel � Parameter
estimation � Differential equation model
Introduction
Global energy consumption has been steadily increasing
since the beginning of the millennium and its demand is
expected to rise in the coming times. Thus, the general
awareness about alternative energy sources has increased
manifold, which have a lower impact on the environment
as a whole [1]. Sustainable sources of energy are to be
explored and used to decrease the overall dependence on
available primary sources of energy (fossil fuels) [2]. In
this context, biodiesel appears to be a feasible option as
its usage renders a reduction of above 90% in emissions
of total non-combusted hydrocarbons [3]. An excellent
review has been published [4] describing various veg-
etable oil feedstock sources used for producing biodiesel.
Biodiesel is mostly produced from the edible sources
such as sunflower [5], soybean [6], and rapeseed [7].
This practice is not favorable towards sustainability
because of the fact that it is competitive with food and
would increase the cost of both edible oil and biodiesel
[8]. Therefore, non-edible oils are preferred for this
purpose. Castor oil is one of the most promising non-
edible sources for the production of biodiesel [9]. Con-
ventional in situ transesterification of castor oil seeds has
been performed by Hincapie et al. [10]. Several catalysts
such as KOH, NaOH, KOCH3, HCl, etc. [11] have been
tried in its transesterification with ethanol. Reduction in
viscosity of castor methyl and ethyl ester blends have
been studied [12]. Kinetics of this process has been
investigated [13–17] by varying the alcohol to oil molar
ratio as well as the temperature. In one such process
[18], methanol to oil ratio was varied from 50:1 to 250:1
and temperature from 35 to 65 �C. Optimization of
castor oil transesterification reaction to produce biodiesel
has been reported by many authors, but optimization of
& Surendra Kumar
1 Department of Chemical Engineering, Indian Institute of
Technology Roorkee, Roorkee, Uttarakhand 247667, India
2 Centre for Transportation Systems, Indian Institute of
Technology Roorkee, Roorkee, Uttarakhand 247667, India
3 Department of Chemistry, Indian Institute of Technology
Roorkee, Roorkee, Uttarakhand 247667, India
123
Int J Ind Chem (2017) 8:253–262
DOI 10.1007/s40090-017-0122-3

tranesterification reaction by the use of ANN modeling
is rare in literature. It may be concluded that these
processes have not been investigated in the presence of
an acid catalyst from the point of view of kinetic
parameter estimation. ANN modeling can be a good
approach to optimize acid catalyzed reaction for bio-
diesel production as it is time saving, and we can opti-
mize biodiesel production on the pilot scale with the
experimental data optimized by using ANN. The FFA
content in castor oil should be less than 1% for using
alkaline catalyst [19]. If the limit of FFA is exceeded,
then soap formation occurs which inhibits the suppres-
sion of ester [20]. Boucher et al. [21] used significant
(50 wt%) amount of H2SO4 associated with 10.86–93.7
methanol to FFA molar ratio for the oil–fatty acid
mixture that contained 2–15% FFAs. Heterogeneous
catalyst (sulphonated polystyrene compounds) were
employed by Soldi et al. [22] and 85% conversion of
fatty acid into methyl ester was reported at a high
methanol to oil ratio of 100:1 and reaction time of 18 h.
In the present investigation, experiments were conducted
in a lab reactor; the experimental conditions were
determined by design of experiment method for metha-
nol to oil molar ratio = 6:1–25:1; catalyst amount
(vol%) = 1–3; temperature (�C) = 40–60 �C; time
duration of experiments = 4 h.
In recent years, artificial neural networks (ANNs) have
been widely applied to a wide range of applications such as
data prediction [23], fault detection [24], data rectification
[25], process control [26], etc. It is capable of handling
even incomplete data and is effective in executing fast
predictions and even for non-linear generalizations
[27, 28]. In 2011, performance of linear and non-linear
calibration techniques were compared in predicting bio-
diesel properties from near IR spectra by Balabin et al.
[29]. Evaluation of the intensification of biodiesel pro-
duction from waste goat tallow was performed using
response surface methodology (RSM) and ANN with
appreciable modeling efficiency by Chakraborty et al. [30].
This study on castor oil transesterification in presence of
acid catalyst aims to useANN formodeling the experimental
data obtained as decided by central composite design (CCD)
and then predicting fractional formation profile of FAME at
optimized conditions, determined by RSM. Further, the
developed ANN model has been used for developing a
kinetic model and estimating its rate constants by a suit-
able parameter estimation method. Broadly, the approach
adopted here is to use the available experimental data for
ANN model representation without imposing additional
requirements on the number of process measurements. The
available experimental data and those predicted using ANN
model have been used to estimate the kinetic parameters.
Materials and methods
Materials and methods as discussed in this section have
been described in detail in the doctoral thesis of Payal [31]
which is concerned with experimental and modeling stud-
ies of castor oil transesterification.
Chemicals
Pharmaceutical grade castor oil was purchased from the
local market through the authorized standard chemical
supplier of the institute. All chemicals; H2SO4 (97%),
anhydrous methanol, sodium bisulphate (Na2SO4) were of
analytical grade and were purchased from Merck India and
used without further purification. Pure standard methyl
esters were purchased from Sigma Aldrich, USA.
Experimental setup
A lab reactor (Applikon, Schiedam, The Netherlands,
stirred type, capacity: 3 L, ez control system) was used for
conducting the reaction. The reactor was 3 L double
jacketed borosilicate glass reactor having 2 L working
volume. The temperature was regularly monitored by the
display of the system. The reflux system was used to avoid
the vaporization of methanol from the reaction system. The
temperature of the reaction system was controlled by the
circulation of water through outer wall of the reactor ves-
sel. Mechanical stirring was used for the proper mixing of
the reaction mixture in the reactor.
Experimental procedure
Initially 1 L castor oil was transferred into the reactor and
heated till it reached the desired temperature. Appropriate
quantities of both methanol and catalyst (sulphuric acid)
were mixed thoroughly at the preset temperature sepa-
rately. The above mixture of catalyst and methanol was
then transferred to the reactor where the mixing was carried
out at a speed equivalent to relative centrifugal force
(rcf) = 32.29g for the preset reaction temperature and
time 4 h. The required mixing intensity (rcf = 32.29g)
was optimized prior to conducting the experiments at
constant methanol/oil molar ratio 6:1, catalyst concentra-
tion 1% and reaction temperature of 60 �C. The samples
were taken up to 4 h regularly at the 20 min time interval
and total 12 samples were collected during this time period.
The samples were collected in 15 mL centrifuge tubes,
filled with 5 mL of distilled water. Shaking and quenching
of the samples were done immediately, and the centrifuge
tubes with the sample were kept in an ice bath immedi-
ately. The samples were washed and centrifuged at
254 Int J Ind Chem (2017) 8:253–262
123

rcf = 8949g for 20 min to separate ester layer. After
centrifuging the sample, two separate layers were formed;
the bottom one contained the glycerol and catalyst in water
phase while the upper layer is of ester.
Gas chromatography analysis
Analysis of all samples for methyl ester formation (FAME
content) was carried out using the gas chromatograph (GC)
(Nucon Gas Chromatograph, 5765, India), equipped with a
flame ionization detector (FID) and a capillary column with
dimension of 0.55 mm I.D 9 10 m length 9 0.50 m
thickness. Nitrogen was used as carrier gas. The column
temperature was kept at 170 �C for 1 min, heated at 10 �C/min up to 240 �C and then it was maintained constant. The
temperature of the injector and detector was set at 220 and
240 �C, respectively. Methyl heptadecanoate was used as
internal standard for GC. The analysis was done by
injecting 1 lL sample into the column. Every sample has
been analyzed three times for % FAME yield and the
average of three values has been taken.
Quantitative analysis of % ME was done using Euro-
pean standard EN 14103:2003. The % ME yield (or %
FAME yield) was calculated using equation
% FAME yield ¼P
A� AEI
AEI
� CEI � VEI
m� 100;
whereP
A is the total peak area from methyl esters in
C14;0–C24;1, AEI is the peak area corresponding to methyl
heptadecanoate, CEI is the concentration of the methyl
heptadecanoate solution (mg/mL), VEI is the volume of
methyl heptadecanoate solution (mL) and m is the mass of
the sample (mg).
Experimental design
Central composite design (CCD) is one of the most com-
monly used techniques for the optimization of experiments.
Transesterification of castor oil with ethanol was studied by
Cavalcante et al. [17] using a central composite rotat-
able design. Optimum reaction conditions were determined
as oil/ethanol molar ratio of 1:11, catalyst amount of 1.75%
KOH, and reaction time of 90 min and 86.32% of biodiesel
yield was obtained. To apply this design, the variation
levels for each variable must be specified clearly.
Accordingly, the variables are transformed into coded
variables bearing the following relationships [32]:
Xj ¼ ðxj � x0j Þ=Dxj; ð1Þ
x0j ¼ xmaxj þ xmin
j
� �.
2; ð2Þ
Dxj ¼ xmaxj � xmin
j
� �.
2; ð3Þ
where Xj: coded value of variable, x0j : basic level, xj: actual
value, Dxj: level of variation.Central composite design is a factorial design with center
points, augmented with a group of axial points (also called
star points). As the distance of the factorial point from the
center of the design space is defined as ±1 unit for each
factor, the distance of a star or axial point from the center of
the design is ±a with (a)[ 1. In this study, the CCD was
used to optimize three parameters (methanol/oil molar ratio,
catalyst amount, and temperature) for enhancing the %
FAME yield. In CCD, the total number of experimental
combination was 2k ? 2k ? n, where ‘k’ is the number of
independent variables and ‘n’ is the number of repetitions of
experiments at the central axis point to reduce the pure error
[16, 33]. Totally, 20 experimentswere required for this work.
Here, the run numbers 18, 19, and 20 were not considered
because the experiment was not feasible to be performed
under these conditions as either catalyst amount or temper-
ature was low [34] and 6 were repeated experiments. The
dependent variables for this study were % FAME yield, Xc
(%) and the independent variables selected were: methanol/
oil molar ratio (x1), catalyst amount (x2), and temperature
(x3). The range and levels of individual variable factor have
been given in Table 1. The experimental data of the FAME
yield for various catalyst amounts, molar ratios, and tem-
peratures have been given in Table 2a, b. These data (col-
umns A–J in Table 2a, b) have also been used to train the
neural network for the kinetic modeling of the process.
Properties of the castor oil FAME produced were also
measured and are given in Table 3 [31, 35]. Except viscosity
and water content, all other properties of the FAME were
found to be satisfactory and within standard range of values
[36]. Therefore, this biodiesel may be used for blending with
other fuels.
Table 1 Independent variables
and levels used for CCDS. no. Variables Coded symbols Range and levels
-1 0 ?1
1 Methanol/oil molar ratio x1 6 15.5 25
2 Catalyst amount (vol%) x2 1 2 3
3 Temperature (�C) x3 40 50 60
Int J Ind Chem (2017) 8:253–262 255
123

Tables 2 Experimental results
on % FAME formation with
time
S. no. Time (min) % formation of FAME, Xc
A B C D E F
1/60/25:1 1/60/6:1 3/60/25:1 3/60/6:1 1/40/25:1 1/40/6:1
(a)
1 0 0 0 0 0 0 0
2 20 7.50 13.81 31.50 16.88 5.32 5.95
3 40 9.51 21.46 40.79 20.58 6.95 7.80
4 60 12.96 24.93 47.06 24.63 8.45 9.35
5 80 16.82 28.81 54.59 26.75 12.23 10.54
6 100 21.59 31.92 59.79 29.04 13.94 12.09
7 120 32.04 35.96 63.06 31.59 16.94 15.15
8 140 36.90 39.79 67.05 37.95 18.45 18.99
9 160 40.32 41.71 69.09 44.79 20.18 21.95
10 180 46.65 42.05 71.09 48.09 22.65 24.65
11 200 53.05 44.19 73.53 50.05 26.94 26.56
12 220 62.18 46.63 75.59 52.76 28.42 28.19
13 240 72.55 48.29 76.85 55.27 31.45 29.95
S. no. Time (min) % formation of FAME, Xc
G H I J K L
3/40/25:1 3/40/6:1 2/50/15.5:1 3.68/50/15.5:1 3/45/12:1 3/60/18:1
(b)
1 0 0 0 0 0 0 0
2 20 7.23 16.28 9.93 33.45 18.41 20.50
3 40 9.59 19.15 14.56 38.56 23.95 34.16
4 60 12.81 23.92 21.72 42.69 26.49 40.15
5 80 18.12 24.56 26.92 46.44 28.85 45.96
6 100 22.42 26.65 30.59 51.56 30.91 50.55
7 120 23.59 27.05 34.49 55.69 33.18 54.72
8 140 28.65 28.53 38.95 58.91 35.39 57.86
9 160 31.95 29.75 43.65 60.08 37.98 60.98
10 180 34.03 30.07 45.96 62.15 40.18 63.85
11 200 36.95 33.05 47.56 63.95 42.59 65.97
12 220 44.15 35.84 49.62 65.67 45.19 66.89
13 240 47.36 37.71 52.25 67.89 46.15 67.56
1/60/25:1 means catalyst amount in % v/v, temperature in �C and methanol to oil molar ratio respectively
Table 3 Properties of FAME
produced from castor oilS. no. Property Determined in present study Standard value/range
Canoira et al. [36]
1 Kinematic viscosity (mm2/s at 40 �C) 18.55 3.5–5.00
2 Density (kg/m3) 920.5 860–900
3 Acid Value (mg KOH/g) 0.25 \0.50
4 Flash point (�C) 170 [120
5 Water content (%) 0.006 \0.0005 or\500 mg/kg
6 Calorific value (MJ/kg) 39.5 37.27–38.22
7 Oxidation stability at 110 �C (h) 8 [6.0
8 Sulfur content (mg/kg) 0.3 \10
256 Int J Ind Chem (2017) 8:253–262
123

Modeling of experimental observations through
ANN
ANNs are useful for the study of complex phenomena for
which we have appropriate data but a poor understanding
of the mathematical relationship between them [37]. There
are several modeling strategies in ANNs, which have var-
ious applications in designing and analyzing existing pro-
cesses. Choosing the right network architecture is one of
the most important tasks prior to the modeling process. A
feed-forward neural network architecture was selected for
the model development owing to its powerful non-linear
mapping ability between inputs and outputs [38], which
consisted of an input layer, an intermediate hidden layer
and an output layer. In a typical feed-forward network
every node in each layer is connected to all the nodes in the
following layer. The neurons in the hidden layer often
consist of sigmoidal neurons. A sigmoid function is a
bounded differentiable real function that is defined for all
real input values and has a positive derivative at each point.
Tangent sigmoid function was preferred as the activation
function in the hidden layer for all neural network
computations.
tan sigðxÞ ¼ 2=ð1þ expð�2xÞÞ � 1: ð4Þ
A total of 156 experimental datasets were used to train
(130 datasets; columns A–J in Table 2a, b) and to test (26
datasets; columns K and L in Table 2b) the performance of
the developed ANN. Each dataset includes four input
variables namely, methanol to oil molar ratio (mr), catalyst
amount (c), temperature (T) and time (t). Scaling of the
input and output variable is usually recommended [39].
Therefore, each input variable was scaled in the range {0,
1} by dividing them with their maximum values, respec-
tively, in Table 4. These scaled variables were applied to
the input neurons to carry out the ANN modeling. The
available data was distributed into three different sets for
the training method, i.e., 70% for the training set, 15% for
the validation set and remaining 15% for the test set.
The Levenberg–Marquardt algorithm works on the
principle of error-back propagation, and was used to train
the neural network [40]. Mean square error (MSE) was
chosen as the performance function for observing
deviations between experimental data and calculated data
from the network’s output layer.
For the present study, MSE was given by:
MSE ¼PN
k¼1
Xexp
k
100� Xcal
k
100
� �2,
N; ð5Þ
where N: number of datasets, Xkexp: experimental value of
the FAME percentage yield, Xkcal: calculated value of the
FAME percentage yield.
Parameter estimation
Parameter estimation has been carried out for the data
obtained experimentally and others generated by using
ANN model. Several physical and kinetic parameters
appear in the process model developed for transesterifica-
tion of castor oil. The physical parameters, like the reactor
volume and species densities were fixed based on the
process knowledge. Each kinetic parameter has a pre-ex-
ponential factor and activation energy associated with it.
The activation energies (E) have been fixed as the tem-
perature (T) and catalyst concentration was taken to be the
same for all the molar ratios.
k ¼ k0e� E
RTð Þ; ð6Þ
where k: reaction constant at given temperature (T), k0:
reaction constant at reference temperature.
Various parameter estimation techniques such as maxi-
mum likelihood estimation [41], prediction error minimiza-
tion (PEM) [42], trust-region SQP algorithm [43] etc. have
been used previously by researchers to estimate parameters of
a model. Further, Hosten and Emig [44] have developed
sequential experimental design procedures for precise
parameter estimation in ordinary differential equations. In this
work, parameter estimation technique based on a prediction
error minimization (PEM) framework has been used. A cen-
tral point in the PEM approach is to design a predictor, which
is a function that returns a predicted value of the output of the
system for given parameter values and a sequence of mea-
surements. Comparison of the predicted value with an actual
measurement gives the prediction error,whichcan be seen as a
function of the system parameters. The prediction errors are
squared and summed together. This function minimization
with respect to the parameters is a way of finding good
parameter estimates. Similar works have been performed by
Mjalli and Ibrehem [42] and Mallikarjunan et al. [45] where
they have used optimal hybrid modeling approach for poly-
merization reactors using PEM technique.
In this work, the parameters values were estimated using
MATLAB 7.6 (R2008a). The MATLAB code consisted of
optimization tool ‘fminsearch’. The differential equation
was solved symbolically using ‘dsolve’ command.
Table 4 Maximum values of input and output variables
S. no. Variables Maximum value
1 Molar ratio (–) 25:1
2 Catalyst amount (% v/v) 3.68
3 Temperature (�C) 60
4 Time (min) 240
5 FAME yield (%) 100
Int J Ind Chem (2017) 8:253–262 257
123
Xci;j ¼ gðti;j; k1; k2;CA0i ;MiÞ: ð7Þ
The function which has been minimized is as follows:
XN
i¼1
XM
j¼1
� Xci;j � gðti;j; k1; k2;CA0i ;MiÞ� �2
; ð8Þ
where Xci;j : values obtained experimentally and predicted
through ANN, M: number of data points and N: number of
molar ratios.
The function ‘fminsearch’ finds the minimum of a scalar
function of several variables, starting at an initial estimate.
This is generally referred to as unconstrained nonlinear
optimization. ‘fminsearch’ uses the simplex search method.
This is a direct searchmethod that does not require numerical
or analytic gradients. If n is the length of x, a simplex in n-
dimensional space is characterized by the n ? 1 distinct
vectors that are its vertices. In two-dimensional space, a
simplex is a triangle; in three-dimensional spaces, it is a
pyramid. At each step of the search, a new point in or near the
current simplex is generated. The function value at the new
point is comparedwith the function’s values at the vertices of
the simplex and, usually, one of the vertices corresponding to
worst value of function is replaced by the new point, giving a
new simplex. This step is repeated until the size of the sim-
plex is less than the specified tolerance [46].
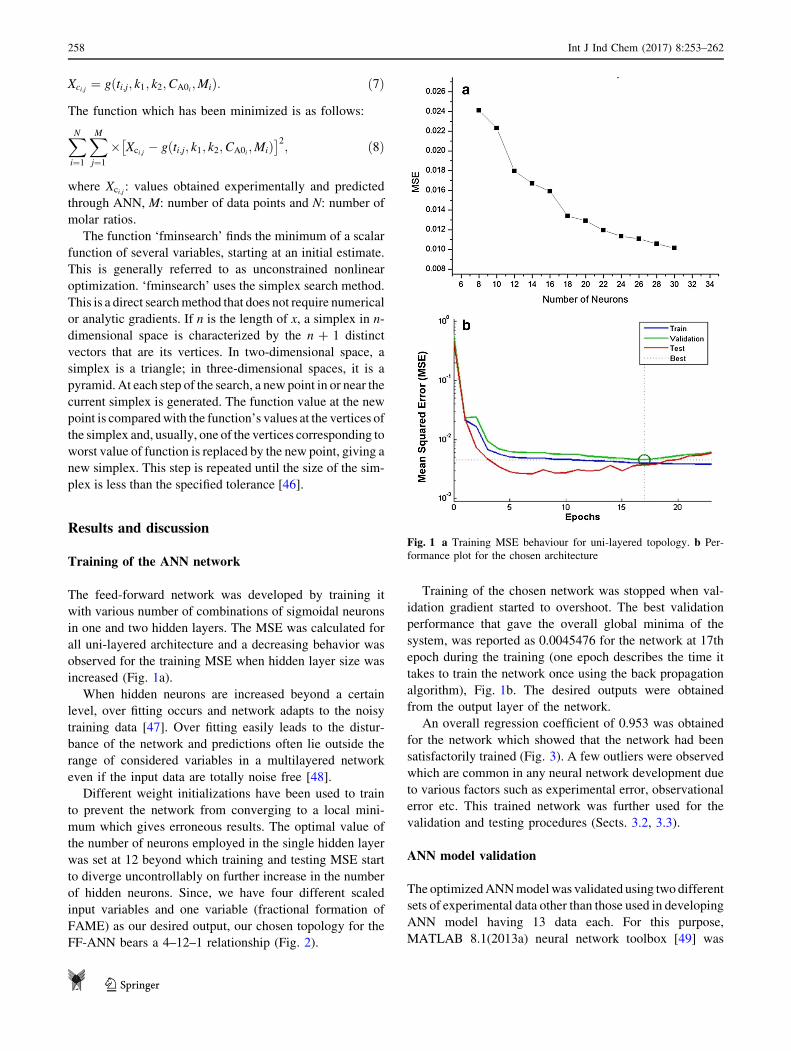
Results and discussion
Training of the ANN network
The feed-forward network was developed by training it
with various number of combinations of sigmoidal neurons
in one and two hidden layers. The MSE was calculated for
all uni-layered architecture and a decreasing behavior was
observed for the training MSE when hidden layer size was
increased (Fig. 1a).
When hidden neurons are increased beyond a certain
level, over fitting occurs and network adapts to the noisy
training data [47]. Over fitting easily leads to the distur-
bance of the network and predictions often lie outside the
range of considered variables in a multilayered network
even if the input data are totally noise free [48].
Different weight initializations have been used to train
to prevent the network from converging to a local mini-
mum which gives erroneous results. The optimal value of
the number of neurons employed in the single hidden layer
was set at 12 beyond which training and testing MSE start
to diverge uncontrollably on further increase in the number
of hidden neurons. Since, we have four different scaled
input variables and one variable (fractional formation of
FAME) as our desired output, our chosen topology for the
FF-ANN bears a 4–12–1 relationship (Fig. 2).
Training of the chosen network was stopped when val-
idation gradient started to overshoot. The best validation
performance that gave the overall global minima of the
system, was reported as 0.0045476 for the network at 17th
epoch during the training (one epoch describes the time it
takes to train the network once using the back propagation
algorithm), Fig. 1b. The desired outputs were obtained
from the output layer of the network.
An overall regression coefficient of 0.953 was obtained
for the network which showed that the network had been
satisfactorily trained (Fig. 3). A few outliers were observed
which are common in any neural network development due
to various factors such as experimental error, observational
error etc. This trained network was further used for the
validation and testing procedures (Sects. 3.2, 3.3).
ANN model validation
The optimizedANNmodelwas validated using two different
sets of experimental data other than those used in developing
ANN model having 13 data each. For this purpose,
MATLAB 8.1(2013a) neural network toolbox [49] was
Fig. 1 a Training MSE behaviour for uni-layered topology. b Per-
formance plot for the chosen architecture
258 Int J Ind Chem (2017) 8:253–262
123

employed. These additional data were obtained by con-
ducting experiments on the same lab reactor at 45 and 60 �C,respectively (columns K and L in Table 2b). Comparison
between ANN predictions and experimental data for these
two separate validation sets show that all the model predic-
tions are within±8% deviation. The three-layered FF-ANN
with 12 hidden neurons (4–12–1) was capable of predicting
the output of the process and yielded a very good approxi-
mation to the castor oil transesterification process.
From the above investigation, it may be concluded that
the network accounts well for the variation in input vari-
ables and the developed ANN model can be successfully
applied in predicting the FAME yield at conditions in the
range of considered variables.
Predictions using ANN model
The ANN model which was trained and tested against
experimental data (see Sects. 3.1, 3.2) was used to predict
FAME yields at different input datasets. It was considered
appropriate to develop a kinetic model at optimized con-
ditions, determined earlier for the lab reactor used [31].
Therefore, predictions were made using the developed
ANN model at the conditions (catalyst = 3% v/v, tem-
perature = 60 �C, time = 0–4 h) to study the effect of
molar ratio on FAME yield. Predictions for different molar
ratios 9:1, 12:1, and 15:1 are shown in Fig. 4. The results
obtained for these conditions from the ANN model have
been used in the following Sect. (3.4) to develop the
kinetic model.
Kinetic modeling
General reaction model
In the preceding section, profiles for fractional formation of
FAME with time have been obtained using developed
ANN model for methanol to oil molar ratios namely, 9:1,
Fig. 2 The 4–12–1 network
topology used for modeling
Int J Ind Chem (2017) 8:253–262 259
123

12:1, and 15:1, and experimental profiles for molar ratio
18:1 and 25:1 are already available at optimum catalyst
amount and temperature. This section concerns the devel-
opment of suitable kinetic model on the basis of these five
profiles so that effect of change in molar ratio on fractional
formation of FAME can be studied. The CA0 values cor-
responding to different molar ratios used for fitting are
given in the Table 5.
Following kinetic model was used to fit the data
obtained by ANN. The kinetic model is in general rever-
sible reaction model, in which both forward and backward
reactions are second order, first order with respect to each
of the reactants and products.
dXc=dt ¼ k1CA0ð3� XcÞðM � XcÞ � k2CA0X2c ; ð9Þ
with Xc = 0 at t = 0. Where CA0 initial concentration of
castor oil (mol/L), Xc: fractional formation of FAME, M:
molar ratio of methanol to castor oil, k1, k2: rate constants
(L min/mol).
Fig. 3 Regression plots for the
network for a training,
b validation, c test, d overall
0
0.2
0.4
0.6
0.8
1
0 50 100 150 200 250 300
Frac
tiona
l For
mat
ion
of F
AM
E
Time (min)
M = 9:1 (Predicted)
M = 12:1 (Predcited)
M = 15:1 (Predicted)
M = 18:1 (Experimental)
M = 25:1 (Experimental)
Fig. 4 ANN model predictions for intermediate molar ratios
260 Int J Ind Chem (2017) 8:253–262
123

Estimation of parameters
The values of k1 and k2 were estimated using the procedure
discussed in Sect. 2. The values estimated are
k1 = 0.000262 and k2 = 0.023178 (L min/mol), respec-
tively. The correlation coefficients and normalized % stan-
dard deviations for different molar ratios i.e. 9:1, 12:1, 15:1,
18:1 and 25:1 were obtained as (0.933453, 8.783124%),
(0.989036, 3.637967%), (0.994593, 2.760923%),
(0.983285, 4.831601%), and (0.974017, 5.589103%),
respectively. Higher values of correlation coefficient
([0.93) and lower values of normalized % standard devia-
tion (\9%) testify the goodness of fit of the kineticmodel. To
compare the accuracy of model, all the predicted values of
fractional formation of FAME, Xc Predicted, by kinetic
model, and its experimental values and generated values by
ANNmodel,Xc experimental, have been plotted in Fig. 5 for
all five molar ratios. From this figure, it is obvious that most
of the predictions lie within ±10% deviation.
Conclusion
In this researchwork, experiments have been conducted at 12
sets of operating conditions. A FF-ANNmodel (4–12–1) has
been developed on the basis of these data. The model is
capable of predicting fractional formation of FAME (Xc) at
other operating conditions. In this work, Xc have been
computed using the developed ANN model at 9:1, 12:1 and
15:1 methanol to oil molar ratio at 60 �C and 3% catalyst
loading. Further, a kinetic model has also been developed
using the experimental and computed data at 60 �C and 3%
catalyst loading. The kinetic model considers the transes-
terification reaction to be a second order reversible, first
order with respect to each of the reactants and products, and
is applicable to methanol to oil molar ratios varying between
9:1 and 25:1. Estimated values of kinetic constants k1 and k2are 0.000262 and 0.023178 L min/mol, respectively.
Acknowledgements Authors are grateful to the Ministry of Human
Resource Development (MHRD), Government of India, New Delhi
for providing the financial assistance during the course of this
research work.
Open Access This article is distributed under the terms of the
Creative Commons Attribution 4.0 International License (http://crea
tivecommons.org/licenses/by/4.0/), which permits unrestricted use,
distribution, and reproduction in any medium, provided you give
appropriate credit to the original author(s) and the source, provide a
link to the Creative Commons license, and indicate if changes were
made.
References
1. Oliveira FCC, Brandao CRR, Ramalho HF, da Costa LAF,
Suarez PAZ, Rubim JC (2007) Adulteration of diesel/biodiesel
blends by vegetable oil as determined by Fourier transform (FT)
near infrared spectrometry and FT-Raman spectroscopy. Anal
Chim Acta 587:194–199
2. Baptista P, Felizardo P, Menezes JC, Correia MJN (2008) Mul-
tivariate near infrared spectroscopy models for predicting the
iodine value, CFPP, kinematic viscosity at 40 C and density at 15
C of biodiesel. Talanta 77:144–151
3. Knothe G, Sharp CA, Ryan TW (2006) Exhaust emissions of
biodiesel, petrodiesel, neat methyl esters, and alkanes in a new
technology engine. Energy Fuel 20:403–408
4. Leung DYC, Wu X, Leung MKH (2010) A review on biodiesel
production using catalyzed transesterification. Appl Energy
87:1083–1095
5. Porte AF, CdS Schneider Rd, Kaercher JA, Klamt RA, Schmatz
WL, da Silva WLT (2010) Sunflower biodiesel production and
application in family farms in Brazil. Fuel 89:3718–3724
6. Gomes MCS, Arroyo PA, Pereira NC (2011) Biodiesel produc-
tion from degummed soybean oil and glycerol removal using
ceramic membrane. J Membr Sci 378:453–4561
7. Xin J, Imahara H, Saka S (2008) Oxidation stability of biodiesel
fuel as prepared by supercritical methanol. Fuel 87:1807–1813
8. Kansedo J, Lee KT, Bhatia S (2009) Cerbera odollam (sea
mango) oil as a promising non-edible feedstock for biodiesel
production. Fuel 88:1148–1150
9. Berman P, Nizri S, Wiesman Z (2011) Castor oil biodiesel and its
blends as alternative fuel. Biomass Bioenergy 35:2861–2866
10. Hincapie H, Mondragon F, Lopez D (2011) Conventional and
in situ transesterification of castor seed oil for biodiesel produc-
tion. Fuel 90:1618–1623
11. Meneghetti SMP, Meneghetti MR, Wolf CR, Silva EC, Lima
GES, Coimbra MDA, Soletti JI, Carvalho SHV (2006)
Table 5 CA0 values corresponding to different molar ratios
S. no. Molar ratio (M) CA0 (gmol/L) Catalyst (vol%/vol)
1 9:1 0.733668 3%
2 12:1 0.67393 3%
3 15:1 0.622769 3%
4 18:1 0.57927 3%
5 25:1 0.49771 3%
0
0.1
0.2
0.3
0.4
0.5
0.6
0.7
0.8
0 0.1 0.2 0.3 0.4 0.5 0.6 0.7 0.8
X cPr
edic
ted
Xc Experimental
mr 9:1 (Predicted)
mr 12:1 (predicted)
mr 15:1 (predicted)
mr 18:1 (experimental)
mr 25:1 (experimental)
+10%
-10%
Fig. 5 Comparison of Xc predicted by kinetic model with Xc
experimental
Int J Ind Chem (2017) 8:253–262 261
123

Ethanolysis of castor and cottonseed oil: a systematic study using
classical catalysts. JAOCS 83:819–822
12. Thomas TP, Birney DM, Auld DL (2012) Viscosity reduction of
castor oil esters by the addition of diesel, safflower oil esters and
additives. Ind Crops Prod 36:267–270
13. Pradhan S, Madankar CS, Mohanty P, Naik SN (2012) Opti-
mization of reactive extraction of castor seed to produce biodiesel
using response surface methodology. Fuel 97:848–855
14. Ramezani K, Rowshanzamir S, Eikani MH (2010) Castor oil
transesterification reaction: a kinetic study and optimization of
parameters. Energy 34:4142–4148
15. Lopez JM, Garcia Cota TDNJ, Monterrosas EEGR, Martineza N,
de la Cruz Gonzalez VM, Flores JLA, Ortega YR (2011) Kinetic
study by 1H nuclear magnetic resonance spectroscopy for bio-
diesel production from castor oil. Chem Eng J 178:391–397
16. Jeong GT, Park DH (2009) Optimization of biodiesel production
from castor oil using response surface methodology. Appl Bio-
chem Biotechnol 156:431–441
17. Cavalcante KSB, Penha MNC, Mendonca KKM, Louzeiro HC,
Vasconcelos ACS, Maciel AP, de Souza AG, Silva FC (2010)
Optimization of transesterification of castor oil with ethanol using
a central composite rotatable design (CCRD). Fuel 89:1172–1176
18. Madankar CS, Pradhan S, Naik SN (2013) Parametric study of
reactive extraction of castor seed (Ricinus communis L.) for
methyl ester production and its potential use as bio lubricant. Ind
Crops Prod 43:283–290
19. Tiwari AK, Kumar A, Raheman H (2007) Biodiesel production
from jatropha oil (Jatropha curcas) with high free fatty acids: an
optimized process. Biomass Bioenergy 31:569–575
20. Canakci M, Gerpen JV (2001) Biodiesel production from oils and
fats with high free fatty acids. Trans ASAE 44:1429–1436
21. Boucher MB, Unker SA, Hawley KR, Wilhite BA, Stuart JD,
Parnas RS (2008) Variables affecting homogeneous acid catalyst
recoverability and reuse after esterification of concentrated
omega-9 polyunsaturated fatty acids in vegetable oil triglyc-
erides. Green Chem 10:1331–1336
22. Soldi RA, Oliveira ARS, Ramos LP, Cesar-Oliveira MAF (2009)
Soybean oil and beef tallow alcoholysis by acid heterogeneous
catalysis. Appl Catal A Gen 361:42–48
23. Barton R (1995) Analysis and rectification of data from dynamic
chemical processes via artificial neural networks. Ph. D Disser-
tation, The University of Texas at Austin, Austin, Texas
24. Suewatanakal W (1993) A comparison of fault detection and
classification using ANN with traditional methods. Ph. D. Dis-
sertation, The University of Texas at Austin, Austin, Texas
25. Karjala TW (1995) Dynamic data rectification via recurrent
neural networks. Ph. D Dissertation, The University of Texas at
Austin, Austin, Texas
26. MacMurray JC(1993) Modelling and control of a packed distil-
lation column using artificial neural networks. M.S. Thesis, The
University of Texas at Austin, Austin, Texas
27. Rajendra M, Jena PC, Raheman H (2009) Prediction of optimized
pretreatment process parameters for biodiesel production using
ANN and GA. Fuel 88:868–875
28. Daponte P, Grimaldi D (1998) Artificial neural networks in
measurements. Measurement 23:93–115
29. Balabin RM, Lomakina EI, Safieva RZ (2011) Neural network
(ANN) approach to biodiesel analysis: analysis of biodiesel
density, kinematic viscosity, methanol and water contents using
near infrared (NIR) spectroscopy. Fuel 90:2007–2015
30. Chakraborty R, Sahu H (2013) Intensification of biodiesel pro-
duction from waste goat tallow using infrared radiation: process
evaluation through response surface methodology and artificial
neural network. Appl Energy 114:827–836
31. Payal PhD (2014) Thesis on castor oil transesterification: exper-
imental and modelling studies. Indian Institute of Technology
Roorkee, Roorkee
32. Lazıc ZR (2004) Design of experiments in chemical engineering.
Wiley, Oxford
33. Yuan X, Liu J, Zeng G, Shi J, Tong J, Hunag G (2008) Opti-
mization of conversion of waste rapeseed oil with high FFA to
biodiesel using response surface methodology. Renew Energy
33:1678–1684
34. Kilic M, Uzun BB, Putun E, Putun AE (2013) Optimization of
biodiesel production from castor oil using factorial design. Fuel
Process Technol 111:105–110
35. Chaudhary P, Kumar B, Kumar S, Gupta VK (2015) Transes-
terification of castor oil with methanol—kinetic modeling. Chem
Prod Process Model 10(2):71–80
36. Canoira L, Galean JG, Alcantara R, Lapuerta M, Contreras RG
(2010) Fatty acid methyl esters (FAMEs) from castor oil: pro-
duction process assessment and synergistic effects in its proper-
ties. Renew Energy 35:208–217
37. Gorr WL, Nagin D, Szczypula J (1994) Comparative study of
artificial neural network and statistical models for predicting
student grade point averages. Int J Forecast 10:17–34
38. Haykin S, Networks Neural (1999) A comprehensive foundation,
2nd edn. Prentice-Hall, Upper Saddle River
39. Hojjat H, Etemad SG, Bagheri R, Thibault J (2011) Thermal con-
ductivity of non-Newtonian nanofluids: experimental data and mod-
eling using neural network. Int J Heat Mass Transf 54:1017–1023
40. HaganMT,MenhajM (1994) Training feed forward networks with
the Marquardt algorithm. IEEE Trans Neural Netw 5:989–993
41. Bindish R, Rawlings JB (2003) Parameter estimation for indus-
trial polymerization processes. AIChE J 49:2071–2078
42. Mjalli FS, Ibrehem AS (2011) Optimal hybrid modelling
approach for polymerization reactors using parameter estimation
techniques. Chem Eng Res Des 89:1078–1087
43. Arora N, Biegler LT (2004) Parameter estimation for a poly-
merization reactor model with a composite-step trust-region NLP
algorithm. Ind Eng Chem Res 43:3616–3631
44. Hosten LH, Emig G (1975) Sequential experimental design
procedures for precise parameter estimation in ordinary differ-
ential equations. Chem Eng Sci 30:1357–1364
45. Mallikarjunan V, Pushpavanam S, Immanuel CD (2010) Param-
eter estimation strategies in batch emulsion polymerization.
Chem Eng Sci 65:4967–4982
46. Lagarias JC, Reeds JA, Wright MH, Wright PE (1998) Conver-
gence properties of the Nelder–Mead simplex method in low
dimensions. SIAM J Optim 9(1):112–147
47. Cavas L, Karabay Z, Alyuruk H, Dogan H, Demir GK (2011)
Thomas and artificial network models for the fixed-bed adsorp-
tion of methylene blue by a beach waste Posidonia oceanic (L.)
dead leaves. Chem Eng J 171:557–562
48. Himmelblau DM (2008) Accounts of experiences in the appli-
cation of artificial neural networks in chemical engineering. Ind
Eng Chem Res 47:5782–5796
49. Beale M, Hagan M, Demuth H (2013) MATLAB Neural network
toolbox user’s guide (R2013A)
262 Int J Ind Chem (2017) 8:253–262
123


![Biodiesel Production from Castor Seeds by Reactive ...ijiset.com/v1s6/IJISET_V1_I6_50.pdf · Biodiesel Production from Castor Seeds by ... waste cooking oil [8] ... evaluatethe experimental](https://static.fdocuments.us/doc/165x107/5af442397f8b9ae9488bcdfb/biodiesel-production-from-castor-seeds-by-reactive-production-from-castor-seeds.jpg)