Bioconductor Packages for Pre-processing DNA Microarray Data affy and marray Sandrine Dudoit, Robert...
42
Bioconductor Packages for Pre-processing DNA Microarray Data affy and marray Sandrine Dudoit, Robert Gentleman, Rafael Irizarry, and Yee Hwa Yang Bioconductor Short Course Winter 2002 © Copyright 2002, all rights reserved
-
Upload
dayna-lawson -
Category
Documents
-
view
217 -
download
0
Transcript of Bioconductor Packages for Pre-processing DNA Microarray Data affy and marray Sandrine Dudoit, Robert...

Bioconductor Packages for Pre-processing DNA
Microarray Dataaffy and marray
Sandrine Dudoit, Robert Gentleman, Rafael Irizarry, and Yee Hwa Yang
Bioconductor Short CourseWinter 2002
© Copyright 2002, all rights reserved

Biological question
Testing
Biological verification and interpretation
Microarray experiment
Estimation
Experimental design
Image analysis
Normalization
Clustering Prediction
Expression quantification Pre-processing
Analysis

Pre-processing
• affy: Affymetrix oligonucleotide chips• marray: Spotted DNA microarrays
Reading in intensity data, diagnostic plots, normalization, expression measures.
Both suites of packages start with very different data types, but produce similar objects of class exprSet.
One can then use other Bioconductor packages, e.g., genefilter, geneplotter.

Pre-processing: spotted DNA microarrays

marray: Pre-processing spotted DNA microarray data
• marrayClasses: – class definitions for cDNA microarray data (MIAME);– basic methods for manipulating microarray objects: printing,
plotting, subsetting, class conversions, etc.
• marrayInput: – reading in intensity data and textual data describing probes and
targets;– automatic generation of microarray data objects;– widgets for point & click interface.
• marrayPlots: diagnostic plots.
• marrayNorm: robust adaptive location and scale normalization procedures.

marrayLayout class
maNspots
maNgr maNgc
maNsr maNsc
maSub
maPlate
maControls
maNotes
Array layout parameters
Total number of spots
Dimensions of spot matrices
Dimensions of grid matrix
Current subset of spots
Plate IDs for each spot
Control status labels for each spot
Any notes

marrayRaw class
maRf
maW
maRb maGb
maGf
Pre-normalization intensity data for a batch of arrays
Matrix of red and green foreground intensities
Matrix of red and green background intensities
Matrix of spot quality weights
maNotes
maGnames
maTargets
maLayout Array layout parameters - marrayLayout
Description of spotted probe sequences- marrayInfo
Description of target samples - marrayInfo
Any notes

marrayNorm class
maA
maW
maMloc maMscale
maM
Post-normalization intensity data for a batch of arrays
Matrix of normalized intensity log-ratios, M
Matrix of location and scale normalization values
Matrix of spot quality weights
maNotes
maGnames
maTargets
maLayout Array layout parameters - marrayLayout
Description of spotted probe sequences - marrayInfoDescription of target samples - marrayInfo
Any notes
Matrix of average log-intensities, A
maNormCall Function call

marrayInput package
• marrayInput provides functions for reading microarray data into R and creating microarray objects of class marrayLayout, marrayInfo, and marrayRaw.
• Input– Image quantitation data, i.e., output files from
image analysis software.
E.g. .gpr for GenePix, .spot for Spot. – Textual description of probe sequences and target
samples.
E.g. gal files, god lists.
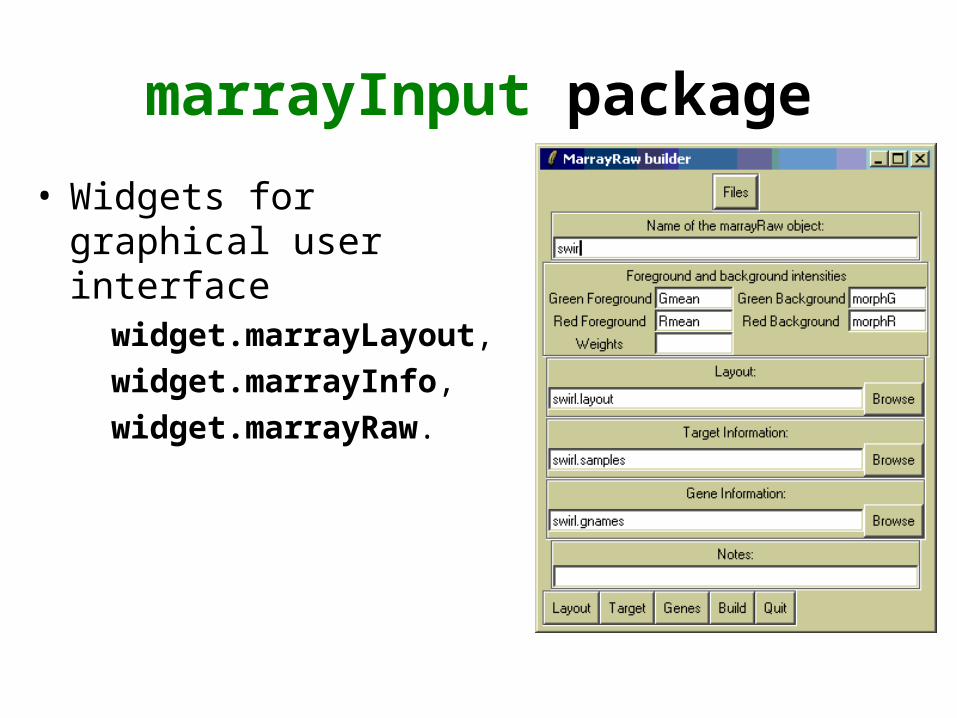
marrayInput package
• Widgets for graphical user interface
widget.marrayLayout,
widget.marrayInfo,
widget.marrayRaw.

marrayPlots package
• See demo(marrayPlots).• Diagnostic plots of spot statistics.
E.g. red and green log intensities, intensity log ratios M, average log intensities A, spot area.– maImage: 2D spatial color images. – maBoxplot: boxplots.– maPlot: scatter-plots with fitted curves and text
highlighted.
• Stratify plots according to layout parameters such as print-tip-group, plate.E.g. MA-plots with loess fits by print-tip-group.

2D spatial imagesmaImage
Cy3 background intensity Cy5 background intensity

Boxplots by print-tip-groupmaBoxplot
Intensity log ratio, M

MA-plot by print-tip-groupmaPlot
Intensity log ratio, M
Average log intensity, A
M = log2R - log2G, A = (log2R + log2G)/2

marrayNorm package• maNormMain: main normalization function, allows
robust adaptive location and scale normalization for a batch of arrays– intensity or A-dependent location normalization
(maNormLoess);– 2D spatial location normalization (maNorm2D);– median location normalization (maNormMed);– scale normalization using MAD (maNormMAD);– composite normalization;– your own normalization function.
• maNorm: simple wrapper function. maNormScale: simple wrapper function for scale normalization.

marrayNorm package
maNorm maNormMainmaNormScale
Class marrayRaw or marrayNorm
marrayNorm
exprSet
as(swirl.norm, "exprSet")
Save data to file using write.exprs or continue analysis using other Bioconductor packages

swirl dataset• Microrrays:
– 8,448 probes (768 controls);– 4 x 4 grid matrix; – 22 x 24 spot matrices.
• 4 hybridizations: swirl mutant and wild type mRNA• Data stored in object of class marrayRaw: data(swirl).• > maInfo(maTargets(swirl))[,3:4]experiment Cy3 experiment Cy51 swirl wild type2 wild type swirl3 swirl wild type4 wild type swirl

Oligonucleotide chips

Probe-pair set
Terminology• Each gene or portion of a gene is represented by 16 to 20
oligonucleotides of 25 base-pairs.
• Probe: an oligonucleotide of 25 base-pairs, i.e., a 25-mer.• Perfect match (PM): A 25-mer complementary to a reference
sequence of interest (e.g., part of a gene).• Mismatch (MM): same as PM but with a single homomeric base
change for the middle (13th) base (transversion purine <-> pyrimidine, G <->C, A <->T) .
• Probe-pair: a (PM,MM) pair.• Probe-pair set: a collection of probe-pairs (16 to 20) related to a
common gene or fraction of a gene. • Affy ID: an identifier for a probe-pair set.• The purpose of the MM probe design is to measure non-specific
binding and background noise.

Affymetrix files
• Main software from Affymetrix company MicroArray Suite - MAS, now version 5.
• DAT file: Image file, ~10^7 pixels, ~50 MB.• CEL file: Cell intensity file, probe level PM
and MM values.• CDF file: Chip Description File. Describes
which probes go in which probe sets and the location of probe-pair sets (genes, gene fragments, ESTs).

affy: Pre-processing Affymetrix data
• Class definitions for probe-level data: AffyBatch, ProbSet, Cdf, Cel.
• Basic methods for manipulating microarray objects: printing, plotting, subsetting.
• Functions and widgets for data input from CEL and CDF files, and automatic generation of microarray data objects.
• Diagnostic plots: 2D spatial images, density plots, boxplots, MA-plots, etc.

affy: Pre-processing Affymetrix data
• Background estimation.• Probe-level normalization: quantile and curve-
fitting normalization (Bolstad et al., 2002).• Expression measures: MAS 4.0 AvDiff, MAS 5.0
Signal, MBEI (Li & Wong, 2001), RMA (Irizarry et al., 2003).
• Main functions: ReadAffy, rma, expresso, express.

affy classes: AffyBatch
cdfName
exprs
nrow ncol
Probe-level intensity data for a batch of arrays (same CDF)
Dimensions of the array
Matrices of probe-level intensities and SEsrows probes, cols arrays.
Name of CDF file for arrays in the batch
se.exprs
description
annotation
phenoData
Any notes
Sample level covariates, instance of class phenoData
Name of annotation data
MIAME information
notes

affy classes
• ProbeSet: PM, MM intensities for individual probe sets.– pm: matrix of PM intensities for individual probe sets,
rows probes, cols arrays. – mm: matrix of MM intensities for individual probe sets,
rows probes, cols arrays.
Apply probeset to AffyBatch object to get list of ProbeSet objects.
• Cel: Single array cel intensity data.• Cdf: Information contained in a CDF file.
CDF data packages
• Data packages containing necessary CDF information are available at www.bioconductor.org.
• Packages contain environment objects, which provide mappings between AffyIDs and matrices of probe locations,rows probe-pairs, cols PM, MM (e.g., 20X2 matrix for hu6800).
• cdfName slot of AffyBatch.• HGU95Av2 and HGU133A provided in package.

Reading in data: ReadAffy
Creates object of class AffyBatch

Accessing PM and MM data
• probeNames: method for accessing AffyIDs corresponding to individual probes.
• pm, mm: methods for accessing probe-level PM and MM intensities probes x arrays matrix.
• Can use on AffyBatch objects.
Diagnostic plots
• See demo(affy).• Diagnostic plots of probe-level intensities, PM
and MM.– image: 2D spatial color images of log intensities
(AffyBatch, Cel).– boxplot: boxplots of log intensities
(AffyBatch).– mva.pairs: scatter-plots with fitted curves (apply exprs, pm, or mm to AffyBatch object).
– hist: density plots of log intensities (AffyBatch).

image

hist
hist(Dilution,col=1:4,type="l",lty=1,lwd=3)

boxplot
boxplot(Dilution,col=1:4)

mva.pairs

Expression measures
• expresso: Choice of common methods for – background correction: bgcorrect.methods– normalization: normalize.AffyBatch.methods– probe specific corrections: pmcorrect.methods– expression measures: express.summary.stat.methods.
• rma: Fast implementation of RMA (Irizarry et al., 2003): model-based background correction, quantile normalization, median polish expression measures.
• express: Implementing your own expression measures.• normalize: Normalization procedures in normalize.AffyBatch.methods or normalize.methods(object).

Expression meassures: expresso
expresso(widget=TRUE)

affy package
rma expressoexpress
AffyBatch
exprSet
Save data to file using write.exprs or continue analysis using other Bioconductor packages

Probe sequence analysis
• Examine probe intensity based on location relative to 5’ end of RNA sequence of interest.
• Expect probe intensities to be lower at 5’ end compared to 3’ of mRNA.
• E.g.
deg<-AffyRNAdeg(Dilution)
plotAffyRNAdeg(deg)

Dilution dataset
• HGU95A chip• 4 arrays: Human liver mRNA
– 2 concentrations: 10 and 20 g;– 2 scanners: 1 and 2.
• Data stored in object of class AffyBatch: data(Dilution).
• > pData(Dilution) liver sn19 scanner
20A 20 0 120B 20 0 210A 10 0 110B 10 0 2

Combining data across slides
Genes
Arrays
M = log2( Red intensity / Green intensity)expression measure, e.g, RMA
0.46 0.30 0.80 1.51 0.90...
-0.10 0.49 0.24 0.06 0.46...
0.15 0.74 0.04 0.10 0.20...
-0.45 -1.03 -0.79 -0.56 -0.32...
-0.06 1.06 1.35 1.09 -1.09...
… … … … …
Data on G genes for n hybridizations
Array1 Array2 Array3 Array4 Array5 …
Gene2Gene1
Gene3
Gene5Gene4
G x n genes-by-arrays data matrix
…

Combining data across slides
D
F
BA
C
E
… but columns have structureHow can we design experiments and combine data across slides to provide accurate estimates of the effects of interest?
Experimental designRegression analysis

exprSet class
description
annotation
phenoData
Any notes
Matrix of expression measures, genes x samples
Matrix of SEs for expression measures
Sample level covariates, instance of class phenoData
Name of annotation data
MIAME information
se.exprs
exprs
notes

Reading in phenoData
tkMIAMEtkphenoData
tkSampleNames