Biocon Annual Report 2016 for web t after tax (PAT) for the year stood at ` 8,088 mn up 124% from FY...
139
Annual Report 2016 Credibly Capable
Transcript of Biocon Annual Report 2016 for web t after tax (PAT) for the year stood at ` 8,088 mn up 124% from FY...

Annual Report 2016
CrediblyCapable
Financial Report
99 Board’s Report
126 Management Discussion & Analysis
138 Corporate Governance Report
151 Financial IGAAP Standalone
190 Biocon Limited & Subsidiaries

(This space has been intentionally left blank)

Financial Report
BIOCON LIMITED
Board’s Report
Dear Shareholders,
We present you the Thirty-Eighth Annual Report on business and operations along with the audited financial statements and the auditor’s report of your Company for
the financial year ended March 31, 2016.
Financial Highlights
In ` Million (except EPS)
Standalone Results Consolidated Results
FY 16 FY 15 FY 16 FY 15
Revenue 25,077 23,907 35,699 31,429
Expenses 20,162 19,406 29,179 26,239
Profit before tax and exceptional items 4,915 4,501 6,520 5,190
Exceptional Items, net 5,230 (218) 5,754 1,051
Income Tax 2,057 671 2,569 957
Minority Interest - - 744 310
Profit after Tax 8,088 3,612 8,961 4,974
Earnings per Share (EPS) before exceptional item (`) 19.61 19.15 21.86 20.11
Earnings per Share (EPS) after exceptional item (`) 40.44 18.06 44.81 24.87
Standalone and Consolidated Financial Statements
The financial statements have been prepared in accordance with generally accepted accounting principles in India (Indian GAAP). These financial statements comply in
all material respects with the Accounting Standards notified under section 133 of the Companies Act 2013 (“the Act”) read together with paragraph 7 of the Companies
(Accounts) Rules, 2014, to reflect the financial position and results of operations of Biocon together with its subsidiaries and associate. The financial statements of FY16
together with Auditor’s report forms part of this Annual Report.
Further, a statement containing the salient features of the financial statements of our subsidiaries pursuant to subsection 3 of Section 129 of the Companies Act, 2013
in the prescribed Form AOC-1 is appended as Annexure 1 to the Board’s report. The statement also provides the details of performance and financial positions of each
of the subsidiaries.
Performance Overview
The highlights of the Company’s standalone performance are as under:
Revenue from operations grew by 4% to ` 23,236 mn. Other Income for FY 16 grew to ` 1,841 mn (FY 15 ` 1,491 mn) due to foreign exchange gain on account of
rupee depreciation. Interest on fixed deposits and dividend on mutual funds increased by ` 364 mn, which was offset by lower dividend from subsidiaries (FY16
` 487mn vs FY15 ` 997mn).
Core operating margins (EBIDTA excluding R&D, Forex, and dividend from subsidiaries) improved by 100 basis points from previous year due to favourable product
mix.
Exceptional items
o During the current year, the Company recorded gain from sale of equity shares of Syngene through an IPO, net of related expenses and cost of equity shares,
amounting to ` 5,131 mn. The tax impact on this gain was ` 1,042 mn.
o During the year, Company recorded gain of ` 99 mn on sale of its equity investment in Biocon SDN. BHD. to its wholly owned subsidiary Biocon Biologics Limited.
Tax on such gain was ` 21 mn.
Biocon Limited
99

Profit after tax (PAT) for the year stood at ` 8,088 mn up 124% from FY 15. PAT excluding exceptional income, net of tax, was ` 3,921 mn, (FY 15 ` 3,830 mn).
Effective tax rate for the year was 20% due to minimum alternate tax (MAT) on exceptional income.
During the year, our consolidated revenues registered a growth of 14% to ̀ 35,699 mn from ̀ 31,429 mn in FY 15. From a segment perspective, the core biopharmaceutical
segment recorded a growth of 7% while the research services business registered a year on year increase of 29%. While, business challenges in branded formulations saw
modest growth in the biopharmaceutical segment, the performance in the research services segment was driven by strong orders and capacity expansion.
Consolidated PAT grew by 80% from ` 4,974 mn to ` 8,961 mn primarily on account of exceptional gain on sale of shares in Syngene through an offer for sale (IPO) and
release of amounts from deferred balances which are explained in detail under the section Management Discussion and Analysis.
A detailed performance analysis is provided in the Management Discussion and Analysis segment which is annexed to this report.
Appropriations
Dividend
On March 11, 2016, the Board of Directors announced an interim dividend of 5.0 (100%) per equity share for FY16, entailing a pay-out of ` 1,107 mn (including dividend
distribution tax). The Interim dividend has been subsequently paid to all eligible shareholders and no further dividends are proposed/recommended by the Board.
Transfer of Unpaid and Unclaimed Amounts to IEPF
Pursuant to the provisions of Section 205C of the Companies Act, 1956 and Section 124(5) of the Companies Act, 2013, dividend which remains unpaid or unclaimed
for a period of seven years from the date of its transfer to unpaid dividend account is required to be transferred by the Company to Investor Education and Protection
Fund (IEPF), established by the Central Government under the provisions of Section 125 of the Companies Act, 2013. The details of any unpaid dividend amounts as per
Section 125(2) of the Companies Act, 2013 have to be identified and uploaded on the website of the Company. Accordingly, unclaimed dividends up to the financial
year 2007-08 have been transferred to IEPF by the Company.
Employee Stock Option Plan (ESOP)
The Company has an Employee Stock Option Plan (‘ESOP’) which is administered by the Nomination & Remuneration Committee for the benefit of employees of the
Group, through Biocon India Limited Employees Welfare Trust (‘Trust’). The details of stock options granted and outstanding are provided in Annexure 2 to the Board’s
Report.
There is no material change in the Employee Stock Option Schemes during the financial year under review and Employee Stock Option Schemes are in compliance with
Securities and Exchange Board of India (Share Based Employee Benefits) Regulation 2014.
The Company propose to roll out new grants under ESOP plan – Grant IX for the eligible new joiners and Grant X for the eligible existing employees and proposes to
discontinue future grants under existing Grants.
Deposits
The Company has not accepted any fixed deposits from public.
Loans, Guarantees or Investments
Loans, guarantees and investments covered under Section 186 of the Companies Act, 2013 form part of the notes to the financial statements.
Subsidiaries
The Company has formulated a policy for determining ‘material’ subsidiaries pursuant to the provisions of the Listing Agreement. The said policy is available at the
Company website http://www.biocon.com/docs/PolicyDocument_MaterialSubsidiary.pdf
The Company has 8 subsidiaries and 2 step down subsidiaries as on March 31, 2016. Biocon FZ-LLC, a wholly owned subsidiary was incorporated on June 16, 2015 in
Dubai. Biocon Biologics Limited, a wholly owned subsidiary was incorporated on March 2, 2016 in the United Kingdom. Biocon Pharma Inc, was incorporated on July 27,
2015 in the United States of America as a wholly owned subsidiary of Biocon Pharma Limited.
A report on the performance and financial position of each of the subsidiaries is presented below. The financial statements of the subsidiaries will be made available on
the website of the Company, post approval by the members.
Syngene International Limited
Syngene International Limited (“Syngene”) is one of India’s leading contract research organisations offering a suite of integrated, end-to-end discovery and development
services for novel molecular entities (NMEs) across industrial sectors including pharmaceutical, biopharmaceutical, and biotechnology amongst others. Syngene helps
its clients in conducting discovery (from hit to candidate selection), development (including pre-clinical and clinical studies, analytical and bio-analytical evaluation,
formulation development and stability studies) and pilot manufacturing (scale-up, pre-clinical and clinical supplies) each with distinctive economic advantage. Unlike
the traditional business models, these services are offered through flexible business models ranging from a full-time equivalent (“FTE”) to a fee-for-service (“FFS”) model
or a combination customized on the client’s specific requirement.
During the year ended March 31, 2016, Syngene registered a revenue growth of 28% to ` 11,131 mn in FY 16 (FY 15 ` 8,716 mn). EBIDTA margin for the year was 33%,
with the operational margin at ` 3,639 mn (FY 15 ` 2,928 mn), a growth of 24%.
On August 11, 2015 Syngene’s shares were listed on the NSE and the BSE after a successful Initial Public Offering (IPO) through an offer for sale by the Company.
Biocon Research Limited
Biocon Research Limited (BRL), a 100% subsidiary of the Company, undertakes discovery and development research work in biologics and provides scientific support
for various development programmes of the group.
BRL’s current business is largely directed towards the R&D services for Monoclonal antibody molecules and Proteins (mAbs), insulin Tregopil (formally referred to as IN-
105) and other insulin products on behalf of other group companies. The research programs undertaken by BRL have made significant inroads to the next level of global
clinical trials. During the year, BRL licensed the ex-India development and commercialisation rights of its existing mAbs portfolio to Biocon Biologics Limited (‘BUK’). BRL
continues to hold 0.93% shareholding in Syngene.
During FY16, BRL registered a turnover of ` 4,097 mn, which includes licensing of development and commercialisation rights of mAbs to BUK for a consideration of
` 2,820 mn and reported a net profit of ` 669 mn.

Financial Report
Biocon Pharma Limited
Biocon Pharma Limited (“BPL”) is a wholly owned subsidiary of the Company. BPL would be engaged in the development and manufacture of generic formulations for
sale in global markets, especially opportunities in US/EU. BPL is in the process of setting up its formulations manufacturing facility for oral solid dosages at Biocon SEZ,
Bengaluru. As at March 31, 2016, BPL had not commenced commercial operations.
Biocon Academy
Biocon Academy spearheads Biocon’s CSR initiatives in the technical/professional education segment. The academy was established as a Centre of Excellence for
Advanced Learning in Biosciences in 2014. Biocon Academy leverages rich industry experience of Biocon and subject matter expertise of international Education Partners
such as Keck Graduate Institute of Claremont, California (USA). The academy is dedicated exclusively to industry oriented biosciences education. The programs offered by
the academy aim to empower the Biotechnology and Engineering graduates with advanced learning and industrial proficiency through job-skills development essential
to build a promising career in the Biotech industry.
Biocon SA
Biocon SA, a wholly owned subsidiary of the Company, is primarily engaged in the business of development and commercialization of generic recombinant human
insulin and its analogues for global markets under various internal as well as partnered programs. Biocon SA also holds the marketing rights for the group’s insulin portfolio.
Biocon SA is also in the business of identifying and developing other novel molecules into commercial products or licensable assets through strategic partnerships.
For the current year, Biocon SA registered net profit of ` 1,229 mn after exceptional items. Net profit excluding exceptional items grew to ` 43 mn (FY 15 Net loss of
` 124 mn), due to higher licensing revenues.
Exceptional item comprises of
(a) an amount of ` 2,561 mn released from deferred balance pursuant to contract with Laboratories PiSA S.A. de C.V (PiSA) of Mexico for the co-development and
commercialization of generic recombinant human insulin (rh-insulin) for the US market.
(b) impairment charge of ` 1,078 mn of the marketing rights of T1H product for US and Canada region (‘Territory’) due to uncertainties over commercialisation of the
products in the Territory owing to OFAC sanctions. The exceptional items are more fully explained in Note 40 of the consolidated financial statements.
During the year, Biocon SA sold equity shares held in Biocon SDN. BHD., Malaysia to BUK.
Biocon SDN. BHD
Biocon SDN. BHD., Malaysia is a step down subsidiary of the Company, wholly owned by BUK. Biocon SDN. BHD. was established with an objective to set up the
group’s first overseas manufacturing facility at Malaysia. It is located within BioXcell, a biotechnology park in Nusajaya, Johor, which is being promoted by the Malaysian
Government. The first phase of the facility, designed to manufacture recombinant human insulin and insulin analogs has been commissioned and a series of operational
processes - scale up, validation, and stability activities were performed in FY 2015-16. The manufacturing facility received local cGMP certification from the National
Pharmaceutical Control Bureau, Malaysia and the plant is currently undergoing a series of validation activities to certify its operational efficiency. Biocon SDN BHD will
seek approvals from leading regulatory agencies across the globe for marketing its products in various RoW during FY’17. Approval from the developed markets are
expected in the later years. As at March 31, 2016, Biocon SDN. BHD. has not commenced commercial operations. The Malaysian facility is expected to start commercial
operations in the second half of FY17. Cost incurred in the profit and loss statement for the year was ` 94 mn after capitalisation of expenses amounting to ` 1,027 mn
(including foreign exchange loss) to fixed assets. Total debt on balance sheet date is ` 10,810 mn.
Neo Biocon FZ LLC
Neo Biocon FZ LLC (“NeoBiocon”), a 51% owned subsidiary of the Company is a research and marketing pharmaceutical company, which was incorporated in January
2008. Operating out of Dubai and Abu Dhabi, NeoBiocon helps us reach out to the Middle East and GCC with our veritable portfolio of quality small molecule drugs. For
FY16, Neo Biocon earned ` 1,196 mn in revenues and reported a net profit of ` 425 mn, a growth of 30% and 22% respectively over FY15.
Biocon FZ -LLC
Biocon FZ LLC is a wholly owned subsidiary of the Company based in Dubai. Incorporated in June 2015, Biocon FZ LLC has been established as a marketing entity for
pharmaceutical products to target markets in the Middle East and GCC. As of March 31, 2016 Biocon FZ LLC earned ` 11 mn as revenue and reported a net profit of ` 3 mn.
Biocon Biologics Limited
Biocon Biologics Limited (“BUK”) is a wholly owned subsidiary of the Company. Incorporated in the United Kingdom in March 2016, BUK will house Biocon’s biosimilar
biologics business. During the year, BUK acquired the shareholding of Biocon SDN. BHD. from Biocon SA and the Company, making Biocon SDN. BHD. a wholly owned
subsidiary of BUK. As of March 31, 2016, BUK earned ` 196 mn as revenue and reported a net profit of ` 71 mn.
Biocon Pharma Inc.
Biocon Pharma, Inc. (“BPI”) is a wholly owned subsidiary of Biocon Pharma Limited was incorporated in July 2015 in the United States of America. BPI would be engaged
in commercialization of generic formulations in the United States. As of March 31, 2016, BPI had not commenced commercial operations.
Management’s discussion and analysis
Management’s discussion and analysis forms a part of this annual report and is annexed to the Board’s report.
Corporate Governance
We strive to maintain high standards of Corporate Governance in all our interactions with our stakeholders. The Company has conformed to the Corporate Governance
code as stipulated under the SEBI (Listing Obligations and Disclosure Requirements) Regulations, 2015. A separate section on Corporate Governance along with a
certificate from the auditors confirming the level of compliance is attached and forms a part of the Board’s Report.
Policy on Directors’ appointment and remuneration
As on March 31, 2016, the Board consists of 9 (nine) members, of which 5 (five) are independent and non-executive. An appropriate mix of executive and independent
directors ensures greater independence of the Board.
Biocon Limited
101

The policy of the Company on director’s appointment and remuneration, including criteria for determining qualifications, independence and other matters as provided
under sub-section (3) of Section 178 of the Companies Act, 2013 is appended in Annexure 3 to the Boards’ Report.
Board Diversity
A diverse Board enables efficient functioning through differences in perspective and skill, and also fosters differentiated thought processes at the back of varied industrial
and management expertise, gender, knowledge and geographical background. The Board recognises the importance of a diverse composition and has adopted a Board
Diversity Policy which sets out the approach to diversity. The policy is available at http://www.biocon.com/docs/PolicyDocument_BoardDiversity.pdf
Declaration by Independent Directors
A declaration of Independence in compliance with Section 149(6) of the Companies Act, 2013, has been taken on record from all the independent directors of the
Company.
Board Evaluation
We at Biocon believe in striving and excelling against contenders not only through products and initiatives but also through effective and efficient Board monitoring. As
required under the Companies Act, 2013 and SEBI (Listing Obligations and Disclosure Requirements) Regulations, 2015, an evaluation of all the directors, the Board as a
whole and its committees was conducted based on the criteria and framework adopted by the Board.
The details of the said evaluation has been enumerated in the Corporate Governance Report, which is annexed to the Boards’ Report.
Inductions
On the recommendation of the Nomination and Remuneration Committee, Mr. M. Damodaran was inducted to the Board as independent members of the Board
effective April 26, 2016.
A brief profile of Mr. M. Damodaran proposed for appointment is available in the Notice convening the Annual General Meeting. The Board recommends his appointment
as a Director at the ensuing Annual General Meeting.
Retirement and Re-appointments
Dr. Arun S. Chandavarkar, shall retire by rotation at the ensuing Annual General Meeting and is eligible for re-appointment.
Committees of the Board
The details of Boards Committees – the Audit & Risk Committee, the Nomination and Remuneration Committee, Corporate Social Responsibility Committee and the
Stakeholders Relationship Committee have been disclosed separately in the Corporate Governance Report which is annexed to and forms a part of this annual report.
Audit & Risk Committee
The Audit & Risk Committee comprises Mr. Russell Walls, Chairman, Mr. Daniel M Bradbury, Dr. Jeremy M Levin and Mr. M. Damodaran, independent directors. The
functions performed by the Audit Committee and the particulars of meetings held and attendance thereat are given in the Corporate Governance Report.
Meetings of the Board
The meetings of the Board are scheduled at regular intervals to decide and discuss on business performance, policies, strategies and other matters of significance. The
schedule of the meetings are circulated in advance, to ensure proper planning and effective participation in meetings. In certain exigencies, decisions of the Board are
also accorded through circulation.
The Board during the financial year 2015-16 met six times. Detailed information regarding the meetings of the Board are included in the report on Corporate Governance,
which forms part of the Board’s Report.
Related party contracts or arrangements
All transactions entered into with Related Parties as defined under Companies Act, 2013 during the year were in the ordinary course of business and on an arm’s length
basis, and did not attract provisions of Section 188 of Companies Act, 2013 relating to approval of shareholders, except the transactions as mentioned in the Annexure
4 – Form No. AOC-2, which not being in ordinary course of business has been duly approved by the Board as required.
The Company has formulated a policy on “materiality of related party transactions” and the process of dealing with such transaction, which are in line with the provisions
of the Companies Act, 2013 and SEBI (Listing Obligations and Disclosure Requirements) Regulations, 2015. The same is also available on the website of the Company
http://www.biocon.com/docs/PolicyDocument_RelatedPartyTransaction_2015.pdf
Prior omnibus approval from the Audit Committee are obtained for transactions which are repetitive and also normal in nature. Further, disclosures are made to the
Committee and the Board on a quarterly basis.
There have been no material related party transactions undertaken by the Company, under Regulation 23 of the SEBI (Listing Obligations and Disclosure Requirements)
Regulations, 2015 and detail of the transaction approved by the Board under Section 188 of the Companies Act, 2013 have been enclosed pursuant to Clause (h) of sub-
section (3) of Section 134 of Companies Act, 2013 read with Rule 8(2) of the Companies (Accounts) Rules 2014 – as Annexure 4 - ‘Form No. AOC-2’.
Material changes and commitments
No material changes and commitments have occurred after the close of the year till the date of this report, which affect the financial position of the Company.
Change in nature of business
There has been no change in the nature of business of the Company. Your Company continues to be a pioneer biopharmaceutical company engaged in manufacturing
active pharmaceutical ingredients and formulations, including biosimilar drugs for diabetics, oncology and autoimmune diseases with sales in markets across the globe.
Signi!cant events during the year
With effect from October 01, 2015, the Company acquired the business assets of the pharmaceutical manufacturing unit of M/s Acacia Lifesciences Private Limited
based in Vishakhapatnam. The facility presently manufactures advanced intermediates of potent APIs to supply to both our ANDA business and third party customers.
Credibly Capable | Annual Report 2016102

Financial Report
The Company offered for sale 11% of its equity of Syngene International Limited through initial public offer and raised ` 5,500 mn. Syngene’ s equity shares got listed
on both NSE & BSE.
Credit Ratings
CRISIL and ICRA continued to reaffirm their rating of “AA+/ Stable” and “A1+”, for various banking facilities throughout the year enabling your Company to avail facilities
from banks at attractive rates indicating a very strong degree of safety for timely payment of financial obligations.
Conservation to energy, technology absorption, foreign exchange earnings & outgo
The particulars as prescribed under sub-section (3)(m) of Section 134 of the Companies Act, 2013, read with the Companies (Accounts) Rules, 2014, are enclosed as
Annexure 5 to the Board’s report.
Auditors
Statutory Auditors
The Shareholders at their 37th Annual General Meeting (AGM) held on July 24, 2015 approved the re-appointment of M/s. S. R. Batliboi & Associates LLP, Chartered
Accountants as Statutory Auditors of the Company to hold office from the conclusion of the 37th AGM upto the conclusion of the 39th AGM to be held in the financial
year 2017. Considering having served for more than a decade and the requirement of rotation of auditor as per the provisions of the new Companies Act 2013, the
statutory auditors have expressed their inability to continue post the ensuing AGM to be held in the year 2016.
Consequent to the above, the Audit Committee and the Board of Directors recommend the appointment of M/s. B S R & Co. LLP as Statutory Auditors of the Company
from the conclusion of this 38th Annual General Meeting for a term of five years till conclusion of the 43rd Annual General Meeting to be held in financial year 2021
(subject to ratification of the appointment by the members at every Annual General Meeting held after this Annual General Meeting).
Cost Auditors
Pursuant to Section 148 of the Companies Act, 2013 read with the Companies (Cost Records and Audit) Amendment Rules, 2014, cost audit records are maintained by
the Company in respect of its manufacturing activity which are required to be audited. Your directors had, on the recommendation of the Audit Committee, appointed
M/s. Rao & Murthy to audit the cost accounts of the Company for FY16. As required under the Companies Act, 2013, the remuneration payable to the cost auditor is
required to be determined by the members, and an approval thereof is being sought at the General Meeting.
Secretarial Auditors
M/s. Sreedharan & Co. was appointed to conduct the secretarial audit of the Company for FY 2015-16, as required under section 204 of the Companies Act, 2013 and
rules thereunder. The secretarial audit report for FY 2015-16 forms the part of the annual report as Annexure 6 of the Board’s report.
The Board has appointed M/s. Sreedharan & Co., as secretarial auditor of the Company for FY 2016-17.
Signi!cant and material orders
There are no significant and material orders passed by the regulators or courts or tribunals impacting the going concern status and Company’s operations in the future.
Extract of Annual Return
An extract of the Annual return has been annexed as Annexure 9 to the Board’s Report in compliance with Section 92 of the Companies Act 2013 read with applicable
Rules made thereunder.
Internal Financial Control
The Company has laid down certain guidelines, processes and structure, which enables implementation of appropriate internal financial controls across the organisation.
Such internal financial controls encompass policies and procedures adopted by the Company for ensuring the orderly and efficient conduct of business, including
adherence to its policies, safeguarding of its assets, prevention and detection of frauds and errors, the accuracy and completeness of accounting records and the timely
preparation of reliable financial information. These include control processes both on manual and IT applications including the ERP application wherein the transactions
are approved and recorded. Appropriate review and control mechanisms are built in place to ensure that such control systems are adequate and are operating effectively.
Because of the inherent limitations of internal financial controls, including the possibility of collusion or improper management override of controls, material
misstatements in financial reporting due to error or fraud may occur and not be detected. Also, evaluation of the internal financial controls are subject to the risk that the
internal financial control may become inadequate because of changes in conditions, or that the compliance with the policies or procedures may deteriorate.
The Company has, in all material respects, an adequate internal financial controls system and such internal financial controls were operating effectively based on the
internal control criteria established by the Company considering the essential components of internal control, stated in the Guidance Note on Audit of Internal Controls
Over Financial Reporting issued by the Institute of Chartered Accountants of India.
Whistle Blower Policy/ Vigil mechanism
The Company has implemented a Whistle Blower Policy, whereby employees and other stakeholders can report matters such as generic grievances, corruption,
misconduct, illegality and wastage/misappropriation of assets to the Company. The policy safeguards the whistle blowers to report concerns or grievances and also
provides direct access to the Chairman of the Audit Committee.
The details of the Whistle Blower Policy are available on the website of the Company at http://www.biocon.com/docs/Biocon_Group_Integrity_Whistle_Blower_Policy.pdf
Particulars of Employees
The Statement containing ratio of remuneration paid to each director and the median employee remuneration and other details in terms of sub-section 12 of section
197 of the Companies Act, 2013 read with Rule 5(1) of the Companies (Appointment and Remuneration of Managerial Personnel) Rules, 2014 is enclosed in Annexure 7.
The Statement containing particulars in terms of subsection 12 of section 197 of the Companies Act 2013 read with rule 5(2) and 5(3) of the Companies (Appointment
and Remuneration of Managerial Personnel) Rules, 2014 form a part of this report.
Considering the first proviso to Section 136(1) of the Companies Act, 2013, the Annual Report, excluding the aforesaid information, is being sent to the members of the
Company and others entitled thereto. The said information is available for inspection at the registered office of the Company during business hours on working days of
Biocon Limited
103
the Company up to the date of the ensuing Annual General Meeting. Any shareholder interested in obtaining a copy thereof, may write to the Company Secretary in
this regard.
Corporate Social Responsibility
At Biocon, CSR has been an integral part of our business since its inception. With the incorporation of Biocon Foundation in 2004, we formally structured our CSR activity.
Today we span our efforts through Biocon Foundation, Biocon Academy and some partnership programs with like-minded private organizations and Government. We
promote social and economic inclusion for the marginalized communities with our integrated system focussing largely in following areas:
Health Care services: We firmly believe that the use of technology can make healthcare delivery in rural areas more efficient and therefore we have developed an
integrated and holistic healthcare delivery service, which seeks to address critical gaps in the delivery of healthcare in rural India. Our efforts are targeted at enabling last
mile reach of preventive and primary health services in rural areas.
Education: While our projects address experiential learning in basic maths, computer skills and language skills of the underserved young people in rural areas, we also
impart advanced training necessary and skills required for gainful employment in the biopharma sector to young graduates through Biocon Academy.
Promote Art & Culture: India has a rich heritage of art and culture across the land which needs to be preserved and promoted. Our various forms of music and dance,
style of paintings and sculptures have intrigued many across the globe, yet a large pool of our artistes have not gained enough recognition. Biocon Foundation believes
in creating a platform to promote art & culture, encourage artists, and share this knowledge with the marginalized communities through various initiatives to help them
develop a keen sense of appreciating fine arts.
Civic Infrastructure: The civic infrastructure is in deficit in the country, especially the rural India. At Biocon, we are working to build townships, schools, sanitation and
water supply that can fulfil the basic needs of rural communities. We have adopted a township in North Karnataka and are also providing support infrastructure including
school, safe drinking water, health centre, and community hall in nearby villages. This coupled with rain water harvesting system and solar lights, we have also built
household and community toilets to enable clean sanitation facilities for the rural communities.
In compliance with the provisions of Section 135 of the Companies Act, 2013 the Board of Directors of the Company have formed a Corporate Social Responsibility
Committee, which monitors and oversees various CSR initiatives and activities of the Company.
A detailed report regarding Corporate Social Responsibility is enclosed in Annexure 8 to the Board’s Report.
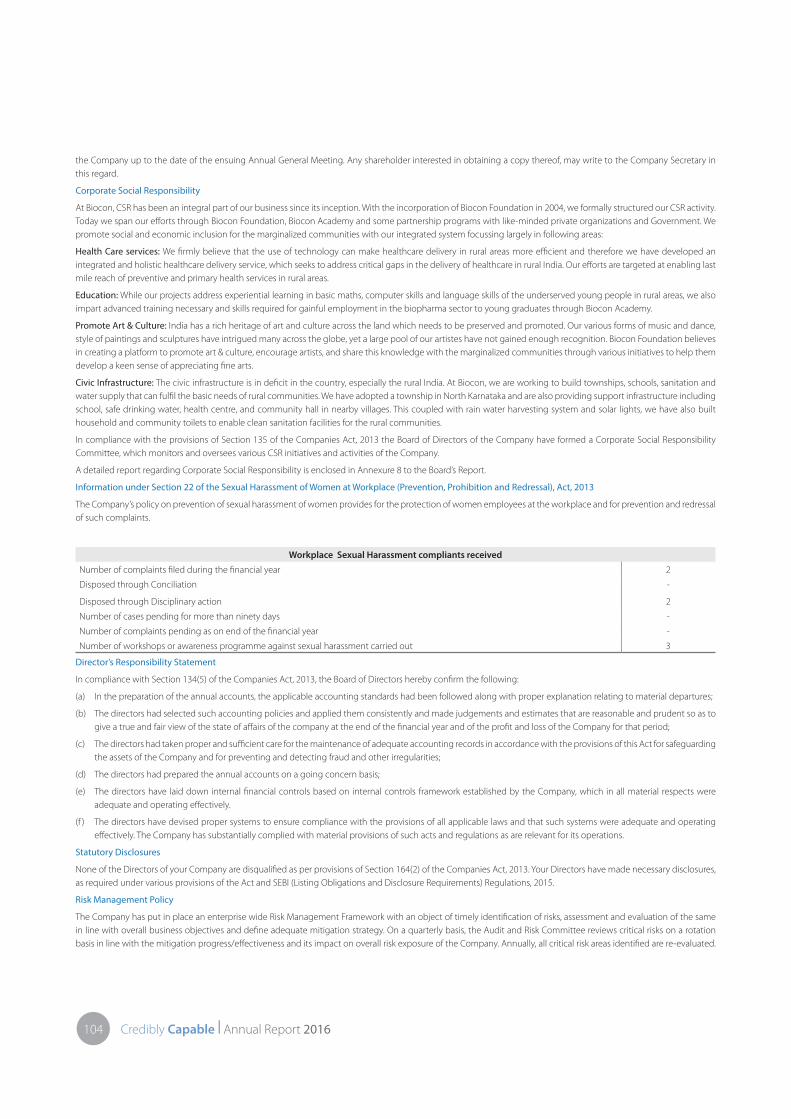
Information under Section 22 of the Sexual Harassment of Women at Workplace (Prevention, Prohibition and Redressal), Act, 2013
The Company’s policy on prevention of sexual harassment of women provides for the protection of women employees at the workplace and for prevention and redressal
of such complaints.
Workplace Sexual Harassment compliants received
Number of complaints filed during the financial year 2
Disposed through Conciliation
Disposed through Disciplinary action
-
2
Number of cases pending for more than ninety days -
Number of complaints pending as on end of the financial year -
Number of workshops or awareness programme against sexual harassment carried out 3
Director’s Responsibility Statement
In compliance with Section 134(5) of the Companies Act, 2013, the Board of Directors hereby confirm the following:
(a) In the preparation of the annual accounts, the applicable accounting standards had been followed along with proper explanation relating to material departures;
(b) The directors had selected such accounting policies and applied them consistently and made judgements and estimates that are reasonable and prudent so as to
give a true and fair view of the state of affairs of the company at the end of the financial year and of the profit and loss of the Company for that period;
(c) The directors had taken proper and sufficient care for the maintenance of adequate accounting records in accordance with the provisions of this Act for safeguarding
the assets of the Company and for preventing and detecting fraud and other irregularities;
(d) The directors had prepared the annual accounts on a going concern basis;
(e) The directors have laid down internal financial controls based on internal controls framework established by the Company, which in all material respects were
adequate and operating effectively.
(f ) The directors have devised proper systems to ensure compliance with the provisions of all applicable laws and that such systems were adequate and operating
effectively. The Company has substantially complied with material provisions of such acts and regulations as are relevant for its operations.
Statutory Disclosures
None of the Directors of your Company are disqualified as per provisions of Section 164(2) of the Companies Act, 2013. Your Directors have made necessary disclosures,
as required under various provisions of the Act and SEBI (Listing Obligations and Disclosure Requirements) Regulations, 2015.
Risk Management Policy
The Company has put in place an enterprise wide Risk Management Framework with an object of timely identification of risks, assessment and evaluation of the same
in line with overall business objectives and define adequate mitigation strategy. On a quarterly basis, the Audit and Risk Committee reviews critical risks on a rotation
basis in line with the mitigation progress/effectiveness and its impact on overall risk exposure of the Company. Annually, all critical risk areas identified are re-evaluated.
Credibly Capable | Annual Report 2016104

Financial Report
Acknowledgement
The Board greatly appreciates the commitment and dedication of its employees across all levels who have contributed to the growth and sustained success of the
Company. We would like to thank all our clients, partners, vendors, investors, bankers and other business associates for their continued support and encouragement
during the year.
We also thank the Government of India, Governments of Karnataka and Telangana, Ministry of Information Technology and Biotechnology, Ministry of Commerce and
Industry, Ministry of Finance, Department of Scientific and Industrial Research, Customs and Excise Departments, Income Tax Department, CSEZ, LTU Bengaluru and all
other Government agencies for their support during the year and look forward to the same in the future.
For and on Behalf of the Board
Bengaluru, Kiran Mazumdar-Shaw
April 26, 2016 Chairperson and Managing Director
(This space has been intentionally left blank)
Biocon Limited
105

An
ne
xure
1 -
Sta
tem
en
t co
nta
inin
g s
alie
nt
fea
ture
s o
f th
e !
na
nci
al s
tate
me
nts
of
Su
bsi
dia
rie
s[P
urs
uan
t to
firs
t p
rovi
so t
o s
ub
-sec
tio
n (3
) of S
ecti
on
129
of t
he
Co
mp
anie
s A
ct, 2
013,
rea
d w
ith
Ru
le 5
of t
he
Co
mp
anie
s (A
cco
un
ts) R
ule
s, 2
014
– A
OC
-1]
In `
Mill
ion
Na
me
of
the
En
tity
& C
ou
ntr
yR
ep
ort
ing
curr
en
cy
Ca
pit
al
Re
serv
es
Tota
l
Ass
ets
Tota
l
Lia
bili
tie
s
(exc
l. ca
pit
al
& r
ese
rve
s)
Inv
est
me
nts
(exc
lud
ing
in
sub
sid
iari
es)
Turn
ov
er
Pro
!t/
(lo
ss)
be
fore
taxa
tio
n
Pro
vis
ion
for
taxa
tio
n
Pro
!t/
(lo
ss)
aft
er
taxa
tio
n
Pro
po
sed
div
ide
nd
% o
f
Sh
are
ho
ldin
g
by
th
e
Co
mp
an
y
Syn
gen
e In
tern
atio
nal
Lim
ited
, In
dia
2IN
R 1
,992
8
,536
2
3,89
5 1
3,36
7 2
,764
1
1,13
1 2
,582
3
70
2,2
12
-
73.5
4%2
Bio
con
Res
earc
h L
imit
ed, I
nd
ia2
INR
1
-1,
338
1,8
70
3,2
07
-
4,0
97
669
-
6
69
-
100.
00%
Bio
con
Aca
dem
y, In
dia
INR
1
-
11
10
-
-
-
-
-
-
100.
00%
Bio
con
Ph
arm
a Li
mit
ed, I
nd
iaIN
R 5
1 -
9 1
,568
1
,526
-
-
-
9 -
-
9 -
10
0.00
%
Bio
con
SA
, Sw
itze
rlan
dU
SD 6
3
,852
7
,735
3
,877
-
3
14
1,3
53
125
1
,228
-
10
0.00
%
Bio
con
Bio
log
ics
Lim
ited
, UK
USD
4,4
41
72
4,6
57
144
-
1
96
89
18
71
-
100.
00%
Neo
Bio
con
, UA
EA
ED 5
6
33
899
2
61
-
1,2
34
425
-
4
25
-
51.0
0%
Bio
con
SD
N B
HD
, Mal
aysi
a 4
MY
R 2
,953
-
363
18,
846
16,
256
-
126
-
94
-
-94
-
R
efer
No
te 4
Bio
con
Ph
arm
a In
c, U
S 5
USD
27
-3
27
3
-
-
-3
-
-3
-
Ref
er N
ote
5
Bio
con
FZ
LLC
, UA
EA
ED 3
3
1
8 1
2 -
1
1 3
-
3
-
10
0.00
%
Bal
ance
Sh
eet
con
vers
ion
rat
e as
at
Mar
ch 3
1, 2
016
- 1
USD
= 6
6.29
; 1 A
ED =
18.
05; 1
MY
R =
17.
10
No
tes:
1. N
on
e o
f th
e su
bsi
dia
ries
hav
e p
rop
ose
d d
ivid
end
s as
at
Mar
ch 3
1, 2
016.
2. I
ncl
ud
ing
0.9
3% e
qu
ity
stak
e h
eld
by
Bio
con
Res
earc
h L
imit
ed in
Syn
gen
e In
tern
atio
nal
Lim
ited
.
3. B
ioco
n P
har
ma
Lim
ited
, Bio
con
SD
N B
HD
, Mal
aysi
a an
d B
ioco
n P
har
ma
Inc.
are
yet
to
co
mm
ence
co
mm
erci
al o
per
atio
ns
as a
t M
arch
31,
201
6.
4. B
ioco
n B
iolo
gic
s Li
mit
ed, U
K h
old
s 10
0% o
f eq
uit
y st
ake
in B
ioco
n S
DN
BH
D, M
alay
sia.
5. B
ioco
n P
har
ma
Lim
ited
, In
dia
ho
lds
100%
of e
qu
ity
stak
e in
Bio
con
Ph
arm
a In
c., U
S.
For
and
on
beh
alf o
f th
e B
oar
d
Kir
an
Ma
zum
da
r-S
ha
w
Aru
n S
. Ch
an
da
va
rka
r S
idd
ha
rth
Mit
tal
Kir
an
Ku
ma
r
Ch
airp
erso
n &
Man
agin
g D
irect
or
CEO
& J
oin
t M
anag
ing
Dire
cto
r Pr
esid
ent
– Fi
nan
ce &
CFO
C
om
pan
y Se
cret
ary
Ben
gal
uru
,
Ap
ril 2
6, 2
016
Credibly Capable | Annual Report 2016106

Financial Report
Annexure 2 - Employee Stock Option Plan (ESOP)Sl.
No.
Particulars Grant IV Grant V Grant VI Grant VII Grant VIII
1 Number of options outstanding at the beginning of the period 61,625 1,151,975 1,346,152 293,000 -
2 Number of options granted during the year - - - 1,077,500 312,500
3 Number of options forfeited / lapsed during the year 2,875 269,087 160,313 95,000
4 Number of options vested during the year - 142,375 151,813 - -
5 Number of options exercised during the year 55,250 91,013 - - -
6 Number of shares arising as a result of exercise of options 55,250 91,013
7 Money realized by exercise of options (`), if scheme is implemented directly by the
company
NIL NIL NIL NIL NIL
8 Loan repaid by the Trust during the year from exercise price received NIL NIL NIL NIL NIL
9 Number of options outstanding at the end of the year 3,500 791,875 1,185,839 1,275,500 312,500
10 Number of options exercisable at the end of the year 3,500 220,638 116,750 - -
11 Weighted average exercise prices of options outstanding at the end of the year 231 343 470 461 459
12 Weighted average fair values of options granted - - - 185 154
The details of other ESOP related disclosures are provided in notes to the financial statements (Notes 30)
Options granted to -
(a) Senior managerial personnel:
Sl. No Name of the Employee Designation Grant VII
No of options granted Exercise price
1 Akhilesh Nand Vice President 40,000 457
2 Narendra Chirmule Vice President 40,000 451
(b) Any other employee who receives a grant in any one year of option amounting to 5% or more of option granted during that year - NIL
(c) Identified employees who were granted option, during any one year, equal to or exceeding 1% of the issued capital (excluding outstanding warrants and
conversions) of the company at the time of grant - NIL
For and on behalf of the Board
Bengaluru Kiran Mazumdar-Shaw
April 26, 2016 Chairperson & Managing Director
(This space has been intentionally left blank)
Biocon Limited
107

Annexure 3 - Policy on Director’s appointment and remunerationThe policy on appointment and remuneration of Directors and Key Management Personnel provides an underlying basis and guide for human resource management,
thereby aligning plans for strategic growth of the Company. The policy is pursuant to Section 178(4) of the Companies Act, 2013 and Regulation 19 of SEBI (Listing
Obligations and Disclosure Requirements) Regulation, 2015.
A brief summary of the policy in relation to the objective, appointment criteria, remuneration and general matters as administered by the Nomination and Remuneration
Committee are reproduced herewith –
Background
Section I
The Key Objectives of the Committee/Policy would be:
To guide the Board in relation to appointment, retention and removal of Directors, Key Managerial Personnel and Senior Management.
To evaluate the performance of the members of the Board and provide necessary report to the Board for further evaluation of the Board.
To recommend to the Board on remuneration payable to the Directors and Key Managerial Personnel.
To retain, motivate and promote talent and to ensure long term sustainability of talented managerial persons and create competitive advantage.
To devise a policy on Board diversity.
To develop a succession plan for the Board and to regularly review the plan.
COMPOSITION AND MEETINGS
The Board has constituted a Nomination and Remuneration Committee in line with the requirements of the Companies Act, 2013 which oversees the functions related
to appointment and remuneration of Directors, Key Managerial personnel and senior management personnel.
The terms of composition and requirements as to the meeting of the Committee are as below -
The Committee shall consist of a minimum 3 non-executive directors, majority of them being independent.
Minimum two (2) members shall constitute a quorum for the Committee meeting.
Membership of the Committee shall be disclosed in the Annual Report.
Term of the Committee shall be continued unless terminated by the Board of Directors.
DEFINITION
‘Act’ means the Companies Act, 2013 and Rules framed thereunder, as amended from time to time.
‘Board’ means Board of Directors of the Company.
‘Committee’ means the Nomination and Remuneration Committee.
‘Directors’ mean Directors of the Company.
‘Key Managerial Personnel’ means Chief Executive Officer and Managing Director, Whole-time Director, Chief Financial Officer, Company Secretary; and such other officer
as may be prescribed under the Act.
‘Senior Management’ means personnel of the Company who are members of its core management team excluding the Board of Directors including Functional Heads.
SECTION II
This section covers the duties of the Committee in relation to various matters and recommendations to be made by the Committee to the Board.
DUTIES AND ROLE OF COMMITTEE
Matters to be dealt with, perused and recommended to the Board by the Committee shall include –
Formulating the criteria for determining qualifications, positive attributes and independence of a director.
Identifying persons who are qualified to become Director and persons who may be appointed in Key Managerial positions in accordance with the criteria laid down
in this policy.
Recommending to the Board, appointment and removal of Director, Key Managerial Personnel and Senior Management Personnel.
Specifically, the duties include
A. NOMINATION MATTERS
Determining the appropriate size, diversity and composition of the Board.
Setting a formal and transparent procedure for selecting new Directors for appointment to the Board.
Ensuring that there is an appropriate induction in place for new Directors and reviewing its effectiveness.
Identifying and recommending Directors who are to be put forward for retirement by rotation.
Developing a succession plan for the Board and Senior Management and regularly reviewing the plan.
Evaluating the performance of the Board members and Senior Management in the context of the Company’s performance, industry benchmarks and compliance.
Making recommendations to the Board concerning any matters relating to the continuation in office of any Director at any time including the suspension or
termination of service of an Executive Director as an employee of the Company subject to the provision of the law and their service contract.
Recommend necessary changes to the Board in line with Board Diversity Policy.
Considering any other matters, as may be requested by the Board.
Credibly Capable | Annual Report 2016108

Financial Report
B. REMUNERATION MATTERS
Considering and determining the Remuneration Policy, based on performance with a reasonable and sufficient need to attract, retain and motivate members of the
Board.
To approve the remuneration of Key Managerial Personnel of the Company by maintaining a balance between fixed and incentive pay reflecting short and long-term
performance objectives appropriate to the working of the Company, and its growth strategy.
To consider any other matters as may be requested by the Board.
SECTION III
This section covers the Policy for appointment, term and retirement of Director and Key Managerial Personnel by the Committee.
Appointment criteria and quali"cations
The Committee shall identify and ascertain the integrity, qualification, expertise and experience of the person for appointment as Director, Key Managerial Personnel
and recommend to the Board his/her appointment.
A person should possess adequate qualification, expertise and experience for the position he/she is considered for appointment. The Committee has discretion to
decide whether qualification, expertise and experience possessed by a person is sufficient/satisfactory for the concerned position.
The Company shall not appoint any person as Whole-time Director who has attained the age of seventy years. Provided that the term of the person holding this
position may be extended beyond the age of seventy years with the approval of shareholders by passing a special resolution based on the explanatory statement
annexed to the notice for such motion indicating the justification for extension of appointment beyond seventy years.
Term / Tenure
Managing Director/Whole-time Director: The Company shall appoint or re-appoint any person as its Executive Chairman, Managing Director or Executive Director for
a term not exceeding such term as may be specified under the Act. No re-appointment shall be made earlier than one year before the expiry of term, and which shall
be done with the approval of the shareholders of the Company.
Independent Director - An Independent Director shall hold office for a term up to five consecutive years on the Board of the Company and will be eligible for
reappointment on passing of a special resolution by the Company and disclosure of such appointment in the Board’s report. No Independent Director shall hold
office for more than two consecutive terms, but such Independent Director shall be eligible for appointment after expiry of three years of ceasing to become an
Independent Director. Provided that an Independent Director shall not, during the said period of three years, be appointed in or be associated with the Company in
any other capacity, either directly or indirectly.
Evaluation
The Committee shall carry out evaluation of performance of every Director at regular intervals and at least on an annual basis.
Removal
Due to reasons for any disqualification mentioned in the Act or under any other applicable Act, rules and regulations thereunder, the Committee may recommend, to the
Board with reasons recorded in writing, removal of a Director or Key Managerial Personnel subject to the provisions and compliance of the said Act, rules and regulations.
Retirement
The Director and Key Managerial Personnel shall retire as per the applicable provisions of the Act and the prevailing policy of the Company. The Board will have the
discretion to retain the Director or Key Managerial Personnel in the same position/remuneration or otherwise even after attaining the retirement age, for the benefit of
the Company.
SECTION IV
This Section of the Policy covers provisions relating to the Remuneration for the Whole-time Director, Key Managerial Personnel and Senior Management Personnel.
General
The remuneration to the Whole-time Director and Key Managerial Personnel will be determined by the Committee and recommended to the Board for approval.
Wherever required, the remuneration/ compensation/ commission etc. shall be subject to approval of the shareholders of the Company and Central Government.
The remuneration and commission including increments recommended to be paid to the Whole-time Director shall be in accordance with the percentage/ slabs/
conditions laid down as per the provisions of the Act. These would be subject to approval of the shareholders of the Company.
Remuneration to Whole-time / Executive / Managing Director and Key Managerial Personnel
a) Fixed pay: The Whole-time Director/Managing Director shall be eligible for a monthly remuneration as may be approved by the Board on the recommendation of the
Committee. The breakup of the pay scale and quantum of perquisites including, employer’s contribution to provident fund, pension scheme, medical expenses, club
fees etc. shall be decided and approved by the Board and approved by the shareholders and Central Government, wherever required. The Committee shall approve
the remuneration for the Key Managerial Personnel.
b) Minimum Remuneration: If, in any financial year, the Company has no profits or its profits are inadequate, the Company shall pay remuneration to its Whole-time
Director in accordance with the provisions of Schedule V of the Act and if it is not able to comply with such provisions, with the previous approval of the Central
Government.
c) Long-term rewards: These long-term rewards are linked to contribution to the performance of the Company based on relative position of the personnel in the
organisation. These rewards could be in the form/nature of stock options and are based on level of employees and their criticality.
d) Provisions for excess remuneration: If any Whole-time Director draws or receives, directly or indirectly by way of remuneration any such sums in excess of the limits
prescribed under the Act or without the prior sanction of the Central Government, where required, he/she shall refund such sums to the Company and until such sum
is refunded, hold it in trust for the Company. The Company shall not waive recovery of such sum refundable to it unless permitted by the Central Government.
Biocon Limited
109

Remuneration to Non-Executive/ Independent Director:
a) Remuneration/Commission: The remuneration/commission shall be fixed as per the limits mentioned in the Act, subject to approval from the shareholders as
applicable.
b) Sitting Fees: The Non- Executive/ Independent Director shall receive remuneration by way of fees for attending meetings of Board or Committee thereof. Provided
that the amount of such fees shall not exceed such amount as may be prescribed by the Central Government from time to time.
c) Stock Options: An Independent Director shall not be entitled to any stock option of the Company.
The remuneration structure for Independent directors per meeting of the Board/Committee effective April 1, 2014 is as follows –
Particulars Currency Amount
Board sitting fees 100,000
Board remuneration US$ 5,000
Travel allowance for overseas directors(Non US) US$ 3,000
Travel allowance for overseas directors (US) US$ 4,000
Chairperson of Audit and Risk Committee * US$ 6,000
Chairperson of other Committees US$ 2,000
Members of Audit and Risk Committee* US$ 3,000
Members of other Committees US$ 1,000
* Audit Committee remuneration revised from US$ 5000 to US$ 6000 and revised from US$2000 to US$3000 respectively with effect from January 21, 2016
Amendments and Updates
The Nomination and Remuneration Committee periodically shall review this Policy and may recommend amendments to this Policy from time to time as it deems
appropriate, which shall be in accordance with the provisions of the Companies Act, 2013. In case of any modifications, amendments or inconsistencies with the Act, the
provisions of the Act and the rules made thereunder would prevail over the Policy.
For and on behalf of the Board
Bengaluru Kiran Mazumdar-Shaw
April 26, 2016 Chairperson & Managing Director
(This space has been intentionally left blank)
Credibly Capable | Annual Report 2016110

Financial Report
ANNEXURE – 4FORM NO. AOC–2(Pursuant to Clause (h) of sub-section (3) of Section 134 of the Act and Rule 8(2) of the Companies (Accounts) Rules, 2014)
Form for disclosure of particulars of contracts/arrangements entered into by the Company with related parties referred to in sub-section (1) of Section 188 of the
Companies Act, 2013 including certain arm’s length transactions under third proviso thereto
1. Details of contracts or arrangements or transactions not at arm’s length basis: None
Sl. No. Particulars Details
a. Name(s) of the related party and nature of relationship
Not applicable
b. Nature of contracts/ arrangements/ transactions
c. Duration of the contracts/ arrangements/ transactions
d. Salient terms of the contracts or arrangements or transactions including the value, if any
e. Justification for entering into such contracts or arrangements or transactions
f. Date(s) of approval by the Board
g. Amount paid as advances, if any
h. Date on which the special resolution was passed in general meeting as required under first proviso to Section 188
2. Details of contracts or arrangement or transactions at arm’s length basis
Sl. No. Particulars Details
a. Name(s) of the related party and nature of relationship Biocon Biologics Limited, UK – Wholly owned subsidiary
b. Nature of contracts/ arrangements/ transactions Transfer/sale of shares of subsidiary company, not in ordinary
course of business.
c. Duration of the contracts/ arrangements/ transactions One off
d. Salient terms of the contracts or arrangements or transactions including the value, if any Sale of equity shares held in Biocon SDN BHD, Malaysia for a
consideration of ` 812 million based on a valuation report by an
independent valuer/category I merchant banker.
e. Date(s) of approval by the Board March16, 2016
f. Amount paid as advances, if any -
For and on behalf of the Board
Bengaluru Kiran Mazumdar-Shaw
April 26, 2016 Chairperson & Managing Director
(This space has been intentionally left blank)
Biocon Limited
111

Annexure 5 – Conservation of energy, research and development, technology absorption, foreign exchange earnings and outgo[Particulars pursuant to the Companies (Accounts) Rules, 2014]
Power and fuel consumption
Power and fuel consumption details FY 16 FY15
1 Electricity
a. Purchased
Million Units 138 134
Total amount in ` mn 758 770
Rate/Unit (`) 5.5 5.8
b. Captive generation
HSD Quantity, KL 4,544 4,032
Million Units 15 14
Units/Litre 3.4 3.4
Cost/Litre (`) 31.1 47.1
Generation cost, Rate/Unit (`) 9.4 13.8
2 Steam
a. Furnace oil
Quantity, KL 14,285 13,852
Total amount (` mn) 320 500
Average rate 22.7 36.4
Energy conservation details
Sl.
No.
Energy conservation measure Investment
(` Mn)
Energy saved per Annum
Units Amount (` Mn)
1 Installation of energy efficient Brine chiller3.7 9,00,000 5.4
2 Optimisation of HVAC system
Power consumption for financial year 2015-16 was 153 million units as against ̀ 147 million units in 14-15 on account of increased consumption of 4% YOY. While the unit
consumption increased, total energy cost reduced by 16% (` 1,223 mn from ` 1,460 mn). The reduction in overall energy cost was attributed to procurement of power
from alternate source (` 130 Mn) and impact of drop in global crude oil prices (` 240 mn).
Continuous monitoring of high energy consumption areas/equipment and taking appropriate corrective measures as and when required, resulted in energy saving and
maintained marginal increment in power consumption as against production growth.
Research and Development
Specific areas in which R & D work has been carried out by the Company
Development of Synthetic and Fermentation based Generic Small Molecules for Anti-infective, Oncology, Cardio-vascular, Nephrology and Transplantation segments.
Formulation development for Abbreviated New Drug Applications (ANDAs).
Generation of Intellectual Property Development – Process Patents for manufacture of key Generic Small Molecules and Biotherapeutics.
Bene"ts derived as a result of R & D activities
Global presence in supply of fermentation based Small Molecules to the Generic Industry in regulated markets
Rich pipeline of Generic Small Molecules catering to varied therapeutic areas.
Internationally competitive prices and product quality.
Established intellectual property with 1,201 Patents/PCT applications filed in Indian and International markets. We have been granted 528 patents in various
jurisdictions.
Safe and environment friendly processes
Future Plan of Action
Strategic Collaborations for increased speed and cost competitiveness in Drug Discovery.
In-house R & D scale up of generic formulations.
Collaborate with global Academia and Industry to build value & visibility to the portfolio.
Credibly Capable | Annual Report 2016112

Financial Report
Expenditure of Scientific Research & Development
In ` Million
FY 16 FY 15
a) Capital 35 22
b) Recurring 1,480 1,011
Total 1,515 1,033
Less: recharge (48) (19)
Net R & D Expenses 1,467 1,014
R & D expenditure as % of finished goods sales 7.32% 5.29%
Technology Absorption, Adoption and Innovation
No technology was imported by the Company during the year.
Foreign Exchange Earnings and Outgo
In ` Million
Foreign exchange earned and used for the year: FY16 FY15
Gross Earning 11,610 10,993
Outflow* 1,340 7,372
Net foreign exchange earning 10,270 3,621
* For details please refer information given in the notes to the annual accounts of the Company schedule 33 (a) (c) and (d).
For and on behalf of the Board
Bengaluru Kiran Mazumdar-Shaw
April 26, 2016 Chairperson & Managing Director
(This space has been intentionally left blank)
Biocon Limited
113
Annexure 6 - Secretarial audit report for the !nancial year ended March 31, 2016[Pursuant to Sub Section (1) of Section 204 of the Companies Act, 2013 and Rule 9 of the Companies (Appointment and Remuneration of Managerial Personnel) Rules,
2014]
To,
The Members,
Biocon Limited
We have conducted the secretarial audit of the compliance of applicable statutory provisions and the adherence to good corporate practices by Biocon Limited
(hereinafter called the company). Secretarial Audit was conducted in a manner that provided us a reasonable basis for evaluating the corporate conducts/statutory
compliances and expressing our opinion thereon.
Based on our verification of the Company’s Books, Papers, Minute Books, Forms and Returns filed and other Records maintained by the company and also the information
provided by the Company, its officers, agents and authorized representatives during the conduct of secretarial audit, we hereby report that in our opinion, the company
has, during the financial year ended on March 31, 2016 (the audit period) complied with the statutory provisions listed hereunder and also that the Company has proper
Board-processes and compliance-mechanism in place to the extent, in the manner and subject to the reporting made hereinafter:
We have examined the books, papers, minute books, forms and returns filed and other records maintained by the Company during the audit period according to the
provisions of:
(i) The Companies Act, 2013 (the Act) and the rules made thereunder;
(ii) The Securities Contracts (Regulation) Act, 1956 (‘SCRA’) and the rules made thereunder;
(iii) The Depositories Act, 1996 and the Regulations and Bye-laws framed thereunder;
(iv) Foreign Exchange Management Act, 1999 and the rules and regulations made thereunder to the extent of Foreign Direct Investment, Overseas Direct Investment
and External Commercial Borrowings;
(v) Following Regulations and Guidelines prescribed under the Securities and Exchange Board of India Act, 1992 (‘SEBI Act’):-
a. The Securities and Exchange Board of India (Substantial Acquisition of Shares and Takeovers) Regulations, 2011;
b. The Securities and Exchange Board of India (Prohibition of Insider Trading) Regulations, 2015;
c. The Securities and Exchange Board of India (Issue of Capital and Disclosure Requirements) Regulations, 2009;
d. The Securities and Exchange Board of India (Share Based Employee Benefits) Regulations, 2014;
e. The Securities and Exchange Board of India (Issue and Listing of Debt Securities) Regulations, 2008; (Not Applicable to the Company during the Audit Period);
f. The Securities and Exchange Board of India (Registrars to an Issue and Share Transfer Agents) Regulations, 1993 regarding the Companies Act and dealing with
client;
g. The Securities and Exchange Board of India (Delisting of Equity Shares) Regulations, 2009; and (Not Applicable to the Company during the Audit Period);
h. The Securities and Exchange Board of India (Buyback of Securities) Regulations, 1998 (Not Applicable to the Company during the Audit Period);
(vi) Other Laws Applicable Specifically to the Company namely:
a. Drugs and Cosmetics Act, 1940
b. Bio Medical Waste (Management & Handling) Rules, 1998
c. ICH Guidelines (this is the base on which US FDA/ EU Guidelines etc. are created on)
d. UCPMP (Currently voluntary – however proposed to be made mandatory)
e. National Biodiversity Act 2002
f. Drugs & Magical Remedies (Objectionable Advertisements) Rules, 1955
g. BUDAPEST TREATY 1977 - on the International Recognition of the Deposit of Micro-organisms
h. Narcotic Drugs and Psychotropic substance Act
We have also examined compliance with the applicable clauses of the following:
a. Secretarial Standards issued by the Institute of Company Secretaries of India on Meetings of the Board of Directors and General Meeting.
b. Listing Agreements (till November 30, 2015) entered into by the Company with BSE Limited and National Stock Exchange of India Limited and Securities and
Exchange Board of India (Listing Obligations and Disclosure Requirements) Regulations, 2015 (From December 01, 2015 to March 31, 2016)
During the period under review the Company has complied with the provisions of the Act, Rules, Regulations, Guidelines, Standards, etc. mentioned above.
We have not examined compliance with applicable Financial Laws, like Direct and Indirect Tax Laws, since the same have been subject to review by statutory financial
audit and other designated professionals.
We further report that:
The Board of Directors of the Company is duly constituted with proper balance of Executive Directors, Non-Executive Directors and Independent Directors. The changes
in the composition of the Board of Directors that took place during the period under review were carried out in compliance with the provisions of the Act.
Adequate notice is given to all directors to schedule the Board Meetings, agenda and detailed notes on agenda were sent at least seven days in advance, and a system
exists for seeking and obtaining further information and clarifications on the agenda items before the meeting and for meaningful participation at the meeting.
Credibly Capable | Annual Report 2016114

Financial Report
As per the minutes of the meetings duly recorded and signed by the Chairman, the decisions of the Board were unanimous and no dissenting views have been recorded.
We further report that based on the review of the compliance reports/certificates of the Chief Executive Officer (CEO) of the Company which were taken on record by
the Board of Directors, there are adequate systems and processes in the Company commensurate with the size and operations of the Company to monitor and ensure
compliance with applicable laws, rules, regulations and guidelines.
We further report that during the audit period, except the Offer of 22 million equity shares held by the company in its subsidiary Syngene International Limited, for sale
to public, there was no event/action having a major bearing on the Company’s affairs in pursuance of the above referred laws, rules, regulations, guidelines etc.
For V. SREEDHARAN & ASSOCIATES
Company Secretaries
Pradeep B. Kulkarni
Bengaluru Partner
April 22, 2016 FCS: 7260; CP No. 7835
(This space has been intentionally left blank)
Biocon Limited
115

Annexure 7 – Particulars of RemunerationInformation in terms of sub-section 12 of Section 197 of the Companies Act, 2013 read with Rule 5(1) of the Companies (Appointment and Remuneration of
Managerial Personnel) Rules, 2014
During the year ended March 31, 2016 the Company paid remuneration to executive directors and Key Managerial Personnel (‘KMP’) as below-
In ` Million
Name of Director / KMP Title Remuneration
2016
Remuneration
2015
ESOPs granted
2016
ESOPs granted
2015
Ms Kiran Mazumdar Shaw Chairperson & Managing Director 16.02 15.52 - -
Mr John Shaw Vice Chairman 15.63 14.78 - -
Mr Arun Chandavarkar CEO & Joint Managing Director 30.85 26.57 - -
Mr Siddharth Mittal* CFO 15.74 7.84 - 9,000
Mr Kiran Kumar CS 6.09 5.70 - -
*Mr. Siddharth Mittal was appointed as CFO effective August 01, 2014 and hence his remuneration is included only for the period after August 01, 2014.
Note: Employee stock compensation expense allocable to KMPs (CEO, CFO & CS) for the Restricted Stock Units under the RSU Plan, 2015 is ` 10 mn (March 31, 2015 - Nil)
which is not included in the remuneration disclosed above.
The remuneration paid to independent directors were as below –
In ` Million
Name of Director Remuneration
2016
Remuneration
2015
Sitting Fees
2016
Sitting Fees
2015
Prof. Charles L Cooney 1.66 3.23 0.20 0.40
Mr. Suresh N Talwar 1.02 1.99 0.20 0.40
Dr. Bala S. Manian 1.28 1.81 0.20 0.30
Ms. Mary Harney 2.46 2.36 0.50 0.40
Mr. Russell Walls 3.56 3.48 0.50 0.40
Mr. Daniel M Bradbury 2.21 2.66 0.50 0.40
Dr. Jeremy M Levin 2.60 1.51 0.50 0.20
Dr. Vijay Kumar Kuchroo 1.89 1.19 0.40 0.20
Other details as required under Rule 5(1) of the Companies (Appointment and Remuneration of Managerial Personnel) Rules, 2014
Sl.
No.
Requirements Details Ratio
X times / %
I Ratio of remuneration of each director to the median
remuneration of employees
Chairperson & Managing Director
Vice Chairman
CEO & Joint Managing Director
43.3x
42.3x
83.4x
II Percentage increase in remuneration of director and KMP
during the financial year
Chairperson & Managing Director
Whole-time Director
CEO & Joint Managing Director
CFO
Compliance Officer & Company Secretary
3%
6%
16%
34%
7%
III Percentage increase/(decrease) in median remuneration of
employees in the financial year
The median remuneration of employees increased from ` 345,675 to ` 369,820, representing
an increase of 7%. While computing the increase in median remuneration, we have considered
employees as at March 31, 2016 and as at March 31, 2015
IV Number of permanent employees on the rolls of the Company There were 4,415 employees as on March 31, 2016
V Relationship between average increase in remuneration and
company performance
The average increase in employee remuneration during the financial year 2015-16 was 14.2%. While computing the increase in remuneration, we have excluded employees who are not eligible for increment.
The Company’s revenues grew by 5% and the net profit grew by 144% during the year as compared to the last fiscal. The aggregate increase in salary for executive directors was upto 10% and that of Key Managerial Personnel increased by 20%. The increase in salary was based on recommendation of the nomination and remuneration committee.
The Company follows a holistic and transparent performance review mechanism to ensure that the increase in remuneration is in line with its performance and industry benchmarks.
Amongst others, the below factors are considered while recommending increase in remuneration–
a. Planned and actual financial performance of the Companyb. Industry benchmarks including peer groups based on function and level of employeesc. Cost of living/inflationd. Competitive factors
The above measures enable the Company to attract and retain the best talent. The Company also uses a mix of fixed, variable and Stock based compensation on a mid-to long-term basis to align middle and senior management compensation to enhancing shareholder values.
Credibly Capable | Annual Report 2016116

Financial Report
Sl.
No.
Requirements Details Ratio
X times / %
VI Comparison of remuneration of Key Managerial Personnel
against performance of the Company
The total compensation paid to KMPs (including executive director) constituted 0.6% of the
net profits of the year. In comparison to the previous fiscal, this reduced by 50% against the
increase in revenues and profits of the Company by 5% and 144% respectively.
VII Variation in the market capitalisation of the Company, Price
Earnings (P/E) ratio and percentage increase in the market
quotation in comparison to the rate at which the Company
came out with the last public offer
The market capitalisation of the Company during the last fiscal increased from ` 94,680 mn
to ` 96,670 mn resulting in a growth of 2%. The P/E ratio decreased by 15.38% from March 31,
2015 to 26 as at March 31, 2016.
The closing price of the Company’s equity shares was ` 483.35 representing 307% increase
over the last public offering, ie IPO in March 2004, adjusted for 1:1 bonus in 2008.
VIII Average percentile increase in salaries of employees other than
managerial personnel and its comparison with the percentile
increase in managerial remuneration and justification thereof
The average increase in employee remuneration other than managerial personnel was
16.7%, which has been marginally higher than that for managerial personnel. The increase in
managerial remuneration is in line with the measures to attract and retain the best talent. The
Company also uses a mix of fixed, variable and Stock based compensation on a mid-to long-
term basis to align middle and senior management compensation to enhancing shareholder
values.
IX Comparison of remuneration of Key Managerial Personnel
against the performance of the Company
KMP Remuneration in ` Mn. Rem as a % of Net Pro!t
CMD
VC
CEO & Jt. MD
CFO
CS
16.02
15.63
30.85
15.74
6.09
0.2%
0.2%
0.4%
0.2%
0.1%
X Key parameters for variable component of remuneration
availed by Directors
The overall variable pay to Directors does not exceed 40% of the fixed pay. This enables the
Company to ensure that its Director remuneration is on par with global markets and in line
with retention plans.
During the financial year, none of the employees received remuneration in excess of the higher paid director.
We hereby affirm that the remuneration paid to the directors and Key Management Personnel is in line with the remuneration policy of the Company.
For and on behalf of the Board
Bengaluru Kiran Mazumdar-Shaw
April 26, 2016 Chairperson & Managing Director
(This space has been intentionally left blank)
Biocon Limited
117

Annexure 8 - Corporate Social Responsibility [Pursuant to Section 135 of Companies Act, 2013]
Biocon believes in making a difference to the lives of millions of people who are underprivileged. It promotes social and economic inclusion by ensuring that marginalized
communities have equal access to health care services, educational opportunities and proper civic infrastructure.
Your Company’s CSR activities are implemented through:
Biocon Foundation – Works towards the development and implementation of healthcare, education and infrastructure projects for the marginalized sections of
society
Biocon Academy - Aims to address the skill deficit in the biotechnology space.
External partners - Partner with reliable CSR players who work towards the development of society.
The CSR Vision of the Company is:
To promote social and economic inclusion by ensuring that marginalized communities have equal access to healthcare services, educational opportunities, and
proper civic infrastructure.
To create a globally competitive biotech ecosystem in India through skill development.
To bridge the gap of gender disparity in education, healthcare and employment.
To create a platform for promoting the rich art & culture of the country and sensitizing the communities to appreciate fine arts.
Visit http://www.biocon.com/biocon_csr_about_policy.asp for more details related to our CSR Policy.
CSR Committee
The CSR Committee of our Board provides oversight of CSR Policy and monitors execution of various activities to meet the set CSR objectives.
The members of the CSR Committee are-
a) Ms. Mary Harney, Chairperson
b) Dr. Vijay Kumar Kuchroo
c) Prof. Ravi Mazumdar
Financial details
The provisions pertaining to corporate social responsibility as prescribed under Section 135 of the Companies Act, 2013 are applicable to the Company. A summary of
the financial details as sought under the Companies Act, 2013 are as follows -
In ` mn
Particulars Amount
Average net profit before tax of the Company for last three financial years 4,065
Prescribed CSR expenditure (2% of the average net profit as computed above) 81
Details of CSR spent during the financial year :
Total amount to be spent for the financial year 81
Total amount spent 81
Total amount unspent if any Nil
The details of the amount spent during the financial year is detailed below:
In ` million
Sl.
No.
CSR project/program
name
Sector Location of project/
program
Amount
outlay
(budget)
Amount
spent on
the projects
or programs
Cumulative
spend up to
the reporting
period
Amount spent:
direct/through
external agency
(i) Expenditure on Projects &
Programs
1 ARY Primary Healthcare
Clinics
Healthcare and medical
facilities
Karnataka - At nine Arogya
Raksha Yojana Primary
Healthcare Outpatient Clinics
7.03 10.00 10.00 Biocon Foundation
2 Cancer Screening Program Healthcare and medical
facilities
Various districts in Karnataka 1.85 1.87 1.87 Biocon Foundation
3 E-Health - Rajasthan &
Karnataka
Healthcare and medical
facilities
Rajasthan & Karnataka 5.52 2.52 2.52 Direct and Biocon
Foundation
4 Chinnara Ganitha Improving quality of
education
Various districts in Karnataka 3.79 4.23 4.23 Biocon Foundation
5 Project Once Clean Drinking Water and
Rain water harvesting
Bengaluru (Huskur) 1.53 1.01 1.01 Biocon Foundation
6 Women’s Hostel Rural development Haliyal, Karnataka 1.53 0.79 0.79 Biocon Foundation
Credibly Capable | Annual Report 2016118
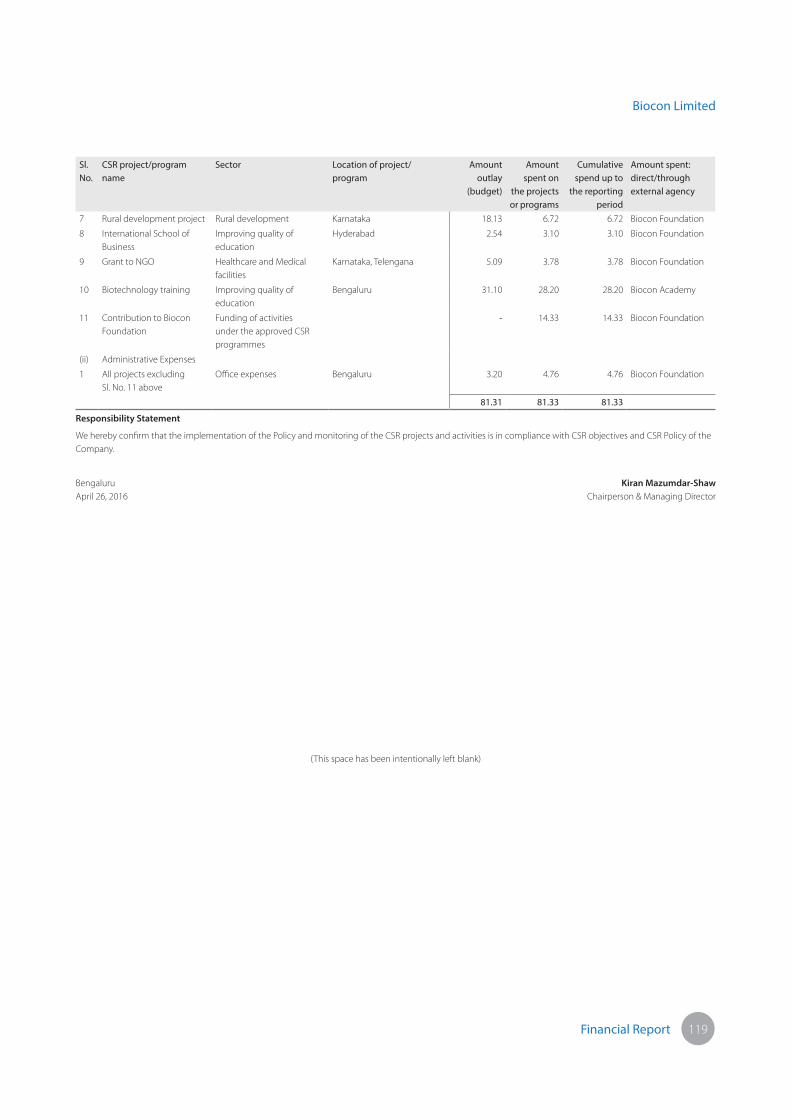
Financial Report
Sl.
No.
CSR project/program
name
Sector Location of project/
program
Amount
outlay
(budget)
Amount
spent on
the projects
or programs
Cumulative
spend up to
the reporting
period
Amount spent:
direct/through
external agency
7 Rural development project Rural development Karnataka 18.13 6.72 6.72 Biocon Foundation
8 International School of
Business
Improving quality of
education
Hyderabad 2.54 3.10 3.10 Biocon Foundation
9 Grant to NGO Healthcare and Medical
facilities
Karnataka, Telengana 5.09 3.78 3.78 Biocon Foundation
10 Biotechnology training Improving quality of
education
Bengaluru 31.10 28.20 28.20 Biocon Academy
11 Contribution to Biocon
Foundation
Funding of activities
under the approved CSR
programmes
- 14.33 14.33 Biocon Foundation
(ii) Administrative Expenses
1 All projects excluding
Sl. No. 11 above
Office expenses Bengaluru 3.20 4.76 4.76 Biocon Foundation
81.31 81.33 81.33
Responsibility Statement
We hereby confirm that the implementation of the Policy and monitoring of the CSR projects and activities is in compliance with CSR objectives and CSR Policy of the
Company.
Bengaluru Kiran Mazumdar-Shaw
April 26, 2016 Chairperson & Managing Director
(This space has been intentionally left blank)
Biocon Limited
119

Annexure 9 - Extract of Annual Return as on the !nancial year ended on March 31, 2016FORM NO. MGT 9
[Pursuant to Section 92(3) of the Companies Act, 2013 and Rule 12(1) of the Companies (Management and Administration) Rules, 2014]
I. Registration and Company Details:
1 CIN L24234KA1978PLC003417
2 Registration Date November 29, 1978
3 Name of the Company BIOCON LIMITED
4 Category / Sub-Category of the Company Category : Company Limited by Shares
Sub Category : Indian Non-Government Company
5 Address of the Registered office and contact details 20th K.M. Hosur Road, Hebbagodi
Bengaluru – 560 100
Contact : Tel +91 80 2808 2037
E-mail : [email protected]
6 Whether listed company Yes
7 Name, Address and Contact details of Registrar and Transfer Agent, if any Karvy Computershare Private Limited,
Plot 31-32, Karvy Selenium, Tower B,
Gachibowli, Financial District,
Nanakramguda, Hyderabad – 500 032
Contact : Tel +91 40 23312454;
E-mail : [email protected]
II. Principal Business activities of the Company:
Sl.
No.
Name and Description of main products / services NIC Code of the Product/ service % to total turnover of the
Company
1 Manufacture of pharmaceuticals, medicinal chemical and botanical products 21 100.00%
III. Particulars of Holding, Subsidiary and Associate companies
Sl.
No.
Name and Address of the Company CIN/GLN Holding/
Subsidiary
% of shares held Applicable
1 Syngene International Limited L85110KA1993PLC014937 Subsidiary 73.54% * 2(87)
2 Biocon Research Limited U73100KA2008PLC046583 Subsidiary 100% 2(87)
3 Biocon Pharma Limited U24232KA2014PLC077036 Subsidiary 100% 2(87)
4 Biocon SA -NA- Subsidiary 100% 2(87)
5 Biocon SDN. BHD. -NA- Subsidiary 100% 2(87)
6 Neo Biocon FZ LLC -NA- Subsidiary 51% 2(87)
7 Biocon Academy U80301KA2013NPL072272 Subsidiary 100% 2(87)
8 Biocon Biologics Limited -NA- Subsidiary 100% 2(87)
9 Biocon Pharma Inc -NA- Subsidiary 100% 2(87)
10 Biocon FZ LLC -NA- Subsidiary 100% 2(87)
*Including 0.93% held by Biocon Research Limited
IV. Share holding Pattern (equity share capital breakup as percentage of total equity)
1. Category-wise Share Holding
Category
Code
Category of Shareholder No. of Shares Held at the beginning of the year
31/03/2015
No. of Shares held at the end of the year
31/03/2016
%
Change
during
the year
Demat Physical Total % of Total
Shares
Demat Physical Total % of Total
shares
(A) Promoter and Promoter Group
(1) Indian
(a) Individual/HUF 80,847,694 - 80,847,694 40.42 79,839,766 - 79,838,266 39.92 0.50
(b) Central Govt/State Govt(s) - - - - - - - - 0.00
(c) Bodies Corporate - - - - - - - - 0.00
(d) Financial Institutions/Banks - - - - - - - - 0.00
(e) Others - - - - - - - - 0.00
Sub-Total (A1) 80,847,694 - 80,847,694 40.42 79,839,766 - 79,838,266 39.92 0.50
Credibly Capable | Annual Report 2016120

Financial Report
Category
Code
Category of Shareholder No. of Shares Held at the beginning of the year
31/03/2015
No. of Shares held at the end of the year
31/03/2016
%
Change
during
the year
Demat Physical Total % of Total
Shares
Demat Physical Total % of Total
shares
(2) Foreign
(a) Individuals (NRIs/Foreign Individuals) 1,665,558 - 1,665,558 0.83 2,058,986 - 2,058,986 1.03 -0.20
(b) Bodies Corporate 39,535,194 - 39,535,194 19.77 39,535,194 - 39,535,194 19.77 -
(c) Institutions - - - - - - - - -
(d) Qualified Foreign Investor - - - - - - - - -
(e) Others - - - - - - - - -
Sub-Total A(2) 41,200,752 - 41,200,752 20.60 41,594,180 - 41,594,180 20.80 -0.20
Total A=A(1)+A(2) 122,048,446 - 122,048,446 61.02 121,433,946 - 121,432,446 60.72 -0.31
(B) Public Shareholding
(1) Institutions
(a) Mutual Funds/UTI 6,930,213 - 6,930,213 3.47 5,647,569 - 5,647,569 2.82 -
(b) Financial Institutions/Banks 9,815,657 - 9,815,657 4.91 5,044,830 - 5,044,830 2.52 -
(c) Central Government/State
Government(s)
- - - - - - - 0.00 0.00
(d) Venture Capital Funds - - - - - - - 0.00 0.00
(e) Insurance Companies - - - - - - - 0.00 0.00
(f ) Foreign Institutional Investors 21,460,044 - 21,460,044 10.73 27,264,626 - 27,264,626 13.63 2.90
(g) Foreign Venture Capital Investors - - - - - - - 0.00 0.00
(h) Qualified Foreign Investor - - - - - - - 0.00 0.00
(i) Others - - - - - - - 0.00 0.00
Sub-Total B(1) 38,205,914 - 38,205,914 19.10 37,957,025 - 37,957,025 18.98 -0.12
(2) Non-Institutions
(a) Bodies Corporate 5,291,631 - 5,291,631 2.65 2,889,920 - 2,889,920 1.44 -1.20
(b) Individuals
(i) Individuals holding nominal
share capital upto ` 2 lakh
16,081,258 109212 16,190,470 8.10 16,468,860 107,672 16,576,478 8.29 0.19
(ii) Individuals holding nominal
share capital in excess of ` 2 lakh
8,509,770 205,698 8,715,468 4.36 10,931,566 205,698 11,137,264 5.57 1.21
(c) Others
Clearing Members 240,435 - 240,435 0.12 138,067 - 138,067 0.07 -0.05
Non-resident Indians 997,344 172,394 1,169,738 0.58 1,358,428 172,394 1,530,822 0.77 0.18
Trusts 8,137,898 - 8,137,898 4.07 8,337,978 - 8,337,978 4.17 0.10
(d) Qualified Foreign Investor - - - - - - - - -
Sub-Total B(2) 39,258,336 487,304 39,745,640 19.87 40,124,819 485,764 40,610,529 20.31 0.43
Total B=B(1)+B(2) 77,464,250 487,304 77,951,554 38.98 78,081,844 485,764 78,567,554 39.28 0.31
Total (A+B) : 199,512,696 487,304 200,000,000 100.00 199,515,790 485,764 200,000,000 100.00 -
(C) Shares held by custodians for GDRs
& ADRs
- - - - - - - - -
GRAND TOTAL (A+B+C) : 19,951,2696 487,304 20,000,0000 100.00 199,515,790 485,764 200,000,000 100.00 -
2. Shareholding of Promoters
Sl.
No.
Shareholder’s NameShareholding at the beginning of the year Shareholding at the end of the year
% change in
shareholding
during the yearNo. of Shares % of total
Shares of the
Company
% of Shares
Pledged /
encumbered to
total shares
No. of Shares % of total
Shares of the
company
% of Shares
Pledged /
encumbered to
total shares
1 Kiran Mazumdar-Shaw 79,287,564 39.64 - 79,287,564 39.64 - -
2 Glentec International Limited 39,535,194 19.77 - 39,535,194 19.77 - -
3 John M M Shaw 1,407,558 0.70 - 1,407,558 0.70 - -
4 Ravi Rasandra Mazumdar 565,014 0.28 - 565,014 0.28 - -
5 Yamini R Mazumdar 552,202 0.28 0.03 550,702 0.28 0.03 -
6 Dev Mazumdar 84,914 0.04 - 86,414 0.04 - -
Total 121,432,446 60.72 0.03 121,432,446 60.72 0.03 -
Biocon Limited
121

3. Change in Promoters’ Shareholding
Sl.
No.
Particulars Shareholding at the
beginning of the year
Cumulative Shareholding
during the year
No. of shares % of total shares of
the Company
No. of shares % of total shares of
the Company
1 KIRAN MAZUMDAR-SHAW
At the beginning of the year 79,287,564 39.64 79,287,564 39.64
Transfer/ Sale of shares during the year - - - -
At the end of the year 79,287,564 39.64
2 GLENTEC INTERNATIONAL
At the beginning of the year 39,535,194 19.77 39,535,194 19.77
Transfer/ Sale of shares during the year - - - -
At the end of the year 39,535,194 19.77
3 JOHN SHAW
At the beginning of the year 1,407,558 0.70 1,407,558 0.70
Transfer/ Sale of shares during the year - - - -
At the end of the year 1,407,558 0.70
4 RAVI RASENDRA MAZUMDAR
At the beginning of the year 565,014 0.28 565,014 0.28
Transfer/ Sale of shares during the year - - - -
At the end of the year 565,014 0.28
5 YAMINI R. MAZUMDAR
At the beginning of the year 552,202 0.28 552,202 0.28
Transfer/ Sale of shares during the year (1,500) 0.00 550,702 0.28
At the end of the year 550,702 0.28
6 DEV MAZUMDAR
At the beginning of the year 84,914 0.04 84,914 0.04
Transfer/ Sale of shares during the year 1,500 0.00 83,414 0.04
At the end of the year 83,414 0.04
4. Shareholding pattern of top ten shareholding (other than Director, promoter and holding of GDRs and ADRs)
Sl.
No.
For each of the top 10 Shareholding Shareholding at the beginning of the
Year 31/03/2015
Cumulative Shareholding during the Year
31/03/2016
No. of Shares % of total shares of
the Company
No. of Shares %of total share of
the Company
1 LIFE INSURANCE CORPORATION OF INDIA
At the beginning of the year 6,248,660 3.12 6,248,660 3.12
Transfer/ Sale of shares during the year (3,553,735) -1.78 2,694,925 1.35
At the end of the year 2,694,925 1.35
2 FRANKLIN TEMPLETON INVESTMENT FUNDS
At the beginning of the year 5,406,196 2.70 5,406,196 2.70
Transfer/ Sale of shares during the year 642,392 0.32 6,048,588 3.02
At the end of the year 6,048,588 3.02
3 RELIANCE CAPITAL TRUSTEE CO. LTD A/C RELIANCEPHARM
At the beginning of the year 2,800,218 1.40 2,800,218 1.40
Transfer/ Sale of shares during the year (348,200) -0.17 2,880,218 1.44
At the end of the year 2,452,018 1.23
4 TEMPLETON DEVELOPING MARKETS TRUST
At the beginning of the year 2,497,396 1.25 2,497,396 1.25
Transfer/ Sale of shares during the year - - - -
At the end of the year 2,497,396 1.25
5 SWISS FINANCE CORPORATION (MAURITIUS) LIMITED
At the beginning of the year 401,000 0.20 401,000 0.20
Transfer/ Sale of shares during the year 1,560,900 0.78 1,961,900 0.98
At the end of the year 1,961,900 0.98
Credibly Capable | Annual Report 2016122

Financial Report
Sl.
No.
For each of the top 10 Shareholding Shareholding at the beginning of the
Year 31/03/2015
Cumulative Shareholding during the Year
31/03/2016
No. of Shares % of total shares of
the Company
No. of Shares %of total share of
the Company
6 BIRLA SUN LIFE INSURANCE COMPANY LIMITED
At the beginning of the year 1,300,860 0.65 1,300,860 0.65
Transfer/ Sale of shares during the year (1,300,860) -0.65 - -
At the end of the year - -
7 SBI LIFE INSURANCE CO. LTD
At the beginning of the year 1,291,918 0.65 1,291,918 0.65
Transfer/ Sale of shares during the year (1,271,918) -0.64 20,000 0.01
At the end of the year 20,000 0.01
8 BIRLA SUN LIFE TRUSTEE COMPANY PRIVATE LIMITED A/C
At the beginning of the year 1,227,308 0.61 1,227,308 0.61
Transfer/ Sale of shares during the year (219,448) -0.11 1,007,860 0.50
At the end of the year 1,007,860 0.50
9 TEMPLETON GLOBAL INVESTMENT TRUST - TEMPLETONEMERG
At the beginning of the year 1,020,399 0.51 1,020,399 0.51
Transfer/ Sale of shares during the year - - - -
At the end of the year 1,020,399 0.51
10 UTI-UNIT SCHEME FOR CHARITABLE AND RELIGIOUS TRUST
At the beginning of the year 857,845 0.43 857,845 0.43
Transfer/ Sale of shares during the year 161,732 0.08 1,019,577 0.51
At the end of the year 1,019,577 0.51
V. Shareholding of Directors and Key Managerial Personnel:
Sl.
No.
For each of the Directors and KMP Shareholding at the beginning of the
year
Cumulative Shareholding during the year
No. of Shares % of total shares of
the Company
No. of Shares % of total share of
the Company
1 ARUN SURESH CHANDAVARKAR
At the beginning of the year 2,200,000 1.10 2,200,000 1.10
Date wise Increase/Decrease - - - -
At the end of the year 2,200,000 1.10
2 RAVI RASENDRA MAZUMDAR
At the beginning of the year 565,014 0.28 565,014 0.28
Date wise Increase/Decrease - - - -
At the end of the year 565,014 0.28
3 KIRAN MAZUMDAR-SHAW
At the beginning of the year 79,287,564 39.64 79,287,564 39.64
Date wise Increase/Decrease - - - -
At the end of the year 79,287,564 39.64
4 JOHN SHAW
At the beginning of the year 1,407,558 0.70 1,407,558 0.70
Date wise Increase/Decrease - - - -
At the end of the year 1,407,558 0.70
(This space has been intentionally left blank)
Biocon Limited
123

5. Indebtedness
Indebtedness of the Company including interest outstanding/accrued but not due for payment
In ` Million
Secured Loans
excluding deposits
Unsecured Loans Deposits Total Indebtedness
Indebtedness at the beginning of the financial year
i) Principal Amount
ii) Interest due but not paid
iii) Interest accrued but not due
-
-
-
815
-
-
-
-
-
815
-
-
Total (i+ii+iii) 815 - 815
Change in Indebtedness during the financial year
- Addition
- Reduction
1,328
-
2,853
1,300
-
-
4,181
1,300
Net Change 1,328 1,553 - 2,881
Indebtedness at the end of the financial year
i) Principal Amount
ii) Interest due but not paid
iii) Interest accrued but not due
1,328
-
-
2,368
-
-
-
-
-
3,696
-
-
Total (i + ii + iii) 1,328 2,368 - 3,696
6. Remuneration of Directors and Key Managerial Personnel
A. Remuneration to Managing Director, Whole-time Directors and/or Manager
Sl.
No.
Particulars of Remuneration Name of MD/WTD/ Manager Total Amount
1 Gross salary
(a) Salary as per provisions contained in section 17(1) of the Income-tax Act, 1961
(b) Value of perquisites u/s 17(2) Income-tax Act, 1961(c) Profits in lieu of salary under Section 17(3) Income- tax Act, 1961
Kiran Mazumdar Shaw
(CMD)
John Shaw
(WTD)
Arun S Chandavarkar
(CEO & Jt. MD)
61.49
1.01-
15.99
0.03-
15.60
0.03-
29.90
0.95-
2 Stock Option - - - -
3 Sweat Equity - - - -
4 Commission- as % of profit- others, specify…Others, please specify*
-
-
-
-
- -
5 Total (A) 16.02 15.63 30.85 62.50
Ceiling as per the Act 808.70
* Employee stock compensation expense allocable to CEO & Jt. MD is ` 4 mn (March 31, 2015 - Nil) which is not included in the remuneration disclosed above.
B. Remuneration to other directors:
Sl.
No.
Particulars of Remuneration Name of Directors
1. Independent Directors Charles L
Cooney
Suresh N
Talwar
Bala S
Manian
Mary
Harney
Russell
walls
Daniel M
Bradbury
Jeremy M
Levin
Vijay K
Kuchroo
Total
Amount
• Fee for attending board committee meetings
0.20 0.20 0.20 0.50 0.50 0.50 0.50 0.40 3.00
• Commission 1.66 1.02 1.28 2.46 3.56 2.21 2.60 1.89 16.68
• Others, please specify - - - - - - - - -
Total (1) 1.86 1.22 1.48 2.96 4.06 2.71 3.10 2.29 19.68
Other Non-Executive Directors
Ravi
Mazumdar
• Fee for attending board committee meetings
0.50 0.50
• Commission - -
• Others, please specify - -
Total (2) 0.50 0.50
Total (B)=(1+2) 20.18
Total Managerial
Remuneration (A+B)82.68
Overall Ceiling as per the Act 889.68
Credibly Capable | Annual Report 2016124

Financial Report
C. Remuneration to key managerial personnel other than MD/ Manager/ Whole-time Director
Sl.
No.Particulars Key Managerial Personnel
CFO CS Total
1 Gross salary 15.71 6.06 21.77
(a) Salary as per provisions contained in Section 17(1) of the Income-tax Act, 1961 0.03 0.03 0.06
(b) Value of perquisites u/s 17(2) Income-tax Act, 1961
(c) Profits in lieu of salary under section 17(3) Income-tax Act, 1961
2 Stock Option - - -
3 Sweat Equity - - -
4 Commission
- as % of profit
- others, specify…
- - -
5 Others, please specify*
Total 15.74 6.09 21.83
*Employee stock compensation expense allocable to KMPs (CFO & CS) for the Restricted Stock Units under the RSU Plan, 2015 is ` 6 mn (March 31, 2015 - Nil) which is
not included in the remuneration disclosed above.
Note: Salary of CEO is not included above, since he is Joint Managing Director and details are already included in Section (A) above
7. Penalties/ Punishment/ Compounding of O#ences:
There were no material penalties/punishment/compounding of offences for the year ended March 31, 2016.
(This space has been intentionally left blank)
Biocon Limited
125

(This space has been intentionally left blank)
Management Discussion and AnalysisIndustry Outlook
The Global Pharmaceutical Industry
The unprecedented global expansion in access to healthcare over the past ten years – marked by hundreds of millions of people in low- and middle-income countries
getting access via government programs, rising incomes and a reduction in the uninsured US population - is expected to significantly increase the volume of medicines
consumed.
Medicine use in 2020
The global consumption of medicines is expected to reach 4.5 trillion doses by 2020 (up 24% from 2015). The largest pharmaceutical-consuming countries will be
pharmerging markets; two-thirds of all global medicines will comprise generics following an expansion of broad-based health system. Developed markets will continue
to account for a majority of medicine spending due to higher unit prices and new medicine introductions that enhance clinical benefit for patients. The use of medicines
in 2020 could include 943 New Active Substances introduced across the previous 25 years, with new medicines largely comprising specialty and biologics.
Over 50% of the world’s population will consume more than 1 dose per person per day of medicines, up from one third of the world in 2005, driven by
countries with large populations such as India, China, Brazil and Indonesia.
Projected trends, 2016-2020
Research and development-led innovation and a range of technology-enabled transformations, expanding the evidence-basis for interventions and bringing
measurable health outcome improvements by 2020.
Small molecule patent expiries resulting in a larger impact across 2016-2020 than in the preceding five years (2011-2015).
Increased impact from biologics.
Cancer treatments representing the largest category of 225 new medicines expected to be introduced in the next five years; over 90% of projected new cancer
treatments to be targeted therapies (using a cancer cell process, mechanism or genetic marker to select or deliver treatment); one-third could use a biomarker;
besides, an estimated third of cancer treatments could target rare cancers (deemed orphan diseases).
Medicine spend trends, 2020
63% 52% 85%
Contribution of developed markets to global
spending
Proportion of original brands in the global spend Proportion of global spending towards treating non-
communicable ailments
Spending growth drivers, 2015-2020 (USD bn)
$887
$182 $1,069
$349$1,400
-$1,430Constant US$ CAGR
2011-2015 6.2%
2010 2011-2015 2015 2016-2020 2020
Constant US$ CAGR
2016-2020 4.7%
Spending Growth
Source: IMS Health, Market Prognosis, September 2015Note: Growth in 2011-2015 was reduced by USD 100 bn and in 2016-2020 increased by USD 26 bn due to exchange rate effects.
Credibly Capable | Annual Report 2016126

Financial Report
Speciality medicines and leading therapy areas, 2020
28%
Specialty Share of Spending 2020 US$
Global Spending
$1.4 Tn
36%
Developed
$850-880 Bn
12%
Pharmerging
$360-390 Bn
Oncology
Leading Specialty Therapy Areas
Autoimmune
Viral Hepatitis
Immunosuppressants
HIV Antivirals
Immunostimulants
Interferons
Erythropoietins
Macular digeneration
9-12%
11-14%
7-10%
11-14%
1-4%
2-5%
1-4%
0-3%
6-9%
$100-120 Bn
CAGR
2016-2020
*Sales in
2020
$55-65 Bn
$45-55 Bn
$20-30 Bn
$20-30 Bn
$15-18 Bn
$7-9 Bn
$7-9 Bn
Informatics, October 2015
$6-8 Bn
*Sales represented in constant US dollars.Source: IMS Health, IMS Therapy Prognosis, Sept. 2015; IMS institute for HealthcareNote: Leading traditional therapy areas shown for 8 developed countries and 6 pharmerging countries
Biologics and biosimilars
Globally, there is an increasing role of biologics in addressing unmet medical needs. These targeted molecules impact underlying disease patho-physiology in unique
ways, providing safer and effective treatments than small molecule therapies.
Biological products comprise vaccines, blood and blood components, allergenics, somatic cells, gene therapy, tissues and recombinant therapeutic proteins. Biologics
can comprise sugars, proteins, nucleic acids or complex combinations of these substances, or may be living entities like cells and tissues. Gene-based and cellular
biologics, for example, are often at the forefront of biomedical research.
In contrast to most drugs that are chemically synthesised with known structures, most biologics are produced in a living system like a microorganism or in cells (plant
or animal) and are therefore complex mixtures not easily identified or characterised. Biological products often represent the cutting-edge of biomedical research,
potentially offering the most effective means to treat a variety of medical illnesses and conditions that presently have no other available treatment. These are big and
complex molecules, often 200 to 1,000 times the size of common small-molecule drugs. For example: aspirin, a small-molecule drug, is made of up 21 atoms, whereas
the biologic drug etanercept, which treats rheumatoid arthritis and plaque psoriasis, comprises more than 20,000 atoms.
Biosimilar medicines represent follow-on versions of original biological medicines designed to treat the same diseases as the innovator’s product. Biosimilars can be
developed during the period in which the originator product is protected by patent exclusivity, but can be marketed only after the patent protecting the originator
product has expired.
Biologics and Biosimilars: Position in the global pharmaceutical space
Given that biologics account for an increasing market presence, the future of the generic pharma industry is likely to be tied increasingly to these products. Biosimilar
medicines account for an increasingly important subset of this global market. By competing with original biologic medicines across a growing range of therapy areas,
biosimilars offer stakeholders - payers, physicians and patients - a greater choice in treatment options.
2016 marks a full decade since the approval of the first biosimilar medicine in Europe. The approval of Sandoz’s human growth hormone (HGH) from the European
Medical Agency (EMA) in April 2006 satisfied regulators that the biosimilar medicine offered a safe and efficacious alternative to the original biologic. In so doing, the
treatment paved the way for other biosimilar medicines to enter the market across a range of therapy areas. Ten years on, it is clear that biosimilar products are set to play
a vitally important role in the virtuous circle of pharmaceutical innovation and healthcare system sustainability.
The US biosimilars landscape is evolving towards significant promise with the USFDA defining the regulatory approval pathway for biosimilars. Since biosimilars present
a cost-effective counter-response to the significant price inflation in old and innovative pharmaceuticals, political pressure is building on the FDA to validate the 351k
pathway. Besides, recent progress has been made in removing regulatory, legal and commercial roadblocks for these life-saving and cost-saving solutions.
The opportunity
The size of the biologics market for those products losing patent exclusivity between 2015 and 2020 is significant, including products in the two major therapy areas of
inflammation (auto-immune) and diabetes.
We have seen across the EU that the use of erythropoietins (EPOs), granulocyte-colony stimulating factors (G-CSFs) and human growth hormone (HGH) have all increased
following the launch of biosimilar versions. This increase in usage was heavily driven by the availability of biosimilars as well as other factors, suchas expanded indications.
Biocon Limited
127

Notably, in markets where access to these molecules was previously restricted, the average uptake of EPOs increased by over 250% following the introduction of
biosimilars – primarily driven by the presence of treatment options not previously available.
We expect the same to play out for insulins and complex biologics like monoclonal antibodies.
Besides the developed markets like the US and EU, markets in the developing world also offer a great opportunity for biosimilar developers. Making available these
treatments to a patient pool who earlier either did not have access or had restricted access to these medicines will lead to better health outcomes in these geographies.
It will also result in expansion of volumes with governments providing patients with greater access to these drugs.
Estimates suggest that the global biosimilars market could reach USD 25-35 bn by 2020. The Global & USA Biosimilar Market Analysis to 2021 report indicates a growing
potential for biosimilars by 2019 when 50% of the biologics market is forecast to belong to off-patent drugs. With the approval of the first biosimilar in the US in 2015 and
the expected patent expiration of 12 biologics by 2020, biosimilars are expected to account for 4% to 10% of the biologics market by 2020.
Therefore, there is tremendous potential to be tapped from the biosimilar opportunity.
Pressure to
curtail
healthcare
expenditure
Growing
demand due
to their cost
e!ectiveness
Optimism
for
biosimilars
Increasing
number of
o!-patented
drugs
Positive
outcome in
the ongoing
clinical trials
Potential savings from the use of Biosimilars and balancing of healthcare budgets
The emergence of a greater range of highly competitive biosimilar medicines will generate savings that can be reinvested in healthcare provision, while at the same time
driving pharmaceutical innovation that ultimately improves outcomes. Biosimilar medicines could empower payers to make significant savings across the foreseeable
future.
Healthcare systems could realise savings of more than €10 billion in the EU5 alone between 2016 and 2020, simply based on direct competition for the originator
molecule. The cumulative savings over the next five years in the EU5 and US could range from €49 billion to €98 billion.
The biosimilar commercial success represents an important ‘safety valve’ in allowing US and EU healthcare budgets to reimburse premium innovative therapies like
cancer immunotherapies in the wake of an ageing population. Even as cancer immunotherapy costs are only just beginning, many patients in developed countries
cannot afford or cannot access novel biologic therapies, leading to a number of bankruptcies among US cancer patients and 50% under-treatment of severe rheumatoid
EU arthritis patients. (Source: Citi Research Report)
US Healthcare spend appears unsustainable given macro-economic pressures
Source: Citi Research Report
Credibly Capable | Annual Report 2016128

Financial Report
Positives for the biosimilars space
Biologic products represent ~23% of the US pharmaceutical market (IMS data for 2015), or USD 103 bn of a total market size of USD 440 bn. Given that biologics are
increasing their presence, generic pharma industry growth could be increasingly tied to these biologic products.
The passage of the Biologics Price Competition and Innovation (BPCI) Act paved the way for a biosimilar pathway in the US. In concept, BPCI is similar to the Hatch-
Waxman Act, potentially leading to the birth of a full-blown biosimilar industry, addressing the need to bring biosimilars to the market quickly with exclusivity periods
for the innovator biologic.
The release of the FDA’s final guidance on biosimilars in April 2015 included positives for biosimilar developers: the potential to extrapolate clinical data across
indications, the need for comparative clinical studies (may not be required in some cases), and interchangeability potential, which could be addressed in a separate
guidance document in 2016. The guidance addressed scientific considerations, quality considerations and biosimilars Q&A, which represent regulatory parts of the
equation.
The CRO space
The global pharmaceutical sector outsources an increasing quantum of services from competitive contract research organizations (CROs) and contract manufacturing
organizations (CMOs). The result is that contract research and manufacturing services (CRAMS) has emerged as one of the fastest growing segments of the global
pharmaceutical and biotechnology industry.
CROs assist pharmaceutical, biotechnology, biopharmaceuticals, government institutions, foundations and universities in R&D related mainly to new drug discovery and
drug development. CRO services span the entire R&D range: from New Molecular Entity (NME) discovery to development to manufacture.
The combination of staggering investments by large pharmaceutical companies, coupled with low research productivity, are incentivising these pharmaceutical entities
to moderate manufacturing costs by outsourcing research and manufacturing activities to low-cost global destinations (India being one).
India has emerged as one of the leading economical quality pharmaceutical manufacturers for a number of global players. Outsourcing to India offers significant benefits
over mature pharmaceutical hubs in North America and Europe. India’s model has become increasingly relevant in the prevailing genericising environment, incentivising
the engagement of Indian pharmaceutical players in research and related manufacture.
Opportunities and prospects
In 2014, global R&D expenditure by the pharmaceutical industry was approximately USD 139 bn; USD 105 bn could have been potentially outsourced (Source: Frost &
Sullivan).
The outsourcing of CRO discovery services in 2013 was estimated at 52% of the global pharmaceutical and biotech industry; this was poised to grow to 65.7% in 2015.
This outsourcing is estimated to grow from USD 14.7 bn in 2014 to USD 22.7 bn in 2018 (Source: IQ4I Report).
The CRO development services outsourcing in 2014 was estimated at 27.3% of the potential outsourcing market for development services; this is likely to grow to 38.7%
in 2019. This outsourcing is estimated to grow from USD 28.8 bn in 2014 to USD 44.6 bn in 2018 (Source: Frost & Sullivan).
Why outsource?
A combination of rising NME development costs, R&D productivity decline and constrained R&D budgets has accelerated the search for alternative models.
The Costs of Drug Development over the past decades
Source: PhRMA 2016 Profile
DiMasi JA, Grabowski HG, Hansen RW. Innovation in the pharmaceutical industry: new estimates of R&D costs. J Health Economics 2016: 47:20-33.
Overall trend in R&D e$ciency (in*ation-adjusted)
Source: Diagnosing the decline in pharmaceutical R&D efficiency, Scannell et al, Nature
Reviews drug discovery Vol. 11
Biocon Limited
129

Why do companies outsource Key criteria for selecting an outsourcing partner
Others, 2%To reduce
Company size, 7%
Lifecycle
management, 9%
Temporary lack of
capacity, 16%
Company is
virtual, 30%
To focus on core
competencies, 36%
0 1 2 3 4 5
Geography/Proximity
Size of CSP
One Stop Setup
References
Innovation
Rapid Availability
Speci!c technology
Process Optimization
Value added services
Relationships
Cost
Financial Stability
Timelines
GMP
Regulatory Inspection History
Con!dentiality
Consistency of Performance
Quality
Rating of scale of 1 to 5
4.81
4.77
4.68
4.65
4.62
4.51
4.44
4.38
4.21
4.11
4.07
4.04
3.96
3.82
3.79
3.54
3.4
3.31
Source: Contract Pharma, 2014 Annual Outsourcing Survey
The Indian Pharmaceutical Industry
The Indian pharmaceutical industry is the largest provider of cost-effective generic medicines to the developed world. India leads pharmaceutical exports to the world,
riding a range of medicine exports and has probably the largest number of USFDA approved pharmaceutical manufacturing facilities. India is the largest global provider
of generic drugs, accounting for 20% of global exports in terms of volume. Branded generics constituted nearly 70-80% of the domestic market. India’s long-term
prospects appear promising; the Indian pharmaceutical industry is likely to emerge among the top 10 global markets by value by 2020 (Source: PwC-CII).
The Indian Biosimilars opportunity
Biosimilars have been available in India since the early 2000s. While Indian firms launched a few products in the domestic market, they could not make a meaningful
global mark on account of the need for sizable investments, longer development tenures, manufacturing complexity and characterization. This segment of India’s
pharmaceutical industry comprises a few serious players like Biocon readying to address the large global opportunity in the next few years.
Company Review
Biocon is a biopharmaceutical enterprise across the sectoral value chain focused on developing affordable products and services that enhance accessibility for patients
worldwide.
The Company is organized into the following strategic business units:
Small Molecules
a) APIs
b) Generic
Formulations
Research
Services
(Syngene)
Biosimilars
(Insulins, MAbs &
other biologics)Strategic
Business
Units
Branded
Formulations
Novel
Molecules
On the back of an impeccable regulatory compliance track record, the Company aspires to establish its identity as an integrated biotechnology enterprise driven by
discovery, research and development. In FY16, the Company undertook a restructuring of its legal entities to align with its strategic businesses units, which could unlock
enhanced value from the business units. All of the Company’s biosimilar assets will be consolidated under the new legal entity Biocon Biologics Limited, incorporated
in the United Kingdom as a subsidiary of Biocon Limited, India. United Kingdom was the identified destination given a robust ecosystem for high-end research and
innovation, investor-friendly climate and geographical proximity to key global markets.
Credibly Capable | Annual Report 2016130

Financial Report
A detailed analysis of our business segments is indicated hereunder:
Biopharmaceuticals
This segment comprises two businesses - biopharma and branded formulations - focussing on our core therapeutic areas of Metabolics, Oncology and Auto-Immune
indications. The biopharma business accretes revenues from the sale of small molecule APIs, generic formulations, biosimilars and associated licensing while branded
formulation accretes revenues from sale of finished dosages.
Small Molecule APIs and Generic Formulations
Our small molecule vertical continues to contribute significant revenues. Our strength in this business is derived from our rich experience in chronic therapeutic care,
state-of-the-art fermentation technology platform, product quality, broad customer base and a consistent regulatory compliance record.
We are one of the leading producers of generic statin and immunosuppressant APIs in India, leveraging their myriad applications.
The business encountered pricing headwinds for generic APIs during the fiscal under review. A declining dependence on heavily genericised small molecule APIs by
commercialising new APIs and extending the generic formulations pipeline continue to be a priority. We continue to focus on developing complex molecules in APIs
and formulation spaces by leveraging our rich biologics knowledge. Our product pipeline comprises ‘difficult-to-make’ (read technology-intensive) molecules that
address the demand emanating from emerging and developed markets in our core therapeutic areas.
Over the long-term, we aim to leverage cost and supply chain efficiencies by emerging as a vertically-integrated player in the generic formulations space. Our endeavour
in this regard was strengthened by the acquisition of a USFDA-approved potent API manufacturing unit in Vishakhapatnam. We intend to continue investing financial
and people resources in this facility to manufacture complex oncology products that support vertical integration in generic formulations and address the growing
demand for potent APIs. The work on the greenfield generic oral solid dosage facility is presently in full swing; we expect this facility to be operational in 2017. We will
seek third parties for certain APIs and formulations for our regulatory filings.
We strengthened our pipeline by filing dossiers with multiple global regulatory agencies in FY16. We filed a couple of USDMFs in FY16 and received CEP for one of
our products in the EU. We made two ANDA filings in FY16 and acquired an ANDA dossier for Simvastatin from a third party, enriching our nascent US pipeline. We
strengthened our market authorisation applications portfolio in the European Union and received our first generic formulation approval in the European Union (EU) for
Rosuvastatin in FY16.
Biosimilars
Biocon possesses one of the largest global biosimilars portfolios, spanning human insulin/insulin analogues, monoclonal antibodies and other biologics with an
addressable market size of ~USD 60 bn. Of the 10 disclosed molecules in the pipeline, nine molecules are being developed with Mylan, our strategic partner. This
collaboration represents the coming together of Biocon’s robust development and manufacturing capabilities, as well as Mylan’s regulatory and commercial excellence
in United States and European Union.
Biocon’s portfolio well positioned in the competitive landscape
Competitive Landscape@
2015 Sales*
(USD bn)
Pre-Clinical Phase I Phase III/Filed
pegfilgrastim 4.7 Pfizer Dr. Reddy’s Biocon, Sandoz, Apotex, Coherus, Richter
trastuzumab 6.8 Oncobiologics, Dr. Reddy’s Hanhwa, Genor, Meiji Seika Biocon, Celltrion, Amgen, Pfizer, Samsung
insulin glargine 7.1 Biocon&, Samsung, Eli Lilly#
adalimumab 14.0 Epirus Dr. Reddy’s, Oncobiologics Biocon, Amgen, Samsung, Sandoz, Boehringer
Ingelheim, Coherus, Fuji Kirin, Baxter-Momenta, Pfizer,
Merck Serono
bevacizumab 6.9 Celltrion Biocon (Global), Sandoz,
Daiichi, Fuji Kirin – Astra Zeneca,
Oncobiologics, Cipla
Biocon (RoW), Amgen, Boehringer Ingelheim, Pfizer,
Samsung
filgrastim 1.0 Biocon, Pfizer Sandoz**, Apotex, Multiple approvals in EU (Teva,
Hospira (Pfizer), Stada, Accord etc.)
etanercept 8.7 Biocon, Celltrion Samsung, Sandoz, Coherus-Baxalta
insulin aspart 4.7 Biocon
insulin lispro 2.8 Biocon Sanofi
rh-insulin 3.1 Biocon – US Biocon - EU
*Reported sales of Innovator Companies, conversion from reported currency into USD& Approved in Japan. # Approved in Japan, EU and US. Launched in Japan & EU.
** Launched in EU & US@ Biosimilar Development Pipeline details may not be exhaustive, Source: Company disclosures, various reports
Operationally, the year under review proved busy for the biosimilars vertical. The global Phase 3 study for Pegfilgrastim was completed, having addressed the primary
end-point of demonstrating clinical equivalence with the reference product while the global Phase 3 study of biosimilar Trastuzumab also met its primary end-point.
Our Adalimumab and Bevacizumab programs made good progress. The global Phase 3 clinical development program for generic Insulin Glargine also crossed critical
milestones. This provides us confidence towards submission of marketing authorization applications for some of these molecules in FY17.
We received the first approval for our Insulin Glargine product in Japan in partnership with FUJIFILM Pharma, the result of stringent regulatory compliance. FUJIFILM
Pharma expects to commercialise the product in the first half of FY17 following pricing approval from Japan’s National Health Insurance. We also received approvals for
our Insulin Glargine product in Mexico and Colombia.
Biocon Limited
131
We initiated a development programme for recombinant human insulin (rh-Insulin) targeted at the U.S market, entering into a co-development and commercialisation
agreement with Laboratorios PiSA S.A. de C.V, Mexico (PiSA). This agreement represents an extension of our decade-long relationship with our trusted partner, who enjoys
a dominant insulins position in Mexico. Through this collaboration, we plan to introduce generic rh-Insulin under the Biocon brand in the US, using the infrastructure
being created for our generic formulations (read ANDA) business in that country. This partnership will leverage our manufacturing facilities for the drug substance and
PiSA’s drug product facilities in Mexico. Further, this arrangement will capitalise on PiSA’s proximity to the US market and Mexico’s NAFTA membership, ensuring an
efficient and optimal supply chain to address the needs of the US healthcare system for affordable, high quality rh-Insulin. The US market accounts for over 40% of the
global sales of rh-Insulin, estimated at USD 1.5 bn (IMS March 2015).
The ability to address market demand by creating capacity, reducing cost and increasing operational efficiency could emerge as a key differentiator for our biosimilar
success in developed and emerging markets. Biocon is building phased capacity to fulfil market demand for its portfolio products. We inaugurated a top-of-the-line insulin
device facility in Bengaluru and launched the first disposable pen – Basalog One™ for Glargine in India. Our Malaysian insulin facility received local cGMP certification
from the National Pharmaceutical Control Bureau, Malaysia. The plant is undergoing a series of validation activities that certify operational efficiency. Following this, we
will seek approvals from leading regulatory agencies across the globe for marketing our insulin products in those geographies. We expect the Malaysian facility to begin
commercial operations in the second half of FY17. The expansion of our Biosimilars fill-finish facility in Bengaluru is on track for qualification in FY18. We plan to augment
our current biologics manufacturing capacity for monoclonal antibodies in line with the launch of our products across the globe.
We continue to pursue licensing opportunities in emerging markets for our key products like rh-Insulin, Insulin Glargine and Trastuzumab. We enjoy market approvals in
over 60 countries for rh-Insulin and over 20 countries for Insulin Glargine. Trastuzumab was licensed in key emerging markets with commercial sales initiated in late-FY16.
Branded Formulations
Despite extending into the branded formulations space later than our peers, we have differentiated ourselves as a biologics-led healthcare company in a crowded Indian
pharma market. We are a specialty biopharma company engaged in chronic therapeutic areas with a significant contribution being derived from biologics. We provide
world-class quality products for millions of patients in India and select international markets.
The introduction of Basalog One™, a ‘once-a-day’ product, a long-acting basal Insulin Glargine presented as an innovative, pre-filled pen, strengthened our existing
BASALOG® portfolio (vials, refills and reusable devices), making it possible for us to offer a comprehensive diabetes-management solution.
This year, we forayed into Virology following the launch of various products targeted at alleviating the challenges faced by a sizeable hepatitis-afflicted population in
India. These products included CIMIVIRTM (Sofosbuvir), CIMIVIR-LTM (Sofosbuvir+Ledipasvir), and DACLAWINTM (Daclatasvir) for Hepatitis-C.
The performance of the division continued to be sluggish as we focused on portfolio optimisation. Our inability to bid for certain large institutional tenders due to
restrictions on the use of CMOs, along with an under-availability of some key products, impacted revenue growth. Nevertheless, our flagship brands across various
therapeutic areas grew attractively and augmented profitability. Notably, our Trastuzumab (CANMAbTM) continued to gain market share in India while our India insulins
franchise crossed ` 1,500 mn in sales in FY16.
Our UAE business carved a niche in a crowded pharma market dominated by MNCs and local generic companies. For FY16, it reported strong 30% growth, driven by
branded generic products that cater to the high incidence of lifestyle diseases.
Metabolics, Oncology, Nephrology and the Institutional Business are expected to remain growth drivers for this vertical in FY17. Our strategic initiatives in this vertical
should lead to consistent profitable growth across the foreseeable future.
Novel Molecules
We are working on a portfolio of molecules in key therapeutic areas like diabetes, oncology and auto-immune diseases.
In FY16, we announced positive clinical data for Insulin Tregopil (formerly IN-105), a novel insulin molecule for post-prandial glycemic control with oral delivery, following
Phase 1 studies that were concluded in the last financial year. We partnered Bristol-Myers Squibb prior to the divestment of their diabetes franchise to AstraZeneca. Based
on the positive data sets, the Company is venturing to take this research asset into the next phase of clinical trials on its own for validation across a larger patient cohort.
The out-licensing of Itolizumab, our anti-CD6 monoclonal antibody, was delayed following uncertainties around U.S. regulations due to the Cuban origin of the molecule.
After evaluating the need for prior authorization from the Office of Foreign Asset Control (OFAC) and related timelines, we concluded that the same had now created
an uncertainty to license this product for development and commercialization in the United States. We recorded an impairment of the carrying value of the marketing
rights for the molecule for the US and Canada during the year. We hold marketing rights in other territories including Europe where these restrictions do not apply
and continue to develop the molecule for such territories. In FY16, a bridging Phase 1 pharmacokinetic and safety study in normal healthy volunteers was initiated in
Australia. The study aims to evaluate the pharmacokinetics of a sub-cutaneous route of administration of Itolizumab in comparison to intravenous route for which the
Company has marketing approval in India. The study is expected to enable a global IND filing with a subcutaneous route of administration. Biocon is the first and only
global company to clinically validate CD6 as a target for autoimmune diseases.
QPI-1007, a novel molecule to treat non-arteritic ischemic optic neuropathy (NAION), based on the SiRNA technology platform, in-licensed by the Company for India and
related markets, progressed following the initiation of pivotal Phase 2/3 trials by our partner Quark Pharma in the US.
Novel immune check-point inhibitors enhanced excitement in the field of cancer in general and cancer immunotherapy in particular. We are building an exciting
pipeline of fusion monoclonal antibody molecules with the concept of preferentially delivering immune modulators to tumour site, enhancing efficacy while limiting
systemic toxicity. The lead molecule in this program FmAb2 achieved preclinical ‘proof of concept’ and is currently in advanced preclinical development.
We remain committed to bring new technologies and molecules to the market via partnerships and in-house R&D with the aim of providing affordable options to global
patients for various unmet medical needs. We aim to monetize some of these assets via out-licensing deals to fund research, development and capital expenditure.
Research Services (Syngene)
Biocon’s subsidiary Syngene is a leading custom research and manufacturing organisation offering a suite of integrated, end-to-end discovery, development and
manufacturing services for small and large NMEs across industrial sectors, including pharmaceutical, biotechnology, agrochemical, consumer health, animal health,
cosmetic and nutrition companies. Syngene has evolved from being just another ordinary CRO to an integrated provider of discovery and development services across
a range of domains, including small and large molecule biologics, ADCs (antibody drug conjugates) and oligonucleotides.
Credibly Capable | Annual Report 2016132

Financial Report
Syngene assists clients in conducting discovery (from hit to candidate selection), development (including pre-clinical and clinical studies, analytical and bio-analytical
evaluation, formulation development and stability studies) and manufacturing (scale-up, pre-clinical, clinical supplies and commercial) – with a difference. Unlike
traditional business models, these services are endowed with an inherent flexibility – ranging from a full-time equivalent (FTE) to a fee-for-service (FFS) – customised
around client requirements.
With a talented pool of over 2,500 scientists, world-class R&D and manufacturing facilities spread over 900,000 square feet, Syngene services more than 250 clients across
diverse sectors. Syngene has forged three long-term, multidisciplinary partnerships (each equipped with a dedicated research centre) with Bristol-Myers Squibb, Abbott
Laboratories Singapore and Baxter International Inc.
During the year, Syngene’s revenues grew 29% following the addition of new clients and projects. Syngene commenced commercial supplies of novel small molecules
APIs to clients in FY16. With work on the new commercial-scale facility in Mangalore underway, Syngene expects a more meaningful contribution from manufacturing
services in the future.
We unlocked significant value by listing Syngene on the Indian stock exchanges, the NSE and the BSE (on August 11, 2015), following a successful IPO oversubscribed
31 times. Syngene, with its proven track record in terms of quality and intellectual property protection, is poised to ride an increase in global R&D spending and R&D
outsourcing across Asia.
Resource Review
Employees
Employees represent the cornerstone of our success. We believe that good employee culture translates individual performance into success for company, industry,
clients and end users.
In light of our steady growth and ambitious plans, attracting and grooming talent was of utmost importance. A detailed discussion on attracting, retaining, training and
developing human capital is provided in our HR section.
As a Group, we employ over 8,300 people, including more than 500 individuals outside India.
IPR
One of our key focus areas is the creation of Intellectual Property (IP), generating not only a competitive advantage but also creating exponential and enduring value.
Patents
The IP portfolio of the Biocon Group of companies comprises 1,241 patent applications and 984 patents granted in various jurisdictions.
Trade Marks
Biocon Limited’s IP portfolio comprises 800 Trade Mark applications, of which 448 are registered trademarks in different classes and various jurisdictions across the world.
Designs
Biocon Limited’s IP portfolio consists of four design applications, of which three designs are registered.
(This space has been intentionally left blank)
Biocon Limited
133

Financial Performance - An Overview
Consolidated Balance Sheet
The following table highlights the consolidated Balance Sheet as on March 31, 2016 (FY16) and March 31, 2015 (FY15)
Table 1, All Figures in ` Million
Particulars FY16 FY15 Change
Equity and Liabilities
Shareholder’s funds
Share capital 1,000 1,000 -
Reserves and surplus 39,556 31,706 25%
40,556 32,706 24%
Minority interest 3,112 1,722 81%
Non-current liabilities
Long-term borrowings 20,724 7,696 169%
Deferred tax liability (net) 346 417 -17%
Other long-term liabilities 3,503 5,516 -36%
Long-term provisions 299 150 99%
24,872 13,779 80%
Current liabilities
Short-term borrowings 3,949 2,610 51%
Trade payables 5,471 4,293 27%
Other current liabilities 5,979 7,062 -15%
Short-term provisions 877 1,582 -45%
16,276 15,547 5%
Total 84,816 63,754 33%
Assets
Non-current Assets
Tangible and intangible assets 39,101 33,065 18%
Loans and advances and other non-current assets 5,783 5,063 14%
44,884 38,128 18%
Current Assets
Current investments 4,285 2,303 86%
Inventories 5,114 4,527 13%
Trade receivables 8,229 7,705 7%
Cash and bank balances 19,213 9,375 105%
Loans and advances and other current assets 3,091 1,716 80%
39,932 25,626 56%
Total 84,816 63,754 33%
Shareholders’ Funds
We have an equity share capital comprising 200,000,000 equity shares of face value of ̀ 5 each. There was no change in the equity capital of the company during the year.
Reserves and Surplus
The total reserves and surplus of the company increased 25% in FY16 as compared to FY15, due to profit accumulation during the year, net of dividend distribution.
Minority Interest
The profit attributable to minority shareholders increased 81% in FY16, largely on account of a stake dilution in Syngene subsequent to the IPO.
Non-current liabilities
Long-term borrowings increased following a further drawdown of the term loan for setting up a manufacturing facility in Malaysia, fresh borrowings for capital
expenditure for setting up our maiden generics formulations facility for oral solid dosages, second sterile formulation facility for biologics and expansion of current
facilities/setting up of new manufacturing facilities and services for small and large molecules by Syngene - all in India. Our other long-term liabilities decreased due to
the release of deferred revenues pertaining to rh-Insulin in our subsidiary Biocon SA, which is fully described in Note C of Exceptional Items in this report.
Non-current assets
Non-current assets grew 18% primarily due to investments in tangible assets for the Malaysian facility and expansion of facilities in our research services business.
Working Capital (Current Assets less Current Liabilities)
Working capital as at March 31, 2016 stood at ` 23,656mn, up 135% over FY16. The increase was on account of cash balance from the proceeds of long-term borrowings
and a stake dilution in Syngene through an IPO coupled with increased inventories and receivables reflecting business growth.
Consolidated Statement of Pro!t and Loss
Credibly Capable | Annual Report 2016134
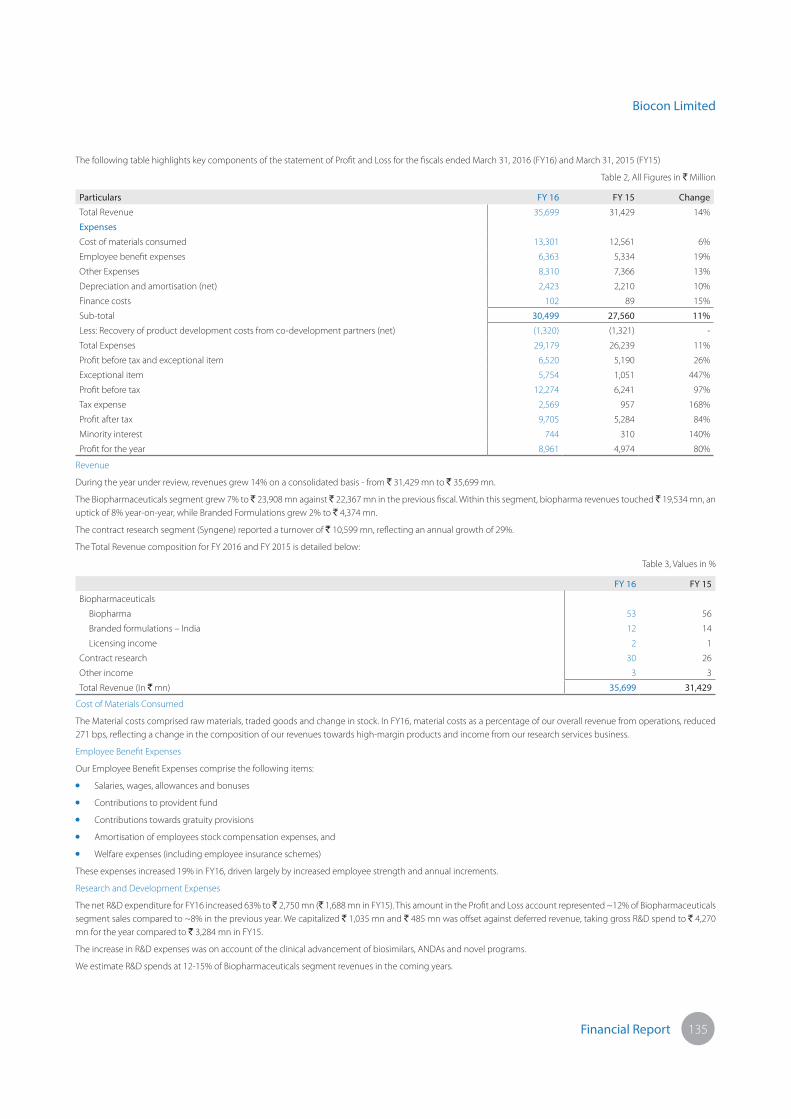
Financial Report
The following table highlights key components of the statement of Profit and Loss for the fiscals ended March 31, 2016 (FY16) and March 31, 2015 (FY15)
Table 2, All Figures in ` Million
Particulars FY 16 FY 15 Change
Total Revenue 35,699 31,429 14%
Expenses
Cost of materials consumed 13,301 12,561 6%
Employee benefit expenses 6,363 5,334 19%
Other Expenses 8,310 7,366 13%
Depreciation and amortisation (net) 2,423 2,210 10%
Finance costs 102 89 15%
Sub-total 30,499 27,560 11%
Less: Recovery of product development costs from co-development partners (net) (1,320) (1,321) -
Total Expenses 29,179 26,239 11%
Profit before tax and exceptional item 6,520 5,190 26%
Exceptional item 5,754 1,051 447%
Profit before tax 12,274 6,241 97%
Tax expense 2,569 957 168%
Profit after tax 9,705 5,284 84%
Minority interest 744 310 140%
Profit for the year 8,961 4,974 80%
Revenue
During the year under review, revenues grew 14% on a consolidated basis - from ` 31,429 mn to ` 35,699 mn.
The Biopharmaceuticals segment grew 7% to ` 23,908 mn against ` 22,367 mn in the previous fiscal. Within this segment, biopharma revenues touched ` 19,534 mn, an
uptick of 8% year-on-year, while Branded Formulations grew 2% to ` 4,374 mn.
The contract research segment (Syngene) reported a turnover of ` 10,599 mn, reflecting an annual growth of 29%.
The Total Revenue composition for FY 2016 and FY 2015 is detailed below:
Table 3, Values in %
FY 16 FY 15
Biopharmaceuticals
Biopharma 53 56
Branded formulations – India 12 14
Licensing income 2 1
Contract research 30 26
Other income 3 3
Total Revenue (In ` mn) 35,699 31,429
Cost of Materials Consumed
The Material costs comprised raw materials, traded goods and change in stock. In FY16, material costs as a percentage of our overall revenue from operations, reduced
271 bps, reflecting a change in the composition of our revenues towards high-margin products and income from our research services business.
Employee Benefit Expenses
Our Employee Benefit Expenses comprise the following items:
Salaries, wages, allowances and bonuses
Contributions to provident fund
Contributions towards gratuity provisions
Amortisation of employees stock compensation expenses, and
Welfare expenses (including employee insurance schemes)
These expenses increased 19% in FY16, driven largely by increased employee strength and annual increments.
Research and Development Expenses
The net R&D expenditure for FY16 increased 63% to ̀ 2,750 mn (` 1,688 mn in FY15). This amount in the Profit and Loss account represented ~12% of Biopharmaceuticals
segment sales compared to ~8% in the previous year. We capitalized ` 1,035 mn and ` 485 mn was offset against deferred revenue, taking gross R&D spend to ` 4,270
mn for the year compared to ` 3,284 mn in FY15.
The increase in R&D expenses was on account of the clinical advancement of biosimilars, ANDAs and novel programs.
We estimate R&D spends at 12-15% of Biopharmaceuticals segment revenues in the coming years.
Biocon Limited
135

Depreciation and Amortization
During this fiscal, depreciation and amortization increased to ` 2,423 mn from ` 2,210 mm in FY15. The increase was on account of an expansion in our existing facilities
in the biopharma business and the commissioning of a new research centre in the research services arm of our Company.
Finance Costs
The finance cost marginally increased to ` 102 mn in FY16 from ` 89 mn in FY15, which was mainly incurred for foreign currency borrowings to address routine
operations. The finance costs for our Malaysia facility continued to be capitalized during the year.
Exceptional Items (net)
The Exceptional items during the year comprised the following:
A. In March 2010, Biocon SA, a wholly-owned subsidiary of Biocon, acquired the marketing rights of T1H product for US and Canada (‘Territory’) from CIMAB, Cuba.
Pursuant to ongoing efforts to license such product to potential partners in the USA, Biocon SA was informed of the need to obtain prior authorization from the
Office of Foreign Assets Control, USA (‘OFAC’). The US regulations restrict any U.S. company or a subsidiary of a U.S. company from engaging in any transaction in
which a Cuban entity has at any time since July 1963 had any interest whatsoever, whether direct or indirect without prior authorization from OFAC. Biocon SA
evaluated options to obtain waiver from this requirement. However, the outcome was not favourable. Consequent to such developments and after evaluating
the requirements of OFAC and related timelines, the management concluded that the same has now created an uncertainty to license or obtain marketing
authorization for development and commercialization of the product in the Territory.
Hence, Biocon SA recorded an impairment of the carrying value of the aforesaid intangible asset amounting to ̀ 1,078 mn. The same was recorded as an exceptional
item in the consolidated financial results for the year ended March 31, 2016. We hold marketing rights in other territories including Europe where these restrictions
do not apply and continue to develop the molecule for such territories.
B. During the year ended March 31, 2016, Syngene completed its Initial Public Offering (IPO) through an offer for sale of 22,000,000 equity shares of ` 10 each by the
Company. Following the sale, the Company’s holding in equity shares of Syngene reduced from 84.54% to 73.54%. The equity shares of Syngene were listed on
National Stock Exchange of India Limited and BSE Limited on August 11, 2015. The gain arising from this sale of equity shares, net of related expenses and cost of
equity shares, amounted to ` 4,148 mn and was recorded as an exceptional item. A consequential tax of ` 1,042 mn was recorded on such gains in the consolidated
financial statements.
C. In March 2016, Biocon SA entered into an agreement with Lab PiSA, Mexico (‘PiSA’), granting a right to PiSA to become Biocon SA’s exclusive co-development
partner and manufacturer for biosimilar rh-Insulin (“Products”) in United States of America (‘the Territory’). As per this Agreement, following the completion of
preliminary development activities to be conducted by PiSA and exercise of the right by PiSA to continue with the development activity, Biocon SA and PiSA shall
conduct the co-development program. Biocon SA shall conduct the required clinical studies and obtain the regulatory approvals to market the Products in the
Territory, while PiSA will be responsible for the manufacture of Products at its facility. Biocon SA and PiSA shall share the cost of all development activities and share
profits from the commercialization of Products in the Territory as per the terms of this agreement.
Consequent to the above agreement with PiSA which changes the nature of Biocon’s future obligations on the rh-Insulin program, the balance of deferred revenues
of ` 2,684 mn relating to this program, were recognized as income in the consolidated statement of Profit and Loss for the year ended March 31, 2016 and disclosed
under Exceptional Item. A consequential tax of ` 123 mn was recorded on such income.
The exceptional items during the previous year comprise the following:
A. Biocon Research Limited (‘BRL’), wholly owned subsidiary of Biocon purchased 7.69% of equity shares of Syngene International Limited (‘Syngene’), from GE Equity
International Mauritius for a consideration of ` 2,154 mn. BRL also subscribed to additional equity shares in Syngene by way of a Rights Issue, thereby taking BRL’s
shareholding in Syngene to 10.93%.
On September 18, 2014, BRL entered into an agreement with Silver Leaf Oak (Mauritius) Limited (‘Silver Leaf’) to sell 10% equity stake in Syngene for a consideration
of ` 3,800 mn. In January 2015, Silver Leaf assigned its rights and obligations to purchase the aforesaid equity stake in Syngene to IVF Trustee Company Private
Limited (‘IVF’), a fund advised by India Value Fund Advisors. Accordingly, BRL sold 10% equity stake in Syngene to IVF and a gain of ` 1,348 mn arising on such sale
of shares net of transaction costs, has been recorded as exceptional item in the consolidated financial results.
B. During the year ended March 31, 2015, we sold equity shares of Syngene constituting 1% of equity capital at cost to Biocon Limited Employees Welfare Trust, a Trust
formed for administration of a Scheme for the benefit of employees of the Group (excluding the employees of Syngene). Accordingly, a loss of ̀ 79 mn was recorded
in the consolidated statement of Profit and Loss for the year ended March 31, 2015.
C. During the year ended March 31, 2015, considering the financial position and uncertain prospective cash flows of Vaccinex Inc., the Company prudently created a
provision of ` 218 mn for diminution other than temporary, in the value of its investments in Vaccinex Inc. in the consolidated financial statements.
Tax Expenses
Tax expenses for the fiscal stood at ` 2,569 mn in comparison to ` 957 mn in FY15. The increase was on account of the tax on Syngene IPO.
Risks, Threats and Concerns
Risk is a potential event or non-event, the occurrence or non-occurrence of which can adversely affect the objectives of the Company.
The global pharma industry bears a striking resemblance with the financial services industry of a decade ago. The industry landscape is affected by product safety issues,
security and privacy breaches, intellectual property tangles, inappropriate marketing practices and corruption thereby leading to penalties, product recalls, brand loss
and revenue loss. The regulatory landscape of the international pharma industry is complex and dynamic. The primary industry driver is patient health and safety even
as regulatory approach to patient protection can vary from market to market. Besides, there are factors of rapid change, increased scrutiny, sophisticated risk-monitoring
techniques and coordination across agencies and regions. In such a context, it is imperative to respond with a holistic risk mitigation framework.
The Company has carved a niche on the back of its steadfastness in conducting business in accordance with all applicable laws and regulations as well as a manner
consistent with core organisational values. Our established risk management framework addresses strategic operational, legal and compliance risks, those are inherent
in the pharma business and impact our strategic goals. Risk management, coupled with a robust internal control framework, helps the Company emphasise qualitative
consistency, employee safety and long-term sustainability.
Credibly Capable | Annual Report 2016136

Financial Report
(This space has been intentionally left blank)
The global pharma business is marked by a variety of risks. Pharmaceutical companies struggle to globally enforce IP protection, particularly in some emerging markets.
Enhanced regulatory scrutiny is set against a backdrop of increasing patient advocacy, social media and affiliate marketing programmes. The digitisation and proliferation
of electronic medical records, networked medical devices, mobile health applications, cloud-based technologies and data-sharing among industry stakeholders have
increased the complexity in managing information assets, particularly protected health information and intellectual property. The success of new products in the global
pharmaceutical industry will more than offset global pricing pressures, supporting an outlook change from stable to positive for the industry.
Although the comprehensive eradication of risks associated with our business of the Company is unfeasible, constant efforts are made to mitigate their adverse
impact. The Company has implemented a precise methodology entailing the timely identification, analysis and assessment of risks and their potential consequences,
formulation of specific mitigation strategies and seamless execution. An enterprise-wide risk evaluation and validation process is conducted regularly and reviewed by
a Risk Management Committee and Board of Directors.
The government, investor and the public demand transparency in life science companies covering aspects like product commercialisation, executive pay, financial
information accuracy, manufacturing processes and clinical trial quality. Several high-profile incidents, particularly in emerging markets, have enhanced the need for
more transparency. Other key developments comprise the Indian Government’s plans to involve the private sector in R&D across vaccines, drugs and pharmaceuticals,
among others, increasing risks and opportunities. On the brighter side, drug approval processes have been simplified by the authorities and approval times for new
facilities drastically reduced. The onus will be on the Company to capitalise on these opportunities while protecting itself from risks.
In addition to the above, other key risks relating to our current operations include human capital risk such as loss of key personnel, timely replenishment of critical vacant
roles, reliance on third party sole suppliers or service providers including regional supplier reliance, risk arising out of co-development arrangements, disruption of
operations from natural disasters, risk arising out of strategic projects, foreign exchange fluctuations, changing landscape of statutory regime etc.
Internal Controls
The Company is responsible for establishing and maintaining adequate and effective internal controls and the preparation and presentation of the financial statements,
including assertions on the internal financial controls in accordance with broader criteria established by the Company.
A robust, comprehensive internal control system is a prerequisite for an organisation to function ethically and in commensuration with its abilities and objectives. We
have established a strong internal control system for the Company, comprising policies and procedures adopted by the Company for ensuring the orderly and efficient
business conduct, including adherence to policies, asset safeguarding, fraud cum error prevention and detection, accounting records accuracy and completeness, and
the timely preparation and presentation of reliable financial information.
This internal control system is aimed at providing assurance of our operational effectiveness and efficiency, compliance with laws and regulations, asset safeguarding
and reliability of financial and management reporting.
The Company is staffed by experienced qualified professionals who play an important role in designing, implementing, maintaining and monitoring the internal control
environment.
An independent firm of Chartered Accountants perform periodic internal audits to provide a reasonable assurance of internal control effectiveness and advise on
industry-wide best practices. The Audit Committee, consisting of Independent Directors, reviews important issues raised by the internal and statutory auditors on a
regular basis and status of rectification measures to ensure that risks are mitigated appropriately on a timely basis.
Outlook
FY16 was an important year for the company as we made significant progress. We restructured our legal entities to represent the strategic business units with the
objective to unlock enhanced value from our business segments whenever necessary. We demonstrated this when we divested the enzymes business to Novozymes in
2007 and also through the successful initial public offering of Syngene.
The achievement of certain milestones during the year reinforced conviction in our differentiated business strategy. The acquisition and expansion of API capacities, first
generic formulations approval in EU and pending ANDA filings and their approvals should grow our base business. The Insulin Glargine approval in Japan and partnership
to develop generic rh-Insulin for the US market in FY16, key biosimilar filings across US and EU, commencement of commercial operations in the Malaysia insulin plant
in FY17 and further monetization of our biosimilar pipeline in the emerging markets should catalyse our biosimilars business. The expansion of manufacturing facilities
for large molecules and novel small molecules for companies in pharmaceutical, agrochemical and other industrial sectors should help Syngene attract clients for
commercial manufacturing, evolving it into a Contract Research and Manufacturing Services company.
In view of these triggers, we feel confident of enhancing value for our business and stakeholders.
Biocon Limited
137

Corporate Governance ReportThe detailed report on Corporate Governance for the financial year ended March 31, 2016, as stipulated in clause 49 of the Listing Agreement of the Company with the
Stock Exchanges for the period April 01, 2015 to November 30, 2015 and as per relevant provisions of Securities and Exchange Board of India (‘SEBI’) (Listing Obligations
and Disclosure Requirements) Regulations, 2015 as referred to in Regulation 15(2) of Listing Regulations for the period December 01, 2015 to March 31, 2016 is set out
below:
Company’s philosophy on Code of Governance
Biocon is committed to do business in an efficient, responsible, honest and ethical manner. Corporate Governance practice goes beyond compliance and involves a
company-wide commitment and has become the integral part of business to ensure fairness, transparency and integrity of the management.
Good governance responsibilities encompasses the activities of the Board of Directors, who execute their Corporate Governance responsibilities by focusing on the
Company’s strategic and operational excellence in the best interests of all stakeholders of the Company, in particular shareholders, employees and our customers in a
balanced fashion with long term benefits to all.
Good Corporate Governance provides an appropriate framework for the Board, its committees and the executive management to carry out the objectives that are in
the interest of the Company and the stakeholders.
The core values of the Company’s governance process include independence, integrity, accountability, transparency, responsibility and fairness. The business policies are
based on ethical conduct, health, safety and a commitment to building long-term sustainable relationships with relevant stakeholders.
Biocon is committed to continually evolve and adopt appropriate Corporate Governance best practices.
Board of Directors
Composition, Category and Pro"le of Directors:
The composition of Board and category of Directors as at March 31, 2016 was as follows:
Category Name of the Directors
Promoter & Executive Directors Ms. Kiran Mazumdar-Shaw
Mr. John Shaw
Executive Director Dr. Arun S Chandavarkar
Non-Independent & Non-Executive Director Prof. Ravi Mazumdar
Independent Directors & Non-Executive Directors Mr. Russell Walls
Ms. Mary Harney
Mr. Daniel M Bradbury
Dr. Vijay K Kuchroo
Dr. Jeremy M Levin
Pro"le of Directors:
The brief profile of the Company’s Board of Directors is as under:
Ms. Kiran Mazumdar-Shaw, Chairperson and Managing Director
Ms. Kiran Mazumdar-Shaw, aged 63 years, is a first generation entrepreneur with close to 41 years of experience in the field of biotechnology. She holds a bachelor’s
degree in Science (Zoology Hons.) from Bangalore University and a master’s degree in Malting and Brewing from Ballarat College, Melbourne University. She has been
awarded with several honorary degrees including Honorary Doctorate of Science from Ballarat University, National University of Ireland, Trinity College, Dublin and the
University of Glasgow. She is the recipient of several national and global awards, the most noteworthy being the ‘Padmashri’ and the ‘Padmabhushan’ Award in 1989
and 2005, respectively, conferred by the President of India. She was also conferred with ‘Ernst & Young Best Entrepreneur: Healthcare & Life Sciences Award (2002)’,
‘The Economic Times Business Woman of the Year Award (2004)’, ‘Nikkei Asia Prize for Regional Growth’ by Japan’s business daily, Nihon Keizai Shimbun (2009) and
most recently, the ‘Othmer Gold Medal’ by the U.S. based Chemical Heritage Foundation and ‘2014 Global Economy Prize’ by Germany’s Kiel Institute both in 2014. The
prestigious Foreign Policy magazine has named her among the ‘100 leading Global Thinkers of 2014’. She has also been named as one of the ‘100 Most Influential People
in the World’ by TIME magazine in 2010, ‘25 Most Influential People in Biopharma’ by Fierce Biotech, Asia-Pacific’s ‘Heroes of Philanthropy (2013)’ and ‘100 Most Powerful
Women (2013)’ by Forbes magazine and Asia’s 50 Power Businesswomen 2016 by Forbes Asia.
She is also an Independent director of the Board of Infosys Limited and is the Chairperson of the Indian Institute of Management, Bengaluru. She was a part of the
U.S. Pharmacopeial Convention (USP) Board of Trustees. She is a member of Karnataka’s Vision Group on Biotechnology and currently chairs this forum. She has set up
the Association of Biotech Led Enterprises (ABLE) in 2003 and was its first president. She serves on the National Advisory Council of the Government’s Department of
Biotechnology. She is member of the governing body of the Indian Pharmacopoeia Commission, Ministry of Health and Family Welfare, Government of India.
Mr. John Shaw, Vice Chairman and Whole-time Director
Mr. John Shaw, aged 67 years, holds a master’s degree in Arts (Economic Hons.) in History and Political Economy from Glasgow University, United Kingdom. Prior to
joining our Board in 1999, he had worked with Coats Viyella Plc. for 27 years in different capacities, the last being the Finance and Managing Director of Coats Viyella
group companies in various locations around the world.
Dr. Arun S Chandavarkar, Chief Executive O$cer and Joint Managing Director
Dr. Arun S Chandavarkar, aged 54 years, is a Bachelor in Technology from the prestigious Indian Institute of Technology, Bombay. He earned his Ph.D. in Biochemical
Engineering from the Massachusetts Institute of Technology, Cambridge, USA. He joined Biocon in 1990 and prior to his elevation as a member of Board, he has worked
in different capacities within the organization, the last being the Chief Operating Officer for the Company. With his acumen in technology, business and leadership, the
Company has established expertise across diverse technology platforms spanning microbial fermentation, cell culture, chemical synthesis and purification to develop a
wide range of products from specialty enzymes to active pharmaceutical ingredients to recombinant therapeutic proteins.
Credibly Capable | Annual Report 2016138

Financial Report
Prof. Ravi Mazumdar, Non-Independent and Non-Executive Director
Prof. Ravi Mazumdar, aged 61 years, was educated at IIT, Bombay (B. Tech in Electrical Engineering, 1977). He received the MSc, DIC from Imperial College, London (1978)
and is a Ph.D. from the University of California, Los Angeles (UCLA, 1983). He is currently a University Research Chair Professor at University of Waterloo, Canada. Prior to
this he was a faculty member at Purdue University, U.S.A, Columbia University, U.S.A., and University of Essex, U.K. He has held visiting positions at the Indian Institute
of Science, Bengaluru; the University of California, Berkeley and Telecom-Paris Tech, France. He is currently a J.D. Gandhi Distinguished Visiting Professor at the Indian
Institute of Technology, Bombay. He has over 150 referred publications in the area of high speed communication networks, applied probability and stochastic processes
and in statistical signal processing. He has been a member of several advisory committees and working groups, including the US Congress Sub-Committee on Science
and Technology. He is a Fellow of the Royal Statistical Society and Fellow of the Institute of Electrical and Electronics Engineers, Inc. He is the younger brother of Ms. Kiran
Mazumdar-Shaw.
Mr. Russell Walls, Independent and Non-Executive Director
Mr. Russell Walls, aged 72 years, is a fellow member of the Association of Chartered Certified Accountants, United Kingdom. He brings to the Board his rich 46 years of
experience in the financial management and accountancy. He has also served as a Director in multiple industries such as pharmaceuticals, textiles, transport and leisure.
He is currently Chairman of Aviva Life Holdings Limited and on the Board of Mytrah Energy Limited, Aviva Italia Holdings Spa and Signet Jewellers Limited etc. He has
been a director of our Company since April, 2011.
Ms. Mary Harney, Independent and Non-Executive Director
Ms. Mary Harney, aged 63 years, was a member of the Irish Parliament for over thirty years and was a Government Minister for seventeen years in environment, economic
and health ministries. She was Deputy Prime Minister for over nine years. She is an economics graduate of Trinity College, Dublin. She was the longest serving woman
ever in the Irish Parliament and in 1993 became the only woman to have led a political party in Ireland. She retired from politics in January 2011 and is now involved in
business. She is a director of several technology companies as well as an insurance company in Ireland. She is a member of the Board of CRANN Trinity College Dublin’s
largest research institute and is chair of AMBER, the Advanced Materials and Bio-Engineering Research Centre at Trinity, a joint research enterprise with University College
Cork, the Royal College of Surgeons in Ireland and industry. She is on the Board of the Hospice Foundation of Ireland and is an honorary member of the International
Women’s Forum. She has been a director of our Company since April, 2012.
Mr. Daniel M Bradbury, Independent and Non-Executive Director
Mr. Daniel M. Bradbury, aged 55 years, holds a postgraduate diploma in Management Studies and a diploma of the Chartered Institute of Marketing from Harrow and
Ealing Colleges of Higher Education, United Kingdom and bachelor’s degree in Pharmacy (Hons.) from Nottingham University, United Kingdom. He has also completed
the Director’s Training and Certification Program at the University of California, Los Angeles and the Director’s College 2010 Executive Education Program from Stanford
University and the international executive program from INSEAD, European Institute of Business Administration, France. He has over 30 years of experience in creating
and implementing strategies that transform businesses and bring novel medicines to market. He has been honoured with the Corporate Directors Forum Director
of the Year Award for Enhancing Economic Value and the Ernst & Young’s Entrepreneur of the Year Finalist. He serves on the University of San Diego’s Rady School of
Management’s advisory council and the Keck Graduate Institute’s Board of trustees. He has been a director of our Company since April 2013.
Dr. Vijay K Kuchroo, Independent and Non-Executive Director
Dr. Vijay K Kuchroo, aged 61 years, is the Samuel L. Wasserstrom Professor of Neurology at Harvard Medical School, Senior Scientist at Brigham and Women’s Hospital
and Co-Director of the Center for Infection and Immunity, Brigham Research Institutes, Boston. He is also an associate member of the Broad Institute and a participant
in a Klarman Cell Observatory project that focuses on T cell differentiation. He is also the Director of the newly formed Evergrande Centre for Immunologic Diseases at
Harvard Medical School and Brigham and Women’s Hospital. To his credit, Dr. Kuchroo first described the inhibitory receptor TIM-3, which is being exploited as a target
for cancer immunotherapy. He was first to describe the development of highly pathogenic Th17 cells, which has been shown to induce multiple different autoimmune
diseases in humans. He has published over 325 original research papers in the field of Immunology and a paper describing development of Th17 authored by him has
been one of the highest cited papers in Immunology. In addition, he has 25 patents and has founded 5 different biotech companies including CoStim Pharmaceuticals
and Tempero Pharmaceuticals. He also serves on the scientific advisory Boards and works in advisory capacity to a number of big pharmaceutical companies including
Pfizer, Novartis and Glaxo-Smith-Kline (GSK).
Dr. Jeremy M Levin, Independent and Non-Executive Director
Dr. Jeremy M Levin, aged 62 years, holds a Bachelor’s Degree in Zoology and a Masters of Arts and a Doctorate in the structure of Chromatin from the University of Oxford.
In addition he received degrees of Bachelor of Medicine and Bachelor of Surgery from the University of Cambridge. He is Chairman and CEO of Ovid Therapeutics Inc.,
a private company developing novel medicines for orphan diseases of the brain. Prior to Ovid, he worked as President and CEO of Teva Pharmaceutical Industries Ltd.
where he was responsible for overseeing all aspects of one of the world’s largest pharmaceutical companies. He has also served as a member of the executive committee
of Bristol-Myers Squibb and as a senior executive in Novartis AG. Currently he is serving on the Board of ZappRx and the Emerging Companies Section of BIO. He is the
recipient of a number of awards including the Kermode Prize for work on novel hypertension drugs, the Albert Einstein Award for Leadership in Life Sciences, the B’nai
B’rith Award for Distinguished Achievement and the Officer’s Cross of the Order of Merit of the Republic of Hungary.
Meetings and attendance record:
The Company prepares schedule of the Board and the Committee meeting in advance for the Directors to make it convenient to attend. The Company circulates the
agenda well ahead and provides the following information inter-alia to the Board and the Committee:
Annual operating plans and budgets and any updates.
Capital budgets and any updates.
Quarterly results for the Company and its operating divisions or business segments.
Minutes of meetings of audit committee and other committees of the Board of directors.
The information on recruitment and remuneration of senior officers just below the level of Board of directors, including appointment or removal of Chief Financial
Officer and the Company Secretary.
Show cause, demand, prosecution notices and penalty notices, which are materially important.
Biocon Limited
139

Fatal or serious accidents, dangerous occurrences, any material effluent or pollution problems.
Any material default in financial obligations to and by the Company, or substantial non-payment for goods sold by the Company.
Any issue, which involves possible public or product liability claims of substantial nature, including any judgement or order which, may have passed strictures on
the conduct of the Company or taken an adverse view regarding another enterprise that may have negative implications on the Company.
Details of any joint venture or collaboration agreement.
Transactions that involve substantial payment towards goodwill, brand equity, or intellectual property.
Significant labour problems and their proposed solutions. Any significant development in Human Resources/ Industrial Relations front like signing of wage
agreement, implementation of Voluntary Retirement Scheme etc.
Sale of investments, subsidiaries, assets which are material in nature and not in normal course of business.
Quarterly details of foreign exchange exposures and the steps taken by management to limit the risks of adverse exchange rate movement, if material.
Non-compliance of any regulatory, statutory or listing requirements and shareholders service such as non-payment of dividend, delay in share transfer etc.
During the year, the Board of Directors met six times on April 29, 2015, June 25, 2015, July 23, 2015, October 20, 2015, January 21, 2016 and March 16, 2016. The details
of Directors’ attendance at the Board meetings during the year and at the last Annual General Meeting are given below.
The details of number of directorship in Indian Companies and Committee membership held in Indian public companies as on March 31, 2016 is given below. None of
the directors on the Board hold directorships in more than ten public companies. Further, none of them is a member of more than ten committees or chairman of more
than five committees across all the public companies in which he is a director.
Name of the Director Relationship with other Directors No. of Board
meeting
attended @
Attendance at
the last AGM
No. of Directorships
held in other Indian
Companies
No. of Committee Memberships/
Chairmanship held in other Indian
Public Companies#
Ms. Kiran Mazumdar-Shaw Spouse of Mr. John Shaw & Sister of
Prof. Ravi Mazumdar
6 Yes 11 -
Mr. John Shaw Spouse of Ms. Kiran Mazumdar- Shaw 5 Yes 6 -
Dr. Arun S Chandavarkar None 6 Yes 2 1
Prof. Ravi Mazumdar Brother of Ms. Kiran Mazumdar- Shaw 5 Yes - -
Mr. Russell Walls None 5 Yes 3 4 (including 3 as Chairman)
Ms. Mary Harney None 5 Yes - -
Mr. Daniel M Bradbury None 6 Yes 2 1
Dr. Vijay K Kuchroo None 4 - - -
Dr. Jeremy M Levin None 6 - - -
Mr. Suresh N Talwar* None 2 Yes Not Applicable Not Applicable
Prof. Charles L Cooney* None 3 Yes Not Applicable Not Applicable
Dr. Bala. S. Manian* None 3 Yes Not Applicable Not Applicable
@ Includes meetings attended through audio-visual/video conferencing mode.
*Ceased to be a director on the Board w.e.f. July 24, 2015 on completion of their tenure.
# As per regulation 26(1) of SEBI (Listing Obligations and Disclosure Requirements) Regulations, 2015, Membership/Chairmanship of the Audit Committee and
Stakeholders Relationship Committee in Indian public companies have been reported.
Shareholding of Non-Executive Directors
Name of the Director Nature of Directorship Details of shareholding as at March 31, 2016
Prof. Ravi Mazumdar* Non-Executive 565,014
*Joint holding with others
Re-appointment of Directors
Dr. Arun S Chandavarkar, shall retire by rotation at the ensuing Annual General Meeting and is eligible for re-appointment.
Notice of interest by Senior Management personnel
The Board has noted that no material financial and commercial transactions have been entered into between the Company and Senior Management team, where they
have personal interest.
Succession planning
The Nomination and Remuneration Committee works with the Board on the leadership succession plan, and prepares contingency plans for succession in case of any
exigencies.
Details of Familiarisation programme to Independent Directors:
Regulation 25(7) of SEBI (Listing Obligations and Disclosure Requirements) Regulations, 2015 and Schedule IV of the Companies Act, 2013 mandates the Company
to familiarize the Independent Directors with the Company by conducting training programmes. During the year, the Board members were regularly apprised with
the overview of the Company and its operations by the Senior Management team. Further, the business unit heads made presentation to the Board during the Board
meeting on a quarterly basis pertaining to the performance and future strategy for their respective business units. The Board was also regularly appraised of all regulatory
and policy changes.
Credibly Capable | Annual Report 2016140

Financial Report
The familiarisation policy including details of familiarisation programmes attended by independent directors during the year ended March 31, 2016 is posted on the
website of the Company at http://www.biocon.com/docs/Familiarisation_Policy.pdf
Meeting of Independent Directors
During the year, the Independent directors met in an executive session without the presence of Non-Independent Directors and members of the Management. The
Independent directors reviewed the performance of Non-Independent Directors, the Board and the Chairperson of the Company. They assessed the quality, quantity and
timeliness of flow of information between the Company management and the Board that is necessary for the Board to effectively and reasonably perform their duties.
Board Committees
The Board has constituted various Committees to focus on specific areas and to make informed decisions within their authority. Each Committee is directed by its Charter
which outlines their scope, roles and responsibilities and their powers. All the decisions and recommendations of the Committee are placed before the Board for their
approval.
The various Committees of the Board are as under:
Audit & Risk Committee
Nomination & Remuneration Committee
Stakeholders Relationship Committee
Corporate Social Responsibility Committee
Share Transfer Committee
Audit & Risk Committee
Terms of Reference
The Board constituted the Audit Committee on April 16, 2001 and title of the Committee was changed from Audit Committee to Audit & Risk Committee in July 2014.
The Audit & Risk Committee discharges such duties and functions generally indicated under Regulation 18 of the SEBI (Listing Obligations and Disclosure Requirements)
Regulations, 2015 and as per Section 177 of Companies Act, 2013 and also such other functions as may be specifically dedicated to it by the Board from time to time.
The Company has put in place an enterprise wide Risk Management Framework. This holistic approach provides the assurance that, to the best of its capabilities, the
Company and all its business units identify, assess and mitigate risks that could materially impact its performance in achieving the stated objectives. The Committee
ensures that the Company is taking appropriate measures to achieve prudent balance between risk and reward in both ongoing and new business activities, reviews
strategic decisions of the Company and on regular basis reviews the Company’s portfolio of risks considering it against the Company’s risk appetite. The Committee also
recommend changes to the Risk Management Technique and/or associated frameworks, processes and practices of the Company.
The role of Audit Committee, inter-alia, includes the following:
To oversee the Company’s financial reporting process and the disclosure of its financial information to ensure that the financial statements are correct, sufficient and
credible.
Recommendation for appointment, remuneration and terms of appointment of auditors of the Company.
Approval of payment to statutory auditors for any other services rendered by the statutory auditors.
Reviewing, with the management, the quarterly & half yearly financial results and annual financial statements before submission to the Board for approval.
Reviewing, with the management, the annual financial statements and auditor’s report thereon before submission to the Board for approval, with particular
reference to:
a. Matters required to be included in the Director’s Responsibility Statement to be included in the Board’s report in terms of Clause (c) of sub-section 3 of Section
134 of the Companies Act, 2013
b. Changes, if any, in accounting policies and practices and reasons for the same
c. Major accounting entries involving estimates based on the exercise of judgement by management
d. Significant adjustments made in the financial statements arising out of audit findings
e. Compliance with other legal requirements relating to financial statements
f. Compliance with applicable Accounting Standard issued by ICAI or other appropriate authority
g. Disclosure of any related party transactions and review of subsequent modification of transactions of the Company with related parties
h. Modified opinion(s) in the draft audit report.
Reviewing, with the management, auditor’s independence, effectiveness of audit process and performance of statutory and internal auditors, adequacy of internal
control systems.
Scrutiny inter corporate loans and investments.
Valuation of undertakings or assets of the Company, wherever it is necessary.
Discussion with statutory auditors before the audit commences, about the nature and scope of audit as well as post-audit discussion to ascertain any area of
concern.
Discussion with internal auditors of any significant findings and follow up thereon.
Review and evaluate the internal financial control and risk management system.
Reviewing the adequacy of internal audit function, reporting structure coverage and frequency of internal audit.
Review the implementation and functioning of Whistle blower mechanism in the Company.
Biocon Limited
141

Approval of appointment of chief financial officer after assessing the qualifications, experience and background, etc. of the candidate.
The audit committee shall mandatorily review the following information:
management discussion and analysis of financial condition and results of operations.
statement of significant related party transactions (as defined by the audit committee), submitted by management.
management letters/letters of internal control weaknesses issued by the statutory auditors.
internal audit reports relating to internal control weaknesses.
the appointment, removal and terms of remuneration of the internal auditor shall be subject to review by the audit committee.
statement of deviations, if any.
Composition
During the year the Committee was reconstituted on October 09, 2015 with interchange of committee members for effective functioning.
The following Directors are the members of the Committee as at March 31, 2016:
1. Mr. Russell Walls, Chairman
2. Mr. Daniel M Bradbury
3. Dr. Jeremy M Levin
All the members of the Committee are Non-Executive and Independent Directors. The members possess sound knowledge of accounts, finance, audit and legal matters.
The Audit & Risk Committee of the Company reviews the financial statements of all the subsidiary companies. The minutes of Board Meetings of the Indian subsidiary
companies are placed for review at the Board Meeting of the Company.
Meeting and attendance during the year
During the year, the Committee met 5 times on April 29, 2015, July 23, 2015, October 20, 2015, January 21, 2016 and March 16, 2016. The Senior Management team,
Internal Auditors and Statutory Auditors attended the meetings of the Audit & Risk Committee as per the requirement. The Company Secretary acts as the Secretary to
the Audit & Risk Committee.
The Committee meets regularly in private sessions with the external auditors, the internal auditors and the chief financial officer.
Name No of meeting held No of meeting attended
Mr. Russell Walls 5 5
Mr. Daniel M Bradbury 5 3
Dr. Jeremy M Levin 5 5
Mr. Suresh N Talwar* 2 2
Prof. Charles L Cooney* 2 2
Prof Ravi Mazumdar# 2 2
*Mr. Suresh N Talwar and Prof. Charles L Cooney ceased to be member w.e.f. July 24, 2015 on completion of their tenure.
# Prof. Ravi Mazumdar stepped down from the Committee after its reconstitution on October 09, 2015.
CEO/CFO Certi!cation
The CEO and CFO have certified, in terms of regulation 17(8) of the SEBI (Listing Obligations and Disclosure Requirements) Regulations, 2015 to the Board that the
financial statements present a true and fair view of the Company’s affairs and are in compliance with existing accounting standards.
Nomination & Remuneration Committee
Terms of Reference
The Committee functions as per the Regulation 19 of the SEBI (Listing Obligations and Disclosure Requirements) Regulations, 2015 and as per Section 178 of the
Companies Act, 2013. The purpose of the Committee is to determine/review the Company’s policy on specific remuneration packages for the Executive Directors
including pension rights and any compensation payment, oversee the framing, review and implementation of compensation policy of the Company on behalf of the
Board, form a policy, procedures and schemes and to undertake overall supervision and administration of Employee Stock Option Schemes (ESOSs) of the Company
and to review the Board structure, size and composition and make recommendation for any change. The Committee also formulate evaluation criteria for directors and
the Board.
Composition
The Board constituted the Remuneration Committee on April 16, 2001 and title of the Committee was changed from Remuneration Committee to Nomination and
Remuneration Committee in April 2014. During the year, the Committee was reconstituted on October 09, 2015. The following directors are the members of the
Committee as at March 31, 2016:
1. Ms. Mary Harney, Chairperson
2. Dr. Vijay K Kuchroo
3. Prof. Ravi Mazumdar
Credibly Capable | Annual Report 2016142
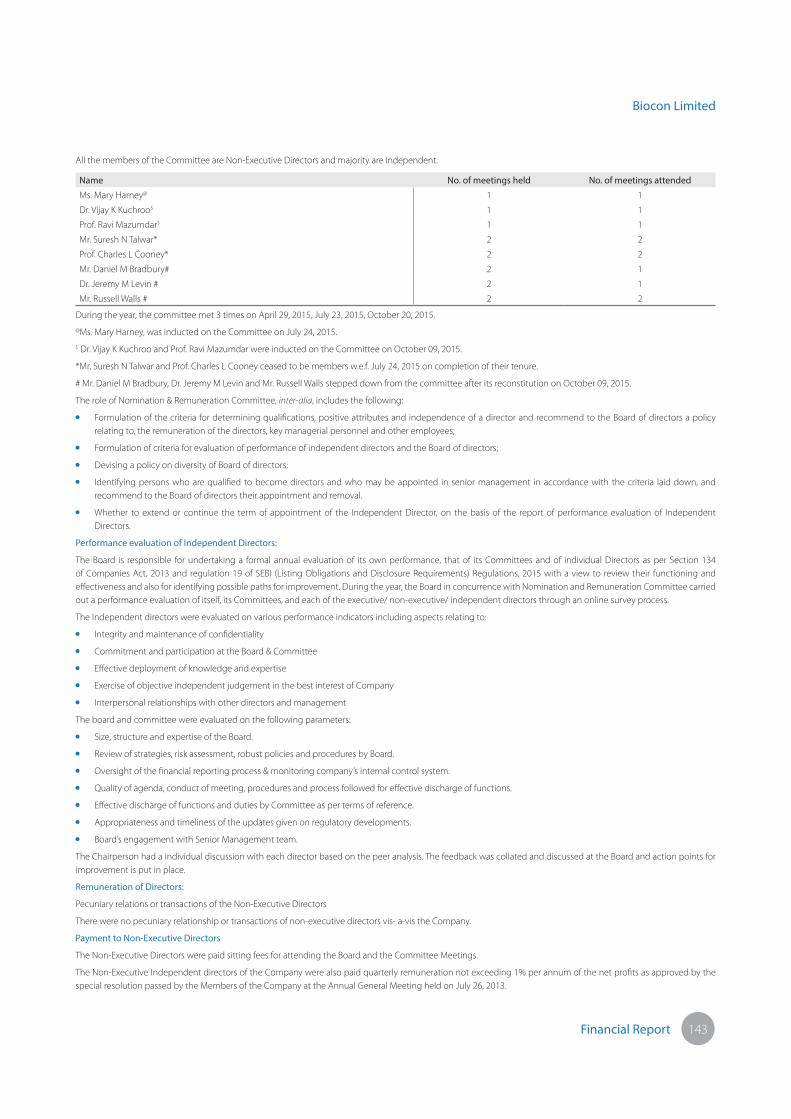
Financial Report
All the members of the Committee are Non-Executive Directors and majority are Independent.
Name No. of meetings held No. of meetings attended
Ms. Mary Harney@ 1 1
Dr. Vijay K Kuchroo$ 1 1
Prof. Ravi Mazumdar$ 1 1
Mr. Suresh N Talwar* 2 2
Prof. Charles L Cooney* 2 2
Mr. Daniel M Bradbury# 2 1
Dr. Jeremy M Levin # 2 1
Mr. Russell Walls # 2 2
During the year, the committee met 3 times on April 29, 2015, July 23, 2015, October 20, 2015.
@Ms. Mary Harney, was inducted on the Committee on July 24, 2015.
$ Dr. Vijay K Kuchroo and Prof. Ravi Mazumdar were inducted on the Committee on October 09, 2015.
*Mr. Suresh N Talwar and Prof. Charles L Cooney ceased to be members w.e.f. July 24, 2015 on completion of their tenure.
# Mr. Daniel M Bradbury, Dr. Jeremy M Levin and Mr. Russell Walls stepped down from the committee after its reconstitution on October 09, 2015.
The role of Nomination & Remuneration Committee, inter-alia, includes the following:
Formulation of the criteria for determining qualifications, positive attributes and independence of a director and recommend to the Board of directors a policy
relating to, the remuneration of the directors, key managerial personnel and other employees;
Formulation of criteria for evaluation of performance of independent directors and the Board of directors;
Devising a policy on diversity of Board of directors;
Identifying persons who are qualified to become directors and who may be appointed in senior management in accordance with the criteria laid down, and
recommend to the Board of directors their appointment and removal.
Whether to extend or continue the term of appointment of the Independent Director, on the basis of the report of performance evaluation of Independent
Directors.
Performance evaluation of Independent Directors:
The Board is responsible for undertaking a formal annual evaluation of its own performance, that of its Committees and of individual Directors as per Section 134
of Companies Act, 2013 and regulation 19 of SEBI (Listing Obligations and Disclosure Requirements) Regulations, 2015 with a view to review their functioning and
effectiveness and also for identifying possible paths for improvement. During the year, the Board in concurrence with Nomination and Remuneration Committee carried
out a performance evaluation of itself, its Committees, and each of the executive/ non-executive/ independent directors through an online survey process.
The Independent directors were evaluated on various performance indicators including aspects relating to:
Integrity and maintenance of confidentiality
Commitment and participation at the Board & Committee
Effective deployment of knowledge and expertise
Exercise of objective independent judgement in the best interest of Company
Interpersonal relationships with other directors and management
The board and committee were evaluated on the following parameters:
Size, structure and expertise of the Board.
Review of strategies, risk assessment, robust policies and procedures by Board.
Oversight of the financial reporting process & monitoring company’s internal control system.
Quality of agenda, conduct of meeting, procedures and process followed for effective discharge of functions.
Effective discharge of functions and duties by Committee as per terms of reference.
Appropriateness and timeliness of the updates given on regulatory developments.
Board’s engagement with Senior Management team.
The Chairperson had a individual discussion with each director based on the peer analysis. The feedback was collated and discussed at the Board and action points for
improvement is put in place.
Remuneration of Directors:
Pecuniary relations or transactions of the Non-Executive Directors
There were no pecuniary relationship or transactions of non-executive directors vis- a-vis the Company.
Payment to Non-Executive Directors
The Non-Executive Directors were paid sitting fees for attending the Board and the Committee Meetings.
The Non-Executive Independent directors of the Company were also paid quarterly remuneration not exceeding 1% per annum of the net profits as approved by the
special resolution passed by the Members of the Company at the Annual General Meeting held on July 26, 2013.
Biocon Limited
143

Criteria for making payment to Non-Executive Directors
The role of Non-Executive/Independent Directors of the Company is not just restricted to Corporate Governance or outlook of the Company but they also bring with
them significant professional expertise and rich experience across the wide spectrum of functional areas such as marketing, technology, corporate strategy, legal, finance
and other corporate functions. The Company seeks their expert advice on various matters in science, technology, legal or Intellectual property.
The details of remuneration and sitting fees paid or provided to each of the Directors during the year ended March 31, 2016 are given below:
(Amount in ` Million)
Salary and Perquisites Others
Name of the Director Fixed pay & Bonus Perquisites# Retiral Bene!ts Commission Sitting fees Total
Ms. Kiran Mazumdar-Shaw 15.1 0.03 0.89 - - 16.02
Mr. John Shaw 15.6 0.03 - - - 15.63
Dr. Arun S Chandavarkar* 28.75 0.95 1.15 - - 30.85
Prof. Ravi Mazumdar - - - - 0.50 0.50
Mr. Russell Walls - - - 3.56 0.50 4.06
Ms. Mary Harney - - - 2.46 0.50 2.96
Mr. Daniel M Bradbury - - - 2.21 0.50 2.71
Dr. Vijay K Kuchroo - - - 1.89 0.40 2.29
Dr. Jeremy M Levin - - - 2.60 0.50 3.10
Mr. Charles L Cooney - - - 1.66 0.20 1.86
Mr. Suresh N Talwar - - - 1.02 0.20 1.22
Mr. Bala S Manian - - - 1.28 0.20 1.48
* Employee stock compensation expense allocable to Dr. Arun S Chandavarkar for the Restricted Stock Units under the RSU Plan, 2015 is ` 4 million, which is not included in
the remuneration disclosed above.
# Perquisites valued as per Income-tax Act, 1961.
The Chairperson & Managing Director and the Vice-Chairman were paid remuneration, including performance bonus, not exceeding amount approved by the
shareholders in the Annual General Meeting held on July 24, 2015 and July 26, 2013 respectively and Nomination and Remuneration Committee. Further, CEO & Joint
Managing Director was paid remuneration, including performance bonus, not exceeding amount approved by the shareholders in the Annual General Meeting held on
July 25, 2014 and Nomination and Remuneration Committee.
The Executive Directors are employees of the Company and are subject to service conditions as per the Company policy, which is two month notice period or such
period as mutually agreed. There is no separate provision for payment of severance fees. However, Independent Directors are not subject to any notice period and
severance fees.
During the year ended March 31, 2016, no options under the ESOP Plan of the Company were granted to the Executive/Non-Executive Directors. Nomination and
Remuneration Committee has approved grant of 76,500 Restricted Stock Units under RSU Plan, 2015 to Dr. Arun S Chandavarkar.
Stakeholders’ Relationship Committee:
Terms of Reference
The Committee is functioning in terms of mandatory requirement of Regulation 20 of SEBI (Listing Obligations and Disclosure Requirements) Regulations, 2015 and as
per Section 178 of the Companies Act, 2013. The main role of the Committee is to look into the redressal of grievances of investors, debenture holders, deposit holders
or other security holders relating to transfer of shares; non-receipt of balance sheet; non-receipt of declared dividends; non-receipt of annual reports; non-receipt of
interest etc. In addition to this, the Committee also looks into investor relations, share transfer (to the extent not delegated to officials) and monitors servicing of investor
requirements.
Composition
The Board constituted the Investors Grievance Committee on January 17, 2004 and title of the Committee was re-designated as Stakeholders Relationship Committee in
April 2014. During the year, the Committee was reconstituted in October 05, 2015 for effective functioning. The following directors are the members of the Committee
as at March 31, 2016:
1. Mr. Daniel M Bradbury (Chairman)
2. Mr. Russell Walls
3. Prof. Ravi Mazumdar
All the members of the Committee are Non-Executive Directors.
Meeting and attendance during the year
During the year, the Committee met 3 times on April 29, 2015, October 20, 2015 and January 21, 2016.
Name No. of meetings held No. of meetings attended
Mr. Daniel M Bradbury@ 2 1
Mr. Russell Walls$ 2 2
Prof. Ravi Mazumdar$ 2 2
Prof. Charles L Cooney* 1 1
Ms. Kiran Mazumdar-Shaw # 1 -
Mr. John Shaw # 1 1
Credibly Capable | Annual Report 2016144
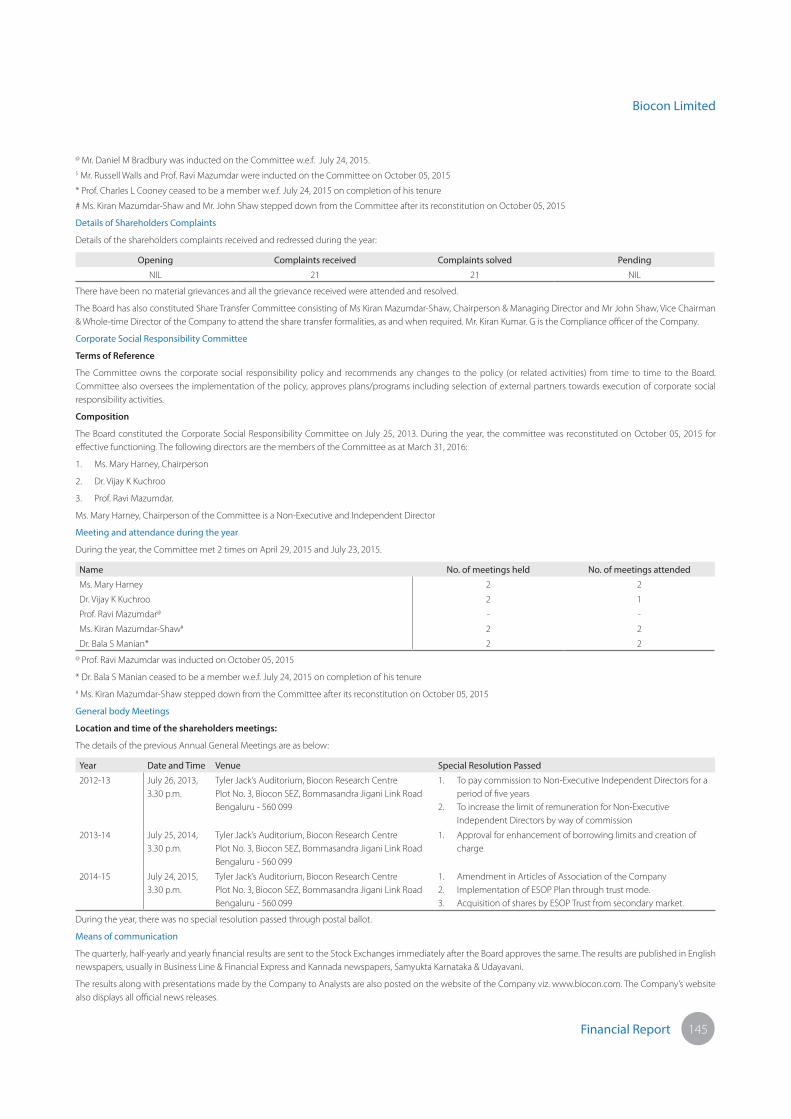
Financial Report
@ Mr. Daniel M Bradbury was inducted on the Committee w.e.f. July 24, 2015.$ Mr. Russell Walls and Prof. Ravi Mazumdar were inducted on the Committee on October 05, 2015
* Prof. Charles L Cooney ceased to be a member w.e.f. July 24, 2015 on completion of his tenure
# Ms. Kiran Mazumdar-Shaw and Mr. John Shaw stepped down from the Committee after its reconstitution on October 05, 2015
Details of Shareholders Complaints
Details of the shareholders complaints received and redressed during the year:
Opening Complaints received Complaints solved Pending
NIL 21 21 NIL
There have been no material grievances and all the grievance received were attended and resolved.
The Board has also constituted Share Transfer Committee consisting of Ms Kiran Mazumdar-Shaw, Chairperson & Managing Director and Mr John Shaw, Vice Chairman
& Whole-time Director of the Company to attend the share transfer formalities, as and when required. Mr. Kiran Kumar. G is the Compliance officer of the Company.
Corporate Social Responsibility Committee
Terms of Reference
The Committee owns the corporate social responsibility policy and recommends any changes to the policy (or related activities) from time to time to the Board.
Committee also oversees the implementation of the policy, approves plans/programs including selection of external partners towards execution of corporate social
responsibility activities.
Composition
The Board constituted the Corporate Social Responsibility Committee on July 25, 2013. During the year, the committee was reconstituted on October 05, 2015 for
effective functioning. The following directors are the members of the Committee as at March 31, 2016:
1. Ms. Mary Harney, Chairperson
2. Dr. Vijay K Kuchroo
3. Prof. Ravi Mazumdar.
Ms. Mary Harney, Chairperson of the Committee is a Non-Executive and Independent Director
Meeting and attendance during the year
During the year, the Committee met 2 times on April 29, 2015 and July 23, 2015.
Name No. of meetings held No. of meetings attended
Ms. Mary Harney 2 2
Dr. Vijay K Kuchroo 2 1
Prof. Ravi Mazumdar@ - -
Ms. Kiran Mazumdar-Shaw# 2 2
Dr. Bala S Manian* 2 2
@ Prof. Ravi Mazumdar was inducted on October 05, 2015
* Dr. Bala S Manian ceased to be a member w.e.f. July 24, 2015 on completion of his tenure
# Ms. Kiran Mazumdar-Shaw stepped down from the Committee after its reconstitution on October 05, 2015
General body Meetings
Location and time of the shareholders meetings:
The details of the previous Annual General Meetings are as below:
Year Date and Time Venue Special Resolution Passed
2012-13 July 26, 2013,
3.30 p.m.
Tyler Jack’s Auditorium, Biocon Research Centre
Plot No. 3, Biocon SEZ, Bommasandra Jigani Link Road
Bengaluru - 560 099
1. To pay commission to Non-Executive Independent Directors for a
period of five years
2. To increase the limit of remuneration for Non-Executive
Independent Directors by way of commission
2013-14 July 25, 2014,
3.30 p.m.
Tyler Jack’s Auditorium, Biocon Research Centre
Plot No. 3, Biocon SEZ, Bommasandra Jigani Link Road
Bengaluru - 560 099
1. Approval for enhancement of borrowing limits and creation of
charge
2014-15 July 24, 2015,
3.30 p.m.
Tyler Jack’s Auditorium, Biocon Research Centre
Plot No. 3, Biocon SEZ, Bommasandra Jigani Link Road
Bengaluru - 560 099
1. Amendment in Articles of Association of the Company
2. Implementation of ESOP Plan through trust mode.
3. Acquisition of shares by ESOP Trust from secondary market.
During the year, there was no special resolution passed through postal ballot.
Means of communication
The quarterly, half-yearly and yearly financial results are sent to the Stock Exchanges immediately after the Board approves the same. The results are published in English
newspapers, usually in Business Line & Financial Express and Kannada newspapers, Samyukta Karnataka & Udayavani.
The results along with presentations made by the Company to Analysts are also posted on the website of the Company viz. www.biocon.com. The Company’s website
also displays all official news releases.
Biocon Limited
145
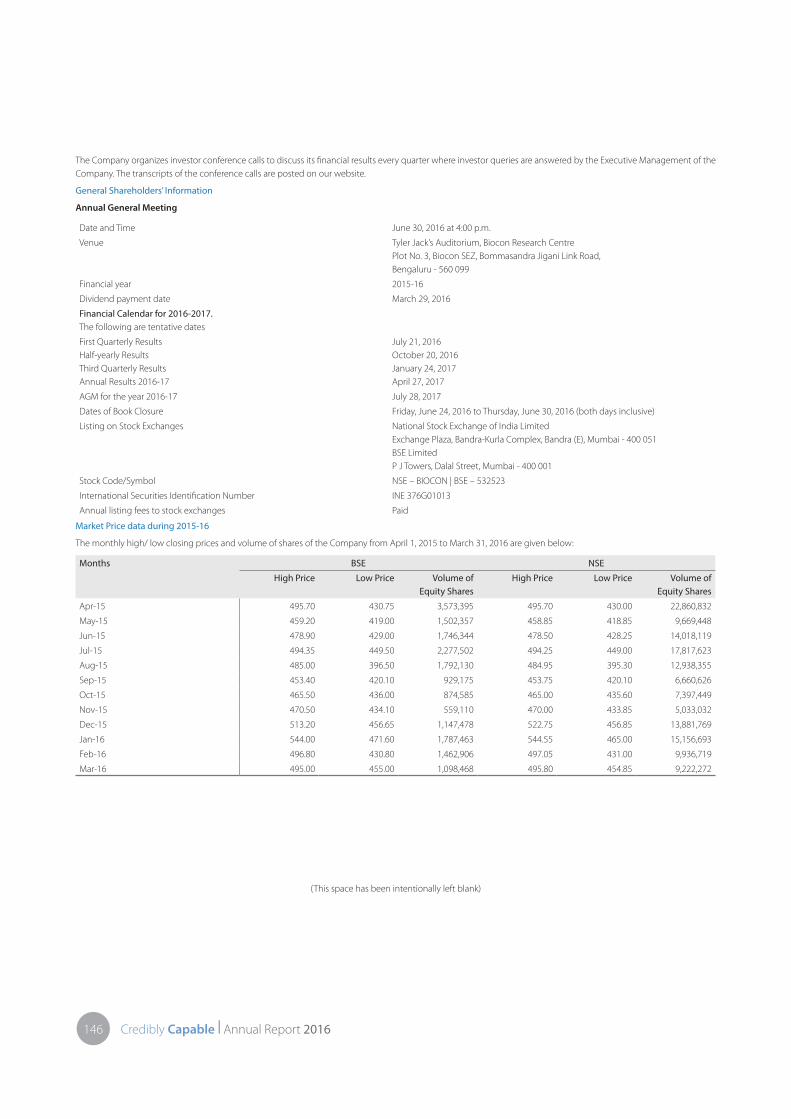
The Company organizes investor conference calls to discuss its financial results every quarter where investor queries are answered by the Executive Management of the
Company. The transcripts of the conference calls are posted on our website.
General Shareholders’ Information
Annual General Meeting
Date and Time June 30, 2016 at 4:00 p.m.
Venue Tyler Jack’s Auditorium, Biocon Research Centre
Plot No. 3, Biocon SEZ, Bommasandra Jigani Link Road,
Bengaluru - 560 099
Financial year 2015-16
Dividend payment date March 29, 2016
Financial Calendar for 2016-2017.
The following are tentative dates
First Quarterly Results
Half-yearly Results
Third Quarterly Results
Annual Results 2016-17
July 21, 2016
October 20, 2016
January 24, 2017
April 27, 2017
AGM for the year 2016-17 July 28, 2017
Dates of Book Closure Friday, June 24, 2016 to Thursday, June 30, 2016 (both days inclusive)
Listing on Stock Exchanges National Stock Exchange of India Limited
Exchange Plaza, Bandra-Kurla Complex, Bandra (E), Mumbai - 400 051
BSE Limited
P J Towers, Dalal Street, Mumbai - 400 001
Stock Code/Symbol NSE – BIOCON | BSE – 532523
International Securities Identification Number INE 376G01013
Annual listing fees to stock exchanges Paid
Market Price data during 2015-16
The monthly high/ low closing prices and volume of shares of the Company from April 1, 2015 to March 31, 2016 are given below:
Months BSE NSE
High Price Low Price Volume of
Equity Shares
High Price Low Price Volume of
Equity Shares
Apr-15 495.70 430.75 3,573,395 495.70 430.00 22,860,832
May-15 459.20 419.00 1,502,357 458.85 418.85 9,669,448
Jun-15 478.90 429.00 1,746,344 478.50 428.25 14,018,119
Jul-15 494.35 449.50 2,277,502 494.25 449.00 17,817,623
Aug-15 485.00 396.50 1,792,130 484.95 395.30 12,938,355
Sep-15 453.40 420.10 929,175 453.75 420.10 6,660,626
Oct-15 465.50 436.00 874,585 465.00 435.60 7,397,449
Nov-15 470.50 434.10 559,110 470.00 433.85 5,033,032
Dec-15 513.20 456.65 1,147,478 522.75 456.85 13,881,769
Jan-16 544.00 471.60 1,787,463 544.55 465.00 15,156,693
Feb-16 496.80 430.80 1,462,906 497.05 431.00 9,936,719
Mar-16 495.00 455.00 1,098,468 495.80 454.85 9,222,272
(This space has been intentionally left blank)
Credibly Capable | Annual Report 2016146

Financial Report
Relative Movement Chart
The chart below gives the relative movement of the closing price of the Company’s share and the BSE Sensex/NSE Nifty relative to the closing price. The period covered
is April 1, 2015 to March 31, 2016. The Biocon Management cautions that the stock price movement shown in the graph below should not be considered indicative of
potential future stock price performance.
Biocon & BSE Sensex share price movement from April 1, 2015 to March 31, 2016.
0
100
200
300
400
500
600
1-Mar-1
6
1-Feb-1
6
1-Jan-1
6
1-Dec-1
5
1-Nov-1
5
1-Oct-1
5
1-Sep-1
5
1-Aug-1
5
1-Jul-1
5
1-Jun-1
5
1-May-1
5
1-Apr-1
50
5000
10000
15000
20000
25000
30000
35000
Biocon BSE Sensex Close
Biocon & S & P Nifty share price movement from April 1, 2015 to March 31, 2016.
0
100
200
300
400
500
600
1-Mar-1
6
1-Feb-1
6
1-Jan-1
6
1-Dec-1
5
1-Nov-1
5
1-Oct-1
5
1-Sep-1
5
1-Aug-1
5
1-Jul-1
5
1-Jun-1
5
1-May-1
5
1-Apr-1
5010002000300040005000600070008000900010000
Biocon NSE Nifty Close
Biocon & S & P CNX 200 share price movement from April 1, 2015 to March 31, 2016.
0
100
200
300
400
500
600
1-Mar-1
6
1-Feb-1
6
1-Jan-1
6
1-Dec-1
5
1-Nov-1
5
1-Oct-1
5
1-Sep-1
5
1-Aug-1
5
1-Jul-1
5
1-Jun-1
5
1-May-1
5
1-Apr-1
50500100015002000250030003500400045005000
Biocon NSE CNX 200
Biocon & BSE S & P 200 share price movement from April 1, 2015 to March 31, 2016.
0
100
200
300
400
500
600
1-Mar-1
6
1-Feb-1
6
1-Jan-1
6
1-Dec-1
5
1-Nov-1
5
1-Oct-1
5
1-Sep-1
5
1-Aug-1
5
1-Jul-1
5
1-Jun-1
5
1-May-1
5
1-Apr-1
50
500
1000
1500
2000
2500
3000
3500
4000
Biocon BSE Sensex 200
Share Transfer System:
99.76% of the equity shares of the Company are in electronic form. Transfers of these shares are done through the depositories with no involvement of the Company.
The Share Transfer Committee approves the transfer of shares in the physical form as per the time limits and procedure specified in the regulation 40 of SEBI (Listing
Obligations and Disclosure Requirements) Regulations, 2015.
Biocon Limited
147

Distribution of the Shareholding
The distribution of shareholding (category wise) as on March 31, 2016 is as under:
Sl.
No.
Category No. of shares % to Equity
1 Promoters (Indian & Foreign) 121,432,446 60.72
2 Foreign Institutional Investors 27,264,626 13.63
3 Mutual Funds, Banks, IFIs 10,734,452 5.37
4 NRIs & Foreign Nationals 2,280,542 1.14
5 Corporate Bodies 2,847,867 1.42
6 Trusts 8,337,978 4.17
7 Indian Public & Others 27,102,089 13.55
Total 200,000,000 100.00
Distribution of shareholding by number of shares:
Category No. of shareholders Total Shares % to Shareholders % to paid-up capital
Up to 5,000 106,349 10,874,768 97.57 5.44
5,001- 10,000 1,289 1,917,295 1.18 0.96
10,001- 20,000 600 1,739,401 0.55 0.87
20,001- 30,000 214 1,060,618 0.20 0.53
30,001- 40,000 85 596,587 0.08 0.30
40,001- 50,000 74 695,272 0.07 0.35
50,001- 100,000 133 1,983,860 0.12 0.99
100,001 & Above 252 181,132,199 0.23 90.56
Total 108,996 200,000,000 100.00 100.00
Statement showing Un-claimed Dividend as at March 31, 2016
As per Section 124(5) of the Companies Act, 2013 and Section 205A of Companies Act, 1956 dividend which remains unpaid or unclaimed for a period of seven years
from the date of its transfer to the unpaid dividend account, is liable to be transferred to the “Investor Education Protection Fund” (IEPF) established by the Central
Government. The amount of unclaimed dividend upto financial years ended March 31, 2008 have been transferred to IEPF by the Company. The unclaimed dividend
amounts for subsequent years along with their due dates for transfer to IEPF is mentioned below:
Sl.
No.
Year Dividend Per Share
(in `)
Nature Amount of unclaimed dividend as
at March 31, 2016 (in `)
Due date for transfer of unclaimed dividend
by the Company to Investors Education
Protection fund (IEPF)
1 2008-09 3.00 Final 649,653 28/Aug/16
2 2009-10 3.50 Final 550,385 28/Aug/17
3 2010-11 1.50 Interim 303,935 3/Jun/18
4 2010-11 3.00 Final 645,345 26/Aug/18
5 2011-12 5.00 Final 1,121,945 31/Aug/19
6 2012-13 7.50 Final 1,246,705 31/Aug/20
7 2013-14 5.00 Final 632,110 31/Aug/21
8 2014-15 5.00 Final 903,530 1/May/22
9 2015-16 5.00 Final 3,456,080 16/April/23
There are no shares in the demat suspense account or unclaimed suspense account.
During the year, the Company has transferred the unclaimed dividend amount for the FY 2007-08 to IEPF account of the Central Government.
Dematerialization of shares and liquidity
The Company’s equity shares are regularly traded on NSE and BSE, in dematerialised form. Equity shares of the Company representing 99.76% of the Company’s equity
share capital are dematerialised as on March 31, 2016.
There are no outstanding GDRs/ ADRs/ Warrants and convertible instruments.
Commodity Price risk or foreign exchange risk and hedging activities
Company has an approved Foreign Exchange Risk Management Policy and accordingly, during the year ended March 31, 2016, the Company has managed the foreign
exchange risk and hedged to the extent considered necessary. The details of foreign currency exposure and hedging are disclosed in notes to the financial statements
(Note 34).
Plant Locations
I II III IV
20th KM, Hosur Road,Electronics City P.O.Bengaluru - 560 100
Biocon ParkPlot No. 2, 3, 4 and 5Bommasandra – Jigani Link RoadBengaluru – 560 100
Plot 213-215IDA Phase-II, PashamylaramMedak District, Telangana - 502307
Plot No. 2,Road No. 21, JN Pharma City, IDA, Parvada, Vishakapatnam, Andhra Pradesh - 531021
Credibly Capable | Annual Report 2016148
Financial Report
Contact Information
Financial Disclosure Correspondence
Mr. Siddharth Mittal
President – Finance & Chief Financial Officer
Tel: 91 80 - 2808 2808
E-mail id: [email protected]
Media Correspondence
Ms. Seema Ahuja
Vice President & Global Head of Communications
Tel: 91 80 - 2808 2808
E-mail id: [email protected]
Investor Relations Correspondence (Investors & Research Analysts)
Mr. Saurabh Paliwal
Head - Investor Relations
Tel.: 91 80 - 2808 2040
E-mail id: [email protected]
Registrar and Share Transfer Agents
Karvy Computershare Private Limited
(Unit: Biocon Limited),
Plot 31-32, Karvy Selenium, Tower B, Gachibowli, Financial District,
Nanakramguda, Hyderabad – 500 032
E-mail id: [email protected], [email protected]
For queries related to shares/ dividend/ compliance
Mr. Kiran Kumar G.
Company Secretary and Compliance Officer
Tel.: 91 80 - 2808 2037
E-mail id: [email protected] or [email protected]
Correspondence Address
Regd. Office
Biocon Limited
20th K M, Hosur Road,
Electronics City P.O., Bengaluru - 560 100
Declaration of Code of Conduct
Biocon Group is committed to conducting its business in accordance with the applicable laws, rules and regulations and with highest standards of business ethics. The
Company has adopted a “Code of Ethics and Business Conduct” which is applicable to all directors, officers and employees.
I hereby certify that the Board Members and Senior Management of the Company have affirmed the compliance with the Code of Ethics and Business Conduct, for the
year 2015-16.
For Biocon Limited
(Sd/-)
Bengaluru Dr. Arun S Chandavarkar
April 26, 2016 Chief Executive Officer
Other Disclosures:
Details of non-compliance:
There were no penalties or strictures imposed on the Company by Stock Exchanges, SEBI or any statutory authority in any matter related to capital markets during the
last 3 years.
Whistle Blower Policy:
The Company has laid down a Whistle Blower Policy and the same has been posted on the Internet/Intranet of the Company. The address of the Chairman of the Audit
& Risk Committee has been given in the policy for the employees to report the matters of concern. No employee is denied the opportunity to meet the members of
the Audit & Risk Committee. The policy is posted on the website of the Company. http://www.biocon.com/docs/Biocon_Group_Integrity_Whistle_Blower_Policy.pdf
Compliance with Discretionary Requirements:
Apart from complying with the mandatory requirements prescribed by regulation of SEBI (Listing Obligations and Disclosure Requirements) Regulation, 2015, the
Company has complied with a few discretionary requirements, such as the Internal Auditor report directly to the Chairman of the Audit & Risk Committee and appointed
separate persons as Chairperson, Managing Director and Chief Executive Officer.
Material Subsidiary:
The Company has formulated a policy for determining ‘material’ subsidiaries pursuant to the provisions of the Listing Agreement. The said policy is available at the
Company’s website http://www.biocon.com/docs/PolicyDocument_MaterialSubsidiary.pdf
Related Party Transactions
The Board has laid down a policy on dealing with related party transactions and it is posted on the Website of the Company. http://www.biocon.com/docs/
PolicyDocument_RelatedPartyTransaction_2015.pdf
During the year, there have been no materially significant related party transactions undertaken by the Company under Section 188 of the Companies Act, 2013 and
Regulation 23 of SEBI (Listing Obligations and Disclosure Requirements) Regulations, 2015 that may have potential conflict with the interest of the Company at large.
Code of Conduct
The Board has laid down a code of conduct for all Board members and Senior Management of the Company and it is posted on the website of the Company (http://
www.biocon.com/biocon_invrelation_cor_code.asp?subLink=gover). The declaration from Chief Executive Officer with regard to compliance of code of conduct by the
Board of Directors and Senior Management is enclosed and forms part of this report.
Biocon Limited
149

Auditors’ Certi!cate
To
The Members of Biocon Limited
We have examined the compliance of conditions of Corporate Governance by Biocon Limited (“the Company”), for the year ended on March 31, 2016, as stipulated in
Chapter IV of Securities and Exchange Board of India (Listing Obligations and Disclosure Requirements) Regulations, 2015 pursuant to the Listing Agreement of the said
Company with stock exchange(s).
The compliance of conditions of Corporate Governance is the responsibility of the management. Our examination was limited to procedures and implementation
thereof, adopted by the Company for ensuring the compliance of the conditions of the Corporate Governance. It is neither an audit nor an expression of opinion on the
financial statements of the Company.
In our opinion and to the best of our information and according to the explanations given to us, we certify that the Company has complied with the conditions of
Corporate Governance as stipulated in the provisions as specified in chapter IV Securities and Exchange Board of India (Listing Obligations and Disclosure Requirements)
Regulations, 2015 pursuant to Listing Agreement of the said Company with stock exchange(s).
We further state that such compliance is neither an assurance as to the future viability of the Company nor the efficiency or effectiveness with which the management
has conducted the affairs of the Company.
For S.R. Batliboi & Associates LLP
Chartered Accountants
ICAI Firm registration number: 101049W/E300004
per Aditya Vikram Bhauwala
Partner
Membership No.: 208382
Place: Bengaluru
Date: May 23, 2016
Credibly Capable | Annual Report 2016150

Financial Report
Independent Auditor’s ReportTo the Members of Biocon Limited
Report on the Standalone Financial Statements
We have audited the accompanying standalone financial statements of Biocon Limited (“the Company”), which comprise the Balance Sheet as at March 31, 2016, the
Statement of Profit and Loss and Cash Flow Statement for the year then ended, and a summary of significant accounting policies and other explanatory information.
Management’s Responsibility for the Financial Statements
The Company’s Board of Directors is responsible for the matters stated in Section 134(5) of the Companies Act, 2013 (“the Act”) with respect to the preparation of
these standalone financial statements that give a true and fair view of the financial position, financial performance and cash flows of the Company in accordance
with accounting principles generally accepted in India, including the Accounting Standards specified under Section 133 of the Act, read with Rule 7 of the Companies
(Accounts) Rules, 2014. This responsibility also includes maintenance of adequate accounting records in accordance with the provisions of the Act for safeguarding of the
assets of the Company and for preventing and detecting frauds and other irregularities; selection and application of appropriate accounting policies; making judgments
and estimates that are reasonable and prudent; and the design, implementation and maintenance of adequate internal financial control that were operating effectively
for ensuring the accuracy and completeness of the accounting records, relevant to the preparation and presentation of the financial statements that give a true and fair
view and are free from material misstatement, whether due to fraud or error.
Auditor’s Responsibility
Our responsibility is to express an opinion on these standalone financial statements based on our audit. We have taken into account the provisions of the Act, the
accounting and auditing standards and matters which are required to be included in the audit report under the provisions of the Act and the Rules made thereunder.
We conducted our audit in accordance with the Standards on Auditing, issued by the Institute of Chartered Accountants of India, as specified under Section 143(10) of
the Act. Those Standards require that we comply with ethical requirements and plan and perform the audit to obtain reasonable assurance about whether the financial
statements are free from material misstatement.
An audit involves performing procedures to obtain audit evidence about the amounts and disclosures in the financial statements. The procedures selected depend
on the auditor’s judgment, including the assessment of the risks of material misstatement of the financial statements, whether due to fraud or error. In making those
risk assessments, the auditor considers internal financial control relevant to the Company’s preparation of the financial statements that give a true and fair view in
order to design audit procedures that are appropriate in the circumstances. An audit also includes evaluating the appropriateness of accounting policies used and the
reasonableness of the accounting estimates made by the Company’s Directors, as well as evaluating the overall presentation of the financial statements. We believe that
the audit evidence we have obtained is sufficient and appropriate to provide a basis for our audit opinion on the standalone financial statements.
Opinion
In our opinion and to the best of our information and according to the explanations given to us, the standalone financial statements give the information required by the
Act in the manner so required and give a true and fair view in conformity with the accounting principles generally accepted in India of the state of affairs of the Company
as at March 31, 2016, its profit, and its cash flows for the year ended on that date.
Report on Other Legal and Regulatory Requirements
1. As required by the Companies (Auditor’s Report) Order, 2016 (“the Order”) issued by the Central Government of India in terms of sub-section (11) of Section 143 of
the Act, we give in the Annexure 1 a statement on the matters specified in paragraphs 3 and 4 of the Order.
2. As required by Section 143(3) of the Act, we report that:
(a) We have sought and obtained all the information and explanations which to the best of our knowledge and belief were necessary for the purpose of our audit;
(b) In our opinion proper books of account as required by law have been kept by the Company so far as it appears from our examination of those books;
(c) The Balance Sheet, Statement of Profit and Loss, and Cash Flow Statement dealt with by this Report are in agreement with the books of account;
(d) In our opinion, the aforesaid standalone financial statements comply with the Accounting Standards specified under Section 133 of the Act, read with Rule 7
of the Companies (Accounts) Rules, 2014;
(e) On the basis of written representations received from the directors as on March 31, 2016, and taken on record by the Board of Directors, none of the directors
is disqualified as on March 31, 2016, from being appointed as a director in terms of Section 164(2) of the Act;
Biocon Limited
151

(f ) With respect to the adequacy of the internal financial controls over financial reporting of the Company and the operating effectiveness of such controls, refer
to our separate Report in “Annexure 2” to this report;
(g) With respect to the other matters to be included in the Auditor’s Report in accordance with Rule 11 of the Companies (Audit and Auditors) Rules, 2014, in our
opinion and to the best of our information and according to the explanations given to us:
i. The Company has disclosed the impact of pending litigations on its financial position in its financial statements – Refer note 35 to the financial statements;
ii. The Company did not have any long-term contracts including derivative contracts for which there were any material foreseeable losses;
iii. There has been no delay in transferring amounts, required to be transferred, to the Investor Education and Protection Fund by the Company.
For S.R. Batliboi & Associates LLP
Chartered Accountants
ICAI Firm registration number: 101049W
per Aditya Vikram Bhauwala
Partner
Membership No.: 208382
Place: Bengaluru
Date: April 26, 2016
(This space has been intentionally left blank)
Credibly Capable | Annual Report 2016152

Financial Report
Annexure 1 to the Auditors’ ReportThe Annexure referred to in our report to the Members of Biocon Limited (‘the Company’) for the year ended March 31, 2016. We report that:
(i) (a) The Company has maintained proper records showing full particulars, including quantitative details and situation of fixed assets.
(b) All fixed assets have not been physically verified by the management during the year but there is a regular programme of verification, intended to cover all
the fixed assets of the Company over a period, which in our opinion, is reasonable having regard to the size of the Company and the nature of its assets. No
material discrepancies were noticed on such verification.
(c) Based on our audit procedures performed for the purpose of reporting the true and fair view of the financial statements and according to information and
explanations given by the management, the title deeds of immovable properties are held in the name of the Company except for five number of immovable
properties aggregating ` 271 million as at March 31, 2016 for which the Company is in process of obtaining registration. Also, according to information and
explanations given by the management immovable properties aggregating ` 1 million for which the title is in dispute and is sub-judice as at March 31, 2016.
(ii) (a) The management has conducted physical verification of inventory at reasonable intervals during the year. In our opinion, the frequency of verification is
reasonable. No material discrepancies were noticed on such physical verification. Inventories lying with outside parties have been confirmed by them as at
year end and no material discrepancies were noticed in respect of such confirmations.
(iii) (a) The Company has granted loans to two companies covered in the register maintained under Section 189 of the Companies Act, 2013. In our opinion and
according to the information and explanations given to us, the terms and conditions of the loans not prejudicial to the Company’s interest.
(b) In respect of loans granted to companies covered in the register maintained under Section 189 of the Companies Act, 2013, repayment of the principal amount
is as stipulated and payment of interest has been regular.
(c) There is no overdue amount of loans granted to companies listed in the register maintained under Section 189 of the Companies Act, 2013.
(iv) In our opinion and according to the information and explanations given to us, provisions of Section 185 and 186 of the Companies Act, 2013 in respect of loans and
advances given, investments made and, guarantees, and securities given have been complied with by the Company.
(v) The Company has not accepted any deposits from the public.
(vi) We have broadly reviewed the books of account maintained by the Company pursuant to the rules made by the Central Government for the maintenance of cost
records under Section 148(1) of the Companies Act, 2013, related to the manufacture of biopharmaceuticals and biotechnology products and are of the opinion
that prima facie, the specified accounts and records have been made and maintained. We have not, however, made a detailed examination of the same.
(vii) (a) The Company is generally regular in depositing with appropriate authorities undisputed statutory dues including provident fund, employees’ state insurance,
income-tax, sales-tax, wealth-tax, service tax, customs duty, excise duty, value added tax, cess and other material statutory dues applicable to it.
(b) According to the information and explanations given to us, no undisputed amounts payable in respect of provident fund, employees’ state insurance, income-
tax, wealth-tax, service tax, sales-tax, customs duty, excise duty, value added tax, cess and other material statutory dues were outstanding, at the year end, for
a period of more than six months from the date they became payable.
(c) According to the records of the Company, the dues outstanding of income-tax, sales-tax, wealth-tax, service tax, customs duty, excise duty, value added tax
and cess on account of any dispute, are as follows:
Name of the Statute Nature of dues Amount
Claimed (` Mn)
Payment under
protest (` Mn)
Period to which the
amount relates
Forum where dispute is pending
The Central Excise Act, 1944 Excise Duty 1 1 1994-1995 Assistant Collector of Central Excise
The Central Excise Act, 1944 Excise Duty 20 - 2009-2014 Commissioner (Appeals)
The Central Excise Act, 1944 Excise Duty 243 7 2005-2008 and 2009-2013 Customs, Excise and Service Tax Appellate
Tribunal
The Central Excise Act, 1944 Excise Duty 1 - 2009-2011 Revision application before Central
Government
The Customs Act, 1962 Customs Duty 46 45 2004-2005, 2007-2008 and
2009-2012
Customs, Excise and Service Tax Appellate
Tribunal
The Customs Act, 1962 Customs Duty 23 23 2008-2009 to 2011-2012 Commissioner (Appeals)
Finance Act, 1944 Service Tax 91 - FY 2006 to FY 2011 Customs, Excise and Service Tax Appellate
Tribunal
Finance Act, 1944 Service Tax 1 - FY 2009 to FY 2011 Commissioner (Appeal)
Income-tax Act, 1961 Income Tax 4 4 FY1996-1997 Supreme Court
Income-tax Act, 1961 Income Tax 93 86 FY 1997-1998 and FY
2002-2007
High Court of Karnataka
Income-tax Act, 1961 Income Tax 154 - FY 2007-2009 and FY
2010-2011
Income Tax Appellate Tribunal
Income-tax Act, 1961 Income Tax 1,483 - FY 2009-2010 Commissioner (Appeals)
Income-tax Act, 1961 Income Tax 319 - FY 2011-2012 Dispute Resolution Panel
Income-tax Act, 1961 Withholding tax 45 16 FY 2003-2004 to FY 2006-
2007 and FY 2011-2012
Income Tax Appellate Tribunal
Income-tax Act, 1961 Withholding tax 8 - FY 2012-2013 Commissioner (Appeals)
Biocon Limited
153

(viii) Based on our audit procedures performed for the purpose of reporting the true and fair view of the financial statements and according to information and
explanations given by the management, we are of the opinion that the Company has not defaulted in repayment of dues to a financial institution, bank or
government. The Company does not have any borrowing by way of debenture.
(ix) Based on our audit procedures performed for the purpose of reporting the true and fair view of the financial statements and according to the information and
explanations given by the management and on an overall examination of the balance sheet, we report that monies raised by way of term loan was applied for the
purposes for which the loan was obtained, though funds amounting to ` 1,326 million received by the Company on March 31, 2016, which were not required for
immediate utilisation have been invested in fixed deposit and current account with bank. No monies were raised, during the year, by the Company by way of initial
public offer or further public offer (including debt instruments).
(x) Based upon the audit procedures performed for the purpose of reporting the true and fair view of the financial statements and according to the information
and explanations given by the management, we report that no fraud by the Company or material fraud on the Company by its the officers or employees of the
Company has been noticed or reported during the year.
(xi) Based on our audit procedures performed for the purpose of reporting the true and fair view of the financial statements and according to the information and
explanations given by the management, we report that the managerial remuneration has been paid / provided in accordance with the requisite approvals
mandated by the provisions of Section 197 read with Schedule V to the Companies Act, 2013.
(xii) In our opinion, the Company is not a nidhi company. Therefore, the provisions of clause 3(xii) of the Order are not applicable to the Company and hence not
commented upon.
(xiii) Based on our audit procedures performed for the purpose of reporting the true and fair view of the financial statements and according to the information and
explanations given by the management, transactions with the related parties are in compliance with Section 177 and 188 of Companies Act, 2013 where applicable
and the details have been disclosed in the notes to the financial statements, as required by the applicable accounting standards.
(xiv) According to the information and explanations given to us and on an overall examination of the balance sheet, the Company has not made any preferential
allotment or private placement of shares or fully or partly convertible debentures during the year under review and hence not commented upon.
(xv) Based on our audit procedures performed for the purpose of reporting the true and fair view of the financial statements and according to the information and
explanations given by the management, the Company has not entered into any non-cash transactions with directors or persons connected with him.
(xvi) According to the information and explanations given to us, the provisions of Section 45-IA of the Reserve Bank of India Act, 1934 are not applicable to the Company.
For S.R. Batliboi & Associates LLP
Chartered Accountants
ICAI Firm registration number: 101049W
per Aditya Vikram Bhauwala
Partner
Membership No.: 208382
Place: Bengaluru
Date: April 26, 2016
(This space has been intentionally left blank)
Credibly Capable | Annual Report 2016154

Financial Report
Annexure 2 to the Independent Auditor’s Report of even date on the Standalone Financial Statements of Biocon Limited Report on the Internal Financial Controls under clause (i) of Sub-section 3 of Section 143 of the Companies Act, 2013 (“the Act”)
To the Members of Biocon Limited
We have audited the internal financial controls over financial reporting of Biocon Limited (“the Company”) as of March 31, 2016 in conjunction with our audit of the
financial statements of the Company for the year ended on that date.
Management’s Responsibility for Internal Financial Controls
The Company’s Management is responsible for establishing and maintaining internal financial controls based on the internal control over financial reporting criteria
established by the Company considering the essential components of internal control stated in the Guidance Note on Audit of Internal Financial Controls Over Financial
Reporting issued by the Institute of Chartered Accountants of India. These responsibilities include the design, implementation and maintenance of adequate internal
financial controls that were operating effectively for ensuring the orderly and efficient conduct of its business, including adherence to the Company’s policies, the
safeguarding of its assets, the prevention and detection of frauds and errors, the accuracy and completeness of the accounting records, and the timely preparation of
reliable financial information, as required under the Companies Act, 2013.
Auditor’s Responsibility
Our responsibility is to express an opinion on the Company’s internal financial controls over financial reporting based on our audit. We conducted our audit in accordance
with the Guidance Note on Audit of Internal Financial Controls Over Financial Reporting (the “Guidance Note”) and the Standards on Auditing as specified under Section
143(10) of the Companies Act, 2013, to the extent applicable to an audit of internal financial controls, both applicable to an audit of Internal Financial Controls and,
both issued by the Institute of Chartered Accountants of India. Those Standards and the Guidance Note require that we comply with ethical requirements and plan and
perform the audit to obtain reasonable assurance about whether adequate internal financial controls over financial reporting was established and maintained and if such
controls operated effectively in all material respects.
Our audit involves performing procedures to obtain audit evidence about the adequacy of the internal financial controls system over financial reporting and their
operating effectiveness. Our audit of internal financial controls over financial reporting included obtaining an understanding of internal financial controls over financial
reporting, assessing the risk that a material weakness exists, and testing and evaluating the design and operating effectiveness of internal control based on the assessed
risk. The procedures selected depend on the auditor’s judgement, including the assessment of the risks of material misstatement of the financial statements, whether
due to fraud or error.
We believe that the audit evidence we have obtained is sufficient and appropriate to provide a basis for our audit opinion on the internal financial controls system over
financial reporting.
Meaning of Internal Financial Controls Over Financial Reporting
A company’s internal financial control over financial reporting is a process designed to provide reasonable assurance regarding the reliability of financial reporting
and the preparation of financial statements for external purposes in accordance with generally accepted accounting principles. A company’s internal financial control
over financial reporting includes those policies and procedures that (1) pertain to the maintenance of records that, in reasonable detail, accurately and fairly reflect
the transactions and dispositions of the assets of the company; (2) provide reasonable assurance that transactions are recorded as necessary to permit preparation
of financial statements in accordance with generally accepted accounting principles, and that receipts and expenditures of the company are being made only in
accordance with authorisations of management and directors of the company; and (3) provide reasonable assurance regarding prevention or timely detection of
unauthorised acquisition, use, or disposition of the company’s assets that could have a material effect on the financial statements.
Inherent Limitations of Internal Financial Controls Over Financial Reporting
Because of the inherent limitations of internal financial controls over financial reporting, including the possibility of collusion or improper management override of
controls, material misstatements due to error or fraud may occur and not be detected. Also, projections of any evaluation of the internal financial controls over financial
reporting to future periods are subject to the risk that the internal financial control over financial reporting may become inadequate because of changes in conditions,
or that the degree of compliance with the policies or procedures may deteriorate.
Opinion
In our opinion, the Company has, in all material respects, an adequate internal financial controls system over financial reporting and such internal financial controls over
financial reporting were operating effectively as at March 31, 2016, based on the internal control over financial reporting criteria established by the Company considering
the essential components of internal control stated in the Guidance Note on Audit of Internal Financial Controls Over Financial Reporting issued by the Institute of
Chartered Accountants of India.
Explanatory paragraph
We also have audited, in accordance with the Standards on Auditing issued by the Institute of Chartered Accountants of India, as specified under Section 143(10) of the
Companies Act, 2013, the financial statements of the Company, which comprise the Balance Sheet as at March 31, 2016, and the related Statement of Profit and Loss
and Cash Flow Statement for the year then ended, and a summary of significant accounting policies and other explanatory information, and our report dated April 26,
2016 expressed an unqualified opinion.
For S.R. Batliboi & Associates LLP
Chartered Accountants
ICAI Firm registration number: 101049W
per Aditya Vikram BhauwalaPartner Membership No.: 208382Place: BengaluruDate: April 26, 2016
Biocon Limited
155

Balance Sheet as at March 31, 2016
(All amounts in Indian Rupees Million)
Notes March 31, 2016 March 31, 2015
EQUITY AND LIABILITIES
Shareholders’ funds
Share capital 3 1,000 1,000
Reserves and surplus 4 31,885 24,844
32,885 25,844
Non-current liabilities
Long-term borrowings 5 1,365 114
Deferred tax liability (net) 6 297 368
Other long-term liabilities 7 1,239 1,364
Long-term provisions 11 95 -
2,996 1,846
Current liabilities
Short-term borrowings 8 2,255 561
Trade payables 9
Total outstanding dues of micro and small enterprises 102 77
Total outstanding dues of creditors other than micro and small enterprises 3,841 2,931
Other current liabilities 10 1,404 603
Short-term provisions 11 506 1,468
8,108 5,640
TOTAL 43,989 33,330
ASSETS
Non-current assets
Fixed assets
Tangible assets 12 9,035 8,986
Intangible assets 13 342 157
Capital work-in-progress 1,723 576
Non-current investments 14 4,587 804
Loans and advances 15 4,748 5,435
Other non-current assets 16 531 13
20,966 15,971
Current assets
Current investments 17 1,521 843
Inventories 18 4,675 4,063
Trade receivables 19 5,731 5,551
Cash and bank balances 20 9,883 6,212
Loans and advances 15 950 497
Other current assets 16 263 193
23,023 17,359
TOTAL 43,989 33,330
Summary of significant accounting policies 2.1
The accompanying notes are an integral part of the financial statements.
As per our report of even date
For S.R. Batliboi & Associates LLP For and on behalf of the Board of Directors of Biocon Limited
Chartered Accountants
ICAI Firm registration no.: 101049W
per Aditya Vikram Bhauwala Kiran Mazumdar-Shaw Arun Chandavarkar
Partner Managing Director Joint Managing Director & CEO
Membership no.: 208382 DIN: 00347229 DIN: 01596180
Siddharth Mittal Kiran Kumar
President - Finance & Chief Financial Officer Company Secretary
M No. A14594
Bengaluru Bengaluru
April 26, 2016 April 26, 2016
Credibly Capable | Annual Report 2016156

Financial Report
The accompanying notes are an integral part of the financial statements.
As per our report of even date
For S.R. Batliboi & Associates LLP For and on behalf of the Board of Directors of Biocon Limited
ICAI Firm registration no.: 101049W
Chartered Accountants
per Aditya Vikram Bhauwala Kiran Mazumdar-Shaw Arun Chandavarkar
Partner Managing Director Joint Managing Director & CEO
Membership no.: 208382 DIN: 00347229 DIN: 01596180
Siddharth Mittal Kiran Kumar
President - Finance & Chief Financial Officer Company Secretary
M No. A14594
Bengaluru Bengaluru
April 26, 2016 April 26, 2016
Statement of Pro!t and Loss for the year ended March 31, 2016
(All amounts in Indian Rupees Million, except share data and per share data, unless otherwise stated)
Notes March 31, 2016 March 31, 2015
Income
Revenue from operations (gross) 23,571 22,742
Less: Excise duty 335 326
Revenue from operations (net) 21 23,236 22,416
Other income 22 1,841 1,491
Total revenue (I) 25,077 23,907
Expenses
Cost of raw materials and packing materials consumed 23 9,478 9,565
Purchases of traded goods 24 (a) 760 880
(Increase)/ Decrease in inventories of finished goods, traded goods and work-in-progress 24 (b) (288) (392)
Employee benefits expense 25 3,187 2,844
Other expenses 26 5,754 5,239
Depreciation and amortisation (net) 27 1,310 1,281
Finance costs 28 9 8
20,210 19,425
Less: Recovery of product development costs from co-development partners (net) 38 (b) (48) (19)
Total expenses (II) 20,162 19,406
Pro!t before tax and exceptional item 4,915 4,501
Exceptional items (net) 31 5,230 (218)
Pro!t before tax 10,145 4,283
Tax expenses
Current tax 2,128 716
Less: MAT credit entitlement - (13)
Deferred tax (71) (32)
Total tax expense 2,057 671
Pro!t for the year 8,088 3,612
Earnings per share [equity shares, par value of ` 5 each (March 31, 2015 - ` 5 each)]
computed on the basis of profit for the year
Basic (in `) 40.44 18.06
Diluted (in `) 40.44 18.06
Weighted average number of shares used in computing earnings per share
Basic 200,000,000 200,000,000
Diluted 200,000,000 200,000,000
Summary of significant accounting policies 2.1
Biocon Limited
157

Cash Flow Statement for the year ended March 31, 2016
(All amounts in Indian Rupees Million)
March 31, 2016 March 31, 2015
I Cash "ows from operating activities
Profit before tax 10,145 4,283
Adjustments to reconcile pro!t before tax to net cash "ows
Depreciation and amortisation (net) 1,310 1,281
Unrealised foreign exchange (gain)/ loss (1) (25)
Employee stock compensation expense 60 -
Provision/ (reversal of provision) for doubtful debts (43) 47
Bad debts written off 8 -
Interest expense 9 8
Interest income (727) (221)
Dividend income (632) (1,120)
Net gain on sale of current investments (16) (14)
Provision for other than temporary diminution in the value of long-term investments - 218
Net gain on sale of non-current investments (5,230) -
Other non-operating income (186) (136)
Operating profit before working capital changes 4,697 4,321
Movements in working capital
Decrease/(increase) in inventories (612) (487)
Decrease/(increase) in trade receivables (131) (654)
Decrease/(increase) in loans and advances and other assets [refer note 32(b) & 32(c)] (1,214) (1,430)
Increase/(decrease) in trade payable, other liabilities and provisions 1,149 329
Cash generated from operations 3,889 2,079
Direct taxes paid (net of refunds) (2,050) (829)
Net cash "ow from operating activities 1,839 1,250
II Cash "ows from investing activities
Purchase of tangible fixed assets, capital work-in-progress and capital advances (net of reimbursements under co-
development arrangement)
(2,146) (577)
Acquisition of intangible assets (232) (125)
Proceeds from sale of fixed assets 7 -
Loans given to subsidiaries [refer note 32(b) & 32(c)] (1,979) (2,367)
Recovery of loans from subsidiaries [refer note 32(b) & 32 (c)] 3,707 3,917
Investment in subsidiary (non-current) (4,506) (1)
Proceeds from sale of non-current investments (net of expenses) 5,953 -
Proceeds from sale of current investments 29,140 22,156
Purchase of current investments (29,802) (19,968)
Investment in bank deposits (having original maturity of more than 3 months) (2,100) (3,050)
Redemption/ maturity of bank deposits (having original maturity of more than 3 months) 2,050 -
Investment in deposits with financial institutions (4,420) -
Other non-operating income 186 136
Interest received 515 221
Dividend received 632 1,120
Net cash "ow from/ (used in) investing activities (2,995) 1,462
III Cash "ows from !nancing activities
Proceeds from long-term borrowings 1,324 -
Repayment of long-term borrowings (140) (145)
Proceeds/ (repayment) of short-term borrowings (net) 1,714 (228)
Dividend paid on equity shares (2,000) (1,000)
Tax on final equity dividend - (170)
Tax on interim equity dividend (107) (30)
Interest paid (12) (8)
Net cash "ow from/ (used in) !nancing activities 779 (1,581)
Credibly Capable | Annual Report 2016158
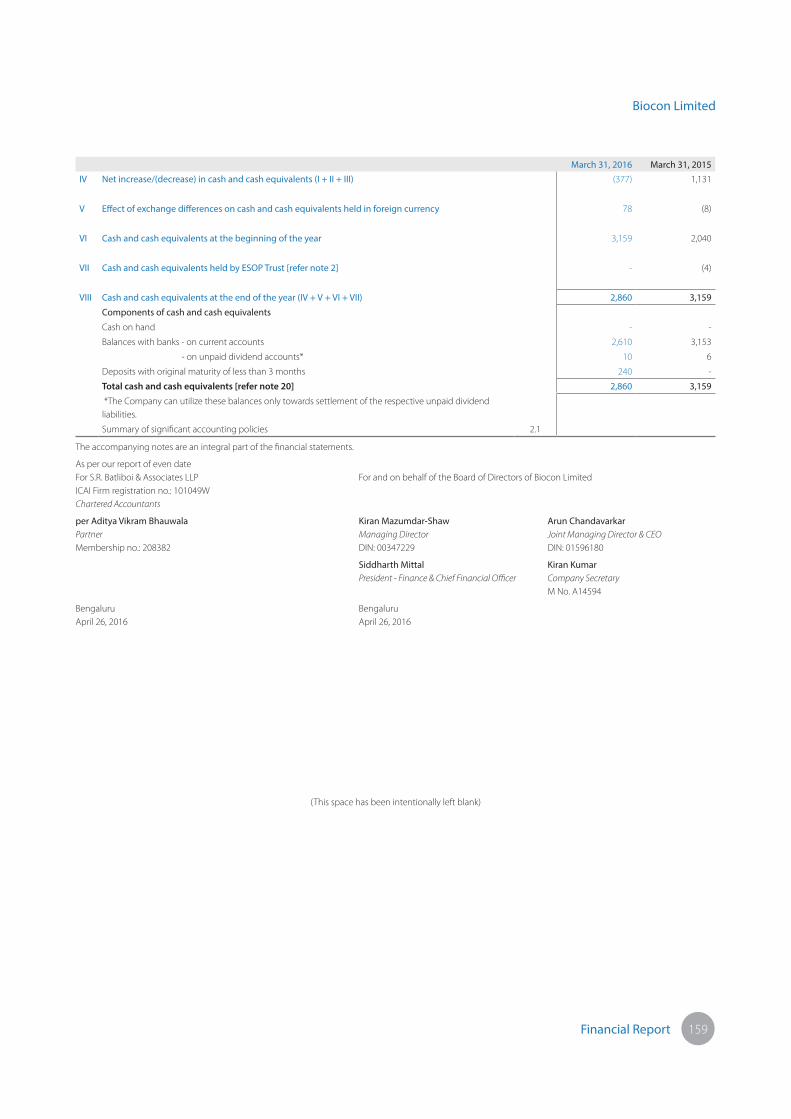
Financial Report
March 31, 2016 March 31, 2015
IV Net increase/(decrease) in cash and cash equivalents (I + II + III) (377) 1,131
V E#ect of exchange di#erences on cash and cash equivalents held in foreign currency 78 (8)
VI Cash and cash equivalents at the beginning of the year 3,159 2,040
VII Cash and cash equivalents held by ESOP Trust [refer note 2] - (4)
VIII Cash and cash equivalents at the end of the year (IV + V + VI + VII) 2,860 3,159
Components of cash and cash equivalents
Cash on hand - -
Balances with banks - on current accounts 2,610 3,153
- on unpaid dividend accounts* 10 6
Deposits with original maturity of less than 3 months 240 -
Total cash and cash equivalents [refer note 20] 2,860 3,159
*The Company can utilize these balances only towards settlement of the respective unpaid dividend
liabilities.
Summary of significant accounting policies 2.1
The accompanying notes are an integral part of the financial statements.
As per our report of even date
For S.R. Batliboi & Associates LLP For and on behalf of the Board of Directors of Biocon Limited
ICAI Firm registration no.: 101049W
Chartered Accountants
per Aditya Vikram Bhauwala Kiran Mazumdar-Shaw Arun Chandavarkar
Partner Managing Director Joint Managing Director & CEO
Membership no.: 208382 DIN: 00347229 DIN: 01596180
Siddharth Mittal Kiran Kumar
President - Finance & Chief Financial Officer Company Secretary
M No. A14594
Bengaluru Bengaluru
April 26, 2016 April 26, 2016
(This space has been intentionally left blank)
Biocon Limited
159
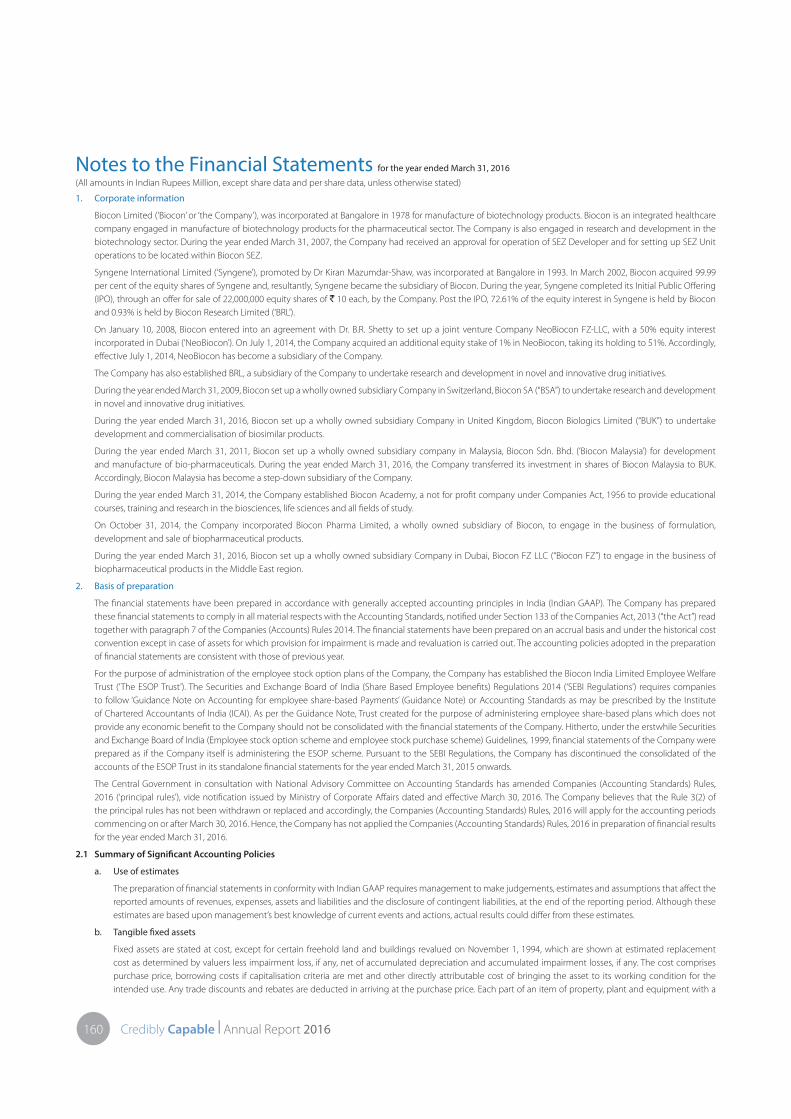
1. Corporate information
Biocon Limited (‘Biocon’ or ‘the Company’), was incorporated at Bangalore in 1978 for manufacture of biotechnology products. Biocon is an integrated healthcare
company engaged in manufacture of biotechnology products for the pharmaceutical sector. The Company is also engaged in research and development in the
biotechnology sector. During the year ended March 31, 2007, the Company had received an approval for operation of SEZ Developer and for setting up SEZ Unit
operations to be located within Biocon SEZ.
Syngene International Limited (‘Syngene’), promoted by Dr Kiran Mazumdar-Shaw, was incorporated at Bangalore in 1993. In March 2002, Biocon acquired 99.99
per cent of the equity shares of Syngene and, resultantly, Syngene became the subsidiary of Biocon. During the year, Syngene completed its Initial Public Offering
(IPO), through an offer for sale of 22,000,000 equity shares of ` 10 each, by the Company. Post the IPO, 72.61% of the equity interest in Syngene is held by Biocon
and 0.93% is held by Biocon Research Limited (‘BRL’).
On January 10, 2008, Biocon entered into an agreement with Dr. B.R. Shetty to set up a joint venture Company NeoBiocon FZ-LLC, with a 50% equity interest
incorporated in Dubai (‘NeoBiocon’). On July 1, 2014, the Company acquired an additional equity stake of 1% in NeoBiocon, taking its holding to 51%. Accordingly,
effective July 1, 2014, NeoBiocon has become a subsidiary of the Company.
The Company has also established BRL, a subsidiary of the Company to undertake research and development in novel and innovative drug initiatives.
During the year ended March 31, 2009, Biocon set up a wholly owned subsidiary Company in Switzerland, Biocon SA (“BSA”) to undertake research and development
in novel and innovative drug initiatives.
During the year ended March 31, 2016, Biocon set up a wholly owned subsidiary Company in United Kingdom, Biocon Biologics Limited (“BUK”) to undertake
development and commercialisation of biosimilar products.
During the year ended March 31, 2011, Biocon set up a wholly owned subsidiary company in Malaysia, Biocon Sdn. Bhd. (‘Biocon Malaysia’) for development
and manufacture of bio-pharmaceuticals. During the year ended March 31, 2016, the Company transferred its investment in shares of Biocon Malaysia to BUK.
Accordingly, Biocon Malaysia has become a step-down subsidiary of the Company.
During the year ended March 31, 2014, the Company established Biocon Academy, a not for profit company under Companies Act, 1956 to provide educational
courses, training and research in the biosciences, life sciences and all fields of study.
On October 31, 2014, the Company incorporated Biocon Pharma Limited, a wholly owned subsidiary of Biocon, to engage in the business of formulation,
development and sale of biopharmaceutical products.
During the year ended March 31, 2016, Biocon set up a wholly owned subsidiary Company in Dubai, Biocon FZ LLC (“Biocon FZ”) to engage in the business of
biopharmaceutical products in the Middle East region.
2. Basis of preparation
The financial statements have been prepared in accordance with generally accepted accounting principles in India (Indian GAAP). The Company has prepared
these financial statements to comply in all material respects with the Accounting Standards, notified under Section 133 of the Companies Act, 2013 (“the Act”) read
together with paragraph 7 of the Companies (Accounts) Rules 2014. The financial statements have been prepared on an accrual basis and under the historical cost
convention except in case of assets for which provision for impairment is made and revaluation is carried out. The accounting policies adopted in the preparation
of financial statements are consistent with those of previous year.
For the purpose of administration of the employee stock option plans of the Company, the Company has established the Biocon India Limited Employee Welfare
Trust (‘The ESOP Trust’). The Securities and Exchange Board of India (Share Based Employee benefits) Regulations 2014 (‘SEBI Regulations’) requires companies
to follow ‘Guidance Note on Accounting for employee share-based Payments’ (Guidance Note) or Accounting Standards as may be prescribed by the Institute
of Chartered Accountants of India (ICAI). As per the Guidance Note, Trust created for the purpose of administering employee share-based plans which does not
provide any economic benefit to the Company should not be consolidated with the financial statements of the Company. Hitherto, under the erstwhile Securities
and Exchange Board of India (Employee stock option scheme and employee stock purchase scheme) Guidelines, 1999, financial statements of the Company were
prepared as if the Company itself is administering the ESOP scheme. Pursuant to the SEBI Regulations, the Company has discontinued the consolidated of the
accounts of the ESOP Trust in its standalone financial statements for the year ended March 31, 2015 onwards.
The Central Government in consultation with National Advisory Committee on Accounting Standards has amended Companies (Accounting Standards) Rules,
2016 (‘principal rules’), vide notification issued by Ministry of Corporate Affairs dated and effective March 30, 2016. The Company believes that the Rule 3(2) of
the principal rules has not been withdrawn or replaced and accordingly, the Companies (Accounting Standards) Rules, 2016 will apply for the accounting periods
commencing on or after March 30, 2016. Hence, the Company has not applied the Companies (Accounting Standards) Rules, 2016 in preparation of financial results
for the year ended March 31, 2016.
2.1 Summary of Signi!cant Accounting Policies
a. Use of estimates
The preparation of financial statements in conformity with Indian GAAP requires management to make judgements, estimates and assumptions that affect the
reported amounts of revenues, expenses, assets and liabilities and the disclosure of contingent liabilities, at the end of the reporting period. Although these
estimates are based upon management’s best knowledge of current events and actions, actual results could differ from these estimates.
b. Tangible !xed assets
Fixed assets are stated at cost, except for certain freehold land and buildings revalued on November 1, 1994, which are shown at estimated replacement
cost as determined by valuers less impairment loss, if any, net of accumulated depreciation and accumulated impairment losses, if any. The cost comprises
purchase price, borrowing costs if capitalisation criteria are met and other directly attributable cost of bringing the asset to its working condition for the
intended use. Any trade discounts and rebates are deducted in arriving at the purchase price. Each part of an item of property, plant and equipment with a
Notes to the Financial Statements for the year ended March 31, 2016
(All amounts in Indian Rupees Million, except share data and per share data, unless otherwise stated)
Credibly Capable | Annual Report 2016160

Financial Report
cost that is significant in relation to the total cost of the item is depreciated separately. This applies mainly to components for machinery. When significant parts
of fixed assets are required to be replaced at intervals, the Company recognizes such parts as individual assets with specific useful lives and depreciates them
accordingly. Likewise, when a major inspection is performed, its cost is recognised in the carrying amount of the fixed assets as a replacement if the recognition
criteria are satisfied.
Leasehold land on a lease-cum-sale basis are capitalised at the allotment rates charged by the Municipal Authorities.
Subsequent expenditure related to an item of fixed asset is added to its book value only if it increases the future benefits from the existing asset beyond its
previously assessed standard of performance. All other expenses on existing fixed assets, including routine repair and maintenance expenditure and cost of
replacing parts, are charged to the statement of profit and loss for the period during which such expenses are incurred.
The Company adjusts exchange differences arising on translation/ settlement of long-term foreign currency monetary items pertaining to the acquisition of
a depreciable asset to the cost of the asset and depreciates the same over the remaining life of the asset. In accordance with MCA circular dated August 9,
2012, exchange differences adjusted to the cost of fixed assets are arising on long-term foreign currency monetary items pertaining to the acquisition of a
depreciable asset, for the period.
Gains or losses arising from derecognition of fixed assets are measured as the difference between the net disposal proceeds and the carrying amount of the
asset and are recognised in the statement of profit and loss when the asset is derecognised.
Assets funded by third parties are capitalised at gross value and the funds so received are recorded as funding received from co-developer and amortised over
the useful life of the assets.
c. Depreciation on tangible fixed assets
Depreciation on fixed assets is calculated on a straight-line basis using the rates arrived at based on the useful lives estimated by the management. The
identified components are depreciated separately over their useful lives; the remaining components are depreciated over the life of the principal asset.
The Company has estimated the following useful lives to provide depreciation on its fixed assets.
Nature of Asset Useful lives (in years)
Buildings * 25
Roads 5
Plant and equipment (including Electrical installation & Lab equipment )* 9-11
Computers & servers* 3
Office equipment 5
Research and development equipment * 9
Furniture and fixtures * 6
Vehicles * 6
Leasehold improvements 5 or lease period whichever is lower
Used assets acquired from third parties are depreciated on a straight line basis over their remaining useful life of such assets.
* For these classes of assets, where the estimated useful lives are different from lives prescribed under Schedule II, management has estimated these useful lives
after taking into consideration technical assessment, prior asset usage experience and the risk of technological obsolescence.
The residual values, useful lives and methods of depreciation of tangible fixed assets are reviewed at each financial year end and adjusted prospectively, if
appropriate.
d. Intangible assets
(i) Goodwill:
Goodwill represents the excess of purchase consideration over the net book value of assets acquired. Goodwill on acquisition of business is amortised on a
straight line basis over a period of 5 years and is tested for impairment on an annual basis.
(ii) Intangible asset:
Intangible assets acquired separately are measured on initial recognition at cost. Following initial recognition, intangible assets are carried at cost less
accumulated amortisation and accumulated impairment losses, if any. Internally generated intangible assets, excluding capitalised development costs, are not
capitalied and expenditure is reflected in the statement of profit and loss in the year in which the expenditure is incurred.
Computer software which is not an integral part of the related hardware is classified as an intangible asset.
Intangible assets are amortized on a straight line basis over the estimated useful economic life. The Company uses a rebuttable presumption that the useful life
of an intangible asset will not exceed its remaining patent life or ten years, whichever is lower. If the persuasive evidence exists to the affect that useful life of
an intangible asset exceeds ten years, the Company amortizes the intangible asset over the best estimate of its useful life. Such intangible assets and intangible
assets not yet available for use are tested for impairment annually. All other intangible assets are assessed for impairment whenever there is an indication that
the intangible asset may be impaired.
The amortisation period and the amortisation method are reviewed at least at each financial year end. If the expected useful life of the asset is significantly
different from previous estimates, the amortisation period is changed accordingly. If there has been a significant change in the expected pattern of economic
benefits from the asset, the amortisation method is changed to reflect the changed pattern. Such changes are accounted for in accordance with AS 5, Net Profit
or Loss for the Period, Prior Period Items and Changes in Accounting Policies.
Gains or losses arising from derecognition of an intangible asset are measured as the difference between the net disposal proceeds and the carrying amount
of the asset and are recognized in the statement of profit and loss when the asset is derecognised.
Biocon Limited
161

Amortisation of intangible assets:
a. Intellectual Property rights/marketing rights are amortized on a straight line basis over the estimated useful economic life of five years.
b. Manufacturing rights are amortised on a straight line basis over the estimated useful economic life of ten years.
c. Computer software is amortised on a straight line basis over a period of three - five years, being its estimated useful life.
Research and development costs
Research and development costs, incurred for development of products are expensed as incurred. Development costs which relate to the design and testing
of new or improved materials, products or processes or for existing products in new territories are recognised as an intangible asset when the Company can
demonstrate all the following:
a. it is technically feasible to complete the development of asset and it will be available for sale/use.
b. it is expected that such development will be completed and used/sold.
c. it is expected that such assets will generate future economic benefits.
d. there are adequate resources to complete such development.
e. it is possible to measure reliably the expenditure attributable to the asset during development.
Research and development expenditure of a capital nature is added to fixed assets. Following the initial recognition of the development expenditure as an
asset, the cost model is applied requiring the asset to be carried at cost less any accumulated amortisation and accumulated impairment losses. The carrying
value of the development cost is tested for impairment annually.
e. Borrowing Costs
Borrowing cost includes interest, amortisation of ancillary costs incurred in connection with the arrangement of borrowings and exchange differences arising
from short-term foreign currency borrowings to the extent they are regarded as an adjustment to the interest cost.
Borrowing costs directly attributable to the acquisition, construction or production of an asset that necessarily takes a substantial period of time to get ready
for its intended use or sale are capitalized as part of the cost of the respective asset. All other borrowing costs are expensed in the period they occur.
f. Impairment of tangible and intangible assets
The Company assesses at each reporting date whether there is an indication that an asset may be impaired. If any indication exists, or when annual impairment
testing for an asset is required, the Company estimates the asset’s recoverable amount. The recoverable amount is determined for an individual asset, unless
the asset does not generate cash inflows that are largely independent of those from other assets or groups of assets. Where the carrying amount of an asset
exceeds its recoverable amount, the asset is considered impaired and is written down to its recoverable amount. In assessing value in use, the estimated future
cash flows are discounted to their present value using a pre-tax discount rate that reflects current market assessments of the time value of money and the risks
specific to the asset. In determining net selling price, recent market transactions are taken into account, if available. If no such transactions can be identified,
an appropriate valuation model is used.
Impairment losses, including impairment on inventories, are recognised in the statement of profit and loss, except for previously revalued tangible fixed assets,
where the revaluation was taken to revaluation reserve. In this case, the impairment is also recognised in the revaluation reserve up to the amount of any
previous revaluation.
After impairment, depreciation is provided on the revised carrying amount of the asset over its remaining useful life.
An assessment is made at each reporting date as to whether there is any indication that previously recognized impairment losses may no longer exist or may
have decreased. If such indication exists, the Company estimates the asset’s recoverable amount. A previously recognised impairment loss is reversed only if
there has been a change in the assumptions used to determine the asset’s recoverable amount since the last impairment loss was recognised. The reversal is
limited so that the carrying amount of the asset does not exceed its recoverable amount, nor exceed the carrying amount that would have been determined,
net of depreciation, had no impairment loss been recognised for the asset in prior years. Such reversal is recognized in the statement of profit and loss unless
the asset is carried at a revalued amount, in which case the reversal is treated as a revaluation increase.
g. Inventories
Inventories are valued as follows:
Raw materials and packing
materials
Lower of cost and net realizable value. However, materials and other items held for use in the production of inventories are
not written down below cost if the finished products in which they will be incorporated are expected to be sold at or above
cost. Cost is determined on a first-in-first-out basis. Customs duty on imported raw materials (excluding stocks in the bonded
warehouse) is treated as part of the cost of the inventories.
Work-in-progress and finished
goods
Lower of cost and net realisable value. Cost includes direct materials (on a first–in-first out basis) and labour and a proportion
of manufacturing overheads based on normal operating capacity. Cost of finished goods includes excise duty.
Traded goods Lower of cost and net realizable value. Cost includes the purchase price and other associated costs directly incurred in
bringing the inventory to its present location. Cost is determined on a first-in-first-out basis.
Net realizable value is the estimated selling price in the ordinary course of business, less estimated costs of completion and estimated costs necessary to
make the sale.
h. Revenue recognition
Revenue is recognised to the extent that it is probable that the economic benefits will flow to the Company and the revenue can be reliably measured. The
following specific recognition criteria must also be met before revenue is recognised.
Credibly Capable | Annual Report 2016162

Financial Report
(i) Sale of products:
Revenue from sale of products is recognised when the significant risks and rewards of ownership of the goods have passed to the buyer. The Company
collects sales taxes and value added taxes (VAT) on behalf of the government and, therefore, these are not economic benefits flowing to the Company.
Hence, they are excluded from revenue. Excise duty deducted from revenue (gross) is the amount that is included in the revenue (gross) and not the entire
amount of liability arising during the year.
(ii) Sale of services:
The Company enters into certain dossier sales, licensing and supply agreements (including arrangement for capacity reservation fee) relating to various
products. Revenue from such arrangements is recognised upon completion of performance obligations or on a proportional performance basis over the
period the Company performs its obligations, based on the terms of the agreements. Proportionate performance is measured based upon the efforts/
costs incurred to date in relation to the total estimated efforts/costs to complete the contract. The Company monitors estimates of the total contract
revenue and cost on a routine basis throughout the contract period. The cumulative impact of any change in estimates of the contract revenue or costs
is reflected in the period in which the changes become known. In the event that a loss is anticipated on a particular contract, provision is made for the
estimated loss.
In respect of services, the Company collects service tax as applicable on behalf of the Government and, therefore, it is not an economic benefit flowing to
the Company. Hence, it is excluded from revenue.
(iii) Interest Income: Interest income is recognised on a time proportion basis taking into account the amount outstanding and the applicable interest rate.
Interest income is included under the head “other income” in the statement of profit and loss.
(iv) Dividend income: Dividend income is recognised when the Company’s right to receive dividend is established by the reporting date.
i. Investments
Investments that are readily realisable and intended to be held for not more than twelve months from the date on which such investments are made are
classified as current investments. All other investments are classified as non-current investments.
On initial recognition, all investments are measured at cost. The cost comprises purchase price and directly attributable acquisition charges such as brokerage,
fees and duties. If an investment is acquired, or partly acquired, by the issue of shares or other securities, the acquisition cost is the fair value of the securities
issued. If an investment is acquired in exchange for another asset, the acquisition is determined by reference to the fair value of the asset given up or by
reference to the fair value of the investment acquired, whichever is more clearly evident.
Current investments are carried in the financial statements at lower of cost and fair value determined on an individual investment basis. Non-current
investments are carried at cost. However, provision for diminution in value is made to recognize a decline other than temporary in the value of the investments.
On disposal of an investment, the difference between its carrying amount and net disposal proceeds is charged or credited to the statement of profit and loss.
j. Retirement bene!ts
Retirement benefit in the form of Provident Fund is a defined contribution scheme and the contributions are charged to the statement of profit and loss for
the year when the employee renders the related service and the contributions to the government funds are due. The Company has no obligation other than
the contribution payable to provident fund authorities.
Gratuity liability is a defined benefit obligation and is provided for on the basis of an actuarial valuation on projected unit credit method made at the end of
each financial year. The gratuity benefit of the Company is administered by a trust formed for this purpose through the group gratuity scheme. Actuarial gains
and losses for defined benefit plan are recognised in full in the period in which they occur in the statement of profit and loss.
Accumulated leave, which is expected to be utilised within the next 12 months, is treated as short-term employee benefit. The Company measures the
expected cost of such absences as the additional amount that it expects to pay as a result of the unused entitlement that has accumulated at the reporting
date.
The Company treats accumulated leave expected to be carried forward beyond 12 months, as long-term employee benefit for measurement purposes. Such
long-term compensated absences are provided for based on the actuarial valuation using the projected unit credit method at the year-end. Actuarial gains/
losses are immediately taken to the statement of profit and loss and are not deferred. The Company presents the entire leave as a current liability in the balance
sheet, since it does not have an unconditional right to defer its settlement for 12 months after the reporting date.
k. Foreign currency translation
Foreign currency transaction and balances
Initial Recognition
Foreign currency transactions are recorded in the reporting currency, by applying to the foreign currency amount the exchange rate between the reporting
currency and the foreign currency at the date of the transaction.
Conversion
Foreign currency monetary items are retranslated using the exchange rate prevailing at the reporting date. Non-monetary items which are carried in terms of
historical cost denominated in a foreign currency are reported using the exchange rate at the date of the transaction. Non-monetary items which are carried at
fair value or other similar valuation denominated in a foreign currency are translated using the exchange rates at the date when such values were determined.
Exchange Di#erences
The Company accounts for exchange differences arising on translation/settlement of foreign currency monetary items as below:
(i) Exchange differences arising on a monetary item that, in substance, forms part of the Company’s net investment in a non-integral foreign operation
is accumulated in the foreign currency translation reserve in the financial statements until the disposal of the net investment, at which time they are
recognised as income or as expenses.
Biocon Limited
163
(ii) Exchange differences arising on long-term foreign currency monetary items related to acquisition of a fixed asset are capitalized and depreciated over the
remaining useful life of the asset.
(iii) Exchange differences arising on other long-term foreign currency monetary items are accumulated in the “Foreign Currency Monetary Item Translation
Difference Account” and amortised over the remaining life of the concerned monetary item.
(iv) All other exchange differences are recognised as income or as expenses in the period in which they arise.
For the purpose of (ii) and (iii) above, the Company treats a foreign monetary item as “long-term foreign currency monetary item”, if it has a term of 12 months
or more at the date of its origination. In accordance with MCA circular dated August 9, 2012, exchange differences for this purpose, are arising on long-term
foreign currency monetary items for the period.
Forward exchange contracts entered into to hedge foreign currency risk of an existing asset/liability.
The premium or discount arising at the inception of forward exchange contract is amortized and recognised as an expense/income over the life of the
contract. Exchange differences on such contracts, except the contracts which are long-term foreign currency monetary items, are recognised in the statement
of profit and loss in the period in which the exchange rates change. Any profit or loss arising on cancellation or renewal of such forward exchange contract is
also recognised as income or as expense for the period. Any gain/loss arising on forward contracts which are long-term foreign currency monetary items are
recognised in accordance with paragraph (ii) and (iii).
l. Income tax
Tax expense comprises current and deferred tax. Current income tax is measured at the amount expected to be paid to the tax authorities in accordance with
the Income Tax Act, 1961 enacted in India. The tax rates and tax laws used to compute the amount are those that are enacted or substantively enacted, at the
reporting date. Current income tax relating to items recognised directly in equity is recognised in equity and not in the statement of profit and loss.
Deferred income taxes reflect the impact of timing differences between taxable income and accounting income originating during the current year and
reversal of timing differences for the earlier years. Deferred income tax relating to items recognized directly in equity is recognized in equity and not in the
statement of profit and loss.
Deferred tax is measured using the tax rates and the tax laws enacted or substantively enacted at the reporting date. Deferred tax liability is recognised for all
taxable timing differences. Deferred tax assets are recognised only to the extent that there is reasonable certainty that sufficient future taxable income will be
available against which such deferred tax assets can be realised. In situations where the Company has unabsorbed depreciation or carry forward tax losses, all
deferred tax assets are recognised only if there is virtual certainty supported by convincing evidence that they can be realised against future taxable profits.
In the situations where the Company is entitled to a tax holiday under the Income-tax Act, 1961 enacted in India or tax laws prevailing in the respective tax
jurisdictions where it operates, no deferred tax (asset or liability) is recognised in respect of timing differences which reverse during the tax holiday period, to
the extent the Company’s gross total income is subject to the deduction during the tax holiday period. Deferred tax in respect of timing differences which
reverse after the tax holiday period is recognised in the year in which the timing differences originate. However, the Company restricts recognition of deferred
tax assets to the extent that it has become reasonably certain or virtually certain, as the case may be, that sufficient future taxable income will be available
against which such deferred tax assets can be realised. For recognition of deferred taxes, the timing differences which originate first are considered to reverse
first.
At each reporting date, the Company re-assesses unrecognised deferred tax assets. It recognises unrecognised deferred tax assets to the extent that it has
become reasonably certain or virtually certain, as the case may be that sufficient future taxable income will be available against which such deferred tax assets
can be realised.
The carrying amount of deferred tax assets are reviewed at each reporting date. The Company writes-down the carrying amount of a deferred tax asset to
the extent that it is no longer reasonably certain or virtually certain, as the case may be, that sufficient future taxable income will be available against which
deferred tax asset can be realised. Any such write-down is reversed to the extent that it becomes reasonably certain or virtually certain, as the case may be, that
sufficient future taxable income will be available.
Deferred tax assets and deferred tax liabilities are offset, if a legally enforceable right exists to set-off current tax assets against current tax liabilities and the
deferred tax assets and deferred taxes relate to the same taxable entity and the same taxation authority.
Minimum Alternate Tax (MAT) paid in a year is charged to the statement of profit and loss as current tax. The Company recognizes MAT credit available as
an asset only to the extent that there is convincing evidence that the Company will pay normal income tax during the specified period, i.e., the period for
which MAT credit is allowed to be carried forward. In the year in which the Company recognizes MAT credit as an asset in accordance with the Guidance Note
on “Accounting for Credit Available in respect of Minimum Alternative Tax under the Income-tax Act, 1961”, the said asset is created by way of credit to the
statement of profit and loss and shown as “MAT Credit Entitlement.” The Company reviews the “MAT credit entitlement” asset at each reporting date and writes
down the asset to the extent the Company does not have convincing evidence that it will pay normal tax during the specified period.
m. Employee stock compensation costs
Employees (including senior executives) of the Company also receive remuneration in the form of share based payment transactions, whereby employees
render services as consideration for equity instruments (equity-settled transactions).
In accordance with the Securities and Exchange Board of India (share based employee benefits) Regulations, 2014 and the Guidance Note on Accounting
for Employee Share-based Payments, the cost of equity-settled transactions is measured using the intrinsic value method and recognised, together with a
corresponding increase in the “Stock options outstanding account” in reserves. The cumulative expense recognised for equity-settled transactions at each
reporting date until the vesting date reflects the extent to which the vesting period has expired and the Company’s best estimate of the number of equity
instruments that will ultimately vest. Expenses for equity settled options expiring unexercised after vesting are not reversed through statement of profit and
loss. The expense or credit recognised in the statement of profit and loss for a period represents the movement in cumulative expense recognised as at the
beginning and end of that period and is recognised in employee benefits expense.
Credibly Capable | Annual Report 2016164

Financial Report
n. Earnings per share (EPS)
Basic earnings per share are calculated by dividing the net profit or loss for the year attributable to equity shareholders by the weighted average number of
equity shares outstanding during the year. Partly paid equity shares are treated as a fraction of an equity share to the extent that they are entitled to participate
in dividends relative to a fully paid equity share during the reporting period. The weighted average number of equity shares outstanding during the year is
adjusted for events such as bonus issue; bonus element in a rights issue to existing shareholders; share split; and reverse share split (consolidation of shares)
that have changed the number of equity shares outstanding, without a corresponding change in resources.
For the purpose of calculating diluted earnings per share, the net profit or loss for the year attributable to equity shareholders and the weighted average
number of shares outstanding during the year are adjusted for the effects of all dilutive potential equity shares.
o. Operating lease
Where the Company is a Lessee
Leases of assets under which all the risks and rewards of ownership are effectively retained by the lessor are classified as operating leases. Lease payments
under operating leases are recognised as an expense on a straight-line basis over the lease term.
Where the Company is a Lessor
Leases in which the Company does not transfer substantially all the risks and benefits of ownership of the asset are classified as operating leases. Assets subject
to operating leases are included in fixed assets. Lease income is recognised on a straight line basis over the lease term. Costs, including depreciation are
recognised as an expense. Initial direct costs such as legal costs, brokerage costs, etc are recognised immediately in the statement of profit and loss.
p. Segment reporting
Identi!cation of segments
The Company’s operating businesses are organised and managed separately according to the nature of products and services provided, with each segment
representing a strategic business unit that offers different products and services to different markets. The analysis of geographical segments is based on the
areas in which major operating divisions of the Company operates.
Inter-segment Transfers
The Company generally accounts for inter-segment sales and transfers at an agreed marked-up price.
Allocation of common costs
Common allocable costs are allocated to each segment according to the relative contribution of each segment to the total common costs.
Unallocated items
The Corporate and other segment include general corporate income and expense items which are not allocated to any business segment.
Segment policies
The Company prepares its segment information in conformity with the accounting policies adopted for preparing and presenting the financial statements of
the Company as a whole.
q. Provisions
A provision is recognised when the Company has a present obligation as a result of past event; it is probable that an outflow of resources embodying
economic benefits will be required to settle the obligation and a reliable estimate can be made of the amount of the obligation. Provisions are not discounted
to its present value and are determined based on best estimate required to settle the obligation at the reporting date. These estimates are reviewed at each
reporting date and adjusted to reflect the current best estimates.
Where the Company expects some or all of a provision to be reimbursed, for example under an insurance contract, the reimbursement is recognised as a
separate asset but only when the reimbursement is virtually certain. The expense relating to any provision is presented in the statement of profit and loss net
of any reimbursement.
r. Contingent liability
A contingent liability is a possible obligation that arises from past events whose existence will be confirmed by the occurrence or non-occurrence of one or
more uncertain future events beyond the control of the Company or a present obligation that is not recognised because it is not probable that an outflow of
resources will be required to settle the obligation. A contingent liability also arises in extremely rare cases where there is a liability that cannot be recognised
because it cannot be measured reliably. The Company does not recognise a contingent liability but discloses its existence in the financial statements.
s. Cash and cash equivalents
Cash and cash equivalents for the purpose of cash flow statement comprise cash at bank and in hand and short-term investments with an original maturity of
three months or less.
t. Derivative instruments
In accordance with the ICAI announcement, derivative contracts, other than foreign currency forward contracts covered under AS 11, are marked to market
on a portfolio basis, and the net loss, if any, after considering the offsetting effect of gain on the underlying hedged item, is charged to the statement of profit
and loss. Net gain, if any, after considering the offsetting effect of loss on the underlying hedged item, is ignored.
Biocon Limited
165

March 31, 2016 March 31, 2015
3. Share capital
Authorised
220,000,000 (March 31, 2015 - 220,000,000) equity shares of ` 5 each (March 31, 2015 - ` 5 each) 1,100 1,100
Issued, subscribed and fully paid-up
200,000,000 (March 31, 2015 - 200,000,000) equity shares of ` 5 each (March 31, 2015 - ` 5 each) 1,000 1,000
(a) Reconciliation of the shares outstanding at the beginning and at the end of the reporting period
Equity shares March 31, 2016 March 31, 2015
No. ` Million No. ` Million
At the beginning of the year 200,000,000 1,000 200,000,000 1,000
Issued during the year - - - -
Outstanding at the end of the year 200,000,000 1,000 200,000,000 1,000
(b) Terms/rights attached to equity shares
The Company has only one class of equity shares having a par value of ` 5 per share. Each holder of equity shares is entitled to one vote per share. The Company
declares and pays dividends in Indian Rupees. The dividend proposed by the Board of Directors is subject to the approval of the shareholders in the ensuing Annual
General Meeting.
During the year ended March 31, 2016, the Board of Directors approved interim dividend for distribution to equity shareholders of ` 5 per share (March 31, 2015 - ` 5
per share).
In the event of liquidation of the Company, the holders of equity shares will be entitled to receive remaining assets of the Company, after distribution of all preferential
amounts, if any. The distribution will be in proportion to the number of equity shares held by the shareholders.
(c) Details of shareholders holding more than 5% shares in the Company
March 31, 2016 March 31, 2015
No. % holding No. % holding
Equity shares of ` 5 each fully paid
Dr. Kiran Mazumdar-Shaw 79,287,564 39.64% 79,287,564 39.64%
Glentec International 39,535,194 19.77% 39,535,194 19.77%
As per records of the Company, including its register of shareholders/members, the above shareholding represents both legal and beneficial ownerships of shares.
(d) Shares reserved for issue under options
For details of shares reserved for issue under the employee stock option (ESOP) plan of the Company, please refer note 30.
(This space has been intentionally left blank)
Credibly Capable | Annual Report 2016166

Financial Report
March 31, 2016 March 31, 2015
4. Reserves and surplus
Securities premium 2,788 2,788
Revaluation reserve 9 9
ESOP Trust
Opening balance - 886
Less: Deconsolidation of ESOP Trust [refer note 2] - (886)
Closing balance - -
General reserve
Opening balance 3,458 3,097
Add: Amount transferred from surplus in the statement of profit and loss - 361
Closing balance 3,458 3,458
Surplus in the statement of pro!t and loss
Balance as per last financial statements 18,329 16,137
Adjustment for depreciation [refer note 12 (g)] - (29)
Profit for the year 8,088 3,612
Less: Appropriations
Interim dividend on equity shares [amount per share ` 5 (March 31, 2015 - ` 5)] (1,000) (1,000)
Tax on interim dividend (107) (30)
Transfer to general reserve - (361)
Total appropriations (1,107) (1,391)
Net surplus in the statement of profit and loss 25,310 18,329
Employee stock options outstanding
Balance as per last financial statements 260 260
Add: Compensation for options granted during the year 60 -
Closing balance 320 260
Total Reserves and surplus 31,885 24,844
(This space has been intentionally left blank)
Biocon Limited
167
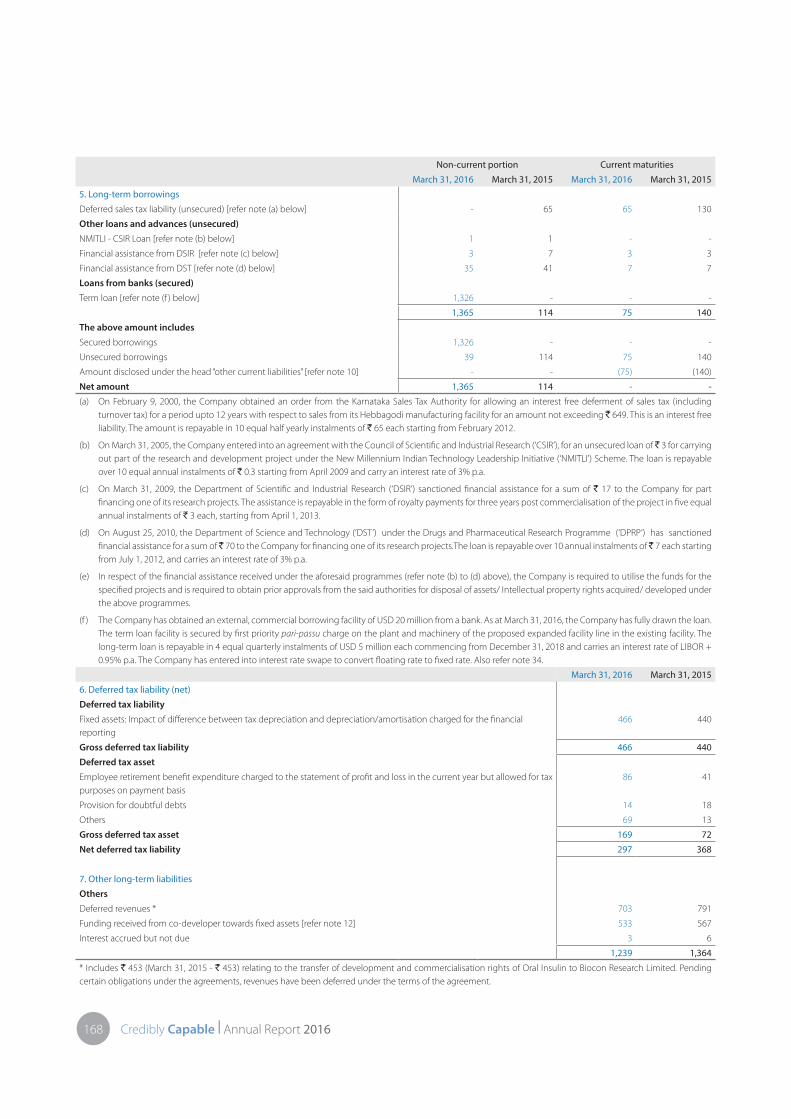
Non-current portion Current maturities
March 31, 2016 March 31, 2015 March 31, 2016 March 31, 2015
5. Long-term borrowings
Deferred sales tax liability (unsecured) [refer note (a) below] - 65 65 130
Other loans and advances (unsecured)
NMITLI - CSIR Loan [refer note (b) below] 1 1 - -
Financial assistance from DSIR [refer note (c) below] 3 7 3 3
Financial assistance from DST [refer note (d) below] 35 41 7 7
Loans from banks (secured)
Term loan [refer note (f ) below] 1,326 - - -
1,365 114 75 140
The above amount includes
Secured borrowings 1,326 - - -
Unsecured borrowings 39 114 75 140
Amount disclosed under the head “other current liabilities” [refer note 10] - - (75) (140)
Net amount 1,365 114 - -
(a) On February 9, 2000, the Company obtained an order from the Karnataka Sales Tax Authority for allowing an interest free deferment of sales tax (including
turnover tax) for a period upto 12 years with respect to sales from its Hebbagodi manufacturing facility for an amount not exceeding ` 649. This is an interest free
liability. The amount is repayable in 10 equal half yearly instalments of ` 65 each starting from February 2012.
(b) On March 31, 2005, the Company entered into an agreement with the Council of Scientific and Industrial Research (‘CSIR’), for an unsecured loan of ̀ 3 for carrying
out part of the research and development project under the New Millennium Indian Technology Leadership Initiative (‘NMITLI’) Scheme. The loan is repayable
over 10 equal annual instalments of ` 0.3 starting from April 2009 and carry an interest rate of 3% p.a.
(c) On March 31, 2009, the Department of Scientific and Industrial Research (‘DSIR’) sanctioned financial assistance for a sum of ` 17 to the Company for part
financing one of its research projects. The assistance is repayable in the form of royalty payments for three years post commercialisation of the project in five equal
annual instalments of ` 3 each, starting from April 1, 2013.
(d) On August 25, 2010, the Department of Science and Technology (‘DST’) under the Drugs and Pharmaceutical Research Programme (‘DPRP’) has sanctioned
financial assistance for a sum of ̀ 70 to the Company for financing one of its research projects.The loan is repayable over 10 annual instalments of ̀ 7 each starting
from July 1, 2012, and carries an interest rate of 3% p.a.
(e) In respect of the financial assistance received under the aforesaid programmes (refer note (b) to (d) above), the Company is required to utilise the funds for the
specified projects and is required to obtain prior approvals from the said authorities for disposal of assets/ Intellectual property rights acquired/ developed under
the above programmes.
(f ) The Company has obtained an external, commercial borrowing facility of USD 20 million from a bank. As at March 31, 2016, the Company has fully drawn the loan.
The term loan facility is secured by first priority pari-passu charge on the plant and machinery of the proposed expanded facility line in the existing facility. The
long-term loan is repayable in 4 equal quarterly instalments of USD 5 million each commencing from December 31, 2018 and carries an interest rate of LIBOR +
0.95% p.a. The Company has entered into interest rate swape to convert floating rate to fixed rate. Also refer note 34.
March 31, 2016 March 31, 2015
6. Deferred tax liability (net)
Deferred tax liability
Fixed assets: Impact of difference between tax depreciation and depreciation/amortisation charged for the financial
reporting
466 440
Gross deferred tax liability 466 440
Deferred tax asset
Employee retirement benefit expenditure charged to the statement of profit and loss in the current year but allowed for tax
purposes on payment basis
86 41
Provision for doubtful debts 14 18
Others 69 13
Gross deferred tax asset 169 72
Net deferred tax liability 297 368
7. Other long-term liabilities
Others
Deferred revenues * 703 791
Funding received from co-developer towards fixed assets [refer note 12] 533 567
Interest accrued but not due 3 6
1,239 1,364
* Includes ` 453 (March 31, 2015 - ` 453) relating to the transfer of development and commercialisation rights of Oral Insulin to Biocon Research Limited. Pending
certain obligations under the agreements, revenues have been deferred under the terms of the agreement.
Credibly Capable | Annual Report 2016168

Financial Report
March 31, 2016 March 31, 2015
8. Short-term borrowings
From banks/!nancial institutions
Packing credit foreign currency loan (unsecured) [refer note (i), (ii) and (iii) below] 2,253 561
Cash credit (secured) [refer Note (iv) below] 2 -
2,255 561
The above amount includes
Secured borrowings 2 -
Unsecured borrowings 2,253 561
(i) During the year ended March 31, 2016, the Company has obtained unsecured foreign currency denominated loans of ` 597 (USD 9 million) [March 31, 2015 ` Nil
(USD Nil)], carrying an interest rate of LIBOR+ 0.20% p.a. from a bank. The facility is repayable within 120 days from the date of its origination.
(ii) During the year ended March 31, 2016, the Company has obtained unsecured foreign currency denominated loans of ` 1,656 (USD 25 million) [March 31, 2015 ` Nil
(USD Nil)], carrying an interest rate of LIBOR+ 0.10% p.a. from a bank. The facility is repayable within 180 days from the date of its origination.
(iii) During the year ended March 31, 2015, the Company had obtained foreign currency denominated loan of ` 561 (USD 9 million), carrying an interest rate of LIBOR+
0.35% p.a., from a bank. The facility was repayable within 180 days from the date of its origination and has been repaid during the year.
(iv) The Company has working capital facilities with a bank carrying interest rate ranging from 9.7% - 13% p.a. These facilities are repayable on demand, secured by
pari-passu first charge on inventories and trade receivables.
March 31, 2016 March 31, 2015
9. Trade payables
Trade payables [refer note (a) below]
Total outstanding dues of micro and small enterprises 102 77
Total outstanding dues of creditors other than micro and small enterprises 3,841 2,931
3,943 3,008
(a) Disclosure required under Clause 22 of Micro, Small and Medium Enterprise Development Act, 2006
(i) The principal amount and the interest due thereon remaining unpaid to any supplier as at the end of each
accounting year
Principal amount due to micro and small enterprises 102 77
Interest due on the above - 1
(ii) The amount of interest paid by the buyer in terms of Section 16 of the MSMED Act, 2006 along with the amounts
of the payment made to the supplier beyond the appointed day during each accounting year
317 312
(iii) The amount of interest due and payable for the period of delay in making payment (which has been paid but
beyond appointed day during the year) but without adding the interest specified under the MSMED Act, 2006
- -
(iv) Interest due and payable for the period of delay in making payment during the year 2 4
(v) The amount of interest accrued and remaining un-paid at the end of each accounting year - -
(vi) The amount of further interest remaining due and payable even in the succeeding years, until such date when
the interest dues as above are actually paid to the small enterprise for the purpose of disallowance as a deductible
expenditure under Section 23 of the MSMED Act, 2006
25 23
The above disclosures are provided by the Company based on the information available with the Company in respect of
the registration status of its vendors/ suppliers.
10. Other current liabilities
Current maturities of long-term borrowings [refer note 5] 75 140
Deferred revenues 39 20
Funding received from co-developer towards fixed assets [refer note 12] 77 77
Investor Education and Protection Fund shall be credited by
Unclaimed dividend 10 6
Payables for capital goods 748 239
Book overdraft 252 -
Advances from customers 58 32
Other payables:
Statutory dues [refer note (a) below] 77 89
Others 68 -
1,404 603
(a) Statutory dues includes provident fund, employees state insurance, professional tax, withholding taxes and other indirect taxes payable.
Biocon Limited
169

Long-term Short-term
March 31, 2016 March 31, 2015 March 31, 2016 March 31, 2015
11. Provisions
Provision for employee bene!ts
Leave encashment - - 82 74
Gratuity 95 - 73 121
Others
Interim dividend on equity shares - - - 1,000
Provision for income tax, net of advance tax - - 351 273
95 - 506 1,468
(This space has been intentionally left blank)
Credibly Capable | Annual Report 2016170

Financial Report
12. Tangible assets
Land
[Refer note (a)
and (b)]
Buildings Leasehold
improvements
Plant and
equipment
[Refer note
(e)]
Research &
development
equipments
Furniture
and !xtures
Vehicles Total
Cost or Valuation
At April 1, 2014 389 3,854 3 11,214 1,127 381 19 16,987
Additions - 76 3 769 21 12 31 912
Disposals - - - (10) - - (6) (16)
At March 31, 2015 389 3,930 6 11,973 1,148 393 44 17,883
Additions [also refer note (f ) below] 130 381 - 832 15 43 6 1,407
Disposals - - - (77) - - (6) (83)
At March 31, 2016 519 4,311 6 12,728 1,163 436 44 19,207
Depreciation/ Amortisation
At April 1, 2014 - 767 1 5,981 644 168 16 7,577
Other adjustment [refer note (g) below] - 29 - - - - - 29
Charge for the year - 157 - 995 101 47 4 1,304
Disposals - - - (10) - - (3) (13)
At March 31, 2015 - 953 1 6,966 745 215 17 8,897
Charge for the year - 169 - 1,040 86 50 6 1,351
Disposals - - - (74) - - (2) (76)
At March 31, 2016 - 1,122 1 7,932 831 265 21 10,172
Net Block
At March 31, 2015 389 2,977 5 5,007 403 178 27 8,986
At March 31, 2016 519 3,189 5 4,796 332 171 23 9,035
a) Land includes land held on leasehold basis: Gross Block ` 226 (March 31, 2015 - ` 226) ; Net Block ` 226 (March 31, 2015 - ` 226).
b) On December 5, 2002, Karnataka Industrial Areas Development Board (‘KIADB’) allotted land aggregating to 26.75 acres to the Company for ` 64 on a lease-cum-
sale basis for a period of 6 years, extended subsequently for further period of 14 years. During the year ended March 31, 2005, the Company acquired an additional
41.25 acres of land for ̀ 99 from KIADB. During the quarter ended June 30, 2005, the Company paid an advance of ̀ 56 towards allotment of additional 19.68 acres
of land, offered to the Company by KIADB on December 20, 2003. The Company has received the possession certificate from KIADB in January 2006 and entered
into an agreement with KIADB to acquire this plot of land on lease-cum-sale basis for a period of 20 years during the year ended March 31, 2007. The registration
for a part of the land under this lease is pending settlement of certain disputes in respect of claims made against KIADB.
c) Additions to fixed assets during the year ended March 31, 2016, include assets of ` 266 (March 31, 2015 - ` 64) of which, ` 235 (March 31, 2015 - ` 32) has been
funded by the co-development partner/ customer. The Company has capitalised and depreciated the gross cost of these assets. The funding received from the
co-development partner is reflected in notes 7 and 10 and the depreciation charge for the year has been adjusted for the proportionate amount recovered from
the co-development partner. Also refer note 27.
d) Also refer note 35 (ii) (b) for asset given on lease.
e) Plant and equipment include computers and office equipment.
f ) The Company has acquired the business assets of the pharmaceutical manufacturing unit of M/s. Acacia Lifesciences Private Limited located at Vishakhapatnam
with effect from October 1, 2015 on a going concern basis for a consideration of ` 531. Fixed assets have been recorded on the fair valuation basis, performed by
an independent valuer, including the assessment of remaining useful life of fixed assets. Stamp duty of ` 11 has been incurred and capitalized in addition to the
value of fixed assets capitalized. Goodwill of ` 77 has been recorded being the excess of purchase consideration over the value of net assets acquired. The useful
life of goodwill has been estimated to be 5 years.
g) During the year ended March 31, 2015 depreciation of ` 29 (net of deferred tax impact) had been adjusted to the opening balance of surplus in the Statement of
profit and loss as at April 1, 2014, with corresponding adjustment to net book value of fixed assets, in accordance with the transitional provisions of Schedule II of
the Act.
(This space has been intentionally left blank)
Biocon Limited
171

13. Intangible assets
Intellectual
property rights
Computer
software
Marketing and
Manufacturing
rights [Refer note
(a), (b) and (c)]
Goodwill
[Refer note (d)]
Total
Gross Block
At April 1, 2014 81 39 193 - 313
Additions - 125 - - 125
At March 31, 2015 81 164 193 - 438
Additions - 54 101 77 232
At March 31, 2016 81 218 294 77 670
Amortisation
At April 1, 2014 81 39 110 - 230
Charge for the year - 20 31 - 51
At March 31, 2015 81 59 141 - 281
Charge for the year - 27 12 8 47
At March 31, 2016 81 86 153 8 328
Net Block
At March 31, 2015 - 105 52 - 157
At March 31, 2016 - 132 141 69 342
a) Erstwhile Biocon Biopharmaceuticals Limited (merged with Biocon with effect from April 1, 2013) (“BBL”) had entered into an agreement with M/s CIMAB, Cuba to
acquire manufacturing rights for certain products in specified territories for a total cost of ̀ 64. M/s CIMAB, Cuba is in the process of obtaining regulatory approvals
in the respective countries.
b) During the year ended March 31, 2009, the Company acquired marketing rights of hR3 and EPO from BBL for a sum of ` 129. These rights give the Company an
exclusive right of marketing the products in certain territories. Effective April 2010, the Company commenced amortisation of these rights over a period of 5 years,
being the estimated useful life of these rights.
c) Pursuant to an asset purchase agreement, with a customer, executed during the year ended March 31, 2016, the Company has acquired the marketing and
manufacturing rights for a product for a sum of ` 101.
d) Also refer note 12 (f ) for recognition of goodwill.
(This space has been intentionally left blank)
Credibly Capable | Annual Report 2016172

Financial Report
March 31, 2016 March 31, 2015
14. Non-current investments
A) Trade investments (valued at cost unless stated otherwise):
I. Quoted equity instruments
In subsidiary company:
145,217,843 (March 31, 2015 - Nil) equity shares of ` 10 each in Syngene International Limited [refer note (g) below] 72 -
Total quoted non-current investments 72 -
II. Unquoted equity instruments
In subsidiary companies:
Nil (March 31, 2015 - 167,217,843) equity shares of ` 10 each in Syngene International Limited [refer note (g) below] - 83
500,000 (March 31, 2015 - 500,000) equity shares of ` 1 each fully paid-up in Biocon Research Limited [refer note (a) below] 1 1
100,000 (March 31, 2015 - 100,000) equity shares of CHF 1 each fully paid-up in Biocon SA, Switzerland 4 4
Nil (March 31, 2015 - 4,853,734) equity shares of RM 10 each fully paid-up in Biocon Sdn.Bhd., Malaysia [refer note (e) below] - 712
150 (March 31, 2015 - Nil) equity shares of AED 1,000 each fully paid-up in Biocon FZ LLC, UAE 3 -
5,050,000 (March 31, 2015 - 50,000) equity shares of ` 10 each fully paid-up in Biocon Pharma Limited 51 1
47,183,101 (March 31, 2015: Nil) equity shares of GBP 1 each fully paid-up in Biocon Biologics Limited, UK [refer note (e) below] 4,453 -
50,000 (March 31, 2015 - 50,000) equity shares of ` 10 each fully paid-up in Biocon Academy 1 1
153 (March 31, 2015 - 153) equity shares of AED 1,000 each fully paid-up in NeoBiocon FZ LLC, UAE [refer note (b) below] 2 2
Total unquoted non-current investments in equity shares of subsidiary companies 4,515 804
III. Unquoted preference shares
In associate company:
4,285,714 (March 31, 2015 - 4,285,714) Series A Preferred Stock at USD 0.70 each, fully paid-up,
par value US $ 0.00001 each in IATRICa Inc., USA
139 139
Less: Provision for decline, other than temporary, in the value of non-current investments [refer note (d) below] (139) (139)
- -
Others:
2,722,014 (March 31, 2015 - 2,722,014) Series B1 Preferred Convertible Stock at US$ 1.55 each, fully paid-up,
par value US $0.001 each in Vaccinex Inc., USA
186 186
217,972 (March 31, 2015 - 217,972) Series B2 Preferred Convertible Stock at USD 3.10 each, fully paid-up,
par value US $0.001 each in Vaccinex Inc., USA
32 32
Less: Provision for decline, other than temporary, in the value of non-current investments [refer note (c) below] (218) (218)
- -
Total unquoted non current investments 4,515 804
Total 4,587 804
Aggregate value of unquoted investments (cost) 4,872 1,161
Aggregate value of quoted investments (cost) 72 -
Aggregate value of quoted investments (market value) 55,800 -
Aggregate provision for diminution in value of investments 357 357
(a) During the year ended March 31, 2009, Biocon Research Limited (‘BRL’) was incorporated as a wholly owned subsidiary for undertaking research in novel and drug
products. BRL commenced commercial activities during the year ended March 31, 2010 and as at March 31, 2016 has a negative net worth of ` 1,337 (March 31,
2015 - ` 2,006) due to its early stage of operations and research activities. BRL is a research & development company and of strategic importance to the Company.
Accordingly, the management is of the view that there is no diminution in the value of the investment. The Company has committed to support BRL to fund its
operations. The Company has also granted an unsecured long-term loan facility of ` 6,500 repayable in March, 2020. The outstanding amount of Loan as at March
31, 2016 is ` 1,455 (March 31, 2015 - ` 2,447). The Company also has other receivables of ` 1,104 (March 31, 2015 - ` 854) from BRL.
(b) NeoBiocon was incorporated in Dubai as a 50% joint venture between the Company and Mr. B R Shetty and is engaged in marketing and distribution of biopharmaceuticals in the Middle-East region. On July 1, 2014, the Company acquired an additional equity stake of 1% in NeoBiocon, taking its holding to 51%.
Accordingly, effective July 01, 2014 NeoBiocon has become a subsidiary of the Company. For the quarter ended June 30, 2014, the aggregate amount of Biocon’s interest in the income and expenses of NeoBiocon was ` 141 and ` 81 respectively.
(c) Vaccinex Inc., USA (‘Vaccinex’) is engaged in research and development activities and has been incurring losses. During the year ended March 31, 2015, considering the financial position and uncertain future cash flows of Vaccinex, the Company on a prudent basis, created a provision of ` 218 for diminution other than
temporary, in the value of its investments.
(d) In 2008, the Company invested ` 139 in IATRICa, engaged in the development of immunoconjugates, for a 30% equity stake. During the year ended March 31, 2013,
there were certain developments in connection with this investment arising due to patent filings, which are contrary to contractual obligations. Pursuant to this, on a
prudent basis, during the year ended March 31, 2013, the Company created a provision of ` 139 for diminution, in the value of investment in IATRICa.
(e) During the year ended March 31, 2016 Biocon Biologics Limited was incorporated as a wholly owned subsidiary in United Kingdom to undertake development and commercialisation of Biosimilar products. During the year ended March 31, 2016, the Company sold its investment in the equity shares of Biocon Sdn. Bhd., a wholly
owned subsidiary to Biocon Biologics Limited (UK), for a sum of ̀ 811. Gain arising from such sale of equity shares amounting to ̀ 99 (net of cost of such equity shares), is recorded as an exceptional gain in the financial statements. Consequential tax of ` 21 is recorded on such gain.
(f ) The Company has invested in National Savings Certificates (unquoted) which are not disclosed above since amounts are rounded off to Rupees million.
(g) During the year, Syngene International Limited (‘Syngene’) completed its Initial Public Offering (IPO), through an offer for sale of 22,000,000 equity shares of ` 10 each, by the Company. Post the sale, the Company’s holding in equity shares of Syngene has reduced from 83.61% to 72.61%. The equity shares of Syngene
were listed on National Stock Exchange of India Limited and BSE Limited on August 11, 2015. Gain arising from such sale of equity shares, net of related expenses
and cost of equity shares, amounting to ` 5,131 is recorded as an exceptional gain in the financial statements. Consequential tax of ` 1,042 is recorded on such gains.
Biocon Limited
173

15. Loans and advances (unsecured, considered good)
Non-current Current
March 31, 2016 March 31, 2015 March 31, 2016 March 31, 2015
Capital advances [refer note (a) below] 430 274 - -
Loans to related parties [refer note (b) below] 1,584 2,447 - -
Duty drawback receivable [refer note (d) below] 313 326 - -
Balances with statutory/government authorities 632 857 - -
Other receivables from related parties [refer note 32 and note (c) below] 1,104 854 705 285
Other receivables - - 21 16
Deposits 173 165 - -
MAT credit entitlement 42 42 - -
Advance income tax (net of provision for taxation) 462 462 - -
Advances recoverable in cash or in kind or for value to be received 8 8 224 196
4,748 5,435 950 497
(a) During the year ended March 31, 2008, the Company was allotted land at the Jawaharlal Nehru Pharma City Vishakhapatnam, Andhra Pradesh, on a long-term
lease basis for a consideration of ` 260. The Company had paid the entire consideration towards the cost of the lease and during the year ended March 31, 2012,
the Company had intimated the SEZ developer of its intention to surrender the above land. During the year ended March 31, 2016 the Company has conveyed
its intention to execute a formal sale/lease deed.
(b) Loans to related parties comprise loans given to following subsidiaries: (Non-current and current)
March 31, 2016 March 31, 2015
(i) Biocon Research Limited 1,455 2,447
Maximum amount outstanding during the year 4,799 3,053
(ii) Biocon Pharma Limited 129 -
Maximum amount outstanding during the year 179 -
(c) Other receivables from related parties comprise receivables from following subsidiaries:(Non-current and current)
Syngene International Limited 91 150
Biocon Research Limited 1,104 854
Biocon SA 51 94
Biocon Sdn Bhd 536 41
NeoBiocon FZ LLC 3 -
Biocon Pharma Limited 24 -
(d) Net of doubtful receivables of ` 216 (March 31, 2015 - ` 69), which has been fully provided
Non-current Current
March 31, 2016 March 31, 2015 March 31, 2016 March 31, 2015
16. Other assets
Unamortised premium on foreign exchange option contracts 5 13 22 30
Unbilled revenue - - - 108
Interest accrued on deposits with banks and financial institutions 26 - 241 55
Non-current cash and bank balances [refer note 20] 500 - - -
531 13 263 193
Credibly Capable | Annual Report 2016174
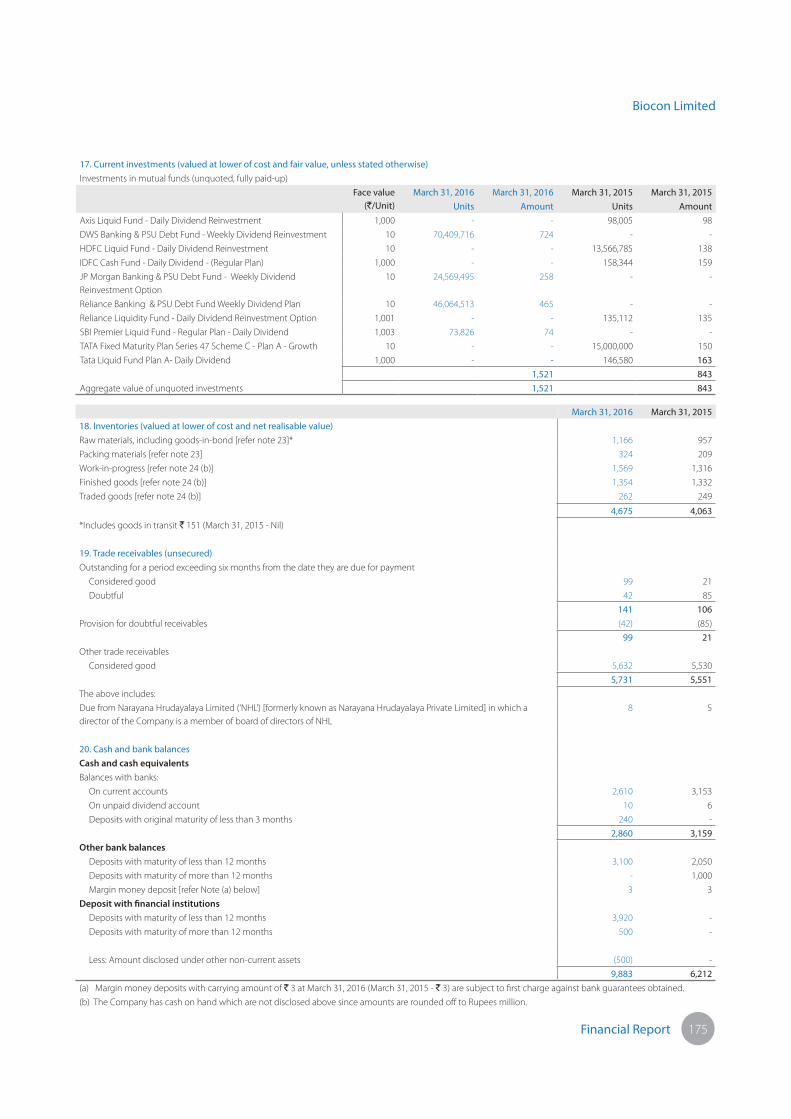
Financial Report
17. Current investments (valued at lower of cost and fair value, unless stated otherwise)
Investments in mutual funds (unquoted, fully paid-up)
Face value
(`/Unit)
March 31, 2016 March 31, 2016 March 31, 2015 March 31, 2015
Units Amount Units Amount
Axis Liquid Fund - Daily Dividend Reinvestment 1,000 - - 98,005 98
DWS Banking & PSU Debt Fund - Weekly Dividend Reinvestment 10 70,409,716 724 - -
HDFC Liquid Fund - Daily Dividend Reinvestment 10 - - 13,566,785 138
IDFC Cash Fund - Daily Dividend - (Regular Plan) 1,000 - - 158,344 159
JP Morgan Banking & PSU Debt Fund - Weekly Dividend
Reinvestment Option
10 24,569,495 258 - -
Reliance Banking & PSU Debt Fund Weekly Dividend Plan 10 46,064,513 465 - -
Reliance Liquidity Fund - Daily Dividend Reinvestment Option 1,001 - - 135,112 135
SBI Premier Liquid Fund - Regular Plan - Daily Dividend 1,003 73,826 74 - -
TATA Fixed Maturity Plan Series 47 Scheme C - Plan A - Growth 10 - - 15,000,000 150
Tata Liquid Fund Plan A- Daily Dividend 1,000 - - 146,580 163
1,521 843
Aggregate value of unquoted investments 1,521 843
March 31, 2016 March 31, 2015
18. Inventories (valued at lower of cost and net realisable value)
Raw materials, including goods-in-bond [refer note 23]* 1,166 957
Packing materials [refer note 23] 324 209
Work-in-progress [refer note 24 (b)] 1,569 1,316
Finished goods [refer note 24 (b)] 1,354 1,332
Traded goods [refer note 24 (b)] 262 249
4,675 4,063
*Includes goods in transit ` 151 (March 31, 2015 - Nil)
19. Trade receivables (unsecured)
Outstanding for a period exceeding six months from the date they are due for payment
Considered good 99 21
Doubtful 42 85
141 106
Provision for doubtful receivables (42) (85)
99 21
Other trade receivables
Considered good 5,632 5,530
5,731 5,551
The above includes:
Due from Narayana Hrudayalaya Limited (‘NHL’) [formerly known as Narayana Hrudayalaya Private Limited] in which a
director of the Company is a member of board of directors of NHL
8 5
20. Cash and bank balances
Cash and cash equivalents
Balances with banks:
On current accounts 2,610 3,153
On unpaid dividend account 10 6
Deposits with original maturity of less than 3 months 240 -
2,860 3,159
Other bank balances
Deposits with maturity of less than 12 months 3,100 2,050
Deposits with maturity of more than 12 months - 1,000
Margin money deposit [refer Note (a) below] 3 3
Deposit with !nancial institutions
Deposits with maturity of less than 12 months 3,920 -
Deposits with maturity of more than 12 months 500 -
Less: Amount disclosed under other non-current assets (500) -
9,883 6,212
(a) Margin money deposits with carrying amount of ` 3 at March 31, 2016 (March 31, 2015 - ` 3) are subject to first charge against bank guarantees obtained.
(b) The Company has cash on hand which are not disclosed above since amounts are rounded off to Rupees million.
Biocon Limited
175

March 31, 2016 March 31, 2015
21. Revenue from operations
Sale of products
Finished goods 20,035 19,176
Traded goods 1,679 1,966
Sale of services
Licensing and development fees 223 283
Capacity reservation fees - 311
Other operating revenue
Sale of process waste 129 134
Others [refer note (a) and (b) below] 1,505 872
Revenue from operations (gross) 23,571 22,742
Less: Excise duty [refer note (c) below] 335 326
Revenue from operations (net) 23,236 22,416
(a) Others include processing charges, rentals and cross charge of power and other facilities by the SEZ Developer/ SEZ
unit of the Company.
(b) Others include ` 446 towards one time compensation from a customer to absolve the customer from capacity
reservation fees.
(c) Excise duty on sales amounting to ` 335 (March 31, 2015- ` 326) has been reduced from revenue from operations in
the statement of profit and loss and excise duty on (increase)/decrease in stock amounting to ` (2) [March 31, 2015
` (5)] has been considered as (income)/expense in note 26 of the financial statements.
Details of products sold
Finished goods
Biopharmaceuticals 16,313 15,786
Formulations 3,722 3,390
20,035 19,176
Traded goods
Biopharmaceuticals 84 38
Formulations 1,595 1,928
1,679 1,966
22. Other income
Interest income on:
Deposits with banks and financial institutions 397 55
Others 330 166
Dividend income from
Subsidiaries 487 997
Current investments 145 123
Net gain on sale of current investments 16 14
Foreign exchange gain, net 280 -
Other non-operating income 186 136
1,841 1,491
23. Cost of raw materials and packing materials consumed
Inventory at the beginning of the year 1,166 1,071
Add: Purchases 9,802 9,660
Less: Inventory at the end of the year 1,490 1,166
Cost of raw materials and packing materials consumed 9,478 9,565
(a) Details of raw materials and packing materials consumed
Bulk drug, formulation chemicals & excipients 2,146 2,366
Bulk drug intermediates 3,962 3,594
Solvents 1,560 1,798
Resins 584 453
Packing materials 639 577
Others 587 777
9,478 9,565
Credibly Capable | Annual Report 2016176
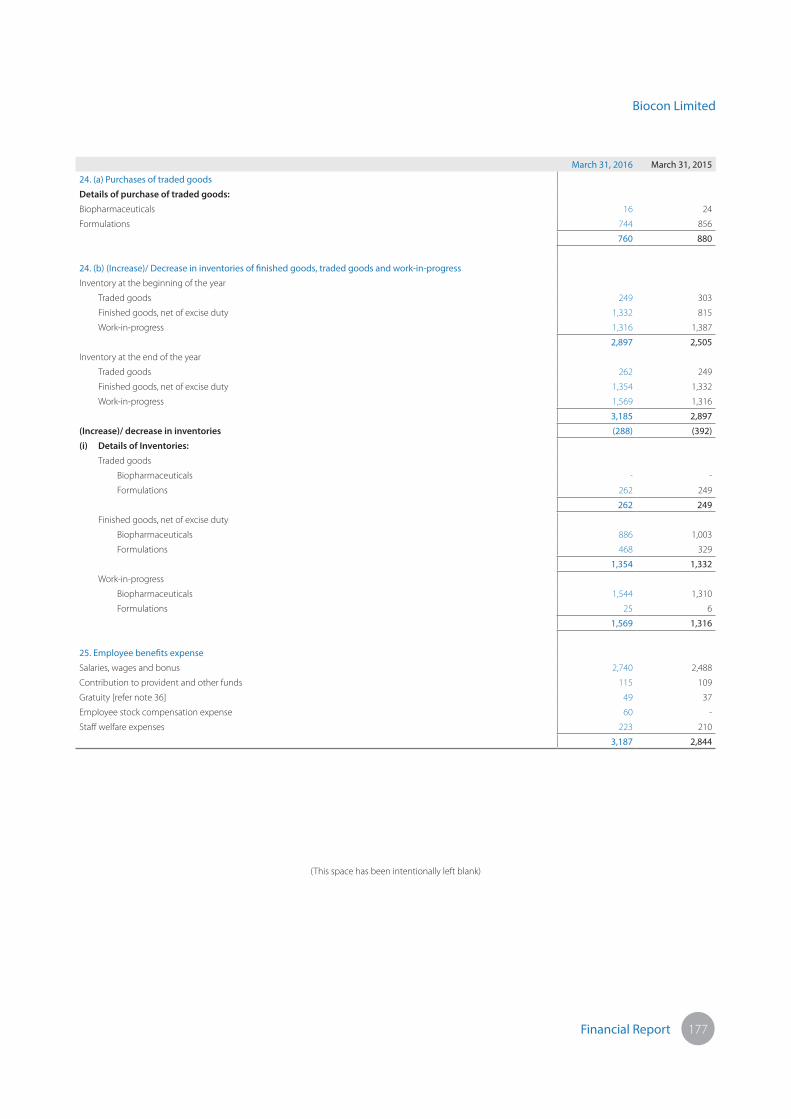
Financial Report
March 31, 2016 March 31, 2015
24. (a) Purchases of traded goods
Details of purchase of traded goods:
Biopharmaceuticals 16 24
Formulations 744 856
760 880
24. (b) (Increase)/ Decrease in inventories of !nished goods, traded goods and work-in-progress
Inventory at the beginning of the year
Traded goods 249 303
Finished goods, net of excise duty 1,332 815
Work-in-progress 1,316 1,387
2,897 2,505
Inventory at the end of the year
Traded goods 262 249
Finished goods, net of excise duty 1,354 1,332
Work-in-progress 1,569 1,316
3,185 2,897
(Increase)/ decrease in inventories (288) (392)
(i) Details of Inventories:
Traded goods
Biopharmaceuticals - -
Formulations 262 249
262 249
Finished goods, net of excise duty
Biopharmaceuticals 886 1,003
Formulations 468 329
1,354 1,332
Work-in-progress
Biopharmaceuticals 1,544 1,310
Formulations 25 6
1,569 1,316
25. Employee bene!ts expense
Salaries, wages and bonus 2,740 2,488
Contribution to provident and other funds 115 109
Gratuity [refer note 36] 49 37
Employee stock compensation expense 60 -
Staff welfare expenses 223 210
3,187 2,844
(This space has been intentionally left blank)
Biocon Limited
177

March 31, 2016 March 31, 2015
26. Other expenses
Royalty and technical fees 56 41
Rent 17 18
Communication expenses 40 33
Travelling and conveyance 335 330
Professional charges 383 333
Payments to auditors [refer note (a) below] 6 5
Directors’ fees including commission 20 21
Power and fuel 1,551 1,652
Insurance 30 19
Rates, taxes and fees, net of refunds of taxes 182 173
Lab consumables 373 254
Repairs and maintenance
Plant and machinery [refer note (b) below] 307 284
Buildings 90 50
Others 280 177
Selling expenses
Freight outwards and clearing charges 284 250
Sales promotion expenses 423 482
Commission and brokerage (other than sole selling agents) 253 216
(Increase)/Decrease of excise duty on inventory (2) (5)
Bad debts written off 8 -
Provision/(reversal) for doubtful debts, net (43) 47
Foreign exchange fluctuation, net - 14
Printing and stationery 26 26
Research & development expenses 902 595
CSR expenditure [refer note 39] 81 71
Miscellaneous expenses 152 153
5,754 5,239
(a) Payments to auditors :
As auditor:
Statutory audit fee 3 2
Tax audit fee 1 1
Limited review 2 2
In other capacity:
Other services (certification fees) [refer note (c) below] - -
Reimbursement of out-of-pocket expenses [refer note (c) below] - -
6 5
(b) Includes spare parts of ̀ 214 (March 31, 2015 - ̀ 179) of which ̀ 153 (March 31, 2015 - ̀ 174) were purchased indigenously
and ` 61 imported (March 31, 2015 - ` 5)
(c) Amounts are not presented since the amounts are rounded off to Rupees million.
27. Depreciation and amortisation (net)
Depreciation of tangible assets [refer note 12] 1,351 1,304
Amortisation of intangible assets [refer note 13] 47 51
Depreciation on assets partly funded by customer/co-development partner [refer note 12 (c)] (88) (74)
1,310 1,281
28. Finance costs
Interest expense 9 8
9 8
Credibly Capable | Annual Report 2016178

Financial Report
March 31, 2016 March 31, 2015
29. Research & development expenses
Research & development expenses (comprising clinical trial expenses, patent fees etc.) (a) 902 595
Other research & development expenses included in other heads of account:
Salaries, wages and bonus 182 139
Contribution to provident and other funds 7 6
Staff welfare expenses 2 5
Lab consumables 373 254
Travelling and conveyance 14 1
Professional charges - 11
(b) 578 416
(a + b) 1,480 1,011
Less: Recovery of product development costs from co-development partners (net) [refer note 38(b)] (48) (19)
1,432 992
Research and development (R & D) expenses on Buildings and Equipment
Buildings - 1
Equipment, net of funding received from co-development partner 35 21
30. Employee stock compensation
(a) Biocon ESOP Plan
On September 27, 2001, Biocon’s Board of Directors approved the Biocon Employee Stock Option Plan (‘ESOP Plan 2000’) for the grant of stock options to the employees
of the Company and its subsidiaries/ joint venture company. The Nomination and Remuneration Committee (‘Remuneration Committee’) administers the plan through
a trust established specifically for this purpose, called the Biocon India Limited Employee Welfare Trust (ESOP Trust).
The ESOP Trust shall make additional purchase of equity shares of the Company using the proceeds from the loan obtained from the Company, other cash inflows from
allotment of shares to employees under the ESOP Plan and shall subscribe, when allotted to such number of shares as is necessary for transferring to the employees. The
ESOP Trust may also receive shares from the promoters for the purpose of issuance to the employees under the ESOP Plan. The Remuneration Committee shall determine
the exercise price which will not be less than the face value of the shares.
Grant I
In September 2001, the Company granted 71,510 options (face value of shares ` 5 each) under the ESOP Plan 2000 to be exercised at a price of ` 10 (before adjusting
bonus and share split). The options vested with the employees equally over a four year period.
Grant II
In January 2004, the Company granted 142,100 options (face value of shares - ` 5 each) under ESOP Plan 2000 to be exercised at a price of ` 5 per share. The options vest
with the employees equally over a four year period.
Grant III
In January 2004, the Board of Directors announced the Biocon Employee Stock Option Plan (ESOP Plan 2004) for the grant of stock options to the employees of the
Company and its subsidiaries/ joint venture company, pursuant to which the Remuneration Committee on March 19, 2004 granted 422,000 options (face value of shares
- ̀ 5 each) under the ESOP Plan 2004 to be exercised at a grant price of ̀ 315 being the issue price determined for the IPO through the book building process. The options
vest with the employees equally over a four year period.
Grant IV
In July 2006, the Company approved the grant of 3,478,200 options (face value of shares - ` 5 each) to its employees under the existing ESOP Plan 2000. The options
under this grant would vest to the employees as 25%, 35% and 40% of the total grant at the end of first second and third year from the date of grant for existing
employees and at the end of third, fourth and fifth year from the date of grant for new employees. Exercise period is 3 years for each grant. The conditions for number of
options granted include service terms and performance grade of the employees. These options are exercisable at a discount of 20% to the market price of Company’s
shares on the date of grant.
Details of Grant IV
Particulars March 31, 2016 March 31, 2015
No. of
Options *
Weighted Average
Exercise Price (`)*
No. of
Options *
Weighted Average
Exercise Price (`)*
Outstanding at the beginning of the year 61,625 187 120,900 185
Granted during the year - - - -
Forfeited during the year - - 2,750 227
Exercised during the year 55,250 179 56,525 187
Expired during the year 2,875 154 - -
Outstanding at the end of the year 3,500 231 61,625 187
Exercisable at the end of the year 3,500 231 61,625 187
Weighted average remaining contractual life (in years) 0.3 - 0.1 -
*adjusted for the effect of bonus shares
Biocon Limited
179

Grant V
In April 2008, the Company approved the grant to its employees under the existing ESOP Plan 2000. The options under this grant would vest to the employees as 25%,
35% and 40% of the total grant at the end of first second and third year from the date of grant for existing employees and at the end of third, fourth and fifth year from
the date of grant for new employees. Exercise period is 3 years for each grant. The conditions for number of options granted include service terms and performance
grade of the employees. These options are exercisable at the market price of Company’s shares on the date of grant.
Details of Grant V
Particulars March 31, 2016 March 31, 2015
No. of
Options*
Weighted Average
Exercise Price (`)*
No. of
Options*
Weighted Average
Exercise Price (`)*
Outstanding at the beginning of the year 1,151,975 336 1,512,070 316
Granted during the year - - 78,000 467
Forfeited during the year 269,087 324 402,525 291
Exercised during the year 91,013 303 35,570 296
Expired during the year - - - -
Outstanding at the end of the year 791,875 343 1,151,975 336
Exercisable at the end of the year 220,638 310 168,475 301
Weighted average remaining contractual life (in years) 4.6 4.9 -
Weighted average fair value of options granted (`) - 226
*adjusted for the effect of bonus shares
Grant VI
In July 2014, the Company approved the grant to its employees under the existing ESOP Plan 2000. The options under this grant would vest to the employees as 10%,
20%, 30% and 40% of the total grant at the end of first, second, third and fouth year from the date of grant, respectively, with an exercise period ending one year from
the end of last vesting. The vesting conditions include service terms and performance grade of the employees. These options are exercisable at the closing market price
of Company’s shares existing on the date preceding to the date of grant.
Particulars March 31, 2016 March 31, 2015
No. of
Options
Weighted Average
Exercise Price (`)
No. of
Options
Weighted Average
Exercise Price (`)
Outstanding at the beginning of the year 1,346,152 470 - -
Granted during the year - - 1,447,440 470
Forfeited during the year 160,313 470 101,288 470
Exercised during the year - - - -
Expired during the year - - - -
Outstanding at the end of the year 1,185,839 470 1,346,152 470
Exercisable at the end of the year 116,750 470 - -
Weighted average remaining contractual life (in years) 3.3 4.4
Weighted average fair value of options granted (`) - 180
Grant VII
In July 2014, the Company approved the grant to its employees under the existing ESOP Plan 2000. The options under this grant would vest to the employees as 10%,
20%, 30% and 40% of the total grant at the end of first, second, third and fouth year from the date of grant, respectively, with an exercise period ending one year from
the end of last vesting. The vesting conditions include service terms and performance grade of the employees. These options are exercisable at the closing market price
of Company’s shares existing on the date preceding to the date of grant.
Particulars March 31, 2016 March 31, 2015
No. of
Options
Weighted Average
Exercise Price (`)
No. of
Options
Weighted Average
Exercise Price (`)
Outstanding at the beginning of the year 293,000 452 - -
Granted during the year 1,077,500 461 293,000 452
Forfeited during the year 95,000 472 - -
Exercised during the year - - - -
Expired during the year - - - -
Outstanding at the end of the year 1,275,500 461 293,000 452
Exercisable at the end of the year - - - -
Weighted average remaining contractual life (in years) 6.0 6.7
Weighted average fair value of options granted (`) 185 205
Grant VIII
In July 2015, the Company approved the grant to its employees under the existing ESOP Plan 2000. The options under this grant would vest to the employees as 10%,
20%, 30% and 40% of the total grant at the end of first, second, third and fourth year from the date of grant, respectively, with an exercise period ending one year from the
Credibly Capable | Annual Report 2016180
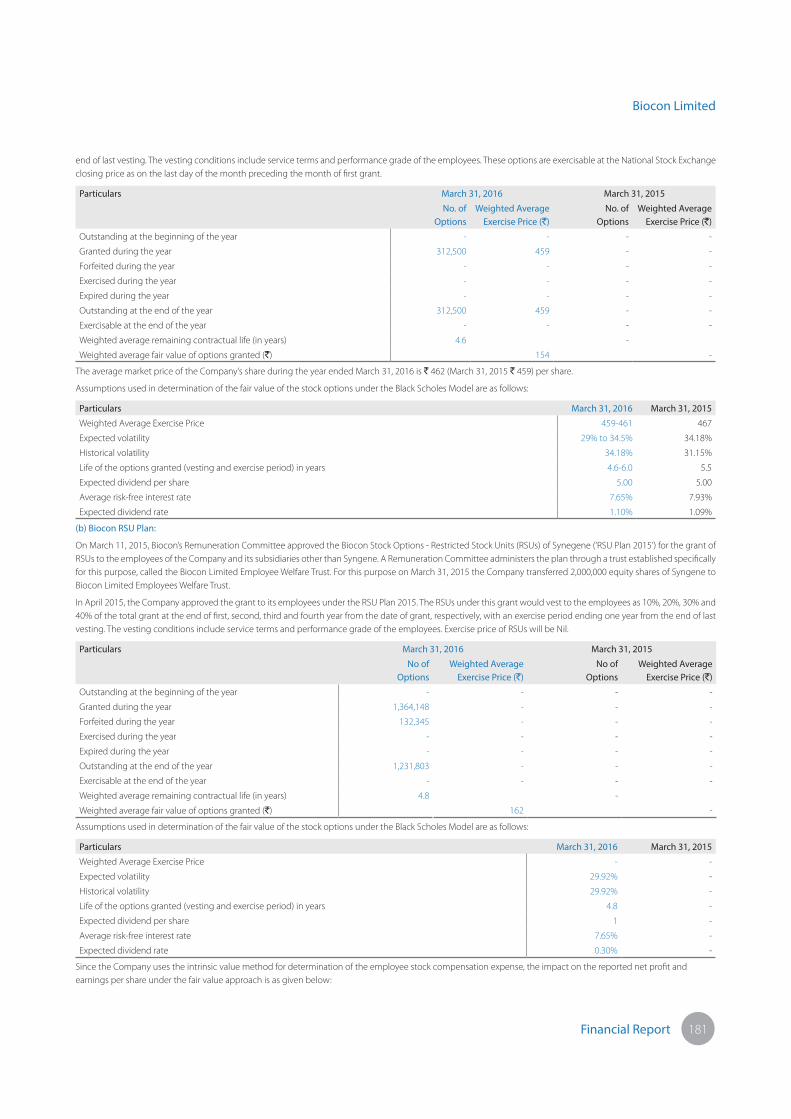
Financial Report
end of last vesting. The vesting conditions include service terms and performance grade of the employees. These options are exercisable at the National Stock Exchange
closing price as on the last day of the month preceding the month of first grant.
Particulars March 31, 2016 March 31, 2015
No. of
Options
Weighted Average
Exercise Price (`)
No. of
Options
Weighted Average
Exercise Price (`)
Outstanding at the beginning of the year - - - -
Granted during the year 312,500 459 - -
Forfeited during the year - - - -
Exercised during the year - - - -
Expired during the year - - - -
Outstanding at the end of the year 312,500 459 - -
Exercisable at the end of the year - - - -
Weighted average remaining contractual life (in years) 4.6 -
Weighted average fair value of options granted (`) 154 -
The average market price of the Company’s share during the year ended March 31, 2016 is ` 462 (March 31, 2015 ` 459) per share.
Assumptions used in determination of the fair value of the stock options under the Black Scholes Model are as follows:
Particulars March 31, 2016 March 31, 2015
Weighted Average Exercise Price 459-461 467
Expected volatility 29% to 34.5% 34.18%
Historical volatility 34.18% 31.15%
Life of the options granted (vesting and exercise period) in years 4.6-6.0 5.5
Expected dividend per share 5.00 5.00
Average risk-free interest rate 7.65% 7.93%
Expected dividend rate 1.10% 1.09%
(b) Biocon RSU Plan:
On March 11, 2015, Biocon’s Remuneration Committee approved the Biocon Stock Options - Restricted Stock Units (RSUs) of Synegene (‘RSU Plan 2015’) for the grant of
RSUs to the employees of the Company and its subsidiaries other than Syngene. A Remuneration Committee administers the plan through a trust established specifically
for this purpose, called the Biocon Limited Employee Welfare Trust. For this purpose on March 31, 2015 the Company transferred 2,000,000 equity shares of Syngene to
Biocon Limited Employees Welfare Trust.
In April 2015, the Company approved the grant to its employees under the RSU Plan 2015. The RSUs under this grant would vest to the employees as 10%, 20%, 30% and
40% of the total grant at the end of first, second, third and fourth year from the date of grant, respectively, with an exercise period ending one year from the end of last
vesting. The vesting conditions include service terms and performance grade of the employees. Exercise price of RSUs will be Nil.
Particulars March 31, 2016 March 31, 2015
No of
Options
Weighted Average
Exercise Price (`)
No of
Options
Weighted Average
Exercise Price (`)
Outstanding at the beginning of the year - - - -
Granted during the year 1,364,148 - - -
Forfeited during the year 132,345 - - -
Exercised during the year - - - -
Expired during the year - - - -
Outstanding at the end of the year 1,231,803 - - -
Exercisable at the end of the year - - - -
Weighted average remaining contractual life (in years) 4.8 -
Weighted average fair value of options granted (`) 162 -
Assumptions used in determination of the fair value of the stock options under the Black Scholes Model are as follows:
Particulars March 31, 2016 March 31, 2015
Weighted Average Exercise Price - -
Expected volatility 29.92% -
Historical volatility 29.92% -
Life of the options granted (vesting and exercise period) in years 4.8 -
Expected dividend per share 1 -
Average risk-free interest rate 7.65% -
Expected dividend rate 0.30% -
Since the Company uses the intrinsic value method for determination of the employee stock compensation expense, the impact on the reported net profit and
earnings per share under the fair value approach is as given below:
Biocon Limited
181
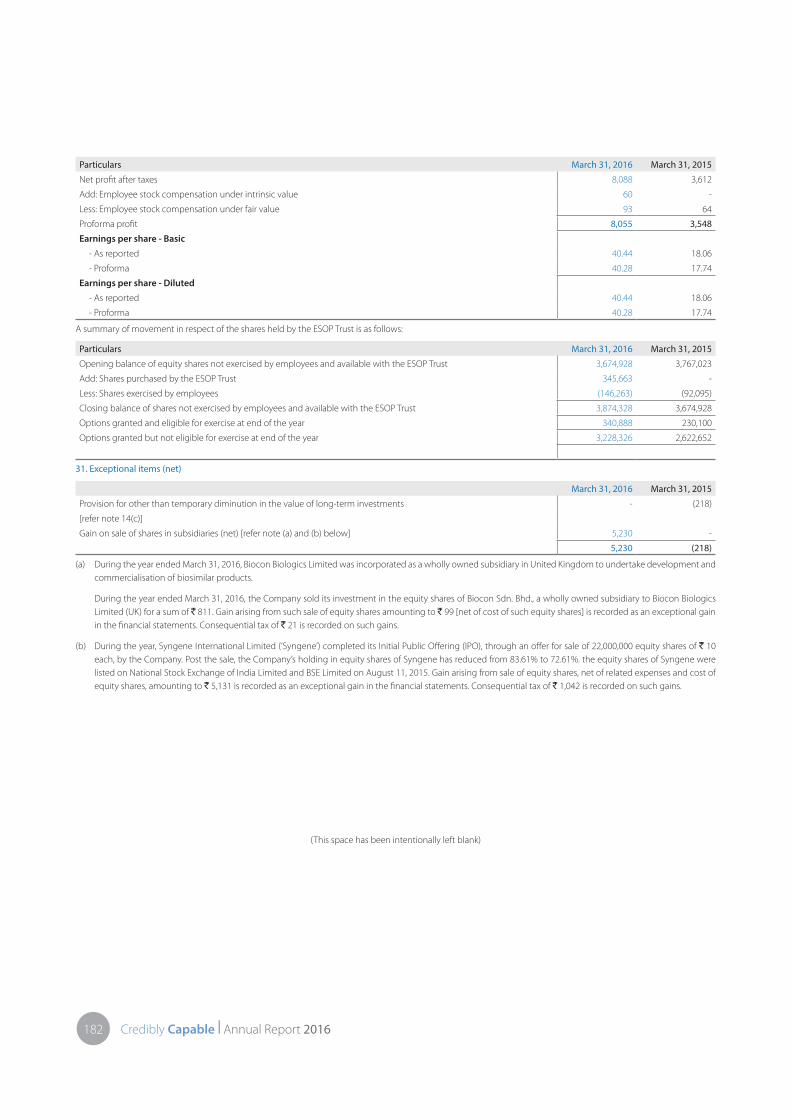
Particulars March 31, 2016 March 31, 2015
Net profit after taxes 8,088 3,612
Add: Employee stock compensation under intrinsic value 60 -
Less: Employee stock compensation under fair value 93 64
Proforma profit 8,055 3,548
Earnings per share - Basic
- As reported 40.44 18.06
- Proforma 40.28 17.74
Earnings per share - Diluted
- As reported 40.44 18.06
- Proforma 40.28 17.74
A summary of movement in respect of the shares held by the ESOP Trust is as follows:
Particulars March 31, 2016 March 31, 2015
Opening balance of equity shares not exercised by employees and available with the ESOP Trust 3,674,928 3,767,023
Add: Shares purchased by the ESOP Trust 345,663 -
Less: Shares exercised by employees (146,263) (92,095)
Closing balance of shares not exercised by employees and available with the ESOP Trust 3,874,328 3,674,928
Options granted and eligible for exercise at end of the year 340,888 230,100
Options granted but not eligible for exercise at end of the year 3,228,326 2,622,652
31. Exceptional items (net)
March 31, 2016 March 31, 2015
Provision for other than temporary diminution in the value of long-term investments - (218)
[refer note 14(c)]
Gain on sale of shares in subsidiaries (net) [refer note (a) and (b) below] 5,230 -
5,230 (218)
(a) During the year ended March 31, 2016, Biocon Biologics Limited was incorporated as a wholly owned subsidiary in United Kingdom to undertake development and
commercialisation of biosimilar products.
During the year ended March 31, 2016, the Company sold its investment in the equity shares of Biocon Sdn. Bhd., a wholly owned subsidiary to Biocon Biologics
Limited (UK) for a sum of ` 811. Gain arising from such sale of equity shares amounting to ` 99 [net of cost of such equity shares] is recorded as an exceptional gain
in the financial statements. Consequential tax of ` 21 is recorded on such gains.
(b) During the year, Syngene International Limited (‘Syngene’) completed its Initial Public Offering (IPO), through an offer for sale of 22,000,000 equity shares of ` 10
each, by the Company. Post the sale, the Company’s holding in equity shares of Syngene has reduced from 83.61% to 72.61%. the equity shares of Syngene were
listed on National Stock Exchange of India Limited and BSE Limited on August 11, 2015. Gain arising from sale of equity shares, net of related expenses and cost of
equity shares, amounting to ` 5,131 is recorded as an exceptional gain in the financial statements. Consequential tax of ` 1,042 is recorded on such gains.
(This space has been intentionally left blank)
Credibly Capable | Annual Report 2016182

Financial Report
32
. Re
late
d p
art
y tr
an
sact
ion
s
Re
late
d p
art
ies
wh
ere
co
ntr
ol e
xis
ts a
nd
re
late
d p
art
ies
wit
h w
ho
m t
ran
sact
ion
s h
av
e t
ak
en
pla
ce d
uri
ng
th
e y
ea
r a
re li
ste
d b
elo
w:
Sl.
No
.
Na
me
of
the
re
late
d
pa
rty
Re
lati
on
ship
De
scri
pti
on
Ap
ril 1
, 20
15
to
Ma
rch
31
, 20
16
Inco
me
/(E
xpe
nse
s)/
Oth
er
tra
nsa
ctio
ns
Bal
ance
as
at
Mar
ch 3
1, 2
01
6
(Pay
able
)/
Re
ceiv
able
Ap
ril 1
, 20
14
to
Ma
rch
31
, 20
15
Inco
me
/(E
xpe
nse
s)/
Oth
er
tra
nsa
ctio
ns
Bal
ance
as
at
Mar
ch 3
1, 2
01
5
(Pay
able
)/
Re
ceiv
able
A.
Re
mu
ne
rati
on
pa
id t
o K
ey
Ma
na
ge
me
nt
Pe
rso
nn
el [
refe
r n
ote
(h
) b
elo
w]
1
Kir
an M
azu
md
ar-S
haw
Ch
airp
ers
on
& M
anag
ing
Dir
ect
or
Sala
ry a
nd
pe
rqu
isit
es
(1
6)
-
(1
6)
-
2
Joh
n S
haw
Vic
e-C
hai
rman
& D
ire
cto
rSa
lary
an
d p
erq
uis
ite
s (
16
) -
(
15
) -
3
Aru
n C
han
dav
arka
rJo
int
Man
agin
g D
ire
cto
r &
CEO
(w.e
.f. A
pri
l 24
, 20
14
)
Sala
ry a
nd
pe
rqu
isit
es
[re
fer
no
te (
i) b
elo
w]
(3
1)
-
(2
7)
-
4
Mu
rali
Kri
shn
an K
NP
resi
de
nt
- G
rou
p F
inan
ce(u
pto
Ju
ly 3
1, 2
01
4)
Sala
ry a
nd
pe
rqu
isit
es
-
-
(2
3)
-
5
Sid
dh
arth
Mit
tal
Pre
sid
en
t -
Fin
ance
(w.e
.f. A
ug
ust
1, 2
01
4)
Sala
ry a
nd
pe
rqu
isit
es
[re
fer
no
te (
i) b
elo
w]
(1
6)
-
(8
) -
6
Kir
an K
um
arC
om
pan
y Se
cre
tary
Sala
ry a
nd
pe
rqu
isit
es
[re
fer
no
te (
i) b
elo
w]
(6
) -
(
6)
-
B.
Oth
ers
7
Syn
ge
ne
Sub
sid
iary
Po
we
r an
d f
acili
ty c
har
ge
s re
cove
red
[re
fer
no
te (d
) b
elo
w]
45
4
-
41
1
-
Re
nt
inco
me
[re
fer
no
te (d
) b
elo
w]
50
-
4
3
-
Div
ide
nd
Inco
me
14
5
-
99
7
-
Exp
en
ses
incu
rre
d o
n b
eh
alf
of
the
re
late
d p
arty
[re
fer
no
te (
a)
be
low
]
58
-
2
2
-
Sale
of
go
od
s 4
-
5
-
Re
sear
ch s
erv
ice
s re
ceiv
ed
(
10
7)
-
(9
9)
-
IPO
exp
en
ses
incu
rre
d o
n b
eh
alf
of
the
Co
mp
any
(4
5)
-
-
-
Oth
er
rece
ivab
les
-
91
-
1
50
Trad
e p
ayab
les
-
(1
6)
-
(3
0)
Gu
aran
tee
giv
en
on
be
hal
f o
f re
late
d p
arty
to
Cu
sto
ms
& E
xcis
e
De
par
tme
nt
(‘CED
’)
-
14
8
-
24
2
Gu
aran
tee
giv
en b
y re
late
d p
arty
to
CED
on
beh
alf o
f th
e C
om
pan
y -
(
50
0)
-
(5
00
)
8
BR
LW
ho
lly o
wn
ed
Su
bsi
dia
ryR
en
t in
com
e [
refe
r n
ote
(d)
be
low
] 3
7
-
34
-
Pow
er
and
fac
ility
ch
arg
es
reco
vere
d [
refe
r n
ote
(d)
be
low
] 6
6
-
77
-
Cro
ss c
har
ge
s to
war
ds
lab
co
nsu
mab
les
and
oth
er
exp
en
ses
67
3
-
58
2
-
Sale
of
go
od
s 4
0
-
6
-
Oth
er
rece
ivab
le -
1
,10
4
-
85
4
Ro
yalt
y e
xpe
nse
(2
7)
-
(1
8)
-
Inte
rest
on
loan
s to
re
late
d p
arti
es
31
6
-
15
7
-
Exp
ense
s in
curr
ed o
n b
ehal
f of t
he
rela
ted
par
ty [r
efer
no
te (a
) bel
ow
] 2
6
-
Loan
s to
re
late
d p
arti
es
[re
fer
no
te (
b)
be
low
] -
1
,45
5
-
2,4
47
Gu
aran
tee
giv
en
by
the
Co
mp
any
to a
ban
k o
n b
eh
alf
of
rela
ted
par
ty lo
an f
acili
ty
-
-
-
68
5
9
Bio
con
SA
Wh
olly
ow
ne
d S
ub
sid
iary
Oth
er
op
era
tin
g in
com
e 5
0
-
60
-
Oth
er
rece
ivab
le -
5
1
-
94
10
B
ioco
n S
dn
.Bh
d.
Sub
sid
iary
of
Bio
con
Bio
log
ics
Lim
ite
d
Exp
en
ses
incu
rre
d o
n b
eh
alf
of
the
re
late
d p
arty
[re
fer
no
te (
a)
be
low
] 1
5
-
29
-
[re
fer
no
te 1
an
d 3
1]
Sale
of
go
od
s 6
9
-
30
-
Trad
e r
ece
ivab
les
-
81
-
3
0
Oth
er
rece
ivab
le -
5
36
-
4
1
Gu
aran
tee
giv
en
by
the
Co
mp
any
to b
anks
on
be
hal
f o
f re
late
d
par
ty lo
an f
acili
ty -
1
0,7
60
-
8
,09
6
11
N
eo
Bio
con
FZ
LLC
Sub
sid
iary
Sale
of
go
od
s 3
5
-
83
-
[re
fer
no
te 1
]D
ivid
en
d In
com
e 3
42
-
-
-
Oth
er
rece
ivab
les
-3
--
Biocon Limited
183

Sl.
No
.
Na
me
of
the
re
late
d
pa
rty
Re
lati
on
ship
De
scri
pti
on
Ap
ril 1
, 20
15
to
Ma
rch
31
, 20
16
Inco
me
/(E
xpe
nse
s)/
Oth
er
tra
nsa
ctio
ns
Bal
ance
as
at
Mar
ch 3
1, 2
01
6
(Pay
able
)/
Re
ceiv
able
Ap
ril 1
, 20
14
to
Ma
rch
31
, 20
15
Inco
me
/(E
xpe
nse
s)/
Oth
er
tra
nsa
ctio
ns
Bal
ance
as
at
Mar
ch 3
1, 2
01
5
(Pay
able
)/
Re
ceiv
able
Trad
e r
ece
ivab
les
-
30
-
29
12
G
len
tec
Inte
rnat
ion
alEn
terp
rise
ow
ne
d b
y ke
y
man
age
me
nt
pe
rso
nn
el
Re
nt
exp
en
ses
pai
d
-
(1
) (
1)
(1
)
13
B
ioco
n P
har
ma
Lim
ite
dW
ho
lly o
wn
ed
Su
bsi
dia
ryIn
vest
me
nt
in e
qu
ity
shar
es
50
-
1
-
Exp
en
ses
incu
rre
d o
n b
eh
alf
of
the
re
late
d p
arty
[re
fer
no
te (
a)
be
low
] 2
1
-
-
-
Inte
rest
on
loan
s to
re
late
d p
arti
es
4
-
-
-
Loan
s to
re
late
d p
arti
es
[re
fer
no
te (c
) b
elo
w]
-
12
9
-
-
Oth
er
rece
ivab
le -
2
4
-
-
Gu
aran
tee
giv
en
by
the
Co
mp
any
to b
anks
on
be
hal
f o
f re
late
d
par
ty lo
an f
acili
ty
-
1,3
62
-
-
14
B
ioco
n B
iolo
gic
s Li
mite
dW
ho
lly o
wn
ed
Su
bsi
dia
ryIn
vest
me
nt
in e
qu
ity
shar
es
4,4
53
-
-
-
Sale
of
no
n-c
urr
en
t in
vest
me
nts
- S
har
es
of
Bio
con
Sd
n. B
hd
[re
fer
no
te (
31
) b
elo
w]
81
1
Sale
of
go
od
s 7
3
-
-
-
Ro
yalt
y e
xpe
nse
(5
) -
-
-
Trad
e r
ece
ivab
les
-
71
-
-
Trad
e p
ayab
les
-
(5
) -
-
15
B
ioco
n F
z LL
CW
ho
lly o
wn
ed
Su
bsi
dia
ryIn
vest
me
nt
in e
qu
ity
shar
es
3
-
-
-
Sale
of
go
od
s 1
-
-
-
Trad
e r
ece
ivab
les
-
1
-
-
16
B
ioco
n A
cad
em
yW
ho
lly o
wn
ed
Su
bsi
dia
ryC
SR E
xpe
nd
itu
re (
29
) -
(
25
) -
17
B
ioco
n F
ou
nd
atio
nTr
ust
in
wh
ich
key
man
agem
ent
per
son
nel
are
th
e B
oar
d o
f Tru
stee
s
CSR
Exp
en
dit
ure
(5
2)
-
(4
6)
-
18
B
ioco
n E
mp
loye
es
We
lfare
Tru
st in
wh
ich
ke
y m
anag
em
en
t Sa
le o
f n
on
-cu
rre
nt
inve
stm
en
ts -
Sh
are
s o
f Sy
ng
en
e -
-
1
-
Tru
stp
ers
on
ne
l w
ere
th
e
Bo
ard
o
f
Tru
ste
es
(up
to J
uly
23
, 20
15
)
Oth
er
rece
ivab
les
-
1
-
1
19
N
aray
ana
Hru
day
alay
a
Lim
ite
d (
form
erl
y
kno
wn
as
Nar
ayan
a
Hru
day
alay
a P
riva
te
Lim
ite
d)
Ente
rpri
se in
wh
ich
a d
ire
cto
r
of
the
Co
mp
any
is a
me
mb
er
of
bo
ard
of
dir
ect
ors
Sale
of
go
od
s 5
1
-
14
-
Trad
e r
ece
ivab
les
-
8
-
5
(a)
Exp
en
ses
incu
rre
d o
n b
eh
alf
of
the
re
late
d p
arty
incl
ud
e r
ech
arg
e o
f so
ftw
are
lice
nse
fee
s an
d a
mo
un
t p
aid
on
be
hal
f to
ve
nd
ors
.
(b)
The
Co
mp
any
has
gra
nte
d a
n u
nse
cure
d lo
an f
acili
ty t
o B
RL
at t
he
inte
rest
rat
e p
reva
ilin
g f
or
Go
vern
me
nt
secu
riti
es,
to
su
pp
ort
its
op
era
tio
ns.
Th
e s
aid
loan
is r
ep
ayab
le b
y M
arch
, 20
20
. Du
rin
g t
he
ye
ar, `
1,8
00
(M
arch
31
, 20
15
: ` 2
,36
7)
was
giv
en
as
loan
. Oth
er
rece
ivab
les
(incl
ud
ing
inte
rest
re
ceiv
able
s) o
f ` 8
64
we
re c
on
vert
ed
to
loan
s as
at
Mar
ch 3
1, 2
01
6 (
Mar
ch 3
1, 2
01
5: `
2,3
53
) u
nd
er
the
afo
resa
id fa
cilit
y. D
uri
ng
th
e
year
en
de
d M
arch
31
, 20
16
, BR
L h
as r
ep
aid
loan
am
ou
nti
ng
to
` 3
,65
7 (
Mar
ch 3
1, 2
01
5: `
3,9
17
).
(c)
The
Co
mp
any
has
gra
nte
d a
n u
nse
cure
d lo
an f
acili
ty t
o B
PL
at t
he
inte
rest
rat
e p
reva
ilin
g fo
r G
ove
rnm
en
t se
curi
tie
s, t
o m
ee
t it
s ca
pe
x an
d w
ork
ing
cap
ital
re
qu
ire
me
nt.
Th
e s
aid
loan
is r
ep
ayab
le b
y M
arch
, 20
25
.
Du
rin
g t
he
ye
ar, `
17
9 (
Mar
ch 3
1, 2
01
5: `
Nil)
was
giv
en
as
loan
. Du
rin
g t
he
ye
ar e
nd
ed
Mar
ch 3
1, 2
01
6, B
PL
has
re
pai
d lo
an a
mo
un
tin
g t
o `
50
(M
arch
31
, 20
15
: ` N
il).
(d)
The
Co
mp
any’
s SE
Z D
eve
lop
er
div
isio
n h
as e
nte
red
into
ag
ree
me
nts
to
leas
e la
nd
an
d p
rovi
de
ce
rtai
n fa
cilit
ies
such
as
po
we
r, u
tilit
ies
etc
. to
SEZ
un
its
of B
RL
and
Syn
ge
ne,
in re
spe
ct o
f wh
ich
th
e C
om
pan
y re
cove
rs
ren
t an
d f
acili
tie
s u
sag
e c
har
ge
s.
(e)
The
Co
mp
any
has
pai
d re
nt
to P
K A
sso
ciat
es a
nd
pu
rch
ased
co
nsu
mab
les
fro
m M
azu
md
ar F
arm
s, a
pro
pri
etar
y fir
m o
f rel
ativ
e o
f Dire
cto
r wh
ich
are
no
t d
iscl
ose
d a
bo
ve s
ince
th
e am
ou
nts
are
rou
nd
ed o
ff t
o `
1 m
illio
n.
(f)
Du
rin
g t
he
ye
ar, t
he
re is
no
tra
nsa
ctio
n w
ith
Bio
con
Ind
ia L
imit
ed
Em
plo
yee
s W
elfa
re T
rust
(tr
ust
in w
hic
h k
ey
man
age
me
nt
pe
rso
nn
el w
ere
th
e B
oar
d o
f Tru
ste
es)
an
d B
ioco
n P
har
ma
Inc.
(a
sub
sid
iary
of
Bio
con
Ph
arm
a Li
mit
ed
).
(g)
The
ab
ove
dis
clo
sure
s in
clu
de
re
late
d p
arti
es
as p
er
Acc
ou
nti
ng
Sta
nd
ard
18
on
“Re
late
d P
arty
Dis
clo
sure
s” a
nd
Co
mp
anie
s A
ct, 2
01
3.
(h)
The
re
mu
ne
rati
on
to
ke
y m
anag
em
en
t p
ers
on
ne
l do
esn
’t in
clu
de
th
e p
rovi
sio
ns
mad
e fo
r g
ratu
ity
and
leav
e b
en
efi
ts, a
s th
ey
are
ob
tain
ed
on
an
act
uar
ial b
asis
for
the
Co
mp
any
as a
wh
ole
.
(i)Em
plo
yee
Sto
ck c
om
pe
nsa
tio
n e
xpe
nse
allo
cab
le t
o k
ey
man
age
me
nt
pe
rso
nn
el p
ert
ain
ing
to
th
e R
SU p
lan
is `
10
(M
arch
31
, 20
15
- N
il) w
hic
h is
no
t in
clu
de
d in
th
e r
em
un
era
tio
n d
iscl
ose
d a
bo
ve.
Credibly Capable | Annual Report 2016184

Financial Report
March 31, 2016 March 31, 2015
33. Supplementary data
(a) Value of imports calculated on C.I.F. basis (on accrual basis):
Raw materials 5,561 5,337
Packing materials 443 332
Traded goods 135 293
Maintenance spares 61 5
Capital goods 905 135
7,105 6,102
(b) Earnings in foreign currency (on accrual basis):*
Export of goods on FOB basis 10,717 10,339
Licensing and development fees 223 283
Capacity reservation fees - 311
Other operating revenue 507 60
Dividend income on investment in subsidiaries 342 -
11,789 10,993
* Excludes recovery of product research & development costs from co-development partners
(c) Expenditure in foreign currency (on accrual basis):
Royalty 29 23
Commission and brokerage 161 113
Interest expense 5 3
Travelling and conveyance 20 26
Professional charges 117 220
Lab consumables 217 293
Research & development expenses 287 258
Others 242 121
1,078 1,057
March 31, 2016 March 31, 2015
(d) Net dividend remitted in foreign exchange:
Year to which it relates 2015-16 2014-15 2013-14
Number of non-resident shareholders 15 15 15
Number of equity shares held on which dividend was due 42,039,218 42,039,218 42,397,675
Dividend remitted 210 210 212
Dividend remitted in FC
USD million 3 3 3
(e) Details of consumption of raw materials, packing materials and spare parts:
March 31, 2016 March 31, 2015
Value Percent Value Percent
(i) Raw materials and packing materials
Imported 5,955 63 5,848 61
Indigenous 3,523 37 3,717 39
9,478 100 9,565 100
(ii) Spare parts
Imported 61 28 5 3
Indigenous 153 72 174 97
214 100 179 100
Biocon Limited
185

34. Foreign exchange forward contracts and unhedged foreign currency exposures
The Company has entered into foreign exchange forward and option contracts to hedge highly probable forecasted transactions in foreign currency. As at March 31,
2016 and 2015, the Company had the following outstanding Contracts:
(in million)
March 31, 2016 March 31, 2015
In respect of foreign currency loans taken:
Foreign exchange forward contracts to buy USD 25 -
(INR 1,656) -
In respect of highly probable forecasted sales/export collection:
European style option contracts with periodical maturity dates USD 59 USD 55
(INR 3,903) (INR 3,425)
European style option contracts with periodical maturity dates EUR 12 EUR 10
(INR 899) (INR 669)
The unhedged foreign currency exposure as at the Balance Sheet date is as given below:
Export trade receivables 1,932 2,150
Other receivables 600 146
Unbilled revenue - 108
Cash and bank balances 2,378 1,920
Import trade payable 1,170 896
Packing credit foreign currency loan 597 561
Term loan 1,326 -
Advance from customers 47 23
Interest rate swap
During the year ended March 31, 2016, Biocon Limited has entered into floating to fixed interest rate swap to hedge the interest rate exposure on USD 20 million term
loan facility. The aggregate amount of loans covered under the said interest rate swap as at March 31, 2016 is ` 1,326 (USD 20 million) [March 31, 2015 - ` Nil (USD Nil)].
The periodic net payments related to interest rate swap to the extent of underlying borrowings is recorded as interest expenses.
March 31, 2016 March 31, 2015
35. Contingent liabilities and commitments
(i) Contingent liabilities:
(a) Claims against the Company not acknowledged as debt 3,041 1,241
The above includes:
(i) Direct taxation (matters pertaining to disputes on tax holiday benefits, transfer pricing and disallowance of certain
expenses claimed by the Company)
2,050 297
(ii) Indirect taxation (includes matters pertaining to disputes on central excise, customs duty and service tax) 594 552
(iii) Other litigations 397 392
The Company is involved in taxation and other disputes, lawsuits, proceedings etc. including patent and commercial matters that arise from time to time in the
ordinary course of business. Also refer note 12(b). Management is of the view that above claims are not tenable and will not have any material adverse effect on the
Company’s financial position and results of operations.
March 31, 2016 March 31, 2015
(b) Guarantees
(i) Corporate guarantees given in favour of the Central Excise Department (‘CED’) in respect of certain
performance obligations of the subsidiaries.
Syngene 148 242
(ii) Corporate guarantee given by Syngene in favour of the CED in respect of certain performance 500 500
obligations of Biocon.
(iii) Corporate guarantees given in favour of banks towards loans obtained by subsidiaries/ step-down subsidiaries
BRL - 685
Biocon Malaysia 10,760 8,096
Biocon Pharma Limited 1,362 -
Total 12,122 8,781
(iv) Guarantees given by banks on behalf of the Company for contractual obligations of the Company.
The necessary terms and conditions have been complied with and no liabilities have arisen. 18 63
(ii) Commitments:
(a) Estimated amount of contracts remaining to be executed on capital
account and not provided for, net of advances 1,114 824
Credibly Capable | Annual Report 2016186

Financial Report
March 31, 2016 March 31, 2015
(b) Operating lease commitments
Where the Company is a lessee:
(i) Rent
The Company has entered into various agreements for lease of building/ office space which expires over a period upto March
2022. Some of these lease arrangements have price escalation clause. There are no restrictions imposed under the lease
arrangements. Gross rental expenses for the year aggregate to ` 17 (March 31, 2015 - ` 18).
The committed lease rentals in future are as follows:
Not later than one year 17 17
Later than one year and not later than five years 45 40
Later than five years 3 7
(ii) Vehicles
The Company has taken vehicles for certain employees under operating leases, which expire over a period upto January,
2020. Gross rental expenses for the year aggregate to ` 16 (March 31, 2015 - ` 10).
The committed lease rentals in future are as follows:
Not later than one year 15 12
Later than one year and not later than five years 26 24
Where the Company is a lessor:
(i) Rent
The Company has leased out certain parts of its land & building (including fit outs), which expire over a period upto 2025.
Gross rental income for the year aggregates to ` 107 (March 31, 2015 - ` 97). Further, minimum lease receipts under
operating lease are as follows:
Not later than one year 111 106
Later than one year and not later than five years 352 308
Later than five years 147 119
Considering that the leased assets comprise of portion of factory buildings located within the Company’s factory premises, disclosure with regard to gross value of
leased assets, accumulated depreciation and net book value of the same is not feasible.
(c) Other Commitments:
As at March 31, 2016 and 2015, the Company has committed to provide financial support to BRL with regard to the operations of such company. Also refer note 14 (a).
(This space has been intentionally left blank)
Biocon Limited
187
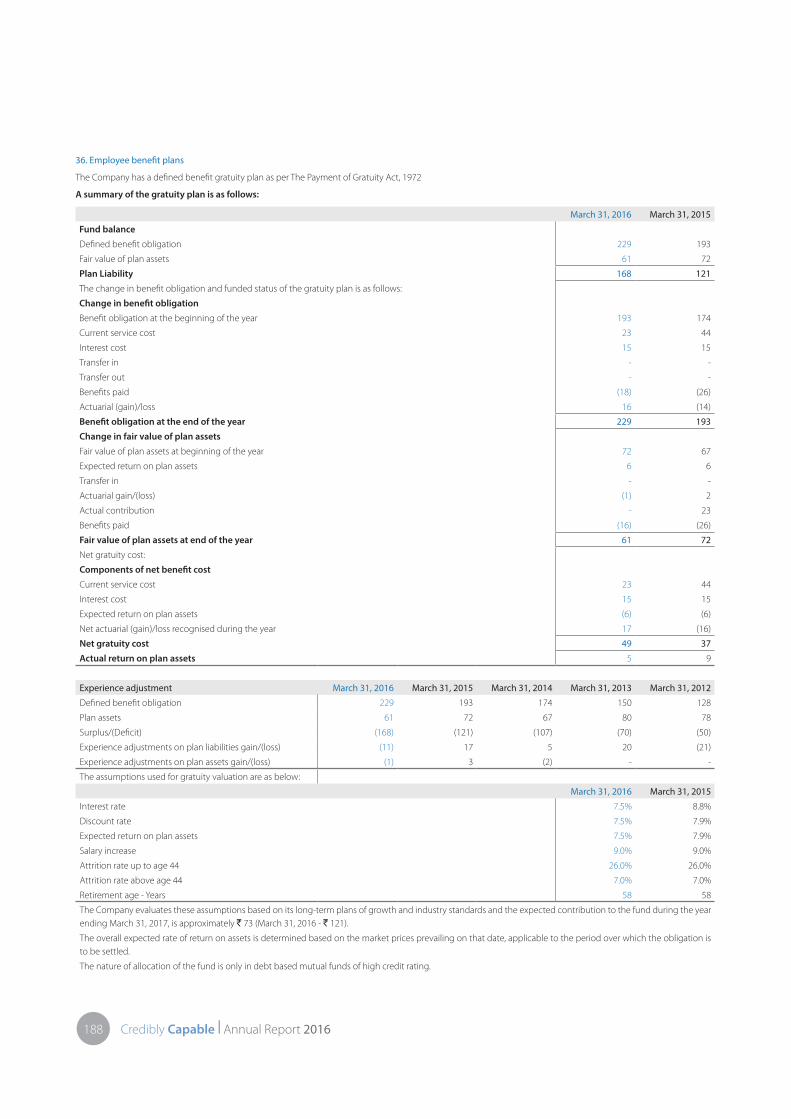
36. Employee bene!t plans
The Company has a defined benefit gratuity plan as per The Payment of Gratuity Act, 1972
A summary of the gratuity plan is as follows:
March 31, 2016 March 31, 2015
Fund balance
Defined benefit obligation 229 193
Fair value of plan assets 61 72
Plan Liability 168 121
The change in benefit obligation and funded status of the gratuity plan is as follows:
Change in bene!t obligation
Benefit obligation at the beginning of the year 193 174
Current service cost 23 44
Interest cost 15 15
Transfer in - -
Transfer out - -
Benefits paid (18) (26)
Actuarial (gain)/loss 16 (14)
Bene!t obligation at the end of the year 229 193
Change in fair value of plan assets
Fair value of plan assets at beginning of the year 72 67
Expected return on plan assets 6 6
Transfer in - -
Actuarial gain/(loss) (1) 2
Actual contribution - 23
Benefits paid (16) (26)
Fair value of plan assets at end of the year 61 72
Net gratuity cost:
Components of net bene!t cost
Current service cost 23 44
Interest cost 15 15
Expected return on plan assets (6) (6)
Net actuarial (gain)/loss recognised during the year 17 (16)
Net gratuity cost 49 37
Actual return on plan assets 5 9
Experience adjustment March 31, 2016 March 31, 2015 March 31, 2014 March 31, 2013 March 31, 2012
Defined benefit obligation 229 193 174 150 128
Plan assets 61 72 67 80 78
Surplus/(Deficit) (168) (121) (107) (70) (50)
Experience adjustments on plan liabilities gain/(loss) (11) 17 5 20 (21)
Experience adjustments on plan assets gain/(loss) (1) 3 (2) - -
The assumptions used for gratuity valuation are as below:
March 31, 2016 March 31, 2015
Interest rate 7.5% 8.8%
Discount rate 7.5% 7.9%
Expected return on plan assets 7.5% 7.9%
Salary increase 9.0% 9.0%
Attrition rate up to age 44 26.0% 26.0%
Attrition rate above age 44 7.0% 7.0%
Retirement age - Years 58 58
The Company evaluates these assumptions based on its long-term plans of growth and industry standards and the expected contribution to the fund during the year
ending March 31, 2017, is approximately ` 73 (March 31, 2016 - ` 121).
The overall expected rate of return on assets is determined based on the market prices prevailing on that date, applicable to the period over which the obligation is
to be settled.
The nature of allocation of the fund is only in debt based mutual funds of high credit rating.
Credibly Capable | Annual Report 2016188

Financial Report
37. Segmental information
In accordance with Accounting Standard 17 - Segment Reporting, segment information has been provided in the consolidated financial statements of the Company and
therefore no separate disclosure on segment information is given in these standalone financial statements.
38. Other notes
(a) The Company had entered into transactions of sale of products to a private company during the year ended March 31, 2013 and 2012 amounting to ` 28 and ` 17
respectively that required prior approval from Central Government under Section 297 of the Companies Act, 1956. These transactions, entered into at prevailing
market prices were approved by the Board of Directors of the Company. During the year ended March 31, 2014, the Company had filed application with the Central
Government for approval of such transactions and for compounding of such non-compliance and same is pending with Central Government as at March 31, 2016.
(b) Recovery of product development costs from co-development partner (net) pertains to co-development partner’s share of expenses under the development
agreements comprising of payroll costs, depreciation and amortisation and other expenses.
(c) The Company has paid the dividend distribution tax of ` 107 (March 31, 2015: ` 30) on interim dividend, after reducing the amount of dividend received by the
Company from its subsidiaries.
39. Corporate Social Responsibility
As per Section 135 of the Companies Act, 2013, a company, meeting the applicability threshold, needs to spend at least 2% of its average net profit for the immediately
preceding three financial years on corporate social responsibility (CSR) activities.
(a) Gross amount required to be spent by the company during the year is ` 81; and
(b) Amount spent during the year on:
Sl.
No.
Particulars In Cash Yet to be paid
in cash
Total
(i) Construction/ acquisition of any asset - - -
(ii) On purposes other than (i) above 81 - 81
40. Prior years’ comparatives
The Company has reclassified and regrouped the previous year figures to conform to current year’s classification.
As per our report of even date
For S.R. Batliboi & Associates LLP For and on behalf of the Board of Directors of Biocon Limited
ICAI Firm registration no.: 101049W
Chartered Accountants
per Aditya Vikram Bhauwala Kiran Mazumdar-Shaw Arun Chandavarkar
Partner Managing Director Joint Managing Director & CEO
Membership no.: 208382 DIN: 00347229 DIN: 01596180
Siddharth Mittal Kiran Kumar
President - Finance & Chief Financial Officer Company Secretary
M No. A14594
Bengaluru Bengaluru
April 26, 2016 April 26, 2016
(This space has been intentionally left blank)
Biocon Limited
189
Independent Auditor’s ReportTo the Members of Biocon Limited
Report on the Consolidated Financial Statements
We have audited the accompanying consolidated financial statements of Biocon Limited (the “Holding Company”) and its subsidiaries and its associate (together,
the “Group”) which comprise of the consolidated Balance Sheet as at March 31, 2016, the consolidated Statement of Profit and Loss and the consolidated Cash Flow
Statement for the year then ended, and a summary of significant accounting policies and other explanatory information (the ‘consolidated financial statements’).
Management’s responsibility for the Consolidated Financial Statements
The Holding Company’s Board of Directors is responsible for the preparation of these consolidated financial statements in terms with the requirement of the Companies
Act, 2013 (“the Act”) that give a true and fair view of the consolidated financial position, consolidated financial performance and consolidated cash flows of the Group
in accordance with accounting principles generally accepted in India, including the Accounting Standards specified under Section 133 of the Act, read with Rule 7 of
the Companies (Accounts) Rules, 2014. The respective Board of Directors of the companies included in the Group and of its associate are responsible for maintenance
of adequate accounting records in accordance with the provisions of the Act for safeguarding of the assets of the Group and for preventing and detecting frauds and
other irregularities; the selection and application of appropriate accounting policies; making judgments and estimates that are reasonable and prudent; and the design,
implementation and maintenance of adequate internal financial control that were operating effectively for ensuring the accuracy and completeness of the accounting
records, relevant to the preparation and presentation of the financial statements that give a true and fair view and are free from material misstatement, whether due
to fraud or error, which have been used for the purpose of preparation of the consolidated financial statements by the Directors of the Holding Company, as aforesaid.
Auditor’s Responsibility
Our responsibility is to express an opinion on these consolidated financial statements based on our audit. While conducting the audit, we have taken into account the
provisions of the Act, the accounting and auditing standards and matters which are required to be included in the audit report under the provisions of the Act and the
Rules made thereunder. We conducted our audit in accordance with the Standards on Auditing, issued by the Institute of Chartered Accountants of India, as specified
under Section 143(10) of the Act. Those Standards require that we comply with ethical requirements and plan and perform the audit to obtain reasonable assurance
about whether the financial statements are free from material misstatement.
An audit involves performing procedures to obtain audit evidence about the amounts and disclosures in the consolidated financial statements. The procedures selected
depend on the auditor’s judgment, including the assessment of the risks of material misstatement of the consolidated financial statements, whether due to fraud or error.
In making those risk assessments, the auditor considers internal financial control relevant to the Holding Company’s preparation of the consolidated financial statements
that give a true and fair view in order to design audit procedures that are appropriate in the circumstances. An audit also includes evaluating the appropriateness of
accounting policies used and the reasonableness of the accounting estimates made by the Holding Company’s Board of Directors, as well as evaluating the overall
presentation of the consolidated financial statements. We believe that the audit evidence obtained by us and the audit evidence obtained by the other auditors in terms
of their reports referred to in Other Matter paragraph below, is sufficient and appropriate to provide a basis for our audit opinion on the consolidated financial statements.
Opinion
In our opinion and to the best of our information and according to the explanations given to us and based on the consideration of the reports of the other auditors on
the financial statements of the subsidiaries as noted below, the consolidated financial statements give the information required by the Act in the manner so required and
give a true and fair view in conformity with the accounting principles generally accepted in India of the consolidated state of affairs of the Group as at March 31, 2016,
its consolidated profit, and its consolidated cash flows for the year ended on that date.
Emphasis of Matter
We draw attention to note 42 in the consolidated financial statements regarding management’s decision to defer recognition of amounts in the consolidated statement
of profit and loss, pertaining to payments received in earlier years pursuant to termination of a customer contract for reasons as more fully discussed in the aforesaid note.
As further discussed in the said note, out of the deferred amount, ` 152 million has been netted off against expenses incurred during the year ended March 31, 2016
towards clinical trial and development activities and the remaining balance of ` 2,684 million has been recognized as income during the year ended March 31, 2016. Our
auditor’s report for the year ended March 31, 2015 also included a matter of emphasis in this regard. Our opinion is not qualified in respect of this matter.
Report on Other Legal and Regulatory Requirements
As required by section 143 (3) of the Act, we report, to the extent applicable, that:
(a) We/the other auditors whose reports we have relied upon, have sought and obtained all the information and explanations which to the best of our knowledge and
belief were necessary for the purpose of our audit of the aforesaid consolidated financial statements;
(b) In our opinion proper books of account as required by law relating to preparation of the aforesaid consolidation of the financial statements have been kept so far
as it appears from our examination of those books and reports of the other auditors;
(c) The consolidated Balance Sheet, consolidated Statement of Profit and Loss, and consolidated Cash Flow Statement dealt with by this Report are in agreement with
the books of account;
(d) In our opinion, the aforesaid consolidated financial statements comply with the Accounting Standards specified under section 133 of the Act, read with Rule 7 of
the Companies (Accounts) Rules, 2014;
(e) On the basis of the written representations received from the directors of the Holding Company as on March 31, 2016 taken on record by the Board of Directors of
the Holding Company and the reports of the auditors who are appointed under Section 139 of the Act, of its subsidiary companies, incorporated in India, none of
the directors of the Group’s companies incorporated in India is disqualified as on March 31, 2016 from being appointed as a director in terms of Section 164 (2) of
the Act;
(f ) With respect to the adequacy and the operating effectiveness of the internal financial controls over financial reporting of the Holding Company and its subsidiary
companies incorporated in India, refer to our separate report in Annexure 1 to this report;
Credibly Capable | Annual Report 2016190

Financial Report
(g) With respect to the other matters to be included in the Auditor’s Report in accordance with Rule 11 of the Companies (Audit and Auditors) Rules, 2014, in our
opinion and to the best of our information and according to the explanations given to us:
i. The consolidated financial statements disclose the impact of pending litigations on its consolidated financial position of the Group. Refer Note 36 to the
consolidated financial statements;
ii. The Group did not have any material foreseeable losses in long-term contracts including derivative contracts;
iii. There has been no delay in transferring amounts, required to be transferred, to the Investor Education and Protection Fund by the Holding Company and its
subsidiary companies incorporated in India.
Other Matter
The accompanying consolidated financial statements include total assets of ` 20,646 million as at March 31, 2016, total revenues (including other income) of ` 1,563
million and net cash inflows of `276 million for the year ended on that date, in respect of four subsidiaries, which have been audited by other auditors, which financial
statements, other financial information and auditor’s reports have been furnished to us by the management. Our opinion on the consolidated financial statements, in so
far as it relates to the amounts and disclosures included in respect of these subsidiaries, and our report in terms of sub-sections (3) and (11) of Section 143 of the Act, in
so far as it relates to the aforesaid subsidiaries, is based solely on the reports of such other auditors.
Our opinion on the consolidated financial statements, and our report on Other Legal and Regulatory Requirements above, is not modified in respect of the above matter
with respect to our reliance on the work done and the reports of the other auditors.
For S.R. Batliboi & Associates LLP
Chartered Accountants
ICAI Firm registration number: 101049W
per Aditya Vikram Bhauwala
Partner
Membership No.: 208382
Place: Bengaluru
Date: April 26, 2016
(This space has been intentionally left blank)
Biocon Limited & Subsidiaries
191
Annexure 1 to the Independent Auditor’s Report of even date on the Consolidated Financial Statements of Biocon LimitedReport on the Internal Financial Controls under Clause (i) of Sub-section 3 of Section 143 of the Companies Act, 2013 (“the Act”)
In conjunction with our audit of the consolidated financial statements of Biocon Limited as of and for the year ended March 31, 2016, we have audited the internal
financial controls over financial reporting of Biocon Limited (hereinafter referred to as the “Holding Company”) and its subsidiary companies, which are companies
incorporated in India, as of that date.
Management’s Responsibility for Internal Financial Controls
The respective Board of Directors of the Holding Company and its subsidiary companies, which are companies incorporated in India, are responsible for establishing
and maintaining internal financial controls based on the internal control over financial reporting criteria established by the Holding Company considering the essential
components of internal control stated in the Guidance Note on Audit of Internal Financial Controls Over Financial Reporting issued by the Institute of Chartered
Accountants of India. These responsibilities include the design, implementation and maintenance of adequate internal financial controls that were operating effectively
for ensuring the orderly and efficient conduct of its business, including adherence to the respective company’s policies, the safeguarding of its assets, the prevention
and detection of frauds and errors, the accuracy and completeness of the accounting records, and the timely preparation of reliable financial information, as required
under the Act.
Auditor’s Responsibility
Our responsibility is to express an opinion on the company’s internal financial controls over financial reporting based on our audit. We conducted our audit in accordance
with the Guidance Note on Audit of Internal Financial Controls Over Financial Reporting (the “Guidance Note”) and the Standards on Auditing, both, issued by Institute of
Chartered Accountants of India, and deemed to be prescribed under section 143(10) of the Act, to the extent applicable to an audit of internal financial controls. Those
Standards and the Guidance Note require that we comply with ethical requirements and plan and perform the audit to obtain reasonable assurance about whether
adequate internal financial controls over financial reporting was established and maintained and if such controls operated effectively in all material respects.
Our audit involves performing procedures to obtain audit evidence about the adequacy of the internal financial controls system over financial reporting and their
operating effectiveness. Our audit of internal financial controls over financial reporting included obtaining an understanding of internal financial controls over financial
reporting, assessing the risk that a material weakness exists, and testing and evaluating the design and operating effectiveness of internal control based on the assessed
risk. The procedures selected depend on the auditor’s judgement, including the assessment of the risks of material misstatement of the financial statements, whether
due to fraud or error.
We believe that the audit evidence we have obtained and the audit evidence obtained by the other auditors in terms of their report referred to in the Other Matter
paragraph below, is sufficient and appropriate to provide a basis for our audit opinion on the internal financial controls system over financial reporting.
Meaning of Internal Financial Controls Over Financial Reporting
A company’s internal financial control over financial reporting is a process designed to provide reasonable assurance regarding the reliability of financial reporting
and the preparation of financial statements for external purposes in accordance with generally accepted accounting principles. A company’s internal financial control
over financial reporting includes those policies and procedures that (1) pertain to the maintenance of records that, in reasonable detail, accurately and fairly reflect
the transactions and dispositions of the assets of the company; (2) provide reasonable assurance that transactions are recorded as necessary to permit preparation
of financial statements in accordance with generally accepted accounting principles, and that receipts and expenditures of the company are being made only in
accordance with authorisations of management and directors of the company; and (3) provide reasonable assurance regarding prevention or timely detection of
unauthorised acquisition, use, or disposition of the company’s assets that could have a material effect on the financial statements.
Inherent Limitations of Internal Financial Controls Over Financial Reporting
Because of the inherent limitations of internal financial controls over financial reporting, including the possibility of collusion or improper management override of
controls, material misstatements due to error or fraud may occur and not be detected. Also, projections of any evaluation of the internal financial controls over financial
reporting to future periods are subject to the risk that the internal financial control over financial reporting may become inadequate because of changes in conditions,
or that the degree of compliance with the policies or procedures may deteriorate.
Opinion
In our opinion, the Holding Company and its subsidiary companies which are companies incorporated in India, have, maintained in all material respects, an adequate
internal financial controls system over financial reporting and such internal financial controls over financial reporting were operating effectively as at March 31, 2016,
based on the internal control over financial reporting criteria established by the Holding Company considering the essential components of internal control stated in the
Guidance Note on Audit of Internal Financial Controls Over Financial Reporting issued by the Institute of Chartered Accountants of India.
Credibly Capable | Annual Report 2016192

Financial Report
Other Matter
Our report under Section 143(3)(i) of the Act on the adequacy and operating effectiveness of the internal financial controls over financial reporting of the Holding
Company and its subsidiary companies in India, insofar as it relates to a subsidiary company, which is a company incorporated in India, is based on the corresponding
report of the other auditors of such subsidiary incorporated in India.
We also have audited, in accordance with the Standards on Auditing issued by the Institute of Chartered Accountants of India as specified under section 143(10) of
the Act, the consolidated financial statements of the Holding Company, which comprise the Consolidated Balance Sheet as at March 31, 2016, and the Consolidated
Statement of Profit and Loss and Consolidated Cash Flow Statement for the year then ended, and a summary of significant accounting policies and other explanatory
information, and our report dated April 26, 2016 expressed an unqualified opinion thereon.
For S.R. Batliboi & Associates LLP
Chartered Accountants
ICAI Firm registration number: 101049W
per Aditya Vikram Bhauwala
Partner
Membership No.: 208382
Place: Bengaluru
Date: April 26, 2016
Biocon Limited & Subsidiaries
193

The accompanying notes are an integral part of the financial statements.
As per our report of even date
For S.R. Batliboi & Associates LLP For and on behalf of the Board of Directors of Biocon Limited
Chartered Accountants
ICAI Firm registration no.: 101049W
per Aditya Vikram Bhauwala Kiran Mazumdar-Shaw Arun Chandavarkar
Partner Managing Director Joint Managing Director & CEO
Membership no.: 208382 DIN: 00347229 DIN: 01596180
Siddharth Mittal Kiran Kumar
President - Finance & Chief Financial Officer Company Secretary
M No. A14594
Bengaluru Bengaluru
April 26, 2016 April 26, 2016
Consolidated Balance Sheet as at March 31, 2016
(All amounts in Indian Rupees Million)
Notes March 31, 2016 March 31, 2015
EQUITY AND LIABILITIES
Shareholders’ funds
Share capital 3 1,000 1,000
Reserves and surplus 4 39,556 31,706
40,556 32,706
Minority interest 5 3,112 1,722
Non-current liabilities
Long-term borrowings 6 20,724 7,696
Deferred tax liability (net) 7 346 417
Other long-term liabilities 8 3,503 5,516
Long-term provisions 9 299 150
24,872 13,779
Current liabilities
Short-term borrowings 10 3,949 2,610
Trade payables 11
Total outstanding dues of micro and small enterprises 117 85
Total outstanding dues of creditors other than micro and small enterprises 5,354 4,208
Other current liabilities 12 5,979 7,062
Short-term provisions 9 877 1,582
16,276 15,547
TOTAL 84,816 63,754
ASSETS
Non-current assets
Fixed assets
Tangible assets 13 16,539 15,807
Intangible assets 14 687 492
Capital work-in-progress 19,989 14,938
Intangible assets under development 14 1,886 1,828
Non-current investments 15 - -
Loans and advances 16 4,123 3,693
Other non-current assets 17 1,660 1,370
44,884 38,128
Current assets
Current investments 18 4,285 2,303
Inventories 19 5,114 4,527
Trade receivables 20 8,229 7,705
Cash and bank balances 21 19,213 9,375
Loans and advances 16 1,853 758
Other current assets 17 1,238 958
39,932 25,626
TOTAL 84,816 63,754
Summary of significant accounting policies 2.1
Credibly Capable | Annual Report 2016194

Financial Report
The accompanying notes are an integral part of the financial statements.
As per our report of even date
For S.R. Batliboi & Associates LLP For and on behalf of the Board of Directors of Biocon Limited
Chartered Accountants
ICAI Firm registration no.: 101049W
per Aditya Vikram Bhauwala Kiran Mazumdar-Shaw Arun Chandavarkar
Partner Managing Director Joint Managing Director & CEO
Membership no.: 208382 DIN: 00347229 DIN: 01596180
Siddharth Mittal Kiran Kumar
President - Finance & Chief Financial Officer Company Secretary
M No. A14594
Bengaluru Bengaluru
April 26, 2016 April 26, 2016
Consolidated Statement of Pro!t and Loss for the year ended March 31, 2016
(All amounts in Indian Rupees Million, except share data and per share data)
Notes March 31, 2016 March 31, 2015
INCOME
Revenue from operations (gross) 35,189 31,224
Less: Excise duty 335 326
Revenue from operations (net) 22 34,854 30,898
Other income 23 845 531
Total revenue (I) 35,699 31,429
EXPENSES
Cost of raw materials and packing materials consumed 24 12,549 11,970
Purchases of traded goods 25(a) 1,070 1,110
(Increase)/Decrease in inventories of finished goods, traded goods and work-in-progress 25(b) (318) (519)
Employee benefits expense 26 6,363 5,334
Other expenses 27 8,310 7,366
Depreciation and amortisation (net) 28 2,423 2,210
Finance costs 29 102 89
30,499 27,560
Less: Recovery of product development costs from co-development partners (net) (1,320) (1,321)
Total expenses (II) 29,179 26,239
Pro!t before tax and exceptional items [(I) - (II)] 6,520 5,190
Exceptional items (net) 40 5,754 1,051
Pro!t before tax 12,274 6,241
Tax expenses
Current tax 2,806 1,120
Less: MAT credit entitlement (166) (130)
Deferred tax (71) (33)
Total tax expense 2,569 957
PROFIT FOR THE YEAR 9,705 5,284
Profit attributable to:
Minority interest 744 310
Owners of the Company 8,961 4,974
9,705 5,284
Earnings per share (equity shares, par value of ` 5 each (March 31, 2015 - ` 5 each)
Basic (in `) 44.81 24.87
Diluted (in `) 44.81 24.87
Weighted average number of shares used in computing earnings per share
Basic 200,000,000 200,000,000
Diluted 200,000,000 200,000,000
Summary of significant accounting policies 2.1
Biocon Limited & Subsidiaries
195

Consolidated Cash Flow Statement for the year ended March 31, 2016
(All amounts in Indian Rupees Million)
March 31, 2016 March 31, 2015
I CASH FLOWS FROM OPERATING ACTIVITIES:
Net profit before tax 12,274 6,241
Non-cash adjustments to reconcile pro!t before tax to net cash "ows
Depreciation and amortisation (net) 2,423 2,210
Unrealised exchange (gain)/loss (net) 30 17
Employee stock compensation expense 129 60
Provision / (reversal of provision) for doubtful debts (47) 61
Bad debts written off 8 -
Interest expense 102 89
Interest income (433) (120)
Dividend income (204) (226)
Net gain on sale of current investments (16) (14)
Other operating revenue (146) (133)
Other non-operating income (186) (153)
Exceptional item (net) [refer note 40] (5,754) (1,051)
Operating profit before working capital changes 8,180 6,981
Movements in working capital
Decrease/(increase) in inventories (582) (737)
Decrease/(increase) in trade receivables (587) (1,503)
Decrease/(increase) in loans and advances and other assets (876) (1,073)
Increase/(decrease) in trade payable, other liabilities and provisions 1,597 (227)
Cash generated from operations 7,732 3,441
Direct taxes paid (net of refunds) (2,468) (1,334)
Net cash "ow from/(used in) operating activities 5,264 2,107
II CASH FLOWS FROM INVESTING ACTIVITIES:
Purchase of tangible fixed assets, capital work in progress and capital advances (net of reimbursements under co-
development arrangements/from customers)
(8,106) (8,381)
Acquisition of intangible assets / product development costs (1,666) (788)
Acquisition of additional shares in subsidiary - (2,154)
Proceeds from sale of shares in subsidiary (net of expenses) 5,142 3,677
Interest received 268 101
Dividend received 204 226
Proceeds from sale of current investments 27,841 29,429
Proceeds from sale of fixed assets 6 -
Purchase of current investments (29,807) (25,181)
Investment in bank deposits (having original maturity more than three months) (3,020) (3,529)
Redemption/maturity of bank deposits (having original maturity more than three months) 3,832 1,360
Investment in deposits with financial institutions (4,420) -
Other non-operating income 186 153
Net cash "ow from/(used in) investing activities (9,540) (5,087)
III CASH FLOWS FROM FINANCING ACTIVITIES:
Recovery of loan from Syngene Employee Welfare Trust 23 40
Proceeds from long-term borrowings 12,620 3,247
Repayment of long-term borrowings (541) (145)
Proceeds/(repayment) of short-term borrowings (net) 1,384 171
Interest paid (106) (5)
Dividend paid on equity shares of the Company (2,000) (1,000)
Dividend paid on equity shares by subsidiary (365) (53)
Tax on final equity dividend - (170)
Tax on interim equity dividend (107) (30)
Tax on equity dividend paid by subsidiary (41) (193)
Net cash "ow from/(used for) !nancing activities 10,867 1,862
Credibly Capable | Annual Report 2016196

Financial Report
March 31, 2016 March 31, 2015
IV Net increase/(decrease) in cash and cash equivalents (I+II+III) 6,591 (1,118)
V E"ect of exchange di"erences on cash and cash equivalents held in foreign currency 65 23
VI Foreign currency translation reserve / adjustments (12) 42
VII Cash and cash equivalents due to consolidation of NeoBiocon and deconsolidation of ESOP Trust (refer note 2
and 37)
- 109
VIII Cash and cash equivalents at the beginning of the year 4,626 5,570
IX Cash and cash equivalents at the end of the year (IV+V+VI+VII+VIII) 11,270 4,626
Components of cash and cash equivalents
Cash on Hand 1 1
Balances with Banks - in current accounts 7,104 4,585
- in deposit accounts 4,155 34
- in unpaid dividend accounts [refer note (i) below] 10 6
11,270 4,626
(i) The Company can utilize these balances only towards settlement of the respective unpaid dividend liabilities.
Summary of significant accounting policy 2.1
The accompanying notes are an integral part of the financial statements.
As per our report of even date
For S.R. Batliboi & Associates LLP For and on behalf of the Board of Directors of Biocon Limited
Chartered Accountants
ICAI Firm registration no.: 101049W
per Aditya Vikram Bhauwala Kiran Mazumdar-Shaw Arun Chandavarkar
Partner Managing Director Joint Managing Director & CEO
Membership no.: 208382 DIN: 00347229 DIN: 01596180
Siddharth Mittal Kiran Kumar
President - Finance & Chief Financial Officer Company Secretary
M No. A14594
Bengaluru Bengaluru
April 26, 2016 April 26, 2016
(This space has been intentionally left blank)
Biocon Limited & Subsidiaries
197
Notes to the Consolidated Financial Statements for the year ended March 31, 2016
(All amounts in Indian Rupees Million, except share and per share data, unless otherwise stated)
1. Corporate information
Biocon Limited (‘Biocon’ or ‘the Company’), was incorporated at Bangalore in 1978 for manufacture of biotechnology products. Syngene International Limited
(‘Syngene’), promoted by Dr Kiran Mazumdar Shaw, was incorporated at Bangalore in 1993. In March 2002, Biocon acquired 99.99% of the equity shares of Syngene
and, resultantly, Syngene became the subsidiary of Biocon. During the year, Syngene completed its Initial Public Offering (IPO), through an offer for sale of 22,000,000
equity shares of 10 each, by the Company. Post the IPO, 72.61% of the equity interest in Syngene is held by Biocon and 0.93% is held by Biocon Research Limited
(‘BRL’).
On January 10, 2008, Biocon entered into an agreement with Dr. B.R. Shetty to set up a Joint Venture Company NeoBiocon FZ-LLC, incorporated in Dubai (‘NeoBiocon’).
NeoBiocon is engaged in development, marketing and distribution of biopharmaceuticals in the Middle East region. On July 01, 2014, the Company acquired an
additional equity stake of 1% in NeoBiocon, taking its holding to 51%. Accordingly, effective July 01, 2014 the results of NeoBiocon have been consolidated as a
subsidiary. Till June 30, 2014, NeoBiocon was accounted as a joint venture on a proportionate consolidation on a line-by-line basis in the consolidated financial
statements, as per the requirements of Accounting Standard 27.
The Company has also established BRL at Bangalore on May 28, 2008, a wholly owned subsidiary of the Company to undertake research and development in novel
and innovative drug initiatives.
Biocon Biopharmaceuticals Limited (formerly Biocon Biopharmaceuticals Private Limited) [BBL] was incorporated at Bangalore on June 17, 2002 as a Joint Venture
between Biocon and CIMAB SA (‘CIMAB’) with Biocon holding 51 per cent of the share capital. During the financial year ended March 31, 2011, Biocon acquired the
interest of the joint venture partner, CIMAB. Consequently all the equity shares of BBL were held by Biocon. On July 25, 2012, the Board of Directors of the Company
approved a scheme of amalgamation (‘the Scheme’) of BBL with the Company under section 391 and 394 of the Companies Act, 1956. The Honourable High Court
of Karnataka (‘the Court’) approved the aforesaid Scheme with Appointed Date as April 01, 2012 vide its order dated July 12, 2013 (“the Order”). The copy of the
Order was filed with the Registrar of Companies on August 08, 2013.
During the year ended March 31, 2009, Biocon set up a wholly owned subsidiary Company in Switzerland, Biocon SA (“BSA”) to undertake research and development
in novel and innovative drug initiatives.
During the year ended March 31, 2016, Biocon set up a wholly owned subsidiary company in United Kingdom, Biocon Biologics Limited (“BUK”) to undertake
development and commercialization of biosimilar products.
During the year ended March 31, 2011, Biocon set up a wholly owned subsidiary company in Malaysia, Biocon Sdn. Bhd. (‘Biocon Malaysia’) for development
and manufacture of bio-pharmaceuticals. During the year ended March 31, 2016, the Company transferred its investment in shares of Biocon Malaysia to BUK.
Accordingly, Biocon Malaysia has become a step-down subsidiary of the Company.
The Company has 30% voting rights in IATRICa Inc. (‘IATRICa’) incorporated in USA. IATRICa is involved in research and development activities.
During the year ended March 31, 2014, the Company established Biocon Academy, a not for profit company under Companies Act, 1956 to provide educational
courses, training and research in the biosciences, life sciences and all fields of study.
On October 31, 2014, the Company incorporated Biocon Pharma Limited (‘BPL’), a wholly owned subsidiary of Biocon, to engage in the business of formulation,
development and sale of biopharmaceutical products. During the year BPL also incorporated a subsidiary Biocon Pharma Inc, to carry its operations in USA.
During the year ended March 31, 2016, Biocon set up a wholly owned subsidiary Company in Dubai, Biocon FZ LLC (“Biocon FZ”) to engage in the business of
biopharmaceutical products in the Middle East region.
Biocon and its subsidiaries (‘the Group’) and associate companies are engaged in manufacture of biotechnology products for the pharmaceutical sector. The
Company is also engaged in research and development in the biotechnology sector. The Group is also engaged in providing contract research and manufacturing
services to overseas customers in the field of synthetic chemistry and molecular biology and undertakes clinical research activities on discovering new biomarkers
and is extending its activity to discovering new diseases subsets and novel data based on pharmacogenomics. During the year ended March 31, 2007, the Company
had received an approval for operation of SEZ Developer and for setting up SEZ Unit operations to be located within Biocon SEZ.
2. Basis of preparation and consolidation
The consolidated financial statements have been prepared in accordance with generally accepted accounting principles in India (Indian GAAP). The Group has
prepared these financial statements to comply in all material respects with the Accounting Standards, notified under section 133 of the Companies Act, 2013 (“the
Act”) read together with paragraph 7 of the Companies (Accounts) Rules 2014 to reflect the financial position and the results of operations of Biocon together with
its subsidiaries and associate company. The consolidated financial statements have been prepared on an accrual basis and under the historical cost convention
except in case of assets for which provision for impairment is made and revaluation is carried out.
For the purpose of administration of the employee stock option plans of the Company, the Company has established the Biocon India Limited Employee Welfare
Trust (‘The ESOP Trust’). The Securities and Exchange Board of India (Share Based Employee benefits) Regulations 2014 (‘SEBI Regulations’) requires companies
to follow ‘Guidance Note on Accounting for employee share-based Payments’ (Guidance Note) or Accounting Standards as may be prescribed by the Institute
of Chartered Accountants of India (ICAI). As per the Guidance Note, Trust created for the purpose of administering employee share-based plans which does not
provide any economic benefit to the Company should not be consolidated with the financial statements of the Company. Hitherto, under the erstwhile Securities
and Exchange Board of India (Employee stock option scheme and employee stock purchase scheme) Guidelines, 1999, financial statements of the Company were
prepared as if the Company itself is administering the ESOP scheme. Pursuant to the SEBI Regulations, the Company has discontinued the consolidation of the
accounts of the ESOP Trust in its standalone financial statements as of March 31, 2015 onwards.
The Central Government in consultation with National Advisory Committee on Accounting Standards has amended Companies (Accounting Standards) Rules,
2016 (‘principal rules’), vide notification issued by Ministry of Corporate Affairs dated and effective March 30, 2016. The Company believes that the Rule 3(2) of
the principal rules has not been withdrawn or replaced and accordingly, the Companies (Accounting Standards) Rules, 2016 will apply for the accounting periods
Credibly Capable | Annual Report 2016198

Financial Report
commencing on or after March 30, 2016. Hence, the Company has not applied the Companies (Accounting Standards) Rules, 2016 in preparation of financial results
for the year ended March 31, 2016.
In accordance with Accounting Standard 23, ‘Accounting for Investments in Associates in Consolidated Financial Statements’, the Group has accounted for its
investments in associate under the equity method as per which the share of profit/ (loss) of the associate company has been added to/reduced from the cost of
investment.
The accounting policies have been consistently applied by the Group and are consistent with those used in the previous year.
The financial statements of subsidiaries and associate company have been drawn upto the same reporting date as that of the Company i.e. March 31, 2016.
All material inter-company transactions and balances between the entities included in the consolidated financial statements have been eliminated. The excess of
the purchase price over the proportionate share of the book value of the net assets of the acquired subsidiary company /increase in shareholding in subsidiary
company on the date of investment is recognised in the consolidated financial statements as goodwill and disclosed under Intangible Assets. In case the cost of
investment in subsidiary companies is less than the proportionate share of the book value of the net assets of the acquired subsidiary company on the date of
investment, the difference is treated as capital reserve and shown under Reserves and surplus.
2.1 Summary of signi!cant accounting policies
a. Use of estimates
The preparation of consolidated financial statements in conformity with Indian GAAP requires management to make judgements, estimates and assumptions that
affect the reported amounts of revenues, expenses, assets and liabilities and the disclosure of contingent liabilities, at the end of the reporting period. Although
these estimates are based upon management’s best knowledge of current events and actions, actual results could differ from these estimates.
b. Tangible !xed assets
Fixed assets are stated at cost, except for certain freehold land and buildings revalued on November 1, 1994, which are shown at estimated replacement cost
as determined by valuers less impairment loss, if any, net of accumulated depreciation and accumulated impairment losses, if any. The cost comprises purchase
price, borrowing costs if capitalization criteria are met and other directly attributable cost of bringing the asset to its working condition for the intended use. Any
trade discounts and rebates are deducted in arriving at the purchase price. Each part of an item of property, plant and equipment with a cost that is significant in
relation to the total cost of the item is depreciated separately. This applies mainly to components for machinery. When significant parts of fixed assets are required
to be replaced at intervals, the Group recognizes such parts as individual assets with specific useful lives and depreciates them accordingly. Likewise, when a major
inspection is performed, its cost is recognized in the carrying amount of the fixed assets as a replacement if the recognition criteria are satisfied.
Leasehold land on a lease-cum-sale basis are capitalised at the allotment rates charged by the Municipal Authorities.
Subsequent expenditure related to an item of fixed asset is added to its book value only if it increases the future benefits from the existing asset beyond its previously
assessed standard of performance. All other expenses on existing fixed assets, including routine repair and maintenance expenditure and cost of replacing parts, are
charged to the consolidated statement of profit and loss for the period during which such expenses are incurred.
The Group adjusts exchange differences arising on translation/ settlement of long-term foreign currency monetary items pertaining to the acquisition of a
depreciable asset to the cost of the asset and depreciates the same over the remaining life of the asset. In accordance with MCA circular dated August 09, 2012,
exchange differences adjusted to the cost of fixed assets are total differences, arising on long-term foreign currency monetary items pertaining to the acquisition
of a depreciable asset, for the period.
Gains or losses arising from de-recognition of fixed assets are measured as the difference between the net disposal proceeds and the carrying amount of the asset
and are recognized in the statement of profit and loss when the asset is de-recognised.
Assets funded by third parties/customers are capitalised at gross value and the funds so received are recorded as funding received from co-developer/deferred
revenue, as applicable, and amortised over the useful life of the assets/period of contract.
c. Depreciation on tangible !xed assets
Depreciation on fixed assets is calculated on a straight-line basis using the rates arrived at based on the useful lives estimated by the management. The identified
components are depreciated separately over their useful lives; the remaining components are depreciated over the life of the principal asset.
The Group has estimated the following useful lives to provide depreciation on its fixed assets:
Nature of Asset Useful lives (in years)
Buildings* 25
Roads 5
Plant and equipment (including Electrical installation & Lab equipment)* 9-11
Computers & servers* 3
Office equipment 3-5
Research and development equipment * 9
Furniture and fixtures * 6
Vehicles * 6
Leasehold improvements 5 or lease period whichever is lower
Used assets acquired from third parties are depreciated on a straight line basis over their remaining useful life of such assets.
* For these classes of assets, where the estimated useful lives are different from lives prescribed under Schedule II of the Act, management has estimated these
useful lives after taking into consideration technical assessment, prior asset usage experience and the risk of technological obsolescence.
The residual values, useful lives and methods of depreciation of tangible fixed assets are reviewed at each financial year end and adjusted prospectively, if
appropriate.
Biocon Limited & Subsidiaries
199

d. Intangible assets
Intangible assets acquired separately are measured on initial recognition at cost. Following initial recognition, intangible assets are carried at cost less accumulated
amortization and accumulated impairment losses, if any. Internally generated intangible assets, excluding capitalized development costs, are not capitalized and
expenditure is reflected in the consolidated statement of profit and loss in the year in which the expenditure is incurred.
Computer Software which is not an integral part of the related hardware is classified as an intangible asset.
Intangible assets are amortized on a straight line basis over the estimated useful economic life. The Group uses a rebuttable presumption that the useful life of an
intangible asset will not exceed its remaining patent life or ten years, whichever is lower. If the persuasive evidence exists to the affect that useful life of an intangible
asset exceeds ten years, the Group amortizes the intangible asset over the best estimate of its useful life. Such intangible assets and intangible assets not yet
available for use are tested for impairment annually. All other intangible assets are assessed for impairment whenever there is an indication that the intangible asset
may be impaired.
The amortization period and the amortization method are reviewed at least at each financial year end. If the expected useful life of the asset is significantly different
from previous estimates, the amortization period is changed accordingly. If there has been a significant change in the expected pattern of economic benefits from
the asset, the amortization method is changed to reflect the changed pattern. Such changes are accounted for in accordance with AS 5, Net Profit or Loss for the
Period, Prior Period Items and Changes in Accounting Policies.
Gains or losses arising from de-recognition of an intangible asset are measured as the difference between the net disposal proceeds and the carrying amount of
the asset and are recognized in the consolidated statement of profit and loss when the asset is de-recognised.
Amortisation of intangible assets:
a. Costs relating to intellectual property rights, manufacturing and marketing rights are amortized on a straight-line basis over the period of expected future sales
from the use of the said intangible asset, i.e., over their estimated useful lives of five to ten years.
b. Computer Software is amortised on a straight line basis over a period of three to five years, being its estimated useful life.
Goodwill
Goodwill represents the excess of the purchase price over the book value of the net assets of the acquired subsidiary company/increase in shareholding in
subsidiary company on the date of investment. Goodwill is not amortised but is tested for impairment on a yearly basis. Goodwill on acquisition of business
represents the excess of purchase consideration over the net book value of assets acquired. Goodwill on acquisition of business is amortised on a straight line basis
over a period of 5 years and is tested for impairment on an annual basis.
Research and Development Costs
Research and development costs incurred for development of products are expensed as incurred. Development costs which relate to the design and testing of new
or improved materials, products or processes or for existing products in new territories are recognised as an intangible asset to the extent that:
a. it is technically feasible to complete the development of asset and it will be available for sale / use.
b. it is expected that such development will be completed and used / sold.
c. it is expected that such assets will generate future economic benefits.
d. there are adequate resources to complete such development.
e. it is possible to measure reliably the expenditure attributable to the asset during development.
Research and development expenditure of a capital nature is added to fixed assets. Following the initial recognition of the development expenditure as an asset,
the cost model is applied requiring the asset to be carried at cost less any accumulated amortization and accumulated impairment losses. The carrying value of the
development cost is tested for impairment annually.
e. Borrowing costs
Borrowing cost includes interest, amortization of ancillary costs incurred in connection with the arrangement of borrowings and exchange differences arising from
short-term foreign currency borrowings to the extent they are regarded as an adjustment to the interest cost.
Borrowing costs directly attributable to the acquisition, construction or production of an asset that necessarily takes a substantial period of time to get ready for its
intended use or sale are capitalized as part of the cost of the respective asset. All other borrowing costs are expensed in the period they occur.
f. Impairment of tangible and intangible assets
The Group assesses at each reporting date whether there is an indication that an asset may be impaired. If any indication exists, or when annual impairment testing
for an asset is required, the Group estimates the asset’s recoverable amount. The recoverable amount is determined for an individual asset, unless the asset does not
generate cash inflows that are largely independent of those from other assets or groups of assets. Where the carrying amount of an asset exceeds its recoverable
amount, the asset is considered impaired and is written down to its recoverable amount. In assessing value in use, the estimated future cash flows are discounted
to their present value using a pre-tax discount rate that reflects current market assessments of the time value of money and the risks specific to the asset. In
determining net selling price, recent market transactions are taken into account, if available. If no such transactions can be identified, an appropriate valuation
model is used.
Impairment losses, including impairment on inventories, are recognized in the consolidated statement of profit and loss, except for previously revalued tangible
fixed assets, where the revaluation was taken to revaluation reserve. In this case, the impairment is also recognized in the revaluation reserve up to the amount of
any previous revaluation.
After impairment, depreciation is provided on the revised carrying amount of the asset over its remaining useful life.
An assessment is made at each reporting date as to whether there is any indication that previously recognized impairment losses may no longer exist or may have
decreased. If such indication exists, the Group estimates the asset’s recoverable amount. A previously recognized impairment loss is reversed only if there has been
Credibly Capable | Annual Report 2016200

Financial Report
a change in the assumptions used to determine the asset’s recoverable amount since the last impairment loss was recognized. The reversal is limited so that the
carrying amount of the asset does not exceed its recoverable amount, nor exceed the carrying amount that would have been determined, net of depreciation, had
no impairment loss been recognized for the asset in prior years. Such reversal is recognized in the consolidated statement of profit and loss unless the asset is carried
at a revalued amount, in which case the reversal is treated as a revaluation increase.
g. Inventories
Inventories are valued as follows:
Raw materials and packing
materials
Lower of cost and net realizable value. However, materials and other items held for use in the production of inventories are
not written down below cost if the finished products in which they will be incorporated are expected to be sold at or above
cost. Cost is determined on a first-in-first out basis. Customs duty on imported raw materials (excluding stocks in the bonded
warehouse) is treated as part of the cost of the inventories. Consumables in the nature of Columns are amortised over a
period of twelve months from the date of issue for consumption.
Work-in-progress and finished
goods
Lower of cost and net realizable value. Cost includes direct materials (on a first–in-first out basis) and labour and a proportion
of manufacturing overheads based on normal operating capacity. Cost of finished goods includes excise duty.
Traded goods Lower of cost and net realizable value. Cost includes the purchase price and other associated costs directly incurred in
bringing the inventory to its present location. Cost is determined on a first-in-first out basis.
Net realizable value is the estimated selling price in the ordinary course of business, less estimated costs of completion and estimated costs necessary to make the
sale.
h. Revenue recognition
Revenue is recognized to the extent that it is probable that the economic benefits will flow to the Group and the revenue can be reliably measured. The following
specific recognition criteria must also be met before revenue is recognised.
(i) Sale of products:
Revenue from sale of products is recognised when the significant risks and rewards of ownership of the goods have passed to the buyer. The Group collects
sales taxes and value added taxes (VAT) on behalf of the government and, therefore, these are not economic benefits flowing to the Group. Hence, they are
excluded from revenue. Excise duty deducted from revenue (gross) is the amount that is included in the revenue (gross) and not the entire amount of liability
arising during the year.
(ii) Sale of services:
Licensing and development fees and capacity reservation fees:
The Group enters into certain dossier sales, licensing and supply agreements (including arrangement for capacity reservation fee) relating to various products.
Revenue from such arrangements is recognised upon completion of performance obligations or on a proportional performance basis over the period the
Group performs its obligations, based on the terms of the agreements. Proportionate performance is measured based upon the efforts/ costs incurred to date
in relation to the total estimated efforts / costs to complete the contract. The Group monitors estimates of the total contract revenue and cost on a routine
basis throughout the contract period. The cumulative impact of any change in estimates of the contract revenue or costs in reflected in the period in which
the changes become known. In the event that the loss is anticipated on a particular contract, provision is made for the estimated loss.
Contract research and manufacturing services income:
In respect of contracts involving research services, in case of ‘time and materials’ contracts, contract research fee are recognised as services are rendered,
in accordance with the terms of the contracts. Revenues relating to fixed price contracts are recognised based on the percentage of completion method
determined based on efforts expended as a proportion to total estimated efforts. The Company monitors estimates of total contract revenue and cost on a
routine basis throughout the contract period. The cumulative impact of any change in estimates of the contract revenue or costs is reflected in the period in
which the changes become known. In the event that a loss is anticipated on a particular contract, provision is made for the estimated loss.
In respect of contracts involving sale of compounds arising out of contract research services for which separate invoices are raised, revenue is recognised when
the significant risks and rewards of ownership of the compounds have passed to the buyer, and comprise amounts invoiced for compounds sold.
In respect of services, the Group collects service tax as applicable, on behalf of the government and, therefore, it is not an economic benefit flowing to the
Group. Hence, it is excluded from revenue.
(iii) Interest income: Interest income is recognized on a time proportion basis taking into account the amount outstanding and the applicable interest rate. Interest
income is included under the head “other income” in the consolidated statement of profit and loss.
(iv) Dividend income: Dividend income is recognized when the Group’s right to receive dividend is established by the reporting date.
i. Investments
Investments that are readily realisable and intended to be held for not more than twelve months from the date on which such investments are made are classified
as current investments. All other investments are classified as long-term investments.
On initial recognition, all investments are measured at cost. The cost comprises purchase price and directly attributable acquisition charges such as brokerage, fees
and duties. If an investment is acquired, or partly acquired, by the issue of shares or other securities, the acquisition cost is the fair value of the securities issued. If
an investment is acquired in exchange for another asset, the acquisition is determined by reference to the fair value of the asset given up or by reference to the fair
value of the investment acquired, whichever is more clearly evident.
Current investments are carried in the consolidated financial statements at lower of cost and fair value determined on an individual investment basis. Long-term
investments are carried at cost. However, provision for diminution in value is made to recognize a decline other than temporary in the value of the investments.
On disposal of an investment, the difference between its carrying amount and net disposal proceeds is charged or credited to the consolidated statement of profit
and loss.
Biocon Limited & Subsidiaries
201

j. Retirement bene!ts
Retirement benefit in the form of Provident Fund is a defined contribution scheme and the contributions are charged to the consolidated statement of profit and
loss for the year when the employee renders the related service and contributions to the government funds are due. The Group has no obligation other than the
contribution payable to provident fund authorities.
Gratuity liability is a defined benefit obligation and is provided for on the basis of an actuarial valuation on projected unit credit method made at the end of each
financial year. The gratuity benefit of the Group is administered by a trust formed for this purpose through the group gratuity scheme. Actuarial gains and losses for
defined benefit plan are recognized in full in the period in which they occur in the consolidated statement of profit and loss.
Accumulated leave, which is expected to be utilised within the next 12 months, is treated as short-term employee benefit. The Group measures the expected cost
of such absences as the additional amount that it expects to pay as a result of the unused entitlement that has accumulated at the reporting date.
The Group treats accumulated leave expected to be carried forward beyond 12 months, as long–term employee benefit for measurement purposes. Such long-
term compensated absences are provided for based on the actuarial valuation using the projected unit credit method at the year-end. Actuarial gains/losses are
immediately taken to the consolidated statement of profit and loss and are not deferred. The Group presents the entire leave as a current liability in the consolidated
balance sheet, since it does not have an unconditional right to defer its settlement for 12 months after the reporting date.
In case of foreign subsidiary companies, contributions are made as per the respective country laws and regulations. The same is charged to statement of profit and
loss on accrual basis. There are no obligations beyond the company’s contribution.
k. Foreign currency translation
Foreign currency transaction and balances
Initial recognition
Foreign currency transactions are recorded in the reporting currency, by applying to the foreign currency amount the exchange rate between the reporting
currency and the foreign currency at the date of the transaction.
Conversion
Foreign currency monetary items are retranslated using the exchange rate prevailing at the reporting date. Non-monetary items which are carried in terms of
historical cost denominated in a foreign currency are reported using the exchange rate at the date of the transaction. Non-monetary items which are carried at fair
value or other similar valuation denominated in a foreign currency are translated using the exchange rates at the date when such values were determined.
Exchange di#erences
The Group accounts for exchange differences arising on translation/ settlement of foreign currency monetary items as below:
(i) Exchange differences arising on a monetary item that, in substance, forms part of the Company’s net investment in a non-integral foreign operation is
accumulated in the foreign currency translation reserve in the financial statements until the disposal of the net investment, at which time they are recognised
as income or as expenses.
(ii) Exchange differences arising on long-term foreign currency monetary items related to acquisition of a fixed asset are capitalized and depreciated over the
remaining useful life of the asset.
(iii) Exchange differences arising on other long-term foreign currency monetary items are accumulated in the “Foreign Currency Monetary Item Translation
Difference Account” and amortized over the remaining life of the concerned monetary item.
(iv) All other exchange differences are recognized as income or as expenses in the period in which they arise.
For the purpose of (ii) and (iii) above, the Group treats a foreign monetary item as “long-term foreign currency monetary item”, if it has a term of 12 months or more
at the date of its origination. In accordance with MCA circular dated August 09, 2012, exchange differences for this purpose, are total differences arising on long-term
foreign currency monetary items for the period.
Forward exchange contracts entered into to hedge foreign currency risk of an existing asset/ liability
The premium or discount arising at the inception of forward exchange contract is amortized and recognized as an expense/ income over the life of the contract.
Exchange differences on such contracts, except the contracts which are long-term foreign currency monetary items, are recognized in the statement of profit and
loss in the period in which the exchange rates change. Any profit or loss arising on cancellation or renewal of such forward exchange contract is also recognized as
income or as expense for the period. Any gain/ loss arising on forward contracts which are long-term foreign currency monetary items are recognized in accordance
with paragraph (ii) and (iii).
Translation of integral and non-integral foreign operation
The Group classifies all its foreign operations as either “integral foreign operations” or “non-integral foreign operations.”
The financial statements of an integral foreign operation are translated as if the transactions of the foreign operation have been those of the Group itself.
The assets and liabilities of a non-integral foreign operation are translated into the reporting currency at the exchange rate prevailing at the reporting date. Their
statement of profit and loss is translated at exchange rates prevailing at the dates of transaction. The exchange differences arising on translation are accumulated
in the foreign currency translation reserve. On disposal of a non-integral foreign operation, the accumulated foreign currency translation reserve relating to that
foreign operation is recognized in the consolidated statement of profit and loss.
When there is a change in the classification of a foreign operation, the translation procedures applicable to the revised classification are applied from the date of the
change in the classification.
l. Income tax
Tax expense comprises current and deferred tax. Current income tax is measured at the amount expected to be paid to the tax authorities in accordance with the
Income Tax Act 1961 enacted in India and tax laws prevailing in the respective tax jurisdictions where the company operates. The tax rates and tax laws used to
Credibly Capable | Annual Report 2016202

Financial Report
compute the amount are those that are enacted or substantively enacted, at the reporting date. Current income tax relating to items recognized directly in equity
is recognized in equity and not in the consolidated statement of profit and loss.
Deferred income taxes reflect the impact of timing differences between taxable income and accounting income originating during the current year and reversal
of timing differences for the earlier years. Deferred income tax relating to items recognized directly in equity is recognized in equity and not in the consolidated
statement of profit and loss.
Deferred tax is measured using the tax rates and the tax laws enacted or substantively enacted at the reporting date. Deferred tax liability is recognised for all taxable
timing differences. Deferred tax assets are recognised only to the extent that there is reasonable certainty that sufficient future taxable income will be available
against which such deferred tax assets can be realised. In situations where the Group has unabsorbed depreciation or carry forward tax losses, all deferred tax assets
are recognised only if there is virtual certainty supported by convincing evidence that they can be realised against future taxable profits.
In the situations where the Group is entitled to a tax holiday under the Income-tax Act, 1961 enacted in India or tax laws prevailing in the respective tax jurisdictions
where it operates, no deferred tax (asset or liability) is recognized in respect of timing differences which reverse during the tax holiday period, to the extent the
Group’s gross total income is subject to the deduction during the tax holiday period. Deferred tax in respect of timing differences which reverse after the tax holiday
period is recognized in the year in which the timing differences originate. However, the Group restricts recognition of deferred tax assets to the extent that it has
become reasonably certain or virtually certain, as the case may be, that sufficient future taxable income will be available against which such deferred tax assets can
be realized. For recognition of deferred taxes, the timing differences which originate first are considered to reverse first.
At each reporting date, the Group re-assesses unrecognised deferred tax assets. It recognises unrecognised deferred tax assets to the extent that it has become
reasonably certain or virtually certain, as the case may be that sufficient future taxable income will be available against which such deferred tax assets can be
realised.
The carrying amount of deferred tax assets are reviewed at each reporting date. The Group writes-down the carrying amount of a deferred tax asset to the extent
that it is no longer reasonably certain or virtually certain, as the case may be, that sufficient future taxable income will be available against which deferred tax asset
can be realised. Any such write-down is reversed to the extent that it becomes reasonably certain or virtually certain, as the case may be, that sufficient future
taxable income will be available.
Deferred tax assets and deferred tax liabilities are offset, if a legally enforceable right exists to set-off current tax assets against current tax liabilities and the deferred
tax assets and deferred taxes relate to the same taxable entity and the same taxation authority.
Minimum Alternate Tax (MAT) paid in a year is charged to the consolidated statement of profit and loss as current tax. The Group recognizes MAT credit available as
an asset only to the extent that there is convincing evidence that the Group will pay normal income tax during the specified period, i.e., the period for which MAT
credit is allowed to be carried forward. In the year in which the Group recognizes MAT credit as an asset in accordance with the Guidance Note on “Accounting for
Credit Available in respect of Minimum Alternative Tax under the Income-tax Act, 1961”, the said asset is created by way of credit to the consolidated statement of
profit and loss and shown as “MAT Credit Entitlement”. The Group reviews the “MAT credit entitlement” asset at each reporting date and writes down the asset to the
extent the Group does not have convincing evidence that it will pay normal tax during the specified period.
m. Government grants and subsidies
Grants and subsidies from the government are recognised as reduction from related expenses, when there is reasonable assurance that (i) conditions attached to
them will be complied with, and (ii) the grant/subsidy will be received.
n. Employee stock compensation costs
Employees (including senior executives) of the Group also receive remuneration in the form of share based payment transactions, whereby employees render
services as consideration for equity instruments (equity-settled transactions).
In accordance with the Securities and Exchange Board of India (share based employee benefits) Regulations, 2014 and the Guidance Note on Accounting for
Employee Share-based Payments, the cost of equity-settled transactions is measured using the intrinsic value method and recognized, together with a corresponding
increase in the “Stock options outstanding account” in reserves. The cumulative expense recognized for equity-settled transactions at each reporting date until the
vesting date reflects the extent to which the vesting period has expired and the Group’s best estimate of the number of equity instruments that will ultimately vest.
Expenses for equity settled options expiring unexercised after vesting are not reversed through statement of profit and loss. The expense or credit recognized in the
consolidated statement of profit and loss for a period represents the movement in cumulative expense recognized as at the beginning and end of that period and
is recognized in employee benefits expense.
Where the terms of an equity-settled transaction award are modified, the minimum expense recognized is the expense as if the terms had not been modified, if the
original terms of the award are met. An additional expense is recognized for any modification that increases the total intrinsic value of the share-based payment
transaction, or is otherwise beneficial to the employee as measured at the date of modification.
o. Earnings Per Share (EPS)
Basic earnings per share are calculated by dividing the net profit or loss for the year attributable to equity shareholders by the weighted average number of equity
shares outstanding during the year. Partly paid equity shares are treated as a fraction of an equity share to the extent that they are entitled to participate in dividends
relative to a fully paid equity share during the reporting period. The weighted average number of equity shares outstanding during the year is adjusted for events
such as bonus issue; bonus element in a rights issue to existing shareholders; share split; and reverse share split (consolidation of shares) that have changed the
number of equity shares outstanding, without a corresponding change in resources.
For the purpose of calculating diluted earnings per share, the net profit or loss for the year attributable to equity shareholders and the weighted average number
of shares outstanding during the year are adjusted for the effects of all dilutive potential equity shares.
Biocon Limited & Subsidiaries
203
p. Operating lease
Where the Group is a Lessee
Leases of assets under which all the risks and rewards of ownership are effectively retained by the lessor are classified as operating leases. Lease payments under
operating leases are recognised as an expense on a straight-line basis over the lease term.
Where the Group is a Lessor
eases in which the Group does not transfer substantially all the risks and benefits of ownership of the asset are classified as operating leases. Assets subject to
operating leases are included in fixed assets. Lease income is recognised on a straight line basis over the lease term. Costs, including depreciation are recognised as
an expense. Initial direct costs such as legal costs, brokerage costs, etc are recognised immediately in the consolidated statement of profit and loss.
q. Segment reporting
Identi!cation of segments
The Group’s operating businesses are organised and managed separately according to the nature of products and services provided, with each segment
representing a strategic business unit that offers different products and services to different markets. The analysis of geographical segments is based on the areas
in which major operating divisions of the Group operates.
Inter-segment transfers
The Group generally accounts for inter-segment sales and transfers at an agreed marked-up price.
Allocation of common costs
Common allocable costs are allocated to each segment according to the relative contribution of each segment to the total common costs.
Unallocated items
The Corporate and other segment include general corporate income and expense items which are not allocated to any business segment.
Segment policies
The Group prepares its segment information in conformity with the accounting policies adopted for preparing and presenting the consolidated financial statements
of the Group as a whole.
r. Provisions
A provision is recognised when the Group has a present obligation as a result of past event; it is probable that an outflow of resources embodying economic
benefits will be required to settle the obligation and a reliable estimate can be made of the amount of the obligation. Provisions are not discounted to its present
value and are determined based on best estimate required to settle the obligation at the reporting date. These estimates are reviewed at each reporting date and
adjusted to reflect the current best estimates.
Where the Group expects some or all of a provision to be reimbursed, for example under an insurance contract, the reimbursement is recognized as a separate asset
but only when the reimbursement is virtually certain. The expense relating to any provision is presented in the consolidated statement of profit and loss net of any
reimbursement.
s. Contingent liability
A contingent liability is a possible obligation that arises from past events whose existence will be confirmed by the occurrence or non-occurrence of one or more
uncertain future events beyond the control of the Group or a present obligation that is not recognized because it is not probable that an outflow of resources will
be required to settle the obligation. A contingent liability also arises in extremely rare cases where there is a liability that cannot be recognized because it cannot be
measured reliably. The Group does not recognize a contingent liability but discloses its existence in the consolidated financial statements.
t. Cash and cash equivalents
Cash and cash equivalents for the purpose of cash flow statement comprise cash at bank and in hand and short-term investments with an original maturity of three
months or less.
u. Derivative instruments
In accordance with the ICAI announcement, derivative contracts, other than foreign currency forward contracts covered under AS 11, are marked to market on a
portfolio basis, and the net loss, if any, after considering the offsetting effect of gain on the underlying hedged item, is charged to the consolidated statement of
profit and loss. Net gain, if any, after considering the offsetting effect of loss on the underlying hedged item, is ignored.
(This space has been intentionally left blank)
Credibly Capable | Annual Report 2016204

Financial Report
March 31, 2016 March 31, 2015
3. Share capital
Authorised :
220,000,000 (March 31, 2015 - 220,000,000) equity shares of ` 5 each 1,100 1,100
(March 31, 2015 - ` 5 each)
Issued, subscribed and paid-up shares:
200,000,000 (March 31, 2015 - 200,000,000) equity shares of `5 each 1,000 1,000
(March 31, 2015 - ` 5 each)
i. Reconciliation of the shares outstanding at the beginning and at the end of the reporting period
Equity shares March 31, 2016 March 31, 2015
No. ` No. `
At the beginning of the year 200,000,000 1,000 200,000,000 1,000
Issued during the year - - - -
Outstanding at the end of the year 200,000,000 1,000 200,000,000 1,000
ii. Terms / rights attached to equity shares
The Company has only one class of equity shares having a par value of ` 5 per share. Each holder of equity shares is entitled to one vote per share. The Company
declares and pays dividends in Indian Rupees. The dividend proposed by the Board of Directors is subject to the approval of the shareholders in the ensuing Annual
General Meeting.
During the year ended March 31, 2016, the Board of Directors approved interim dividend for distribution to equity shareholders of ` 5 per share (March 31, 2015 - ` 5
per share).
In the event of liquidation of the Company, the holders of equity shares will be entitled to receive remaining assets of the Company, after distribution of all preferential
amounts, if any. The distribution will be in proportion to the number of equity shares held by the shareholders.
iii. Details of shareholders holding more than 5% shares in the Company
March 31, 2016 March 31, 2015
No. % holding No. % holding
Equity shares of ` 5 each fully paid
Dr Kiran Mazumdar Shaw 79,287,564 39.64% 79,287,564 39.64%
Glentec International 39,535,194 19.77% 39,535,194 19.77%
As per the records of the Company, including its register of shareholder/members, the above shareholding represents both legal and beneficial ownership of shares.
iv. Shares reserved for issue under options
For details of shares reserved for issue under the employee stock option plan (ESOP) of the Company, refer to note 31.
(This space has been intentionally left blank)
Biocon Limited & Subsidiaries
205

March 31, 2016 March 31, 2015
4. Reserves and surplus
Revaluation reserve 9 9
Capital reserve 801 801
Securities premium 2,788 2,788
Foreign currency translation reserve account
Opening balance (261) 205
Add: Exchange difference during the year on net investment in non-integral operations (92) (466)
Closing balance (353) (261)
ESOP Trust
Opening balance - 886
Less: Deconsolidation of ESOP Trust (refer note 2) - (886)
Closing balance - -
General reserve
Opening balance 3,459 3,098
Add: Amount transferred from surplus balance in the statement of profit and loss - 361
Closing balance 3,459 3,459
Surplus in the statement of pro!t and loss account
Balance as per last financial statements 24,531 21,161
Adjustment arising on depreciation (refer note 13 (xi)) - (29)
Profit for the year 8,961 4,974
Less: appropriations
Interim dividend on equity shares [amount per share ` 5 (March 31, 2015 - ` 5)] (1,000) (1,000)
Tax on interim dividend (107) (30)
Tax on interim dividend by Subsidiary (41) (184)
Transfer to general reserve - (361)
Total appropriations (1,148) (1,575)
Net Surplus in the statement of profit and loss 32,344 24,531
Employee stock options outstanding
Balance as per last financial statements 379 319
Add: Compensation for options granted during the year 129 60
Closing balance 508 379
Total reserves and surplus 39,556 31,706
5. Minority interest
The share of the net assets attributable to the minority shareholders are as follows:
As per last balance sheet 1,722 823
Others [refer note (a) and (b) below] 646 589
Profit/(loss) for the year attributable to minority shareholders 744 310
3,112 1,722
a) During the year ended March 31, 2016, interim dividend of ` 53 (March 31, 2015 - ` 53) was distributed to minority shareholders of Syngene. Also during the year
ended March 31, 2016, dividend of ` 324 (March 31, 2015 - Nil) was distributed to minority shareholders of NeoBiocon.
b) Minority interest as at March 31, 2016 and 2015 represents that part of the net profits and net assets of Syngene [refer (i), (ii), (iii) and (iv) below] and NeoBiocon [refer (v) below] as follows:
(i) to the extent of 22,226,663 equity shares of ` 10 each [March 31, 2015 - 22,226,663 equity shares of ` 10 each] held by other parties. Syngene issued bonus shares during the year ended March 31, 2015. [Also refer note 40(b)]
(ii) to the extent of 6,680,000 equity shares of ` 10 each [March 31, 2015 - 6,680,000 equity shares of ` 10 each] being shares allotted by Syngene to Syngene
Employee Welfare Trust (‘Trust’) and employees of Syngene. A loan of ` 87 [March 31, 2015 - ` 110] is recoverable from the Trust. Also refer note 16.
(iii) to the extent of 2,000,000 equity shares of ` 10 each [March 31, 2015 - 2,000,000 equity shares of ` 10 each] being shares sold by the Company to Biocon Employee Welfare Trust. Also refer note 40(a).
(iv) to the extent of 22,000,000 equity shares of ` 10 each being shares sold by the Company to third party through an offer for sale during year ended March 31,
2016. Also refer note 40(c).
(v) On July 01, 2014, the Company acquired an additional equity stake of 1% in NeoBiocon, taking its holding to 51%. Accordingly, effective July 01, 2014 the results
of NeoBiocon have been consolidated as a subsidiary. As on March 31, 2016, 147 equity shares (March 31, 2015: 147 equity shares) are held by a third party.
Credibly Capable | Annual Report 2016206

Financial Report
Non-current portion Current maturities
March 31, 2016 March 31, 2015 March 31, 2016 March 31, 2015
6. Long-term borrowings
Deferred sales tax liability, unsecured [refer note (i) below] - 64 65 130
Other loans and advances (unsecured)
NMITLI - CSIR Loan [refer note (ii) below] 1 1 - -
Financial assistance from DSIR [refer note (iii) below] 3 7 3 3
Financial assistance from DST [refer note (iv) below] 35 42 7 7
Loans from banks (secured)
Term loan [refer note (vi), (vii), (viii), (ix) and (x) below] 20,061 7,396 29 726
Buyer’s credit [refer note (vii) below] 624 186 - -
20,724 7,696 104 866
The above amount includes
Secured borrowings 20,685 7,582 29 726
Unsecured borrowings 39 114 75 140
Amount disclosed under the head “Other current liabilities” - - (104) (866)
(note 12)
Net amount 20,724 7,696 - -
(i) On February 9, 2000, the Company obtained an order from the Karnataka Sales Tax Authority for allowing an interest free deferment of sales tax (including turnover
tax) for a period upto 12 years with respect to sales from its Hebbagodi manufacturing facility for an amount not exceeding ` 649. This is an interest free liability. The
amount is repayable in 10 equal half yearly instalments of ` 65 each starting from February 2012.
(ii) On March 31, 2005, the Company entered into an agreement with the Council of Scientific and Industrial Research (‘CSIR’), for an unsecured loan of ` 3 for carrying
out part of the research and development project under the New Millennium Indian Technology Leadership Initiative (‘NMITLI’) Scheme. The loan is repayable over
10 equal annual instalments of ` 0.3 starting from April 2009 and carry an interest rate of 3 percent per annum.
(iii) On March 31, 2009, the Department of Scientific and Industrial Research (‘DSIR’) sanctioned financial assistance for a sum of ` 17 to the Company for part financing
one of its research projects. The assistance is repayable in the form of royalty payments for three years post commercialisation of the project in five equal annual
instalments of ` 3 each, starting from April 1, 2013.
(iv) On August 25, 2010, the Department of Science and Technology (‘DST’) under the Drugs and Pharmaceutical Research Programme (‘DPRP’) has sanctioned
financial assistance for a sum of ` 70 to the Company for financing one of its research projects. The loan is repayable over 10 annual instalments of ` 7 each starting
from July 1, 2012, and carries an interest rate of 3 percent per annum.
(v) In respect of the financial assistance received under the aforesaid programmes (refer note (ii) to (iv) above), the Company is required to utilise the funds for the
specified projects and is required to obtain prior approvals from the said authorities for disposal of assets/Intellectual property rights acquired/developed under the
above programmes.
(vi) The Company has obtained an external commercial borrowing facility of USD 20 million from a bank. As at March 31, 2016, the Company has fully drawn the loan.
The term loan facility is secured by first priority pari-passu charge on the plant and machinery of the proposed expanded facility line in the existing facility. The long
term loan is repayable in 4 equal quarterly instalments of USD 5 million each commencing from December 31, 2018 and carries an interest rate of Libor + 0.95% p.a.
The Company has entered into interest rate swap to convert floating rate to fixed rate. Also refer note 34.
(vii) Syngene has obtained a foreign currency denominated long term secured buyer’s credit loans of ` 624 (USD 9.41 million) [March 31, 2015 - ` 186 (USD 2.99
million)] as of March 31, 2016 from HSBC Bank (Mauritius) Limited that carry interest rate in the range of Libor + 0.60% to Libor + 0.80%. The loan is guaranteed
by Hongkong and Shanghai Banking Corporation Limited, India to HSBC Bank (Mauritius) Limited. All of the credit facilities provided by Hongkong and Shanghai
Banking Corporation Limited, India is secured by a pari passu charge on the current assets and movable fixed assets of Syngene. The loans are repayable at end of
960 days to 1079 days from the date of its origination.
(viii) (a) Syngene has entered into External Commerial Borrowing agreement (ECB / facility) with Citibank N.A. and HSBC Bank (Mauritius) Limited dated March 30,
2016 to borrow ` 6,628 (USD 100 million) comprising (a) USD 50 million term loan facility (‘Facility A’); and (b) USD 50 million term loan facility (‘Facility B’). The
facilities are borrowed to incur capital expenditure at Bangalore and Mangalore premises of Syngene and are funded equally by Citibank N.A. and HSBC Bank
(Mauritius) Limited.
(b) ‘Facility A’ of ` 3,314 (USD 50 million) carries an interest rate of Libor + 1.04% and is repayable in two installments of USD 12.5 million in March 2019 and USD
37.5 million in March 2020; and ‘Facility B’ of ` 3,314 (USD 50 million) carries an interest rate of Libor + 1.30% and is repayable in March 2021.
(c) The facilities provided are secured by first priority pari passu charge on fixed assets and second charge on current assets of Syngene.
(ix) On February 24, 2016, Biocon Pharma Limited, has obtained an external commercial borrowing facility of USD 20 million [March 31, 2015 - Nil] from a bank, carrying
interest rate in the range of Libor + 1.75% per annum. The loan is repayable in 11 unequal quarterly installments commencing from June 28, 2019. The loan is
secured by first priority pari-passu charge on the plant and machinery of the facility for the manufacture of pharmaceuticals. Biocon Pharma Limited has also
entered into interest rates swape to convert floating rate to fixed rate. Also refer note 34.
(x) Biocon Sdn. Bhd, Malaysia, has obtained a term loan facility of USD 130 million from a consortium of banks. During the year ended March 31, 2016, Biocon Sdn.
Bhd has refinanced the existing term loan from Standard Chartered Bank (Hong Kong) Limited. Biocon Sdn. Bhd will repay the loan in quarterly installments
commencing from April 2017.
On July 6, 2015, Biocon Sdn. Bhd has entered into a new term loan agreement with Standard Chartered Bank (Hong Kong) Limited for an amount upto USD 70
million. Biocon Sdn. Bhd will repay the loan in quarterly installments commencing from April 2017.
The term loans are denominated in USD and carries an interest rate of Libor + 3% p.a. The term loan is secured by a fixed and floating charge over all present and
future assets and a charge over the freehold property of Biocon Sdn. Bhd. Also refer note 34.
Biocon Limited & Subsidiaries
207

March 31, 2016 March 31, 2015
7. Deferred tax liability (net)
Deferred tax liability
Fixed assets: Impact of difference between tax depreciation and 589 540
depreciation / amortisation charged for the financial reporting
Gross deferred tax liability 589 540
Deferred tax asset
Employee retirement benefit expenditure charged to the statement of profit 160 92
and loss in the current year but allowed for tax purposes on payment basis
Provision for doubtful debts 14 18
Others 69 13
Gross deferred tax asset 243 123
Net deferred tax liability 346 417
(i) The Group has units in a Special Economic Zone (SEZ) which claim deduction of income under the provisions of the
Income Tax Act, 1961. Deferred tax assets/ (liabilities) are recognised in respect of timing differences which originate in the
reporting period, but are expected to reverse after the tax holiday period.
8. Other long-term liabilities
Deferred revenues [refer note 42 and 13(iv)] 957 3,052
Funding received from Co-developer towards fixed assets [refer note 13(iii)] 2,541 2,458
Interest accrued but not due 3 6
Payables for capital goods 2 -
3,503 5,516
Long-term Short-term
March 31, 2016 March 31, 2015 March 31, 2016 March 31, 2015
9. Provisions
Provision for employee benefits
Leave encashment - - 193 160
Gratuity (refer note 38) 299 150 77 124
Others
Interim dividend on equity shares - - - 1,000
Provision for income tax, net of advance tax - - 607 298
299 150 877 1,582
March 31, 2016 March 31, 2015
10. Short-term borrowings
From banks
Packing credit foreign currency loan (unsecured) [refer note (ii) , (iii), (iv) and (vi) below] 2,253 2,610
Packing credit foreign currency loan (secured) [refer note (i) below] 1,658 -
Cash credit (secured) [refer note (v) below] 2 -
Bank overdraft (unsecured) [refer note (vii) below] 36 -
3,949 2,610
The above amount includes
Secured borrowings 1,660 -
Unsecured borrowings 2,289 2,610
(i) Syngene has obtained foreign currency denominated short-term secured pre-shipment credit loans of ` 1,658 (USD 25 million) [March 31, 2015 - Nil] from Royal
Bank of Scotland N.V. that carries interest of LIBOR + 0.1% p.a. The loans are repayable after the end of 6 months from the date of its origination. The facility provided are secured by charge on fixed assets and current assets of Syngene.
(ii) Syngene had obtained foreign currency denominated short-term unsecured pre-shipment loans of ` 1,364 (USD 21.9 million) as of March 31, 2015 from banks that carry interest rate in the range of LIBOR + 0.15% to LIBOR+ 0.42% p.a. These facilities were repayable at the end of 6 months from the date of its origination and has
been repaid during the year.
(iii) The Company has obtained unsecured foreign currency denominated loans of ` 2,253 (USD 34 million) [March 31, 2015 ` Nil (USD Nil)], carrying an interest rate of
LIBOR plus 0.10% to 0.20% p.a. from banks. The facility is repayable within 120 to 180 days from the date of its origination.
(iv) The Company had obtained foreign currency denominated loan of ` 561 (USD 9 million) as at March 31, 2015, carrying an interest rate of LIBOR plus 0.35% p.a., from
a bank. The facility was repayable within 180 days from the date of its origination and has been repaid during the year.
(v) The Company has working capital facilities with a bank carrying interest rate ranging from 9.7% - 13% p.a. These facilities are repayable on demand, secured by
pari-passu first charge on inventories and trade receivables.
(vi) BRL had obtained foreign currency denominated loans of ` 685 (USD 11 million), carrying an interest rate of LIBOR + 0.35% to 0.50% p.a., from a bank as at March
31, 2015, which has been repaid during the year.
(viii) BPL has obtained unsecured overdraft facility from a bank carrying an interest rate of 9.25% p.a.
Credibly Capable | Annual Report 2016208

Financial Report
March 31, 2016 March 31, 2015
11.Trade payables
Trade payables
Total outstanding dues of micro and small enterprises 117 85
Total outstanding dues of creditors other than micro and small enterprises 5,354 4,208
5,471 4,293
12. Other current liabilities
Current maturities of long term borrowings (refer note 6) 104 866
Deferred revenues [refer note 42 and 13(iv)] 186 1,165
Funding received from co-developer towards fixed assets [refer note 13(iii)] 80 80
Investor Education and Protection Fund shall be credited by: (as and when due)
- Unclaimed dividend 10 6
Payables for capital goods 2,596 2,451
Advances from customers 2,427 2,208
Balance in current account with bank representing book overdraft 255 102
Other payables:
Statutory dues [refer note (i) below] 205 132
Others 116 52
5,979 7,062
(i) Statutory dues includes provident fund, employees state insurance, professional tax, withholding taxes and indirect tax payable.
(This space has been intentionally left blank)
Biocon Limited & Subsidiaries
209

13. Tangible assets
Land
[Refer note
(i), (ii) and
(vi)]
Buildings Leasehold
improvements
Plant and
equipments
[Refer note
(ix)]
Research and
development
equipments
Furniture
and
!xtures
Vehicles Total
Cost or Valuation
At April 1, 2014 1,290 5,240 3 17,695 1,982 509 27 26,746
Additions - 703 2 2,300 46 43 38 3,132
Disposals - - - 13 - - 6 19
Other adjustments
- Foreign currency translation adjustment (61) (30) - (18) - - - (109)
At March 31, 2015 1,229 5,913 5 19,964 2,028 552 59 29,750
Additions 130 657 - 2,254 60 83 6 3,190
Disposals - - - 85 - - 8 93
Other adjustments
- Foreign currency translation adjustment 14 6 1 4 - 1 - 26
At March 31, 2016 1,373 6,576 6 22,137 2,088 636 57 32,873
Depreciation
At April 1, 2014 - 1,160 1 9,252 1,010 270 18 11,711
Charge for the year - 216 3 1,755 174 67 4 2,219
Disposals - - - 13 - - 3 16
Other adjustments [refer note (xi) below] - 29 - - - - - 29
At March 31, 2015 - 1,405 4 10,994 1,184 337 19 13,943
Charge for the year - 255 1 1,984 155 71 6 2,472
Disposals - - - 80 - - 4 84
Other adjustments
- Foreign currency translation adjustment - 1 - 2 - - - 3
At March 31, 2016 - 1,661 5 12,900 1,339 408 21 16,334
Net Block
At March 31, 2015 1,229 4,508 1 8,970 844 215 40 15,807
At March 31, 2016 1,373 4,915 1 9,237 749 228 36 16,539
(i) Land includes land held on leasehold basis: Gross Block ` 226 (March 31, 2015 - ` 226); Net Block ` 226 (March 31, 2015 - ` 226).
(ii) On December 5, 2002, Karnataka Industrial Areas Development Board (‘KIADB’) allotted land aggregating to 26.75 acres to the Company for ` 64 on a lease-cum-
sale basis for a period of 6 years, extended subsequently for further period of 14 years. During the year ended March 31, 2005, the Company acquired an additional
41.25 acres of land for ` 99 from KIADB. During the quarter ended June 30, 2005, the Company paid an advance of ` 56 towards allotment of additional 19.68 acres
of land, offered to the Company by KIADB on December 20, 2003. The Company has received the possession certificate from KIADB in January 2006 and entered
into an agreement with KIADB to acquire this plot of land on lease-cum-sale basis for a period of 20 years during the year ended March 31, 2007. The registration
for a part of the land under this lease is pending settlement of certain disputes in respect of claims made against KIADB.
(iii) Additions to fixed assets during the year ended March 31, 2016, include assets of ` 278 (March 31, 2015 - ` 76) of which, ` 241 (March 31, 2015 - ` 38) has been
funded by the co-development partner/ customer. The Group has capitalised and depreciated the gross cost of these assets. The funding received from the co-development partner is reflected in note 8 and 12. The depreciation charge for the year has been adjusted for the proportionate amount recovered from the co-
development partner. Also refer note 28.
(iv) Additions to fixed assets during the year ended March 31, 2016, include assets of ` 25 (March 31, 2015 - ` 215) which have been funded by the customers. Syngene
has capitalised and depreciated the gross cost of these assets. The funding received from the customer is reflected as Deferred revenues in note 8 and note 12 and
the same is recognised as other operating revenue on a systematic basis over the useful life of the asset/period of contract. Cumulative amount of such funded
assets as at March 31, 2016 - ` 1,270 (March 31, 2015 - ` 1,245) (gross block).
(v) Syngene has entered into agreements with customers, which grant the customers an option to purchase fixed assets with gross block of ` 3,009 (March 31, 2015 - `
2,818) as at March 31,2016 relating to particular projects, upon satisfaction of certain terms and conditions. The consideration would be as per the terms of the
agreement, subject to amounts already funded/contributed by the customer.
(vi) During the year ended March 31, 2012, Biocon Sdn Bhd acquired freehold land in Johor Malaysia at an aggregate consideration of approximately RM 45 million for
the construction of biopharmaceutical manufacturing facility. The freehold land has been offered as a security to the lenders of the term loan facilities. Also refer
note 6(x).
(vii) As at March 31, 2016, BRL holds equipments received on loan basis from co- development partner for use in the joint development program amounting to ` 68
(March 31, 2015 - ` 68).
(viii) Plant and equipments includes office equipments and computer equipments.
(ix) Also refer note 35 (b) for assets given on lease.
(x) The Company has acquired the business assets of the pharmaceutical manufacturing unit of M/s. Acacia Lifesciences Private Limited located at Vishakhapatnam with effect from October 01, 2015 on a going concern basis for a consideration of ` 531. Fixed assets have been recorded on the fair valuation basis, performed by
an independent valuer, including the assessment of remaining useful life of fixed assets. Stamp duty of ` 11 has been incurred and capitalized in addition to the value of fixed assets capitalized. Goodwill of ` 77 has been recorded being the excess of purchase consideration over the value of net assets acquired. The useful life
of goodwill has been estimated to be 5 years.
(xi) During the year ended March 31, 2015 depreciation of ` 29 (net of deferred tax impact) had been adjusted to the opening balance of surplus in the Statement of profit
and loss as at April 1, 2014, with corresponding adjustment to net book value of fixed assets, in accordance with the transitional provisions of Schedule II of the Act.
Credibly Capable | Annual Report 2016210
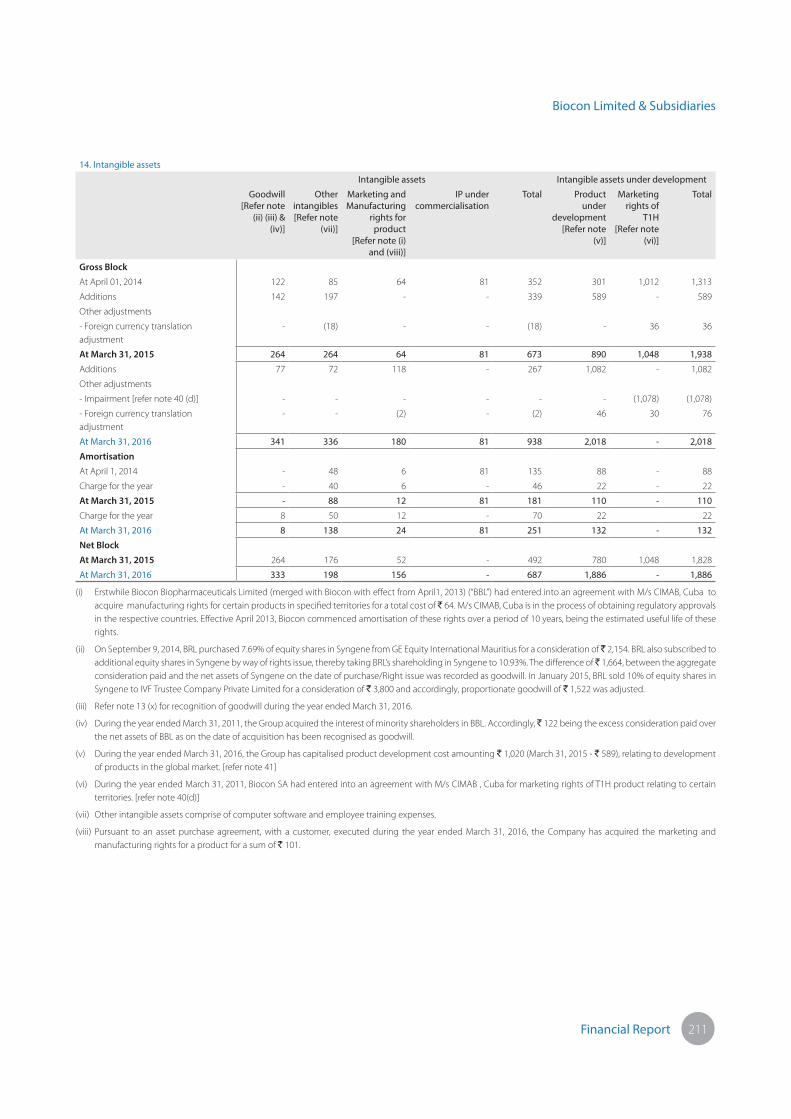
Financial Report
14. Intangible assets
Intangible assets Intangible assets under development
Goodwill
[Refer note
(ii) (iii) &
(iv)]
Other
intangibles
[Refer note
(vii)]
Marketing and
Manufacturing
rights for
product
[Refer note (i)
and (viii)]
IP under
commercialisation
Total Product
under
development
[Refer note
(v)]
Marketing
rights of
T1H
[Refer note
(vi)]
Total
Gross Block
At April 01, 2014 122 85 64 81 352 301 1,012 1,313
Additions 142 197 - - 339 589 - 589
Other adjustments
- Foreign currency translation
adjustment
- (18) - - (18) - 36 36
At March 31, 2015 264 264 64 81 673 890 1,048 1,938
Additions 77 72 118 - 267 1,082 - 1,082
Other adjustments
- Impairment [refer note 40 (d)] - - - - - - (1,078) (1,078)
- Foreign currency translation
adjustment
- - (2) - (2) 46 30 76
At March 31, 2016 341 336 180 81 938 2,018 - 2,018
Amortisation
At April 1, 2014 - 48 6 81 135 88 - 88
Charge for the year - 40 6 - 46 22 - 22
At March 31, 2015 - 88 12 81 181 110 - 110
Charge for the year 8 50 12 - 70 22 22
At March 31, 2016 8 138 24 81 251 132 - 132
Net Block
At March 31, 2015 264 176 52 - 492 780 1,048 1,828
At March 31, 2016 333 198 156 - 687 1,886 - 1,886
(i) Erstwhile Biocon Biopharmaceuticals Limited (merged with Biocon with effect from April1, 2013) (“BBL”) had entered into an agreement with M/s CIMAB, Cuba to
acquire manufacturing rights for certain products in specified territories for a total cost of ` 64. M/s CIMAB, Cuba is in the process of obtaining regulatory approvals
in the respective countries. Effective April 2013, Biocon commenced amortisation of these rights over a period of 10 years, being the estimated useful life of these
rights.
(ii) On September 9, 2014, BRL purchased 7.69% of equity shares in Syngene from GE Equity International Mauritius for a consideration of ̀ 2,154. BRL also subscribed to
additional equity shares in Syngene by way of rights issue, thereby taking BRL’s shareholding in Syngene to 10.93%. The difference of ̀ 1,664, between the aggregate
consideration paid and the net assets of Syngene on the date of purchase/Right issue was recorded as goodwill. In January 2015, BRL sold 10% of equity shares in
Syngene to IVF Trustee Company Private Limited for a consideration of ` 3,800 and accordingly, proportionate goodwill of ` 1,522 was adjusted.
(iii) Refer note 13 (x) for recognition of goodwill during the year ended March 31, 2016.
(iv) During the year ended March 31, 2011, the Group acquired the interest of minority shareholders in BBL. Accordingly, ` 122 being the excess consideration paid over
the net assets of BBL as on the date of acquisition has been recognised as goodwill.
(v) During the year ended March 31, 2016, the Group has capitalised product development cost amounting ` 1,020 (March 31, 2015 - ` 589), relating to development
of products in the global market. [refer note 41]
(vi) During the year ended March 31, 2011, Biocon SA had entered into an agreement with M/s CIMAB , Cuba for marketing rights of T1H product relating to certain
territories. [refer note 40(d)]
(vii) Other intangible assets comprise of computer software and employee training expenses.
(viii) Pursuant to an asset purchase agreement, with a customer, executed during the year ended March 31, 2016, the Company has acquired the marketing and
manufacturing rights for a product for a sum of ` 101.
Biocon Limited & Subsidiaries
211
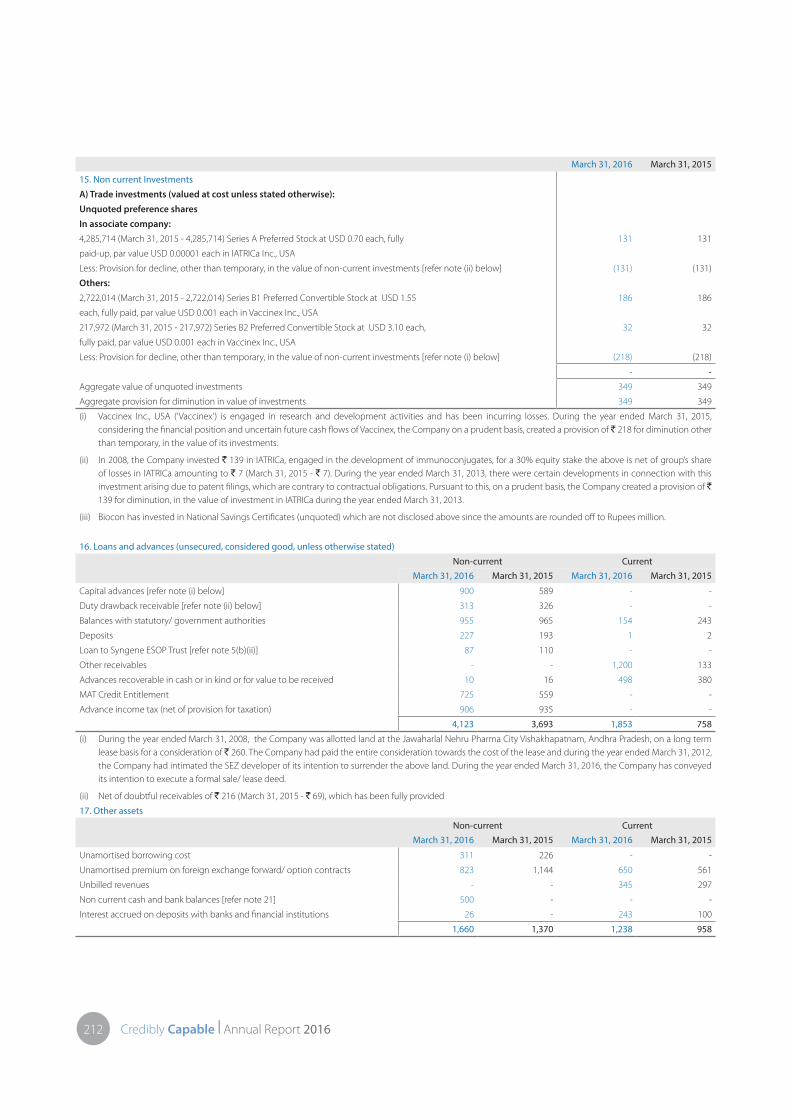
March 31, 2016 March 31, 2015
15. Non current Investments
A) Trade investments (valued at cost unless stated otherwise):
Unquoted preference shares
In associate company:
4,285,714 (March 31, 2015 - 4,285,714) Series A Preferred Stock at USD 0.70 each, fully 131 131
paid-up, par value USD 0.00001 each in IATRICa Inc., USA
Less: Provision for decline, other than temporary, in the value of non-current investments [refer note (ii) below] (131) (131)
Others:
2,722,014 (March 31, 2015 - 2,722,014) Series B1 Preferred Convertible Stock at USD 1.55 186 186
each, fully paid, par value USD 0.001 each in Vaccinex Inc., USA
217,972 (March 31, 2015 - 217,972) Series B2 Preferred Convertible Stock at USD 3.10 each, 32 32
fully paid, par value USD 0.001 each in Vaccinex Inc., USA
Less: Provision for decline, other than temporary, in the value of non-current investments [refer note (i) below] (218) (218)
- -
Aggregate value of unquoted investments 349 349
Aggregate provision for diminution in value of investments 349 349
(i) Vaccinex Inc., USA (‘Vaccinex’) is engaged in research and development activities and has been incurring losses. During the year ended March 31, 2015,
considering the financial position and uncertain future cash flows of Vaccinex, the Company on a prudent basis, created a provision of ` 218 for diminution other
than temporary, in the value of its investments.
(ii) In 2008, the Company invested ` 139 in IATRICa, engaged in the development of immunoconjugates, for a 30% equity stake the above is net of group’s share
of losses in IATRICa amounting to ` 7 (March 31, 2015 - ` 7). During the year ended March 31, 2013, there were certain developments in connection with this
investment arising due to patent filings, which are contrary to contractual obligations. Pursuant to this, on a prudent basis, the Company created a provision of `
139 for diminution, in the value of investment in IATRICa during the year ended March 31, 2013.
(iii) Biocon has invested in National Savings Certificates (unquoted) which are not disclosed above since the amounts are rounded off to Rupees million.
16. Loans and advances (unsecured, considered good, unless otherwise stated)
Non-current Current
March 31, 2016 March 31, 2015 March 31, 2016 March 31, 2015
Capital advances [refer note (i) below] 900 589 - -
Duty drawback receivable [refer note (ii) below] 313 326 - -
Balances with statutory/ government authorities 955 965 154 243
Deposits 227 193 1 2
Loan to Syngene ESOP Trust [refer note 5(b)(ii)] 87 110 - -
Other receivables - - 1,200 133
Advances recoverable in cash or in kind or for value to be received 10 16 498 380
MAT Credit Entitlement 725 559 - -
Advance income tax (net of provision for taxation) 906 935 - -
4,123 3,693 1,853 758
(i) During the year ended March 31, 2008, the Company was allotted land at the Jawaharlal Nehru Pharma City Vishakhapatnam, Andhra Pradesh, on a long term
lease basis for a consideration of ` 260. The Company had paid the entire consideration towards the cost of the lease and during the year ended March 31, 2012,
the Company had intimated the SEZ developer of its intention to surrender the above land. During the year ended March 31, 2016, the Company has conveyed
its intention to execute a formal sale/ lease deed.
(ii) Net of doubtful receivables of ` 216 (March 31, 2015 - ` 69), which has been fully provided
17. Other assets
Non-current Current
March 31, 2016 March 31, 2015 March 31, 2016 March 31, 2015
Unamortised borrowing cost 311 226 - -
Unamortised premium on foreign exchange forward/ option contracts 823 1,144 650 561
Unbilled revenues - - 345 297
Non current cash and bank balances [refer note 21] 500 - - -
Interest accrued on deposits with banks and financial institutions 26 - 243 100
1,660 1,370 1,238 958
Credibly Capable | Annual Report 2016212

Financial Report
18. Current investments (valued at lower of cost and fair value, unless stated otherwise)
Investments in mutual funds (unquoted, fully paid-up)
Face value March 31, 2016 March 31, 2016 March 31, 2015 March 31, 2015
(`/ unit) Units Amount Units Amount
DWS Banking & PSU Debt Fund - Weekly Dividend Reinvestment 10 70,409,716 724 - -
Birla Sun Life Savings Fund - Daily Dividend - Regular Plan 100 5,016,970 503 2,521,503 253
ICICI Prudential Flexible Income - Regular Plan - Daily Dividend 106 4,689,806 496 2,391,423 253
HDFC Floating Rate Income Fund -Short Term -Whole Sale Plan - Dividend
Reinvestment
10 49,241,163 496 14,034,587 141
Reliance Banking & PSU Debt Fund Weekly Dividend Plan 10 46,064,513 465 - -
JP Morgan Banking & PSU Debt Fund - Weekly Dividend Reinvestment Option 10 24,569,495 258 - -
UTI-Treasury Advantage Fund - Daily Dividend Reinvestment 1,002 252,021 253 - -
Reliance Liquid Fund - Regular Plan - Daily Dividend 1,529 154,108 236 125,892 192
Axis Liquid Fund - Daily Dividend Reinvestment 1,000 200,433 201 98,005 98
HDFC Liquid Fund - Daily Dividend Reinvestment 1,020 171,988 175 - -
SBI Premier Liquid Fund - Regular Plan - Daily Dividend 1,003 154,313 155 - -
Reliance Money Manager Fund - Daily Dividend Plan 1,004 151,044 152 - -
ICICI FMP Series 78 - 95 D Plan K Dividend 10 13,003,654 130 - -
Baroda Pioneer Liquid Fund - Plan A Daily Dividend 1,001 40,637 41 - -
Tata Liquid Fund Plan A- Daily Dividend 1,115 - - 229,233 255
IDFC Cash Fund - Daily Dividend -(Regular Plan) 1,000 - - 158,344 158
TATA Fixed Maturity Plan Series 47 Scheme C - Plan A - Growth 10 - - 15,000,000 150
HDFC Liquid Fund - Daily Dividend Reinvestment 10 - - 13,832,802 141
Reliance Liquidity Fund - Daily Dividend Reinvestment Option 1,001 - - 135,112 135
TATA Floater Fund Plan A - Daily Dividend 1,004 - - 125,068 126
Kotak Liquid Fund Plan A - Regular Plan - Daily Dividend 1,223 - - 99,734 122
Birla Sun Life Cash Plus - Daily Dividend 100 - - 748,871 75
ICICI Prudential Liquid - Regular Plan - Daily Dividend. 100 - - 699,774 70
Reliance Liquid Fund - Cash Plan - Daily Dividend Option - Direct 1,114 - - 45,147 53
JP Morgan Liquid Fund - Daily Dividend 10 - - 4,033,108 40
Kotak Liquid Scheme Plan A - Direct Plan - Daily Dividend 1,223 - - 18,308 22
HDFC Liquid Fund - Direct Plan -Daily Dividend 10 - - 1,013,825 10
Birla Sun Life Cash Plus - Daily Dividend- Direct Plan 100 - - 93,857 9
4,285 2,303
Aggregate value of unquoted investments 4,285 2,303
(This space has been intentionally left blank)
Biocon Limited & Subsidiaries
213

March 31, 2016 March 31, 2015
19. Inventories (at lower of cost and net realisable value)
Raw materials, including goods-in-bond [refer note 24]* 1,359 1,205
Packing materials [refer note 24] 324 209
Work-in-progress [refer note 25 (b)] 1,707 1,436
Traded goods [refer note 25 (b)] 323 320
Finished goods [refer note 25 (b)] 1,401 1,357
5,114 4,527
* includes goods in-transit ` 151 (March 31, 2015 - ` Nil)
20. Trade receivables (unsecured)
Outstanding for a period exceeding six months from the date they are due for payment
Considered good 113 53
Doubtful 56 105
169 158
Provision for doubtful receivables (56) (105)
113 53
Other trade receivables
Considered good 8,116 7,652
8,229 7,705
The above includes:
Due from Narayana Hrudayalaya Limited (‘NHL’) [formerly known as Narayana Hrudayalaya Private Limited] in which a
director of the Company is a member of Board of Directors of NHL.
8 5
21. Cash and bank balances
Cash and cash equivalents
Balances with banks:
On current accounts [refer note (ii) below] 7,104 4,585
On unpaid dividend account 10 6
Deposits with original maturity of less than 3 months 4,155 34
Cash on hand 1 1
11,270 4,626
Other bank balances
Deposits with maturity of less than 12 months 4,020 3,746
Deposits with maturity of more than 12 months - 1,000
Margin money deposit [refer note (i) below] 3 3
Deposit with !nancial institutions
Deposits with maturity of less than 12 months 3,920 -
Deposits with maturity of more than 12 months 500 -
19,713 9,375
Less: Amount disclosed under other non-current assets (500) -
19,213 9,375
(i) Margin money deposits with carrying amount of ` 3 (March 31, 2015 - ` 3) are subject to first charge against bank guarantees obtained.
(ii) Includes ` 3,318 (March 31, 2015 - Nil) held in Nostro accounts by banks on behalf of Syngene.
(This space has been intentionally left blank)
Credibly Capable | Annual Report 2016214

Financial Report
March 31, 2016 March 31, 2015
22. Revenue from operations
Sale of products
Finished goods 20,051 19,166
Traded goods 2,843 2,783
Sale of services
Licensing and development fees 761 433
Contract research and manufacturing services income 10,730 8,225
Capacity reservation fees - 311
Other operating revenue
Sale of process waste 151 149
Others 653 157
Revenue from operations (gross) 35,189 31,224
Less: Excise duty [refer note (a) below] 335 326
Revenue from operations (net) 34,854 30,898
Excise duty on sales amounting to ` 335 [March 31, 2015 - ` 326] has been reduced from revenue from operations in the
statement of profit and loss and excise duty on (increase)/decrease in stock amounting to ` (2) [March 31, 2015 - ` (5)] has
been considered as (income)/ expense in note 27 of financial statements.
Details of products sold
Finished goods sold
Biopharmaceuticals 16,208 15,776
Formulations 3,843 3,390
20,051 19,166
Traded goods
Biopharmaceuticals 84 37
Formulations 2,759 2,746
2,843 2,783
23. Other income
Interest income on:
Deposits with banks and financial institutions 403 111
Others 30 9
Dividend earned on current investments 204 226
Net gain on sale of current investments 16 14
Other non-operating income 192 171
845 531
24. Cost of raw materials and packing materials consumed
Inventory at the beginning of the year 1,414 1,197
Add: Purchases 12,818 12,187
Less: Inventory at the end of the year 1,683 1,414
Cost of raw materials and packing materials consumed 12,549 11,970
(This space has been intentionally left blank)
Biocon Limited & Subsidiaries
215

March 31, 2016 March 31, 2015
25. (a) Purchase of traded goods
Details of purchase of traded goods:
Biopharmaceuticals 16 24
Formulations 1,054 1,086
1,070 1,110
25. (b) (Increase)/ Decrease in inventories of !nished goods, traded goods and work-in-progress
Inventory at the beginning of the year
Traded goods 320 325
Finished goods, net of excise duty 1,357 815
Work-in-progress 1,436 1,429
Traded goods of NeoBiocon, pursuant to acquisition [refer note 1] - 25
3,113 2,594
Inventory at the end of the year
Traded goods 323 320
Finished goods, net of excise duty 1,401 1,357
Work-in-progress 1,707 1,436
3,431 3,113
(Increase)/ Decrease in inventories (318) (519)
Details of inventory:
Traded goods
Biopharmaceuticals - -
Formulations 323 320
323 320
Finished goods, net of excise duty
Biopharmaceuticals 933 1,028
Formulations 468 329
1,401 1,357
Work-in-progress
Biopharmaceuticals 1,686 1,430
Formulations 25 6
1,711 1,436
26. Employee bene!ts expense
Salaries, wages and bonus 5,766 5,067
Contribution to provident and other funds 221 199
Gratuity (refer note 38) 102 74
Employee stock compensation expense 129 60
Welfare expenses 324 272
6,542 5,672
Less: Expenses capitalized to fixed assets [refer note 41 (a)] (179) (338)
6,363 5,334
(This space has been intentionally left blank)
Credibly Capable | Annual Report 2016216

Financial Report
March 31, 2016 March 31, 2015
27. Other expenses
Royalty and technical fees 24 23
Rent 39 42
Communication expenses 64 53
Travelling and conveyance 483 485
Professional charges 577 745
Directors’ fees including commission 33 34
Power and fuel 1,942 1,767
Insurance 62 54
Rates, taxes and fees, net of refunds of taxes 199 202
Lab consumables 597 486
Repairs and maintenance
Plant and machinery 474 415
Buildings 143 87
Others 497 264
Selling expenses
Freight outwards and clearing charges 304 269
Sales promotion expenses 576 596
Commission and brokerage (other than sole selling agents) 259 222
(Increase)/ decrease in excise duty on inventory [refer note 22 (a)] (2) (5)
Bad debts written off 8 -
Provision/ (reversal) for doubtful debts (47) 61
Printing and stationery 58 42
Foreign exchange loss (net) 129 200
Research and development expenses 2,663 1,934
Clinical trial and development expenses 80 66
CSR expenditure [refer note 45] 112 93
Miscellaneous expenses 444 373
9,718 8,508
Less: Adjustment of product development expenses with deferred revenues [refer note (a) below] (152) (295)
Less: Expenses capitalized to fixed assets [refer note 41 (a)] (1,256) (847)
8,310 7,366
(a) Research and development expenses of ` 152 (March 31, 2015 - ` 295) incurred towards Biosimilar Insulin program
subsequent to the date of termination of the Pfizer arrangement have been adjusted against the amounts received
from Pfizer. Refer note 42.
28. Depreciation and amortisation (net)
Depreciation of tangible assets [refer note 13] 2,472 2,219
Amortisation of intangible assets [refer note 14] 92 68
Less: Depreciation on assets partly funded by customers/ co-development partners [refer note 13] (90) (77)
Less: Expenses capitalized to fixed assets [refer note 41(a)] (51) -
2,423 2,210
29. Finance costs
Interest expense 328 157
Exchange difference to the extent considered as an adjustment to borrowing cost 106 65
Less: Expenses capitalized to fixed assets [refer note 41(a)] (332) (133)
102 89
30. Research and development expenses
Research and development expenses (a) 2,663 1,934
Other research and development expenses included in other heads (b) 2,579 1,959
(a + b) 5,242 3,893
Recovery of product development costs from co-development partners (net) (1,320) (1,321)
Adjustment of product development expenses with deferred revenues [refer note 27 (a)] (152) (295)
Product development costs capitalised [refer note 41(a)] (1,020) (589)
2,750 1,688
Research and development expenses on Buildings and Equipment (net of funding
received from co-development partners)
Buildings - 1
Equipment (net of disposals) 80 46
80 47
Biocon Limited & Subsidiaries
217

31. Employee stock compensation
(a) Biocon ESOP Plan:
On September 27, 2001, Biocon’s Board of Directors approved the Biocon Employee Stock Option Plan (‘ESOP Plan 2000’) for the grant of stock options to the employees
of the Company and its subsidiaries/ joint venture company. The Nomination and Remuneration Committee (‘Remuneration Committee’) administers the plan through
a trust established specifically for this purpose, called the Biocon India Limited Employee Welfare Trust (ESOP Trust).
The ESOP Trust shall make additional purchase of equity shares of the Company using the proceeds from the loan obtained from the Company, other cash inflows from
allotment of shares to employees under the ESOP Plan and shall subscribe, when allotted to such number of shares as is necessary for transferring to the employees. The
ESOP Trust may also receive shares from the promoters for the purpose of issuance to the employees under the ESOP Plan. The Remuneration Committee shall determine
the exercise price which will not be less than the face value of the shares.
Grant I
In September 2001, the Company granted 71,510 options (face value of shares - ` 5 each) under the ESOP Plan 2000 to be exercised at a grant price of ` 10 (before
adjusting bonus and share split). The options vested with the employees equally over a four year period.
Grant II
In January 2004, the Company granted 142,100 options (face value of shares - ` 5 each) under ESOP Plan 2000 to be exercised at a price of ` 5 per share. The options vest
with the employees equally over a four year period.
Grant III
In January 2004, the Board of Directors announced the Biocon Employee Stock Option Plan (ESOP Plan 2004) for the grant of stock options to the employees of the
Company and its subsidiaries/ joint venture company, pursuant to which the Remuneration Committee on March 19, 2004 granted 422,000 options (face value of shares
- ̀ 5 each) under the ESOP Plan 2004 to be exercised at a grant price of ̀ 315 being the issue price determined for the IPO through the book building process. The options
vest with the employees equally over a four year period.
Grant IV
In July 2006, the Company approved the grant of 3,478,200 options (face value of shares - ` 5 each) to its employees under the existing ESOP Plan 2000. The options
under this grant would vest to the employees as 25%, 35% and 40% of the total grant at the end of first second and third year from the date of grant for existing
employees and at the end of third, fourth and fifth year from the date of grant for new employees. Exercise period is three years for each grant. The conditions for number
of options granted include service terms and performance grade of the employees. These options are exercisable at a discount of 20% to the market price of Company’s
shares on the date of grant.
Details of Grant IV
Particulars March 31, 2016 March 31, 2015
No of Options * Weighted Average
Exercise Price (`)*
No of Options * Weighted Average
Exercise Price (`)*
Outstanding at the beginning of the year 61,625 185 120,900 185
Granted during the year - - - -
Forfeited during the year - - 2,750 227
Exercised during the year 55,250 179 56,525 187
Expired during the year 2,875 154 - -
Outstanding at the end of the year 3,500 231 61,625 185
Exercisable at the end of the year 3,500 231 61,625 187
Weighted average remaining contractual life (in years) 0.3 - 0.1 -
*adjusted for the effect of bonus shares
Grant V
In April 2008, the Company approved the grant to its employees under the existing ESOP Plan 2000. The options under this grant would vest to the employees as 25%,
35% and 40% of the total grant at the end of first second and third year from the date of grant for existing employees and at the end of third, fourth and fifth year from
the date of grant for new employees. Exercise period is three years for each grant. The conditions for number of options granted include service terms and performance
grade of the employees. These options are exercisable at the market price of Company’s shares on the date of grant.
(This space has been intentionally left blank)
Credibly Capable | Annual Report 2016218

Financial Report
Details of Grant V
Particulars March 31, 2016 March 31, 2015
No of
Options*
Weighted Average
Exercise Price (`)*
No of
Options*
Weighted Average
Exercise Price (`)*
Outstanding at the beginning of the year 1,151,975 336 1,512,070 316
Granted during the year - - 78,000 467
Forfeited during the year 269,087 324 402,525 291
Exercised during the year 91,013 303 35,570 296
Expired during the year - - - -
Outstanding at the end of the year 791,875 343 1,151,975 336
Exercisable at the end of the year 220,638 310 168,475 301
Weighted average remaining contractual life (in years) 4.6 4.9 -
Weighted average fair value of options granted (`) 226
*adjusted for the effect of bonus shares
Grant VI
In July 2014, the Company approved the grant to its employees under the existing ESOP Plan 2000. The options under this grant would vest to the employees as 10%,
20%, 30% and 40% of the total grant at the end of first, second, third and fourth year from the date of grant, respectively, with an exercise period ending one year from
the end of last vesting. The vesting conditions include service terms and performance grade of the employees. These options are exercisable at the closing market price
of Company’s shares existing on the date preceding to the date of grant.
Details of Grant VI
Particulars March 31, 2016 March 31, 2015
No of
Options
Weighted Average
Exercise Price (`)
No of
Options
Weighted Average
Exercise Price (`)
Outstanding at the beginning of the year 1,346,152 470 - -
Granted during the year - - 1,447,440 470
Forfeited during the year 160,313 470 101,288 470
Exercised during the year - - - -
Expired during the year - - - -
Outstanding at the end of the year 1,185,839 470 1,346,152 470
Exercisable at the end of the year 116,750 470 - -
Weighted average remaining contractual life (in years) 3.3 - 4.4 -
Weighted average fair value of options granted (`) 180
Grant VII
In July 2014, the Company approved the grant to its employees under the existing ESOP Plan 2000. The options under this grant would vest to the employees as 10%,
20%, 30% and 40% of the total grant at the end of first, second, third and fourth year from the date of grant, respectively, with an exercise period ending one year from
the end of last vesting. The vesting conditions include service terms and performance grade of the employees. These options are exercisable at the closing market price
of Company’s shares existing on the date preceding to the date of grant.
Details of Grant VII
Particulars March 31, 2016 March 31, 2015
No of
Options
Weighted Average
Exercise Price (`)
No of
Options
Weighted Average
Exercise Price (`)
Outstanding at the beginning of the year 293,000 452 - -
Granted during the year 1,077,500 461 293,000 452
Forfeited during the year 95,000 472 - -
Exercised during the year - - - -
Expired during the year - - - -
Outstanding at the end of the year 1,275,500 461 293,000 452
Exercisable at the end of the year - - - -
Weighted average remaining contractual life (in years) 6.0 6.7
Weighted average fair value of options granted (`) 185 205
Grant VIII
In July 2015, the Company approved the grant to its employees under the existing ESOP Plan 2000. The options under this grant would vest to the employees as 10%,
20%, 30% and 40% of the total grant at the end of first, second, third and fourth year from the date of grant, respectively, with an exercise period ending one year from
the end of last vesting. The vesting conditions include service terms and performance grade of the employees. These options are exercisable at the closing price as per
National Stock Exchange as on the last day of the month preceding the month of first grant.
Biocon Limited & Subsidiaries
219

Details of Grant VIII
Particulars March 31, 2016 March 31, 2015
No of
Options
Weighted Average
Exercise Price (`)
No of
Options
Weighted Average
Exercise Price (`)
Outstanding at the beginning of the year - - - -
Granted during the year 312,500 459 - -
Forfeited during the year - - - -
Exercised during the year - - - -
Expired during the year - - - -
Outstanding at the end of the year 312,500 459 - -
Exercisable at the end of the year - - - -
Weighted average remaining contractual life (in years) 4.6 -
Weighted average fair value of options granted (`) 154 -
The average market price of the Company’s share during the year ended March 31, 2016 is ` 462 (March 31, 2015 - ` 459) per share.
Assumptions used in determination of the fair value of the stock options under the Black Scholes Model are as follows:
Particulars March 31, 2016 March 31, 2015
Weighted Average Exercise Price 459-461 467
Expected volatility 29% to 34.5% 34.18%
Historical volatility 34.18% 31.15%
Life of the options granted (vesting and exercise period) in years 4.6-6.0 5.5
Expected dividend per share 5.00 5.00
Average risk-free interest rate 7.65% 7.93%
Expected dividend rate 1.10% 1.09%
(b) RSU Plan 2015:
On March 11, 2015, Biocon’s and Remuneration Committee approved the Biocon Stock Options - Restricted Stock Units (RSUs) of Synegene (‘RSU Plan 2015’) for the
grant of RSUs to the employees of the Company and its subsidiaries, other than Syngene. The Remuneration Committee administers the plan through a trust established
specifically for this purpose, called the Biocon Limited Employee Welfare Trust. For this purpose on March 31, 2015, the Company transferred 2,000,000 equity shares of
Syngene to Biocon Limited Employee Welfare Trust.
In April 2015, the Company approved the grant to its employees under the RSU Plan 2015. The RSUs under this grant would vest to the employees as 10%, 20%, 30% and
40% of the total grant at the end of first, second, third and fouth year from the date of grant, respectively, with an exercise period ending one year from the end of last
vesting. The vesting conditions include service terms and performance grade of the employees. Exercise price of RSUs will be Nil.
Particulars March 31, 2016
No of
Options
Weighted Average
Exercise Price (`)
Outstanding at the beginning of the year - -
Granted during the year 1,364,148 -
Forfeited during the year 132,345 -
Exercised during the year - -
Expired during the year - -
Outstanding at the end of the year 1,231,803 -
Exercisable at the end of the year - -
Weighted average remaining contractual life (in years) 4.8
Weighted average fair value of options granted (`) 162
Assumptions used in determination of the fair value of the stock options under the Black Scholes Model are as follows:
Particulars March 31, 2016 March 31, 2015
Weighted Average Exercise Price - -
Expected volatility 29.92% -
Historical volatility 29.92% -
Life of the options granted (vesting and exercise period) in years 4.8 -
Expected dividend per share 1 -
Average risk-free interest rate 7.65% -
Expected dividend rate 0.30% -
(c) Syngene ESOP Plan:
On July 20, 2012, Syngene Employee Welfare Trust (‘Trust’) was created for the welfare and benefit of the employees and directors of Syngene and subsidiary company.
The Board of Directors of Syngene has approved the employee stock option plan of Syngene. On October 31, 2012 the Trust subscribed 1,875,000 equity shares (face
value of ` 5 per share) of Syngene using the proceeds from interest free loan of ` 150 obtained from Syngene. The loan granted and receivable from the Trust has been
Credibly Capable | Annual Report 2016220

Financial Report
adjusted in the shareholders’ funds as per the Guidance Note on Accounting for Employee Share-based Payments issued by Institute of Chartered Accountants of India.
As at March 31, 2016, the Trust holds 5,919,219 (March 31, 2015 - 6,680,000) equity shares of face value: ̀ 10 each, adjusted for the consolidation of shares and bonus issue.
During the year ended March 31, 2015 the Trust transferred 760,781 (March 31, 2015 - Nil) equity shares to the employees on exercise of their stock options.
Grant
Pursuant to the Scheme, Syngene has granted options to eligible employees under Syngene Employee Stock Option Plan - 2011. Each option entitles for one equity
share. The options under this grant will vest to the employees as 25%, 35% and 40% of the total grant at end of second, third and fourth year from the date of grant,
respectively, with an exercise period of three years for each grant. The vesting conditions include service terms and performance grades of the employees. These options
are exercisable at an exercise price of ` 80 per share (face value of ` 5 per share).
Details of Grant
Particulars March 31, 2016 March 31, 2015
No of
Options
Weighted Average
Exercise Price (`)
No of
Options
Weighted Average
Exercise Price (`)
Outstanding at the beginning of the year 5,057,100 23 1,580,340 80
Granted during the year 930,583 23 59,700 80
Forfeited during the year 284,067 22 220,540 80
Exercised during the year 760,781 22 - -
Outstanding at the end of the year 4,942,835 22 1,419,500 80
Decrease in Number of options as a result of consolidation of
shares [refer note (i) below]
- - (709,750)
Increase in Number of options as a result of Bonus issue
[refer note (ii) below]
- - 4,347,350
Outstanding at the end of the year as adjusted 4,942,835 22 5,057,100 23*
Exercisable at the end of the year 434,494 22 - -
Weighted average fair market value of shares granted (In `) 394 140*
Weighted average share price at the date of exercise (In `) 367 -
* adjusted for matters as discussed in point (i) & (ii) below.
The weighted average fair value of the options granted during the year ended March 31, 2016 is in the range of ` 372* [March 31, 2015 - ` 125* - ` 128*] face value of
` 10 each per option, under Black Scholes Model. The weighted average remaining contractual life for the stock options outstanding as at March 31, 2016 is 2.96 years
[March 31, 2015 - 4.69 years].
Assumptions used in determination of the fair value of the stock options under the Black Scholes Model are as follows:
Particulars March 31, 2016 March 31, 2015
Dividend yield (%) 0.03% -
Exercise Price (In `) 23* 23*
Volatility 29.10% 50.40% - 53.30%
Life of the options granted (vesting and exercise period) in years 5.69 years 6.15 years
Average risk-free interest rate 7.48% 8.57% - 8.59%
(i) The Shareholders’ of Syngene at the Extraordinary General Meeting (‘EGM’) of Syngene held on March 16, 2015, approved the consolidation (i.e. reverse share split) of
2 equity shares of face value of ` 5 each into 1 equity share of face value of ` 10 each.
(ii) The Shareholders’ of Syngene at the EGM of Syngene held on March 16, 2015, approved the issue of fully paid bonus shares of face value of ` 10 each in the ratio of
1:6.1253329 by capitalisation of Securities premium account.
Since the Group uses the intrinsic value method for determination of the employee stock compensation expense, the impact on the reported net profit and earnings
per share under the fair value approach is as given below :
Particulars March 31, 2016 March 31, 2015
Net profit after taxes 8,961 4,974
Add: Employee stock compensation under intrinsic value * 123 51
Less: Employee stock compensation under fair value * 177 136
Proforma net profit after taxes 8,908 4,889
Earnings per share - Basic
- As reported 44.81 24.87
- Proforma 44.54 24.44
Earnings per share - Diluted
- As reported 44.81 24.87
- Proforma 44.54 24.44
* After adjustment of share of minority interest.
Biocon Limited & Subsidiaries
221

A summary of movement in respect of the shares held by the ESOP Trust is as follows:
Particulars March 31, 2016 March 31, 2015
Opening balance of equity shares not exercised by employees and available with the ESOP Trust 3,674,928 3,767,023
Add: Shares purchased by the ESOP Trust 345,663 -
Less: Shares exercised by employees (146,263) (92,095)
Closing balance of equity shares not exercised by employees and available with the ESOP Trust 3,874,328 3,674,928
Options granted and eligible for exercise at end of the year 340,888 230,100
Options granted but not eligible for exercise at end of the year 3,228,326 2,622,652
32. Reconciliation of basic and diluted shares used in computing earnings per share
March 31, 2016 March 31, 2015
Basic outstanding shares 200,000,000 200,000,000
Add: Effect of dilutive options granted but not exercised/ not yet eligible for exercise - -
Weighted average shares outstanding and potential options outstanding 200,000,000 200,000,000
(This space has been intentionally left blank)
Credibly Capable | Annual Report 2016222

Financial Report
33
. Re
late
d p
art
y tr
an
sact
ion
s
Sl
No
Na
me
of
the
re
late
d p
art
yR
ela
tio
nsh
ipD
esc
rip
tio
nA
pri
l 1, 2
01
5 t
o
Ma
rch
31
, 20
16
Inco
me
/(E
xpe
nse
s)
/Oth
er
tra
nsa
ctio
ns
Ba
lan
ce a
s a
t
Ma
rch
31
, 20
16
(Pa
yab
le)/
Re
ceiv
ab
le
Ap
ril 1
, 20
14
to
Ma
rch
31
, 20
15
Inco
me
/(E
xpe
nse
s)
/Oth
er
tra
nsa
ctio
ns
Ba
lan
ce a
s a
t
Ma
rch
31
, 20
15
(Pa
yab
le)/
Re
ceiv
ab
le
A. R
em
un
era
tio
n t
o K
ey
ma
na
ge
ria
l pe
rso
nn
el
[re
fer
no
te (
iv)
be
low
]
1
Kir
an M
azu
md
ar-S
haw
Ch
airp
ers
on
& M
anag
ing
Dir
ect
or
Sala
ry a
nd
pe
rqu
isit
es
(1
6)
-
(1
6)
-
2
Joh
n S
haw
Vic
e C
hai
rman
& D
ire
cto
rSa
lary
an
d p
erq
uis
ite
s (
16
) -
(
15
) -
3
Aru
n C
han
dav
arka
rJo
int
Man
agin
g D
ire
cto
r &
CEO
Sala
ry a
nd
pe
rqu
isit
es
[re
fer
no
te (
v)]
(3
1)
-
(2
7)
-
(w.e
.f A
pri
l 24
, 20
14
)
4
Mu
rali
Kri
shn
an K
NP
resi
de
nt
- G
rou
p F
inan
ceSa
lary
an
d p
erq
uis
ite
s -
-
(
23
) -
(up
to J
uly
31
, 20
14
)
5
Sid
dh
arth
Mit
tal
Pre
sid
en
t -
Fin
ance
Sala
ry a
nd
pe
rqu
isit
es
[re
fer
no
te (
v)]
(1
6)
-
(8
) -
(w.e
.f. A
ug
ust
1, 2
01
4)
6
Kir
an K
um
arC
om
pan
y Se
cre
tary
Sala
ry a
nd
pe
rqu
isit
es
[re
fer
no
te (
v)]
(6
) -
(
6)
-
B.
Oth
ers
7
Gle
nte
c In
tern
atio
nal
Ente
rpri
se o
wn
ed
by
key
man
age
me
nt
pe
rso
nn
el
Re
nt
exp
en
ses
pai
d -
(
1)
(1
) (
1)
8
Ne
oB
ioco
n F
Z L
LCJo
int
ven
ture
Sale
of
go
od
s -
-
1
3
-
[re
fer
no
te 1
an
d 3
7]
Trad
e r
ece
ivab
les
-
-
-
-
9
Syn
ge
ne
Em
plo
yee
We
lfare
Tru
stTr
ust
in
w
hic
h
key
man
age
me
nt
pe
rso
nn
el a
re t
he
Bo
ard
of T
rust
ee
s
Loan
re
cove
ry /
(g
ran
ted
) 2
2
(8
8)
40
(
11
0)
Inte
rim
div
ide
nd
pai
d b
y Sy
ng
en
e 6
-
4
0
-
Issu
e o
f B
on
us
shar
es
by
Syn
ge
ne
5,7
42
,50
0 e
qu
ity
shar
es
of `
10
/-
eac
h
-
-
57
-
10
B
ioco
n F
ou
nd
atio
nTr
ust
in w
hic
h k
ey
man
age
me
nt
pe
rso
nn
el a
re t
he
Bo
ard
of T
rust
ee
s
CSR
exp
en
dit
ure
(9
3)
- (
67
) -
11
B
ioco
n E
mp
loye
es
We
lfare
Tru
stTr
ust
in w
hic
h k
ey
man
age
me
nt
pe
rso
nn
el w
ere
th
e B
oar
d o
f Tru
ste
es
Sale
of
no
n-c
urr
en
t in
vest
me
nts
-
Shar
es
of
Syn
ge
ne
[al
so r
efe
r n
ote
40
(a)]
-
-
1
-
(up
to J
uly
23
, 20
15
)O
the
r re
ceiv
able
s -
1
-
1
12
N
aray
ana
Hru
day
alay
a Li
mit
ed
[fo
rme
rly
kno
wn
as
Nar
ayan
a H
rud
ayal
aya
Pri
vate
Lim
ite
d]
Ente
rpri
se in
wh
ich
a d
ire
cto
r o
f th
e
Co
mp
any
is a
me
mb
er
of
Bo
ard
of
Dir
ect
ors
Sale
of
go
od
s 5
2
-
44
-
Trad
e r
ece
ivab
les
-
8
-
5
13
N
ew
Me
dic
al C
en
tre
Tra
din
g (
L.L.
C)
Ente
rpri
se in
wh
ich
a s
har
eh
old
er
of
a
sub
sid
iary
has
sig
nifi
can
t in
flu
en
ce
Sale
of
go
od
s 1
,16
6
-
73
2
-
Trad
e r
ece
ivab
les
-
40
0
-
36
8
[re
fer
no
te 1
an
d 3
7]
Re
nt
(4
)-
(3
) -
Trad
e p
ayab
le-
-
-
(1
0)
14
N
eo
ph
arm
a (L
.L.C
)En
terp
rise
in w
hic
h a
sh
are
ho
lde
r o
f a
sub
sid
iary
has
sig
nifi
can
t in
flu
en
ce
Pu
rch
ase
of
go
od
s (
85
) -
(
31
) -
[re
fer
no
te 1
an
d 3
7]
Trad
e p
ayab
le -
(
26
) -
(
30
)
(i)
The
Co
mp
any
has
pai
d re
nt
to P
K A
sso
ciat
es a
nd
pu
rch
ased
co
nsu
mab
les
fro
m M
azu
md
ar F
arm
s, a
pro
prie
tary
firm
of r
elat
ive
of D
irect
or w
hic
h a
re n
ot
dis
clo
sed
ab
ove
sin
ce t
he
amo
un
ts a
re ro
un
ded
off
to
Ru
pee
s M
illio
n.
(ii)
Du
rin
g t
he
ye
ar, t
he
re is
no
tra
nsa
ctio
n w
ith
Bio
con
Ind
ia L
imit
ed
Em
plo
yee
s W
elfa
re T
rust
(tr
ust
in w
hic
h k
ey
man
age
me
nt
pe
rso
nn
el w
ere
th
e B
oar
d o
f Tru
ste
es)
.
(iii)
The
ab
ove
dis
clo
sure
s in
clu
de
re
late
d p
arti
es
as p
er
Acc
ou
nti
ng
Sta
nd
ard
18
on
“Re
late
d P
arty
Dis
clo
sure
s” a
nd
Co
mp
anie
s A
ct, 2
01
3.
(iv)
The
re
mu
ne
rati
on
to
ke
y m
anag
eri
al p
ers
on
ne
l do
es
no
t in
clu
de
th
e p
rovi
sio
ns
mad
e fo
r g
ratu
ity
and
leav
e b
en
efi
ts, a
s th
ey
are
ob
tain
ed
on
an
act
uar
ial b
asis
for
the
Co
mp
any
as a
wh
ole
.
(v)
Emp
loye
e s
tock
co
mp
en
sati
on
exp
en
se a
lloca
ble
to
ke
y m
anag
eri
al p
ers
on
ne
l is
pe
rtai
nin
g t
o t
he
RSU
Pla
n `
10
(M
arch
31
, 20
15
- N
il) w
hic
h is
no
t in
clu
de
d in
th
e r
em
un
era
tio
n d
iscl
ose
d a
bo
ve.
Biocon Limited & Subsidiaries
223

34. Foreign exchange & derivative contracts and unhedged foreign currency exposures
The Group has entered into foreign exchange forward and option contracts to hedge highly probable forecasted transactions in foreign currency. As at March 31, 2016
and 2015, the Group had the following outstanding contracts:
(in millions)
March 31, 2016 March 31, 2015
In respect of foreign currency loans taken:
Foreign exchange forward contracts to buy USD 25 -
(INR 1,656) -
In respect of highly probable forecasted imports:
Foreign exchange forward contracts with periodical maturity dates
- conversion to MYR USD - 10
- (INR 623)
European style option contracts with periodical maturity dates
- conversion to MYR USD 8 6
(INR 530) (INR 374)
In respect of highly probable forecasted sales/ export collection:
Foreign exchange forward contracts with periodical maturity dates USD 9 12
(INR 616) (INR 762)
European style option contracts with periodical maturity dates USD 386 396
(INR 25,581) (INR 24,648)
European style option contracts with periodical maturity dates EUR 12 10
(INR 899) (INR 669)
The unhedged foreign currency exposure as at the Balance Sheet date is as given below:
Cash and bank balances 3,010 3,207
Export trade receivables 4,053 4,122
Other receivables-current 34 60
Unbilled revenue - 108
Advance from customers 2,392 2,161
Import payables 2,892 1,332
Long-term borrowings 20,685 7,582
Short-term borrowings 2,253 3,336
Interest rate swap
During the year ended March 31, 2012, Biocon Sdn. Bhd. entered into floating to fixed interest rate swap to hedge the interest rate exposure on proposed utilisation
of USD 130 million term loan facility. The aggregate amount of loans covered under the said interest rate swap as at March 31, 2016 is ` 3,845 (USD 58 million) [March
31, 2015 - ` 4,748 (USD 76 million)]. The periodic net payments related to interest rate swap to the extent of underlying borrowing, is recorded as interest expense.
During the year ended March 31, 2016, Biocon Limited entered into floating to fixed interest rate swap to hedge the interest rate exposure on USD 20 million term loan
facility. The aggregate amount of loans covered under the said interest rate swap as at March 31, 2016 is ` 1,326 (USD 20 million) [March 31, 2015 - ` Nil (USD Nil)]. The
periodic net payments related to interest rate swap to the extent of underlying borrowing, is recorded as interest expense.
During the year ended March 31, 2016, Biocon Pharma Limited entered into floating to fixed interest rate swap to hedge the interest rate exposure on USD 20 million
term loan facility. The aggregate amount of loans covered under the said interest rate swap as at March 31, 2016 is ̀ 1,326 (USD 20 million) [March 31, 2015 - ` Nil (USD
Nil)]. The periodic net payments related to interest rate swap to the extent of underlying borrowing, is recorded as interest expense.
(This space has been intentionally left blank)
Credibly Capable | Annual Report 2016224

Financial Report
35. Commitments
March 31, 2016 March 31, 2015
(a) Capital commitments
Estimated amount of contracts remaining to be executed on capital
account and not provided for, net of advances 2,131 3,313
(b) Operating lease commitments
Where the Group is a lessee
(i) Rent:
The Group has entered into various agreements for lease of building / office space which expires over a period up to March
2022. Gross rental expenses for the year aggregates to ` 39 (March 31, 2015 - ` 25). The committed lease rentals in the future
are:
Not later than one year 26 17
Later than one year and not later than five years 72 40
Later than five years 3 7
(ii) Vehicles:
The Group has taken vehicles for employees under operating leases, which expire in 2020. Gross rental expenses for the year
aggregates to ` 19 (March 31, 2015 - ` 12). The committed lease rentals in the future are:
Not later than one year 19 15
Later than one year and not later than five years 33 27
Later than five years - -
Where the Group is a lessor:
(i) Rent:
The Company has leased out certain parts of its building (including fit outs) and land on an operating lease, which expire
over a period up to 2018. Gross rental income for the year aggregates to ` 20 (March 31, 2015 - ` 20). Further, minimum lease
rentals under operating lease are as follows:
Not later than one year 20 20
Later than one year and not later than five years 10 30
Later than fiver years - -
Considering that the leased assets comprise of portion of factory buildings located within the Company’s factory premises,
disclosure with regard to gross value of leased assets, accumulated depreciation and net book value of the same is not
feasible.
36. Contingent liabilities
(i) Claims against the Company not acknowledged as debt 5,197 2,840
The above includes:
(a) Direct taxation (matters pertaining to disputes on tax holiday benefits, 4,132 1,838
transfer pricing and disallowance of certain expenses claimed by the Group)
(b) Indirect taxation (includes matters pertaining to disputes on central excise, 668 610
custom duty and service tax) 397 392
(c) Other litigations
The Group is involved in taxation and other disputes, lawsuits, proceedings etc. including patent and commercial matters
that arise from time to time in the ordinary course of business. Management is of the view that such claims are not tenable
and will not have any material adverse effect on the Group’s financial position and results of operations.
(ii) Corporate guarantees given to the Central Excise Department 648 742
(iii) Guarantees given by banks on behalf of the Group for contractual obligations of the Group. 60 65
37. Interest in joint venture
NeoBiocon was incorporated in Dubai as a 50% joint venture between the Company and Mr. B R Shetty. On July 01, 2014, the Company acquired an additional equity
stake of 1% in NeoBiocon, taking its holding to 51%. Accordingly, effective July 01, 2014 NeoBiocon has become a subsidiary of the Company. Till June 30, 2014,
NeoBiocon was accounted as a joint venture on a proportionate consolidation on a line-by-line basis in the consolidated financial statements, as per the requirements
of Accounting Standard 27. For the quarter ended June 30, 2014, the aggregate amount of Biocon’s interest in the income and expenses of NeoBiocon was ` 141 and
` 81 respectively.
Biocon Limited & Subsidiaries
225

38. Employee bene!t plans
The Company has a defined benefit gratuity plan as per The Payment of Gratuity Act, 1972 for its employees in India
A summary of the gratuity plan is as follows:
March 31, 2016 March 31, 2015
Balance Sheet
Defined benefit obligation 440 359
Fair value of plan assets 64 85
Plan Liability 376 274
The change in benefit obligation and funded status of the gratuity plan is as follows:
Change in bene!t obligation
Benefit obligation at the beginning of the year 359 306
Current service cost 45 68
Past service cost - -
Interest cost 28 24
Benefits paid (26) (30)
Actuarial (gain) / loss 34 (9)
Bene!t obligation at the end of the year 440 359
Change in fair value of plan assets
Fair value of plan assets at beginning of the year 85 77
Expected return on plan assets 7 7
Actuarial gain / (loss) (2) 2
Actual contribution - 23
Benefits paid (26) (24)
Fair value of plan assets at the end of the year 64 85
Net gratuity cost:
Components of net bene!t cost
Current service cost 45 68
Past service cost - -
Interest cost 28 24
Expected return on plan assets (7) (7)
Net actuarial (gain) / loss recognised during the year 36 (11)
Net gratuity cost 102 74
Actual return on plan assets 5 9
Experience adjustment March 31, 2016 March 31, 2015 March 31, 2014 March 31, 2013 March 31, 2012
Defined benefit obligation 440 359 306 247 188
Plan assets 64 85 77 94 94
Surplus / (Deficit) (376) (274) (229) (153) (94)
Experience adjustments on plan liabilities gain / (loss) (29) (2) (2) 23 (30)
Experience adjustments on plan assets gain / (loss) (1) (2) (2) - -
March 31, 2016 March 31, 2015
The assumptions used for gratuity valuation are as below:
Interest rate 7.5% 8.8%
Discount rate 7.5% 7.9%
Expected return on plan assets 7.9% 7.9%
Salary increase 9.0% 9.0%
Attrition rate up to age 44 26.0% 18% to 26%
Attrition rate above age 44 7.0% 5% to 8%
Retirement age - Years 58 58
The Group evaluates these assumptions based on its long-term plans of growth and industry standards and the expected contribution to the fund during the year
ending March 31, 2017, is approximately ` 77 (March 31, 2016 - ` 121).
The overall expected rate of return on assets is determined based on the market prices prevailing on that date, applicable to the period over which the obligation is
to be settled.
The nature of allocation of the fund is only in debt based mutual funds of high credit rating.
Credibly Capable | Annual Report 2016226

Financial Report
39. Segmental information
Business segments
The primary reporting of the Group has been performed on the basis of business segment. The Group is organised into two business segments, active pharmaceutical
ingredients (‘Pharma’) and contract research and manufacturing services (‘Contract Research’). Segments have been identified and reported based on the nature of the
products, the risks and returns, the organisation structure and the internal financial reporting systems.
April 1, 2015 to March 31, 2016
Particulars Pharma Contract
Research
Unallocated Eliminations Total
Revenues
External sales 24,041 10,813 - - 34,854
Inter-segment transfers 4 257 - (261) -
Total revenues 24,045 11,070 - (261) 34,854
Costs
Segment costs (13,173) (7,089) - - (20,262)
Inter-segment transfers (257) (4) - 261 -
Result
Segment result 10,615 3,977 - - 14,592
Corporate expenses - - (6,392) - (6,392)
Other income - - 845 - 845
Operating pro!t 9,045
Depreciation / amortisation (1,450) (973) - - (2,423)
Finance costs - - (102) - (102)
Exceptional items - - 5,754 - 5,754
Income taxes - Current and deferred - - (2,569) - (2,569)
Minority Interest - - (744) - (744)
Pro!t after taxes 8,961
Other information
Segment assets 46,185 23,867 - - 70,052
Unallocated corporate assets - - 14,764 - 14,764
Total assets 84,816
Segment liabilities 26,870 13,238 - - 40,108
Unallocated corporate liabilities - - 1,040 - 1,040
Minority Interest - - 3,112 - 3,112
Total liabilities 44,260
Capital expenditure 6,620 3,059 - - 9,679
(This space has been intentionally left blank)
Biocon Limited & Subsidiaries
227

April 1, 2014 to March 31, 2015
Particulars Pharma Contract
Research
Unallocated Eliminations Total
Revenues
External sales 22,501 8,397 - - 30,898
Inter-segment transfers 5 202 - (207) -
Total revenues 22,506 8,599 - (207) 30,898
Costs
Segment costs (12,823) (5,623) - - (18,446)
Inter-segment transfers (202) (5) - 207 -
Result
Segment result 9,481 2,971 - - 12,452
Corporate expenses - - (5,494) - (5,494)
Other income - - 531 - 531
Operating pro!t 7,489
Depreciation / amortisation (1,396) (814) - - (2,210)
Finance costs - - (89) - (89)
Exceptional items - - 1,051 1,051
Income taxes - Current and deferred - - (957) - (957)
Minority Interest - - (310) - (310)
Pro!t after taxes 4,974
Other information
Segment assets 39,676 14,294 - - 53,970
Unallocated corporate assets - - 9,784 - 9,784
Total assets 63,754
Segment liabilities 23,081 5,599 - - 28,680
Unallocated corporate liabilities - - 646 - 646
Minority Interest - - 1,722 - 1,722
Total liabilities 31,048
Capital expenditure 5,462 2,505 - - 7,967
Geographical segments
Secondary segmental reporting is performed on the basis of the geographical location of customers. The management views the Indian market and export markets
as distinct geographical segments. The following is the distribution of the Group’s sale by geographical markets:
Revenues, net April 1, 2015 to
March 31, 2016
April 1, 2014 to
March 31, 2015
India 11,038 10,923
Outside India 23,816 19,975
Total 34,854 30,898
The following is the carrying amount of assets by geographical area in which the assets are located:
Carrying amount of assets Capital expenditure
March 31, 2016 March 31, 2015 March 31, 2016 March 31, 2015
India 56,442 39,116 5,954 3,793
Outside India 28,374 24,638 3,725 4,174
84,816 63,754 9,679 7,967
Segment revenue and result
The expenses that are not directly attributable and that cannot be allocated to a business segment on a reasonable basis are shown as unallocated corporate
expenses.
Segment assets and liabilities
Segment assets include all operating assets used by the business segment and consist principally of fixed assets and current assets. Segment liabilities comprise of
liabilities which can be identified directly against the respective segments. Assets and liabilities that have not been allocated between segments are shown as part of
unallocated corporate assets and liabilities respectively.
Credibly Capable | Annual Report 2016228

Financial Report
40. Exceptional items (net)
March 31, 2016 March 31, 2015
Provision for other than temporary diminution in the value of long-term investments - (218)
[refer note 15(i)]
Loss on sale of shares in subsidiary [refer note (a) below] - (79)
Gain on sale of shares in subsidiary (net) [refer note (b) and (c) below] 4,148 1,348
Impairment loss on intangible asset [refer note (d) below] (1,078) -
Recognition of deferred revenue [refer note 42] 2,684 -
5,754 1,051
(a) During the year ended March 31, 2015, the Company sold equity shares of Syngene constituting 1% of the equity capital at cost to Biocon Limited Employee Welfare
Trust, a Trust formed for administration of a Scheme for the benefit of employees of the Group (excluding the employees of Syngene). Accordingly, a loss of ` 79 had
been recorded in the consolidated financial statements.
(b) On September 9, 2014, BRL purchased 7.69% of equity shares in Syngene from GE Equity International Mauritius for a consideration of ` 2,154. BRL also subscribed
to additional equity shares in Syngene by way of rights issue, thereby taking BRL’s shareholding in Syngene to 10.93%. On September 18, 2014, BRL entered into an
agreement with Silver Leaf Oak (Mauritius) Limited (“Silver Leaf”) to sell 10% of equity holding in Syngene.
In January 2015, Silver Leaf assigned its rights and obligations to purchase the aforesaid equity stake in Syngene to IVF Trustee Company Private Limited (“IVF”), a
fund advised by India Value Fund Advisors. Subsequently, BRL sold such shares to IVF for a consideration of ` 3,800. Accordingly, a gain of ` 1,491 had been recorded
on such sale. Further, BRL incurred expense of ` 143 (including interest expense of ` 20 on loans taken from banks) in relation to above transaction. Accordingly,
gain on sale of investment, net of transaction cost, amounting to ` 1,348 had been disclosed as exceptional item.
(c) During the year ended March 31, 2016, Syngene completed its Initial Public Offering (IPO), through an offer for sale by the Company of 22,000,000 equity shares of
` 10 each, by the Company. Post the sale, the Company’s holding in equity shares of Syngene has reduced from 84.54% to 73.54%. Gain arising from such sale of
equity shares, net of related expenses and cost of equity shares, amounting to ` 4,148 has been recorded as an exceptional item. Consequential tax of ` 1,042 has
been recorded on such gains under income tax expense.
(d) In March 2010, Biocon SA, a wholly owned subsidiary of the Company, acquired marketing rights of T1H product for US and Canada region (‘Territory’) from M/s.
CIMAB, Cuba.
Pursuant to ongoing efforts to license such product to potential partners in the USA, Biocon SA was informed of the need to obtain prior authorization from the
Office of Foreign Assets Control, USA (‘OFAC’). The US regulations restrict any U.S. company or a subsidiary of a U.S. company from engaging in any transaction in
which a Cuban entity has at any time since July 1963 had any interest whatsoever, whether direct or indirect without prior authorization from OFAC. Biocon SA
evaluated options to obtain waiver from this requirement. However the outcome was not favourable. Consequent to such developments and after evaluating the
requirements of OFAC and related timelines, management concluded that the same has now created an uncertainty to license this product for development and
commercialization in the Territory.
Hence, during the current year ended March 31, 2016, Biocon SA has recorded an impairment of the carrying value of the aforesaid intangible asset amounting to
` 1,078. Biocon SA holds marketing rights in other territories including Europe where these restrictions do not apply and continues to develop the molecule for such
territories.
(This space has been intentionally left blank)
Biocon Limited & Subsidiaries
229

41. Amounts capitalized to !xed assets during the year
March 31, 2016 March 31, 2015
a) Expenses capitalised
(i) Capital work-in-progress*
Salaries, wages and bonus 179 338
Insurance 5 10
Professional charges 33 85
Power and fuel 116 106
Repairs and maintenance 17 -
Miscellaneous expenses 65 57
236 258
Depreciation 51 -
Finance costs
Interest expense 293 133
Exchange difference to extent considered as an adjustment to borrowing cost 39 -
332 133
798 729
*Capital work-in-progress is further adjusted by grants received by Biocon Malaysia from government amounting to ` 453
(March 31, 2015 - ` 169) towards the aforesaid expenses as per the terms of the agreement with the government.
(ii) Intangible assets under development
Lab consumables 30 29
Research & development expenses 990 560
1,020 589
(b) Others
(i) Capital work-in-progress
Foreign exchange loss on long-term monetary liability 253 1,106
Consumables - 171
253 1,277
42. Pursuant to the termination of a customer contract in March 2012, based on an evaluation of the prevalent regulatory framework, industry practices and ethics/
governance requirements relating to clinical trials and the regulatory submissions already initiated/ filed, Biocon SA, a wholly owned subsidiary of the Company,
had determined that it had continuing obligations to complete clinical development and regulatory activities in relation to biosimilar insulin products. Accordingly,
the Company deferred the remainder of the upfront amounts received from the said customer, to be recognized in the consolidated statement of profit and loss in
subsequent periods in line with costs to be incurred towards such clinical trials and development activities. Accordingly, for the year ended March 31, 2016, of the
deferred amount of ` 152 (March 31, 2015 - ` 295), have been netted off against expenses incurred towards such clinical trial and development activities.
In March 2016, Biocon SA entered into an agreement with Lab PiSA, Mexico (‘PiSA’), granting a right to PiSA to become Biocon SA’s exclusive co-development partner and
manufacturer for biosimilar rh-insulin (“Products”) in United States of America (‘the Territory’). As per this Agreement, on completion of certain preliminary development
activities to be conducted by PiSA and exercise of the right by PiSA to continue with the development activity, Biocon SA and PiSA shall conduct the co-development
program. Biocon SA shall conduct the required clinical studies and obtain the regulatory approvals to market the Products in the Territory, while PiSA will be responsible
for manufacture of the Products at its facility. Biocon SA and PiSA shall share the cost of all development activities and share profits from commercialization of the
Products in the Territory as per the terms of this Agreement.
Consequent to the above agreement with PiSA which changes the nature of Biocon’s future obligations on the rh-insulin program, the balance of deferred revenues of
` 2,684 relating to this program has been recognized as income and is disclosed under exceptional items. Consequential tax of ` 123 is recorded on such income under
income tax expense.
43. Other notes
(a) The Company had entered into transactions of sale of products to a private company during the year ended March 31, 2013 and 2012 amounting to ` 28 and ` 17
respectively that required prior approval from Central Government under Section 297 of the Companies Act, 1956. These transactions, entered into at prevailing
market prices were approved by the Board of Directors of the Company. During the year ended March 31, 2014, the Company had filed application with the Central
Government for approval of such transactions and for compounding of such non-compliance and same is pending with Central Government as at March 31, 2016.
(b) Recovery of product development costs from co-development partner (net) pertains to co-development partner’s share of expenses under the development
agreements comprising of payroll costs, depreciation and amortisation and other expenses.
Credibly Capable | Annual Report 2016230

Financial Report
44. Additional information, as required under Schedule III to the Act, of enterprises consolidated as subsidiary/ associates/ joint ventures.
Name of the entity Net Assets i.e. total assets
minus total liabilities as at March 31, 2016
Share in pro!t or loss for the year ended
March 31, 2016
As a % of consolidated
net assets
Amount As a % of consolidated
pro!t or loss
Amount
Holding Company
Biocon Limited 59% 25,285 67% 6,507
Subsidiaries
Indian
Syngene International Limited 18% 7,822 17% 1,671
Biocon Research Limited 1% 495 -9% (900)
Biocon Academy - - - -
Biocon Pharma Limited - 169 - (8)
Foreign
Biocon SA -2% (666) 15% 1,497
Biocon Sdn.Bhd. 12% 5,402 -1% (94)
NeoBiocon FZ LLC 1% 349 2% 217
Biocon FZ LLC - 17 - 3
Biocon Pharma Inc - 23 - (3)
Biocon Biologics Limited 4% 1,660 1% 71
Associates
Foreign
IATRICa Inc., USA - - - -
Minority interest in all subsidiaries 7% 3,112 8% 744
Total 100% 43,668 100% 9,705
Name of the entity Net Assets i.e. total assets
minus total liabilities as at March 31, 2015
Share in pro!t or loss for the year ended
March 31, 2015
As a % of consolidated
net assets
Amount As a % of consolidated
pro!t or loss
Amount
Holding Company
Biocon Limited 64% 21,951 65% 3,435
Subsidiaries
Indian
Syngene International Limited 22% 7,364 30% 1,578
Biocon Research Limited 2% 693 -2% (99)
Biocon Academy - - - -
Biocon Pharma Limited - - - -
Foreign
Biocon SA -8% (2,706) 1% 72
Biocon Sdn.Bhd. 14% 4,955 -4% (220)
NeoBiocon FZ LLC 1% 449 4% 208
Associates
Foreign
IATRICa Inc., USA - - - -
Minority interest in all subsidiaries 5% 1,722 6% 310
Total 100% 34,428 100% 5,284
45. Corporate Social Responsibility
As per Section 135 of the Companies Act, 2013, a company in India, meeting the applicability threshold, needs to spend at least 2% of its average net profit for the
immediately preceding three financial years on corporate social responsibility (CSR) activities.
(a) Gross amount required to be spent by the Company during the year is ` 112; and
(b) Amount spent during the year on:
Particulars In Cash Yet to be paid in cash Total
(i) Construction/ acquisition of any asset - - -
(ii) On purposes other than (i) above 112 - 112
Biocon Limited & Subsidiaries
231

46. Prior year comparatives
The previous year’s figures have been re-grouped/ reclassified, where necessary to conform to current year’s classification.
As per our report of even date
For S.R. Batliboi & Associates LLP For and on behalf of the Board of Directors of Biocon Limited
Chartered Accountants
ICAI Firm registration no.: 101049W
per Aditya Vikram Bhauwala Kiran Mazumdar-Shaw Arun Chandavarkar
Partner Managing Director Joint Managing Director & CEO
Membership no.: 208382 DIN: 00347229 DIN: 01596180
Siddharth Mittal Kiran Kumar
President - Finance & Chief Financial Officer Company Secretary
M No. A14594
Bengaluru Bengaluru
April 26, 2016 April 26, 2016
(This space has been intentionally left blank)
Credibly Capable | Annual Report 2016232

Conceptualized & Developed by :
Team Corporate Communications, Biocon | [email protected]
Trisys Communications | [email protected]
Forward Looking Statement
In this Annual Report we have disclosed forward-looking information to enable investors to comprehend our prospects and take
informed investment decisions. This report and other statements - written and oral - that we periodically make contain forward-looking statements that set out anticipated results based on the management’s plans and assumptions. We have tried wherever possible to identify such statements by using words such as ‘anticipates’, ‘estimates’, ‘expects’, ‘projects’, ‘intends’, ‘plans’, ‘believes’ and words of similar substance in connection with any discussion of future performance. The market data & rankings used in the various chapters are based on several published reports and internal company assessment.
We cannot guarantee that these forward looking statements will be realised, although we believe we have been prudent in
our assumptions. The achievement of results is subject to risks, uncertainties and even inaccurate assumptions. Should known or unknown risks or uncertainties materialise, or should underlying assumptions prove inaccurate, actual results could vary materially from those anticipated, estimated or projected. Readers should bear this in mind. We undertake no obligation to publicly update any forward-looking statements, whether as a result of new information, future events or otherwise.

Biocon Limited
20th KM Hosur Road, Electronic City, Bangalore – 560 100, India
T – 91 80 2808 2808
W – www.biocon.com