Biochemistry Validation Form - Point Of Care Testing Ltd Piccolo Xpress Evaluation... · Document...
26
BIOMANFO009 Biochemistry Method Evaluation Form Document Name: BIOMANFO009 Biochemistry Method Validation Form Version 2.1 Author: S Troup Page 1 of 26 Date Approved: 05/04/12 Biochemistry Validation Form Method: Piccolo Xpress Chemistry 13 panel Manufacturer: Abaxis Cat no: 400-0029 CE marked: Yes: x No: Location of bench book: X:\Bio\Patricia\Piccollo Xpress evaluation (August 2012) Evaluation performed by: Patricia Lockett, Senior Biomedical Scientist for Point of Care Testing & Caroline Addison, Principal Clinical Biochemist Date of Evaluation: August 2012 Introduction Background The point of care team was contacted by A&E with regard to increasing the point of care test repertoire in their department. The initial requirements were U&Es, LFTs, paracetamol & salicylate, Troponin T, BNP, INR, D-Dimer, CRP, hCG and amylase. The department agreed to look for suitable analysers. The Abaxis Piccolo Xpress chemistry analyser is a point of care device that delivers clinical chemistry profiles. Profiles are available in disks and include lipid, liver enzymes, kidney function, glucose and electrolytes (see picture 1). It was decided to evaluate this instrument for the A&E department in particular the Chemistry 13 reagent disk which offers albumin, ALP, ALT, amylase, AST, urea, creatinine, calcium, GGT, glucose, total bilirubin, total protein and urate. Sample type is heparinised whole blood, heparinised plasma or serum. Rationale for evaluation See background.
-
Upload
phungxuyen -
Category
Documents
-
view
215 -
download
0
Transcript of Biochemistry Validation Form - Point Of Care Testing Ltd Piccolo Xpress Evaluation... · Document...

BIOMANFO009 Biochemistry Method Evaluation Form
Document Name: BIOMANFO009 Biochemistry Method Validation Form Version 2.1Author: S Troup Page 1 of 26 Date Approved: 05/04/12
Biochemistry Validation Form
Method: Piccolo Xpress Chemistry 13 panel
Manufacturer: Abaxis
Cat no: 400-0029
CE marked: Yes: x No:
Location of bench book: X:\Bio\Patricia\Piccollo Xpress evaluation (August2012)
Evaluation performed by:Patricia Lockett, Senior Biomedical Scientist for Point of Care Testing &Caroline Addison, Principal Clinical Biochemist
Date of Evaluation: August 2012
Introduction
BackgroundThe point of care team was contacted by A&E with regard to increasing thepoint of care test repertoire in their department. The initial requirements wereU&Es, LFTs, paracetamol & salicylate, Troponin T, BNP, INR, D-Dimer, CRP,hCG and amylase. The department agreed to look for suitable analysers.The Abaxis Piccolo Xpress chemistry analyser is a point of care device thatdelivers clinical chemistry profiles. Profiles are available in disks and includelipid, liver enzymes, kidney function, glucose and electrolytes (see picture 1).It was decided to evaluate this instrument for the A&E department in particularthe Chemistry 13 reagent disk which offers albumin, ALP, ALT, amylase, AST,urea, creatinine, calcium, GGT, glucose, total bilirubin, total protein and urate.Sample type is heparinised whole blood, heparinised plasma or serum.
Rationale for evaluationSee background.

BIOMANFO009 Biochemistry Method Evaluation Form
Document Name: BIOMANFO009 Biochemistry Method Validation Form Version 2.1Author: S Troup Page 2 of 26 Date Approved: 05/04/12
Picture 1: Piccolo Xpress chemistry analyser and reagent disk.
Method
Current NewMethod Various Chemistry 13 reagent
diskAnalyser Roche cobas c701 Abaxis Piccolo Xpress
A limited number of reagent disks (50) was available for the evaluation.Patient comparison was performed by taking 10 random serum samples andanalysing on both the Piccolo Xpress and laboratory analyser. A further 10serum samples were then selected to ensure the measuring range had beenevaluated (where possible).
Comparison of lithium heparin whole blood versus lithium heparin plasma wasalso performed. Patient samples which had been sent to the laboratory inlithium heparin sample tubes (i.e. for ketone analysis) were analysed as wholeblood on the Piccolo Xpress. These samples were then centrifuged to obtainthe plasma, which was then analysed for all parameters on the Roche cobasc701. Due to a limited number of reagent disks this could only be performedfor 8 patient samples.
Precision was determined by analysing the 2 levels of Randox Chemistryinternal quality control material which is used in the laboratory. Within dayprecision was assessed by measuring both levels of QC 5 times in one day.Between batch precision was assessed over a further 2 days, by measuringboth levels of QC 3 times each.
Review of kit insert
Interferences/cross reactivitiesSamples containing EDTA, fluoride, oxalate or any anticoagulantcontaining ammonium ions will interfere with at least 1 chemistry in thechemistry 13 reagent discSodium heparin is not suitable.Samples with haematocrits in excess of 62-65% packed red cellvolume (volume fraction of 0.62-0.65) may give an inaccurate result –

BIOMANFO009 Biochemistry Method Evaluation Form
Document Name: BIOMANFO009 Biochemistry Method Validation Form Version 2.1Author: S Troup Page 3 of 26 Date Approved: 05/04/12
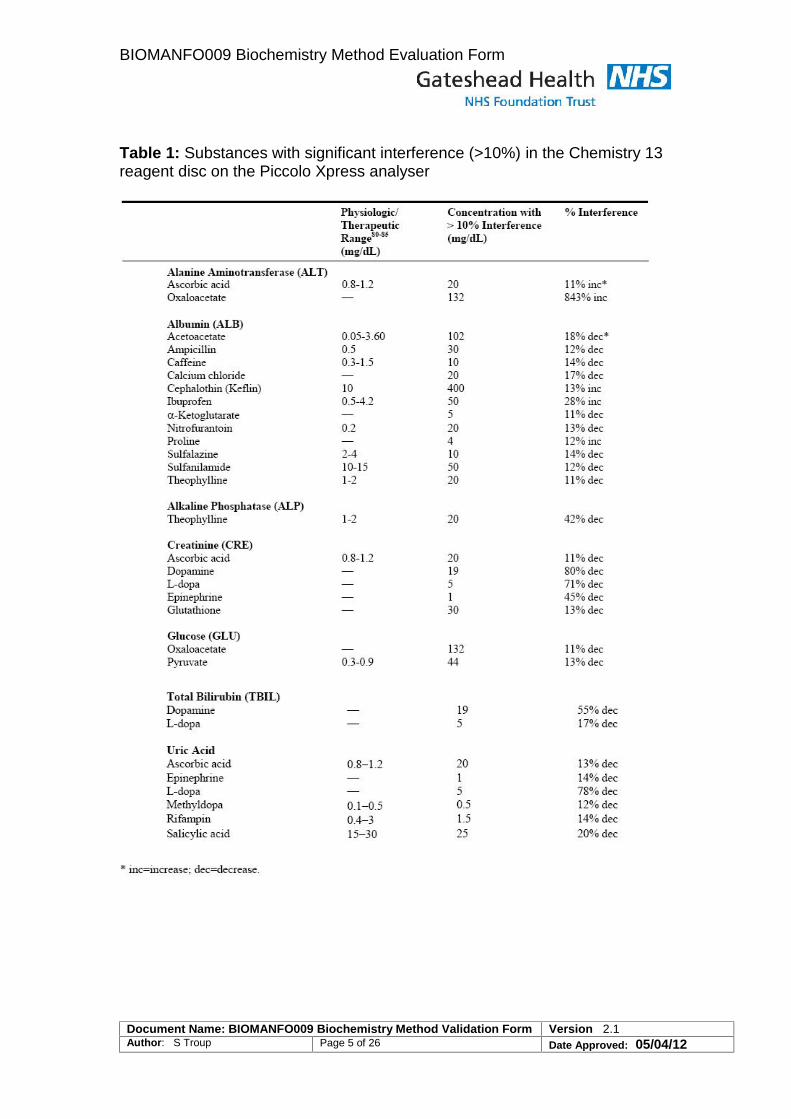
these samples may be reported as haemolysed and can be re-spunand the plasma analysed.Haemolysis, icterus and lipaemia can cause changes in reportedconcentrations of some analytes. The Piccolo Xpress suppresses anyresults that are affected by >10% interference from haemolysis,lipaemia or icterus.Table 1 shows substances with >10% interference and their effect onthe chemistry 13 test(s).Refrigerating whole blood samples can cause significant changes inconcentrations of AST, creatinine and glucose.Total bilirubin may be adversely affected by photodegradation.Samples not run immediately should be stored in the dark.Glucose concentrations decrease approximately 5-12mg/dl (0.28 –0.67mmol/L) in 1 hour in uncentrifuged samples at room temperature.
Linearity/dilutionsEach analyte in the Chemistry 13 reagent disc is linear over themeasuring range as shown in table 2. Samples above or below thisrange are reported as greater than (>) or less than (<) with an asteriske.g. ALT >2000* U/L or ALT <5* U/LAny samples that exceed the assay range should be analysed byanother approved method. DO NOT dilute the sample and re-run onthe Piccolo Xpress analyser.Samples which are grossly beyond the measuring range will be printedas’~~~’ instead of a result.
PrecisionResults for within-run and total precision were determined by testingtwo levels of control material. Controls were run in duplicate twice eachday for 20 days over a four week period. Precision data is shown intable 3.
LOD/LOQThe lower limit of the reportable range for each analyte is shown intable 2.
Sample type/handlingMinimum required volume is 100µl of heparinised whole blood,heparinised plasma, serum or control material. The reagent discchamber can contain up to 120µl of sample.Samples containing EDTA, fluoride, oxalate or any anticoagulantcontaining ammonium ions will interfere with at least 1 chemistry in thechemistry 13 reagent discSodium heparin is not suitable.Whole blood samples must be homogenous before transferring to asample disc. Gently invert the collection tubes several times prior toinversion. DO NOT shake the tube as this may cause haemolysis.

BIOMANFO009 Biochemistry Method Evaluation Form
Document Name: BIOMANFO009 Biochemistry Method Validation Form Version 2.1Author: S Troup Page 4 of 26 Date Approved: 05/04/12
Whole blood venepuncture samples should be run within 60minutes ofcollection. If analysis cannot be performed in this time, the sample maybe separated into plasma or serum and stored at 2-8C.The reagent disc should be analysed within 10 minutes of transferringthe sample to the reagent disc.
Reagent storage/hazardsStore reagent discs in their sealed pouches at 2-8C. Do not expose todirect sunlight or temperatures above 32C. Do not use beyond theexpiration date.Reagent discs may be used directly from the refrigerator withoutwarming.Do not allow discs to remain at room temperature for more than48hours.Be careful not to touch the barcode ring located on top of the disc.A disc not used within 20 minutes of opening should be discarded.The reagent discs are plastic and may crack or chip if dropped. Neveruse a dropped disc as this may spray biohazardous materialthroughout the interior of the analyser.
Level sensing?Not applicable – Chemistry 13 discs contain all reagents
OtherIn rare circumstances sample when applied to the disc may not flowsmoothly into the sample chamber. Due to an uneven flow, aninadequate quantity of sample may be analysed and several results falloutside of the reference range. Re-run sample using new reagent disc.
BIOMANFO009 Biochemistry Method Evaluation Form
Document Name: BIOMANFO009 Biochemistry Method Validation Form Version 2.1Author: S Troup Page 5 of 26 Date Approved: 05/04/12
Table 1: Substances with significant interference (>10%) in the Chemistry 13reagent disc on the Piccolo Xpress analyser

BIOMANFO009 Biochemistry Method Evaluation Form
Document Name: BIOMANFO009 Biochemistry Method Validation Form Version 2.1Author: S Troup Page 6 of 26 Date Approved: 05/04/12
Table 2: Manufacturer measuring range for Chemistry 13 reagent disc onPiccolo Xpress analyser
Table 3: Manuafacturer Total precision data for the chemistry 13 reagent discon the Piccolo Xpress analyser
% CV (mean concentration)
Analyte Level 1 Level 2
ALT 13.5% (21 U/L) 6.2% (52 U/L)
Albumin 2.1% (56 g/L) 2.9% (37g/L)
ALP 5.8% (39 U/L) 3.1% (281 U/L)
Amylase 5.7% (46 U/L) 3.8% (300 U/L)
AST 1.9% (49 U/L) 1.2% (147 U/L)
Calcium 2.9%(8.6mg/dl/2.15mmol/L)
3.4%(11.8mg/dl/2.94mmol/L)
Creatinine 13.1%(1.1mg/dl/97µmol/L)
5.2%(5.2mg/dl/460µmol/L)
GGT 2.94% (25 U/L) 2.15% (106 U/L)
Glucose 1.6% (66mg/dl/3.66mmol/L)
1.4% (278mg/dl/15.43mmol/L)
Total bilirubin 9.3% (0.8mg/dl/14µmol/L)
2.8%(5.2mg/dl/89µmol/L)
Total protein 1.2% (68 g/L) 2.0% (47 g/L)
Urea 2.1%(19mg/dl/6.8mmol/L)
1.8%(65mg/dl/23.2mmol/L)
Urate 4.8% (3.8mg/dl/0.226mmol/L)
3.9%(7.5mg/dl/0.446mmol/L)

BIOMANFO009 Biochemistry Method Evaluation Form
Document Name: BIOMANFO009 Biochemistry Method Validation Form Version 2.1Author: S Troup Page 7 of 26 Date Approved: 05/04/12
Instrument download/calculations
Details of information downloaded if applicable Details of results calculations if applicable
Performed by: not applicable Date:Checked by:not applicable Date:
Results/Data
N.B. ensure data use is raw data from analyser, not from middleware orLIMS, as this may be rounded.
Biaso Patient comparison
Figures 1 -13 show the Passing & Bablok regression analysis for all analytesincluded in the chemistry 13 reagent disc.
Albumin shows a constant negative bias on the Piccolo Xpress compared tothe laboratory assay (y = 0.9x -0.5). This bias was not considered to besignificant.
A proportional negative bias was seen for ALP. Again this bias was notconsidered to be significant.
Good comparison was seen between the Piccolo Xpress and the laboratoryfor ALT (y = 1.01 + 0.01)
A positive bias was seen for amylase on the Piccolo Xpress (y = 1.36x +4.76). This bias may be attributable to the differences in what each assay ismeasuring. The laboratory assay is specific for pancreatic amylase whereasthe Piccolo Xpress measures total amylase.
A small constant positive bias was seen between the Piccolo Xpress and thelaboratory for AST (y = 1.06x + 1.14) however, this was not considered to besignificant.
Good comparison was seen between the Piccolo Xpress and the laboratoryfor urea (y = 1.03x – 0.35).
A mixed bias was seen for calcium when comparing the Piccolo Xpress andthe laboratory assay. This assay would identify patients with calcium

BIOMANFO009 Biochemistry Method Evaluation Form
Document Name: BIOMANFO009 Biochemistry Method Validation Form Version 2.1Author: S Troup Page 8 of 26 Date Approved: 05/04/12
concentrations at the extremes and therefore, is probably sufficient for a pointof care device. It should be noted that a new calcium assay is currently underevaluation by the department. This new calcium assay is reported to be morestable than the current assay. A repeat comparison if this new assay isinstalled would be beneficial.
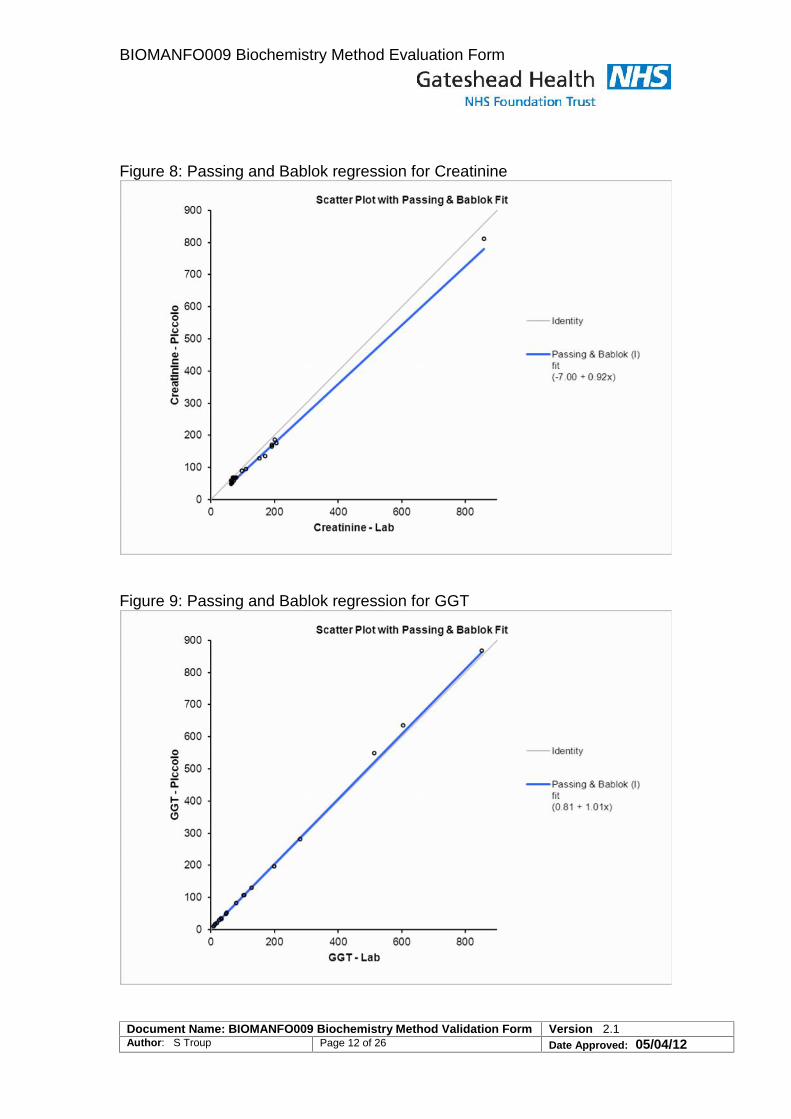
A constant negative bias was seen for Creatinine (y = 0.92x -7.00). Again thisbias was not considered to be significant.
Good comparison was seen between the Piccolo Xpress and the laboratoryfor GGT (y = 1.01x + 0.81).
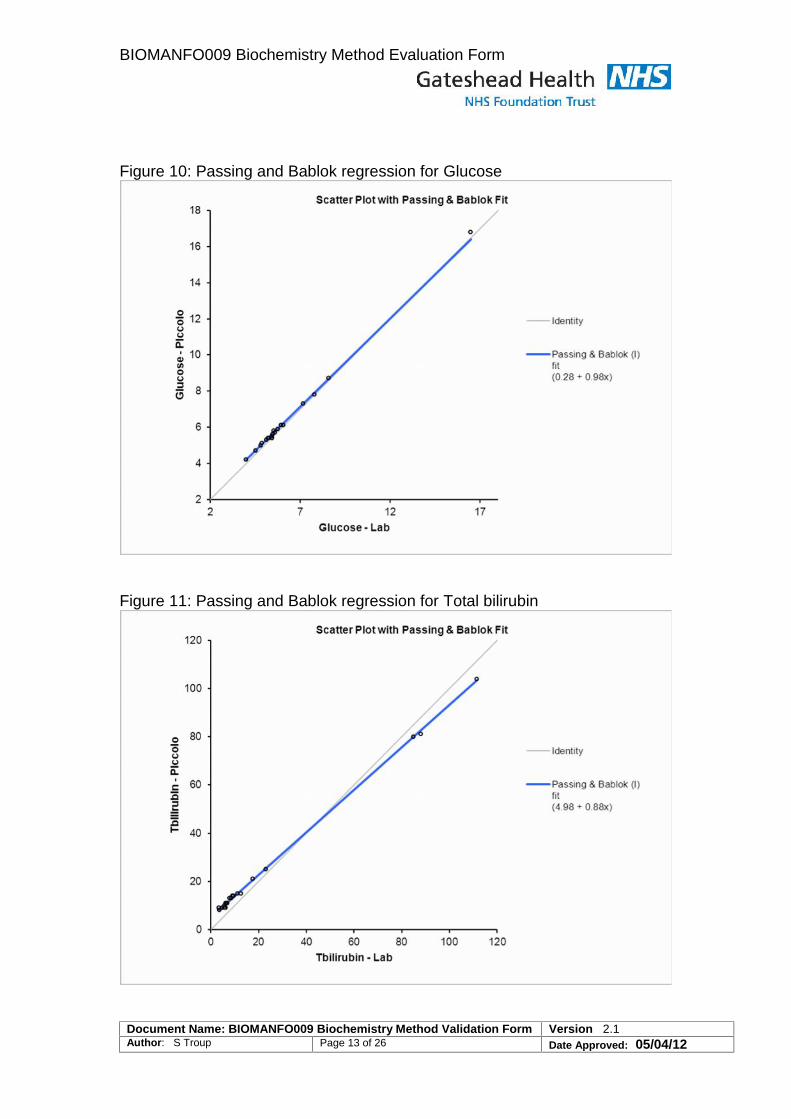
Good comparison was seen between the Piccolo Xpress and the laboratoryfor Glucose (y = 0.98x + 0.28).
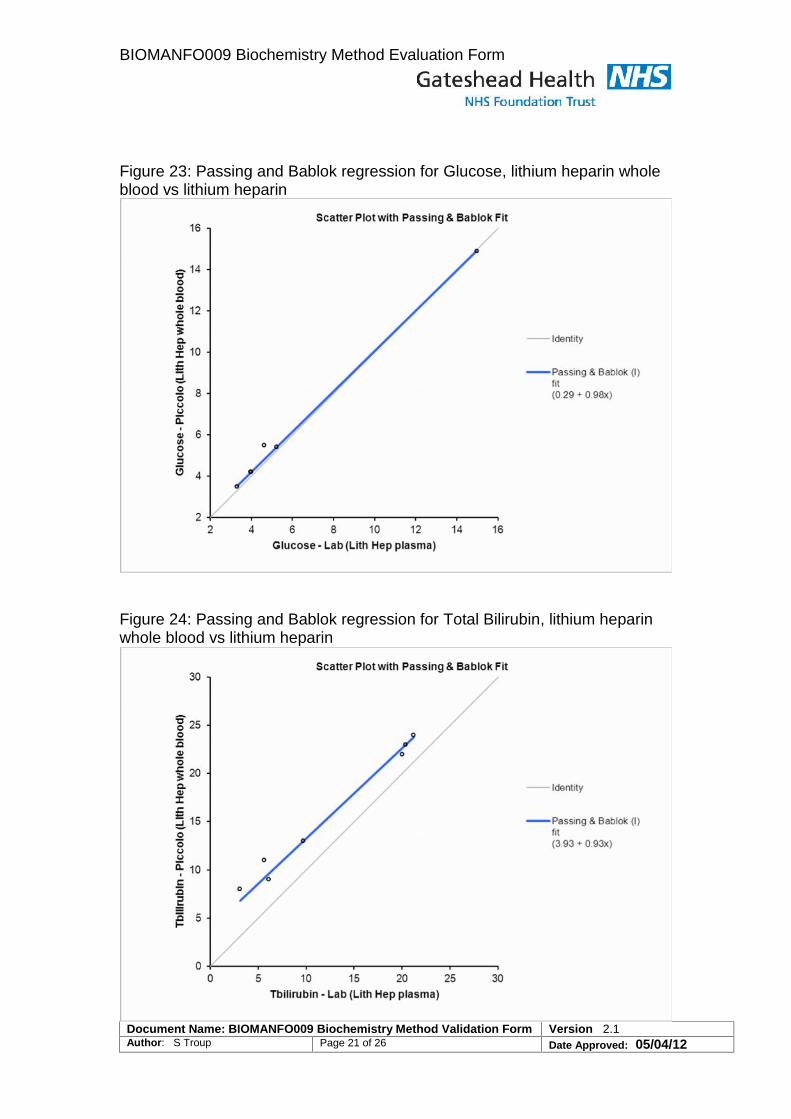
A mixed bias was seen for total bilirubin (y = 0.88x + 4.98). This bias was notconsidered to be significant.
A small proportional positive bias was seen for total protein, again this was notconsidered to be significant.
Urate showed a small constant negative bias, but was not considered to besignificant.
Figure 1: Passing and Bablok regression for Albumin

BIOMANFO009 Biochemistry Method Evaluation Form
Document Name: BIOMANFO009 Biochemistry Method Validation Form Version 2.1Author: S Troup Page 9 of 26 Date Approved: 05/04/12
Figure 2: Passing and Bablok regression for ALP
Figure 3: Passing and Bablok regression for ALT

BIOMANFO009 Biochemistry Method Evaluation Form
Document Name: BIOMANFO009 Biochemistry Method Validation Form Version 2.1Author: S Troup Page 10 of 26 Date Approved: 05/04/12
Figure 4: Passing and Bablok regression for Amylase
Figure 5: Passing and Bablok regression for AST

BIOMANFO009 Biochemistry Method Evaluation Form
Document Name: BIOMANFO009 Biochemistry Method Validation Form Version 2.1Author: S Troup Page 11 of 26 Date Approved: 05/04/12
Figure 6: Passing and Bablok regression for Urea
Figure 7: Passing and Bablok regression for Calcium
BIOMANFO009 Biochemistry Method Evaluation Form
Document Name: BIOMANFO009 Biochemistry Method Validation Form Version 2.1Author: S Troup Page 12 of 26 Date Approved: 05/04/12
Figure 8: Passing and Bablok regression for Creatinine
Figure 9: Passing and Bablok regression for GGT
BIOMANFO009 Biochemistry Method Evaluation Form
Document Name: BIOMANFO009 Biochemistry Method Validation Form Version 2.1Author: S Troup Page 13 of 26 Date Approved: 05/04/12
Figure 10: Passing and Bablok regression for Glucose
Figure 11: Passing and Bablok regression for Total bilirubin

BIOMANFO009 Biochemistry Method Evaluation Form
Document Name: BIOMANFO009 Biochemistry Method Validation Form Version 2.1Author: S Troup Page 14 of 26 Date Approved: 05/04/12
Figure 12: Passing and Bablok regression for Total protein
Figure 13: Passing and Bablok regression for Urate
BIOMANFO009 Biochemistry Method Evaluation Form
Document Name: BIOMANFO009 Biochemistry Method Validation Form Version 2.1Author: S Troup Page 15 of 26 Date Approved: 05/04/12
o Patient comparison – lithium heparin whole blood vs Lithiumheparin plasma
Patient samples which had been sent to the laboratory in lithium heparinsample tubes (i.e. for ketone analysis) were analysed as whole blood on thePiccolo Xpress. These samples were then centrifuged to obtain the plasma,which was then analysed for all parameters on the Roche cobas c701. Due toa limited number of reagent disks this could only be performed for 8 patientsamples. Further comparison may be appropriate.
Figures 14-26 show the Passing & Bablok regression analysis for lithiumheparin whole blood versus lithium heparin plasma for all analytes included inthe chemistry 13 reagent disk.
Good comparison was seen between lithium heparin whole blood and plasmasamples for albumin (y = 0.97x + 1.13).
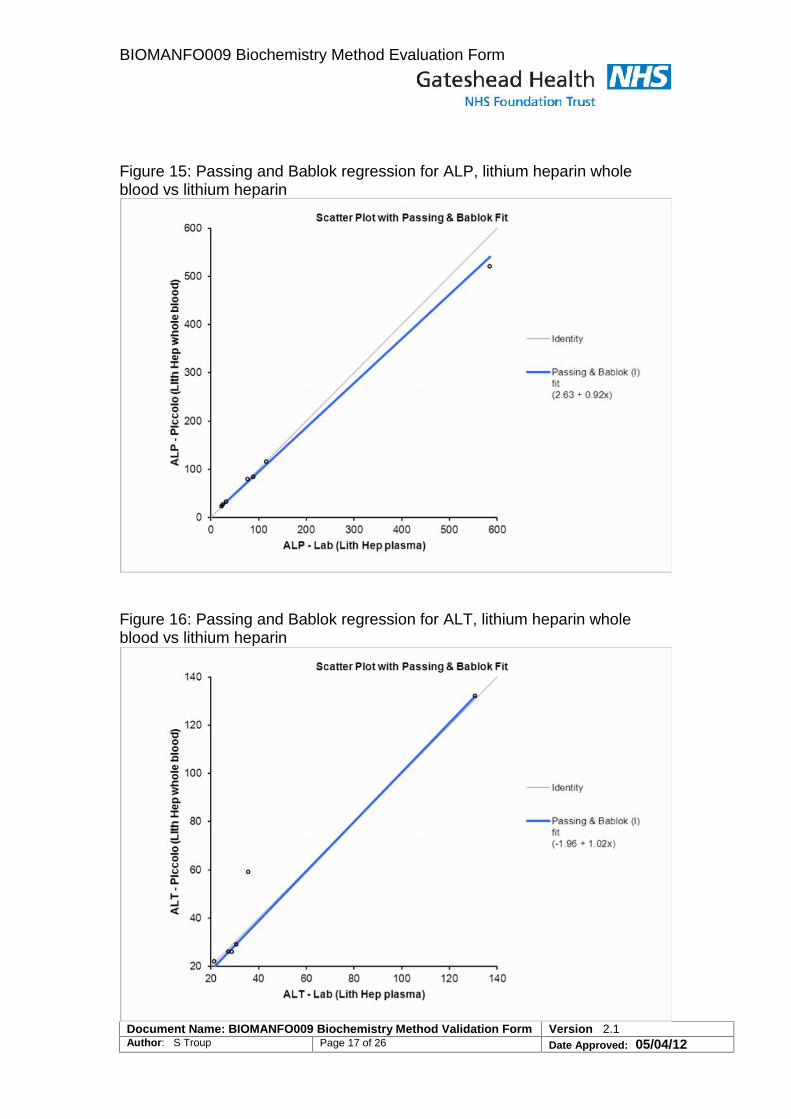
Good comparison was seen between lithium heparin whole blood and plasmasamples for ALP (y = 0.97x + 1.13).
Good comparison was seen between lithium heparin whole blood and plasmasamples for ALT (y = 0.97x + 1.13).
A positive bias was seen for amylase on whole blood lithium heparin versuslithium heparin plasma. Again, this bias may be attributable to the differencesin what each assay is measuring. The laboratory assay is specific forpancreatic amylase whereas the Piccolo Xpress measures total amylase.
A small constant positive bias was seen between whole blood lithium heparinversus lithium heparin plasma for AST, however, this was not considered tobe significant.
Good comparison was seen between lithium heparin whole blood and plasmasamples for urea (y = 1.03x – 0.35).
A mixed bias was seen for calcium on whole blood lithium heparin versuslithium heparin plasma. Further comparison of samples would be beneficial,especially if the more stable laboratory calcium assay is introduced.
A negative bias was seen for Creatinine (y = 0.92x -7.00). Again this bias wasnot considered to be significant.
Good comparison was seen between lithium heparin whole blood and plasmasamples for GGT (y = 1.10x - 4.82).

BIOMANFO009 Biochemistry Method Evaluation Form
Document Name: BIOMANFO009 Biochemistry Method Validation Form Version 2.1Author: S Troup Page 16 of 26 Date Approved: 05/04/12
Good comparison was seen between lithium heparin whole blood and plasmasamples for Glucose (y = 0.98x + 0.29).A positive bias was seen for total bilirubin. This bias was not considered to besignificant.
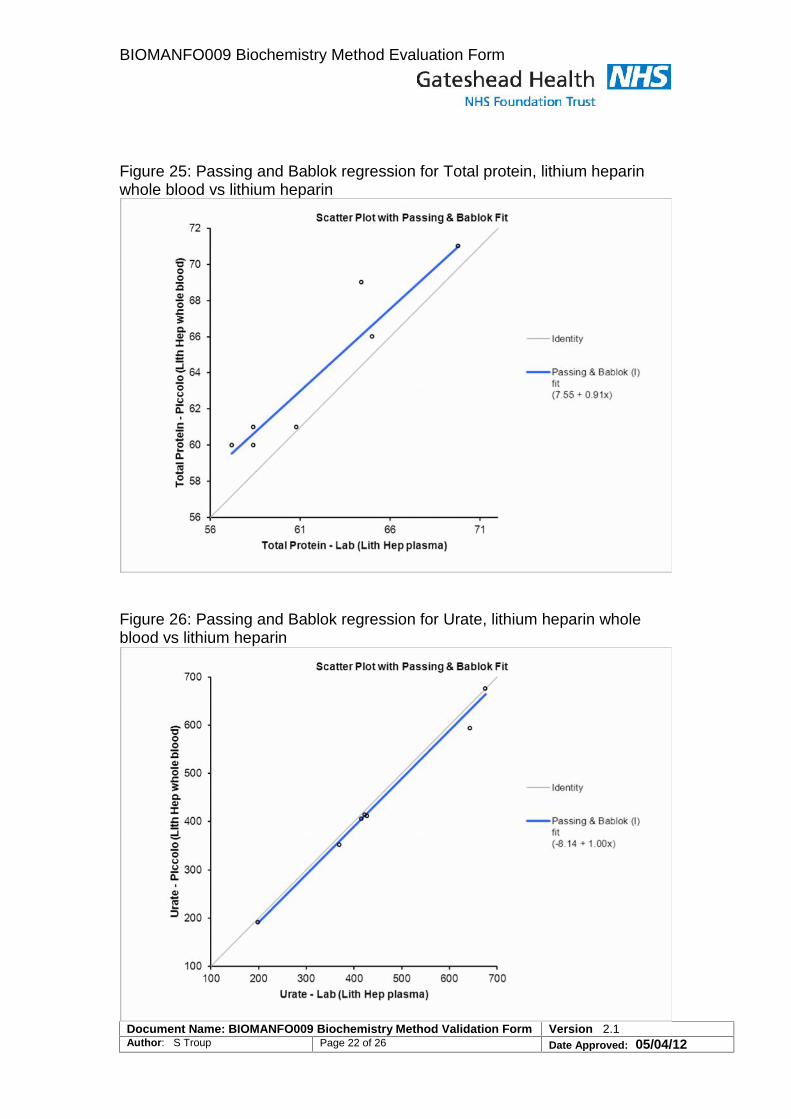
A positive bias was seen for total protein, again this was not considered to besignificant.
Good comparison was seen between lithium heparin whole blood and plasmasamples for Urate.
Figure 14: Passing and Bablok regression for Albumin, lithium heparin wholeblood vs lithium heparin
BIOMANFO009 Biochemistry Method Evaluation Form
Document Name: BIOMANFO009 Biochemistry Method Validation Form Version 2.1Author: S Troup Page 17 of 26 Date Approved: 05/04/12
Figure 15: Passing and Bablok regression for ALP, lithium heparin wholeblood vs lithium heparin
Figure 16: Passing and Bablok regression for ALT, lithium heparin wholeblood vs lithium heparin

BIOMANFO009 Biochemistry Method Evaluation Form
Document Name: BIOMANFO009 Biochemistry Method Validation Form Version 2.1Author: S Troup Page 18 of 26 Date Approved: 05/04/12
Figure 17: Passing and Bablok regression for Amylase, lithium heparin wholeblood vs lithium heparin
Figure 18: Passing and Bablok regression for AST, lithium heparin wholeblood vs lithium heparin

BIOMANFO009 Biochemistry Method Evaluation Form
Document Name: BIOMANFO009 Biochemistry Method Validation Form Version 2.1Author: S Troup Page 19 of 26 Date Approved: 05/04/12
Figure 19: Passing and Bablok regression for Urea, lithium heparin wholeblood vs lithium heparin
Figure 20: Passing and Bablok regression for Calcium, lithium heparin wholeblood vs lithium heparin

BIOMANFO009 Biochemistry Method Evaluation Form
Document Name: BIOMANFO009 Biochemistry Method Validation Form Version 2.1Author: S Troup Page 20 of 26 Date Approved: 05/04/12
Figure 21: Passing and Bablok regression for Creatinine, lithium heparinwhole blood vs lithium heparin
Figure 22: Passing and Bablok regression for GGT, lithium heparin wholeblood vs lithium heparin
BIOMANFO009 Biochemistry Method Evaluation Form
Document Name: BIOMANFO009 Biochemistry Method Validation Form Version 2.1Author: S Troup Page 21 of 26 Date Approved: 05/04/12
Figure 23: Passing and Bablok regression for Glucose, lithium heparin wholeblood vs lithium heparin
Figure 24: Passing and Bablok regression for Total Bilirubin, lithium heparinwhole blood vs lithium heparin
BIOMANFO009 Biochemistry Method Evaluation Form
Document Name: BIOMANFO009 Biochemistry Method Validation Form Version 2.1Author: S Troup Page 22 of 26 Date Approved: 05/04/12
Figure 25: Passing and Bablok regression for Total protein, lithium heparinwhole blood vs lithium heparin
Figure 26: Passing and Bablok regression for Urate, lithium heparin wholeblood vs lithium heparin

BIOMANFO009 Biochemistry Method Evaluation Form
Document Name: BIOMANFO009 Biochemistry Method Validation Form Version 2.1Author: S Troup Page 23 of 26 Date Approved: 05/04/12
o EQA comparisonDue to the number of reagent discs available, EQA performance was notassessed.
o Dilution checkSamples with results outside of the measuring range should not be diluted.
Imprecisiono Within run – see between runo Between run
Precision was found to be acceptable for all analytes (<5 %CV) exceptcreatinine and ALT - see table 1 for data.
The level 1 QC for creatinine had a mean concentration of 42.8µmol/L andgave a %CV of 16.12. This is higher than is desirable even for a point of careinstrument and has been fed back to the manufacturer.
The level 1 QC for ALT had a mean concentration of 26.8 U/L and gave a%CV of 5.95. This is probably acceptable precision for a point of care device.
o Measurement uncertaintyMeasurement uncertainty is estimated as being the intermediate imprecisionexpressed as 1 SD. The intermediate imprecision is the imprecision of theanalytical method over a period of time, taking into account changes inreagent lots and calibration lots. Cannot be determined at this time and to bedetermined at a later date.
Other (if applicable, e.g. non-CE marked method, or change of use ofCE marked method) – Not applicable.
o Limit of detectiono Limit of quantitationo Linear rangeo Recoveryo Interferenceo Analyte stability

BIOMANFO009 Biochemistry Method Evaluation Form
Document Name: BIOMANFO009 Biochemistry Method Validation Form Version 2.1Author: S Troup Page 24 of 26 Date Approved: 05/04/12
Table 1: Precision data for all analytes in the chemistry 13 panel.
Level 1 Level 2
Within Day Between Day Within Day Between Day
Mean %CV %CV Mean %CV %CV
Albumin 32.80 2.55 2.35 45.00 0.00 3.07
ALP 79.00 4.56 4.83 367.20 1.53 3.28
ALT 26.80 8.09 5.95 158.00 0.45 1.83
Amylase 36.80 1.22 1.71 333.80 2.13 1.50
AST 31.60 1.73 3.54 180.60 0.50 0.84
Urea 4.62 3.56 2.33 23.52 1.02 0.82
Calcium 1.65 2.03 1.68 2.83 2.05 1.39
Creatinine 42.80 13.26 16.12 432.00 1.00 2.27
GGT 25.40 4.49 5.54 139.80 0.93 0.79
Glucose 3.00 0.00 0.00 15.06 0.36 0.35Totalbilirubin 18.20 2.46 3.71 85.20 0.52 1.44
Total Protein 44.60 1.23 1.20 77.40 1.16 1.02
Urate 165.60 1.01 2.66 497.20 1.44 1.62
BIOMANFO009 Biochemistry Method Evaluation Form
Document Name: BIOMANFO009 Biochemistry Method Validation Form Version 2.1Author: S Troup Page 25 of 26 Date Approved: 05/04/12
Cost implicationsInstrumentation & IT connectivityThe capital cost of each instrument does not include interfacing of the PiccoloXpress to the LIMS.
Quality ControlRandox Chemistry QC material which is currently used by the laboratory issuitable for use on the Piccolo Xpress. The cost of the QC material is QCcosts are included in the laboratory cost per test.
Turn around times
This assay is intended to be performed in the A&E department. It is thereforeexpected for the turnaround time to improve. This does rely on suitably trainedstaff being available to perform the analysis as well as machine availability.The chemistry 12 panel takes approx. 12 minutes.
Conclusion
The Piccolo Xpress chemistry analyser and chemistry 13 reagent disk havebeen evaluated by the Point of Care department. The evaluation has shownthat the assays are suitable, in terms of performance for use in the A&Edepartment. Further work to be carried out include
1) Analysis of EQA material2) Repeat comparison of calcium on the Piccolo versus the laboratory
assay, particularly if a more stable calcium assay is introduced into thelaboratory.
3) Repeat precision for creatinine and ALT.
Funding to cover the costs of purchase, reagents, QC and maintenanceneeds to be identified.

BIOMANFO009 Biochemistry Method Evaluation Form
Document Name: BIOMANFO009 Biochemistry Method Validation Form Version 2.1Author: S Troup Page 26 of 26 Date Approved: 05/04/12
Confirmation Method Evaluation
Date of Introduction: Date Signature
Staff Name (print):
Departmental BMS 4 Name (print):
Head of Department Name (print)