Biochemical Evolution - Instituto de Biociênciasdreyfus.ib.usp.br/bio5706/Wilson_et_al_1977.pdf ·...
67
Ann. Rev. Biochem. 1977 46:573-639 Copyright © 1977 by Annual Reviews Inc. A rights reserved BIOCHEMICAL EVOLUTION Aan C Wilson, Steven S Carlson, 1 and Thomas J White 2 Department of Biochemistry, University of California, Berkeley, California 94720 CONTENTS PERSPECTIVES AND SUMMARY .. . .. . .. .. ................. . .. .. . .. .... .... . .. . . .. . ... . .. ...... . .. . .. .... ... 574 INTRODUCTION .......... . .. . .... . ................ .. . ... . . .. ............. .. . .. . . ..... .... . .. . . . . . . .. . . ...... .... . . .. . .. . . 577 EVOLUTIONARY CLOCK-THE EVIDENCE........................................................ 577 Primary Considerations.......................................................................................... 577 Protein Sequences.................................................................................................... 582 Protein Immunology ..................... ......................................................................... 583 Protein Electrophoresis . ......... .................. . .. . ..... . ............ . .. . ...... ................ . .. . . . .. . .... . 585 DNA Annealing ............ .............................. ........................ . .................. . .. .............. 587 EVOLUTIONARY CLOCK-THE OBJECTIONS ................. . ... ...... ......................... 587 Molecular Evolution in Primates .... . ................. . ................. . .................... . . . ........ 587 The Generation- Time Hypothesis .................................. .. . ............... .. . ..... ............ 592 Anomalous Rates of Protein Evolution .............................................................. 598 Rates of Sequence Evolution foowing a Gene Duplication . ....................... 602 Stochastic Variation................................................................................................ 604 BASIS FOR THE CLOCK ...... .. ... . . . .... ............. .... .. . ........ . ... .... . . .. . ... .. . ... .. .......... . . .. . . ... . .. 608 Dferent Rates for Dferent Functional Classes of Proteins ................. . ... ... 608 Neutralists versus Positive Selectionists ... . ... . .. .. ...................... ........ ............. ... . ... 613 ORGANISMAL RATES VERSUS MOLECULAR RATES...................................... 616 Frogs versus Mammals .......................................................................................... 617 Other Organisms ........................................ ........ ........................................ ..... ....... 618 Blue-green Algae ............. . . ........................ . ........ .............. ... ................................ ... 618 IPresent address: Department of Biochemistry and Biophysics, University of California Medical Center, San Francisco, California 94143. 2Present address: Department of Biochemistry, University of Wisconsin, Madi- son, Wisconsin 53706. 573 Annu. Rev. Biochem. 1977.46:573-639. Downloaded from www.annualreviews.org by Universidade de Sao Paulo (USP) on 10/07/13. For personal use only.
Transcript of Biochemical Evolution - Instituto de Biociênciasdreyfus.ib.usp.br/bio5706/Wilson_et_al_1977.pdf ·...

Ann. Rev. Biochem. 1977. 46:573-639 Copyright © 1977 by Annual Reviews Inc. AJ/ rights reserved
BIOCHEMICAL EVOLUTION
Allan C. Wilson, Steven S. Carlson, 1 and Thomas J. White 2
Department of Biochemistry, University of California, Berkeley, California 94720
CONTENTS
PERSPECTIVES AND SUMMARY ... ......................................................................... 574 INTRODUCTION .......................................................................................................... 577 EVOLUTIONARY CLOCK-THE EVIDENCE........................................................ 577
Primary Considerations.......................................................................................... 577 Protein Sequences.................................................................................................... 582 Protein Immunology ................................... ........................................................... 583 Protein Electrophoresis .......................................................................................... 585 DNA Annealing ...................................................................................................... 587
EVOLUTIONARY CLOCK-THE OBJECTIONS ................. . ... ......... . .................. ... 587 Molecular Evolution in Primates ................................................................ ........ 587 The Generation-Time Hypothesis ........................................................................ 592 Anomalous Rates of Protein Evolution .............................................................. 598 Rates of Sequence Evolution following a Gene Duplication ........................ 602 Stochastic Variation................................................................................................ 604
BASIS FOR THE CLOCK ...................................................................... .............. ........ 608 Different Rates for Different Functional Classes of Proteins ........................ 608 Neutralists versus Positive Selectionists ........ ....................... ............................ ... 613
ORGANISMAL RATES VERSUS MOLECULAR RATES...................................... 616 Frogs versus Mammals .......................................................................................... 617 Other Organisms ................................................ .................................................... 618 Blue-green Algae .................................................................................................... 618
IPresent address: Department of Biochemistry and Biophysics, University of California Medical Center, San Francisco, California 94143.
2Present address: Department of Biochemistry, University of Wisconsin, Madison, Wisconsin 53706.
573
Ann
u. R
ev. B
ioch
em. 1
977.
46:5
73-6
39. D
ownl
oade
d fr
om w
ww
.ann
ualr
evie
ws.
org
by U
nive
rsid
ade
de S
ao P
aulo
(U
SP)
on 1
0/07
/13.
For
per
sona
l use
onl
y.

574 WILSON, CARLSON & WHITE
REGULATORY EVOLUTION . . . . . . . . . . . . . . . . . . . . . . . . . . . . . . . . . . . . . . . . . . . . . . . . . . . . . . . . . . . . . . . . . . . . . . . . . . . . . . . . . . . . 620 Acquisition of New Functions by Microbes........................................................ 620 Changing Enzyme Levels in Animal Evolution................................................ 622 Hybrid Inviability.................................................................................................... 625
GENE DUPLICATION . . . . . . . . . . . . . . . . . . . . . . . . . .. . . . . . .. . . . . . . . . . . . . . . . . . . . . . . .. . . . . . . . . . . . . . . . . . . . . . . . . . . . . . . . . . . . . . . 625 GENE REARRANGEMENT . . . . . . . . . . . . . . . . . . . . . . . . . . . . . . . . . . . . . . . . . . . . . . . . . . . . . . . . . . . . . . . . . . . . . . . . . . . . . . . . . . . . . . 627 HORIZONTAL GENE TRANSFER . . . ... . . . . .. . . . . . ... . . . . . . . . . . . . . . . . . . . . . . . . . . . . . . . . . . . . . . . . . . . . . . . . . . . . . . 628
Plasmid Evolution .................................................................................................. 629 Virogene Evolution.................................................................................................. 630
Expectations of a Genetic Transfer Hypothesis ................................................ 63 1 CONCLUSIONS AND PROSPECTS . . . . . . . . . . . . . . . . . . . . . . . . . . . . . . . . . . . . . . . . . . . . . . . . . . . . . . . . . . . . . . . . . . . . . . . . . . 632
PERSPECTIVES AND SUMMARY
As soon as methods were developed for determining the amino acid sequences of proteins, biochemists began to look for species differences in amino acid sequence. Although the original goal was to identify the amino acid residues necessary for protein function, it quickly became evident that these comparative studies on proteins, along with similar studies on nucleic acids, would also give insight into evolution at the gene level. Specifically, the comparison of sequences from species whose times of evolutionary divergence were known allowed an estimate of the rates at which mutations have been accumulating in genes. The most intriguing and controversial result of these studies was that sequences change at nearly constant rates.
Although there has been much debate about the degree of rate constancy and about the factors underlying the rate constancy, the data indicate that the variation in rates within a given protein class is about twice that expected for a simple Poisson process, such as radioactive decay. To this extent, the sequences in genes and proteins evolve in a clocklike manner.
The empirical finding that genes and proteins behave approximately as evolutionary clocks is proving useful in the fields of paleontology, anthropology, and systematic biology. As sequence evolution is mainly divergent, it is relatively easy to reconstruct phylogenetic trees from sequence data. These trees depict the approximate order of branching of the lineages leading to modern species from a common ancestor. Phylogenetic analysis of sequence data is making major contributions to knowledge of evolutionary relationships among both organisms and organelles.
Molecular phylogenies also contain information about times of divergence. If the absolute time is known for one branching event, approximate estimates of the times of other branching events in the tree can be made. This approach has been used to date the branching event separating the human lineage from that leading to apes. Reexamination of fossil evidence suggests that the biochemically derived date of 5 million years is plausible.
Ann
u. R
ev. B
ioch
em. 1
977.
46:5
73-6
39. D
ownl
oade
d fr
om w
ww
.ann
ualr
evie
ws.
org
by U
nive
rsid
ade
de S
ao P
aulo
(U
SP)
on 1
0/07
/13.
For
per
sona
l use
onl
y.
BIOCHEMICAL EVOLUTION 575
These and other studies indicate that the molecular approach will prove increasingly useful in establishing a more detailed time record of evolutionary events than can be obtained by consideration of the fossil record alone.
Although a majority of those biochemists who study macromolecular evolution agree that sequence evolution is strongly dependent on elapsed time, there is less agreement about whether the clock is geared to years or to generations. Using the data available for 12 polypeptides, we have compared the number of sequence changes that have accumulated along the lineages of 26 species pairs of long- and short-generation-Iength organisms since their divergence from a common ancestor. Our review indicates that, at least for mammals, years are more important than generations for sequence evolution.
Although sequence evolution generally goes on at an approximately constant rate for proteins within a given functional class, that rate is not necessarily the same for proteins having different functions. Serum albumin, for instance, has evolved at a rate consistently greater than that of cytochrome c. Differences in evolutionary rate are thought to be due to differences in the probability of fixation of mutations. We propose that rates of protein evolution depend both on the probability that a substitution will be compatible with the biochemical function of the protein and on the dispensability of the protein to the organism, i.e. the probability that an organism can survive and reproduce without it.
Although we seem to understand why some classes of proteins evolve faster than others, it has been hard to understand why the rate is steady within a given class. As explanations involving positive natural selection did not seem satisfactory, some workers proposed a non-darwinian explanation. According to this hypothesis, the random fixation of selectively neutral substitutions is responsible for much of sequence evolution in genes and proteins. Recently, a theory involving positive selection was proposed to explain the evolutionary clock. The available evidence has not allowed a discrimination to be made between these hypotheses.
Although molecular and organismally derived phylogenies generally agree with respect to branching order, there is an important discrepancy between sequence evolution and evolution at the organismal level. In the same span of time, one group of organisms (e.g. mammals) can show a great deal of morphological evolution, while another group (e.g. frogs) can remain essentially unchanged morphologically. However, the proteins of frogs generally show the same rate of sequence change as in mammals. Our review did not uncover any convincing evidence that phenotypically conservative organisms (i.e. "living fossils") have experienced retarded sequence evolution or that sequence evolution has been accelerated in organisms whose rates of phenotypic change are unusually rapid. This result raises
Ann
u. R
ev. B
ioch
em. 1
977.
46:5
73-6
39. D
ownl
oade
d fr
om w
ww
.ann
ualr
evie
ws.
org
by U
nive
rsid
ade
de S
ao P
aulo
(U
SP)
on 1
0/07
/13.
For
per
sona
l use
onl
y.

576 WILSON, CARLSON & WHITE
doubts about the relevance of sequence evolution to the evolution of organisms.
Phenotypic change may be based On only a small minority of the evolutionary changes in sequence. Major phenotypic changes, such as the acquisition of a novel metabolic ability, usually depend initially on increases in the activity of a rate-limiting protein. The activity increase could in principle be brought about by point mutations in the structural gene coding for that protein. Experimental studies of microbial evolution show, however, that the activity increase is usually brought about by other sorts of mutations. Chief among these are quantitative mutations that increase the effective concentration of the rate-limiting protein. These quantitative effects can result from point mutations in control genes (i.e. classical regulatory genes and genes that exert control at levels other than transcription) as well as from chromosomal mutations that alter the arrangement of genes. Quantitative mutations affecting enzymes levels may also have had a major role in the adaptive metabolic evolution of multicellular organisms.
It is notable that rates of evolutionary change in gene rearrangement are unusually high in those groups with high rates of phenotypic evolution and high rates of speciation. It is possible that chromosomal mutations influence phenotypic evolution directly by acting as regulatory mutations. This influence might, however, be indirect. Chromosomal mutations might act chiefly as sterility barriers, which facilitate speciation, i.e. the process by which one species splits into two. Speciation may, in turn, facilitate phenotypic evolution.
Gene duplication is thought to have had a major role in the evolution of new functions. By this mechanism, which allows retention of old functions while new ones are added, organisms can increase in complexity. Although some workers have focused particular attention on the association between gene duplication and the evolution of structural genes with new functions, we draw attention in this review to the frequent association of regulatory evolution with gene duplication.
Extrachromosomal elements may be an important factor in the acquisition of new genes and functions both within a species and among closely related organisms. The question of whether integration of genes transferred by plasm ids or viruses between phylogenetically remote species has been used repeatedly in adaptive evolution remains to be answered.
Biochemical evolution is an unusual field, insofar as changes occurring at the molecular level cannot be completely understood without considering their relationship to changes at the phenotypic and population levels. In the past there was little interaction between biochemistry and molecular genetics, on the One hand, and fields like popUlation genetics, cytogenetics, taxonomy, paleontology, and sociobiology, on the other hand. In the future, integration of knowledge obtained from all of these diverse fields will be
Ann
u. R
ev. B
ioch
em. 1
977.
46:5
73-6
39. D
ownl
oade
d fr
om w
ww
.ann
ualr
evie
ws.
org
by U
nive
rsid
ade
de S
ao P
aulo
(U
SP)
on 1
0/07
/13.
For
per
sona
l use
onl
y.

BIOCHEMICAL EVOLUTION S77
necessary if one is to understand the relationship between biochemical evolution and the evolution of organisms.
INTRODUCTION
This review deals with the contributions of comparative studies on the nucleic acids and proteins of present-day organisms to knowledge of evolution. On the whole, this has been the most conceptually interesting subject in the field of biochemical evolution during the past decade, although important advances have also been made in our understanding of the origin of life (1-4). Numerous reviews (5-21) and symposia (22-25) have been published recently on some of the evolutionary implications of comparative studies with macromolecules.
Evolutionary biochemists are concerned with both the occurrence and the fixation of mutations. A newly arisen mutation in a given gene is initially present in a single organism in a population. When those descendants who bear the mutant gene predominate in the population, the mutant gene is said to have been fixed. Macromolecular sequence studies show that base substitutions account for the great majority of fixations (11 , 26-28), even though many other types of mutations are known from genetic evidence to occur frequently, e.g. additions, deletions, unequal crossovers, duplications, translocations, and inversions (29-31). Most of the base substitutions fixed in structural genes are silent, i.e. they occur at the third position of codons and do not result in amino acid substitutions (32-35). This is consistent with the view that most mutations are deleterious and are eliminated by natural selection.
The main concern of this review is with the rates at which base substitutions and amino acid substitutions have been fixed and with the relationship between these rates and the rates of organismal evolution. We consider topics that have not been comprehensively reviewed before, such as molecular evolution in primates, the generation-time hypothesis, stochastic variation in the evolutionary clock, and the relationship between sequence evolution and organismal evolution. The evolutionary roles of horizontal gene transfer and of macromutations involving duplications and rearrangements are also discussed.
EVOLUTIONARY CLOCK-THE EVIDENCE
Primary Considerations The discovery of the evolutionary clock stands out as the most significant result of research in molecular evolution. Since the possibility that macromolecular sequences evolved at constant rates was first recognized in 1962 by Zuckerkandl & Pauling (26), a large body of evidence consistent with
Ann
u. R
ev. B
ioch
em. 1
977.
46:5
73-6
39. D
ownl
oade
d fr
om w
ww
.ann
ualr
evie
ws.
org
by U
nive
rsid
ade
de S
ao P
aulo
(U
SP)
on 1
0/07
/13.
For
per
sona
l use
onl
y.
578 WILSON, CARLSON & WHITE
this possibility has accumulated. We first review evidence for and against the existence of a clocklike phenomenon at the molecular sequence level and later discuss the possible mechanisms underlying it.
To obtain evidence regarding absolute rates of macromolecular evolution, one usually compares the sequences of bases or amino acids in homologous macromolecules from representatives of two or more species whose absolute times of divergence are known. The number of sequence differences that have accumulated in each lineage since two species diverged from a common ancestor, divided by the divergence time, gives the absolute rate" of macromolecular evolution along each lineage. Thus estimation of absolute evolutionary rates involves the concepts of homology and paleontological estimates of times of divergence. Sequences related by descent from a common ancestral sequence are referred to as homologous. For rate studies, one must compare directly only those homologous sequences whose phylogenetic branching order precisely reflects that of the species in which they are found. Such sequences may be referred to as orthologous (36). They may be contrasted with paralogous sequences such as the a- and /3-chains of hemoglobin. The a- and /3-chains are products of a gene duplication that was fixed long before mammals arose. Since the time of the duplication event, both sequences have been evolving independently in each species. For example, all mammals tested have both a- and /3-chains. If one were to compare the a-chain of one mammal with the /3-chain of another mammal, the comparison would be paralogous. One would be comparing two sequences whose time of divergence was much greater than that of the species being compared. As the time of a gene duplication cannot be determined directly from the fossil record, the measurement of absolute rates of molecular evolution must be made by comparing orthologous sequences only.
. .
DISTANCE ESTIMATES It was recognized quite early (37) that simply counting amino acid sequence differences between two proteins can underestimate the total number of mutations fixed. This is due to the occurrence of multiple substitutions at the same amino acid site. Methods for correcting sequence data for this effect have been proposed (8, 37-39), all of which involve assumptions about the nature of molecular evolution. A more empirical approach has been to use phyletic distance to estimate the effect of multiple substitutions at the same site. Phyletic distance is the number of sequence substitutions that have occurred as estimated by construction of phylogenetic trees from sequence data. After discussing briefly the methods for construction of phylogenetic trees, we consider the effect of multiple substitutions on the evolutionary clock.
PHYLOGENETIC TREES Macromolecular sequences contain an approximate record of their past evolutionary ancestry. Procedures that are cur-
Ann
u. R
ev. B
ioch
em. 1
977.
46:5
73-6
39. D
ownl
oade
d fr
om w
ww
.ann
ualr
evie
ws.
org
by U
nive
rsid
ade
de S
ao P
aulo
(U
SP)
on 1
0/07
/13.
For
per
sona
l use
onl
y.

BIOCHEMICAL EVOLUTION 579
rently available permit the reconstruction of this ancestry within the limitations of the data. These methods allow the calculation of an evolutionary branching order for these sequences and the number of sequence substitutions per branch. This construction is a molecular phylogenetic tree. These trees provide a useful framework for analysis of rates of evolution and taxonomic relationships.
There are currently three types of procedures: matrix methods, maximum parsimony methods, and an ancestral sequence method. Basic to all of these methods is some mathematical criterion that allows one particular tree to be selected from the many possible alternatives for a given set of orthologous macromolecular sequences. For example, the procedure of Fitch & Margoliash (40) chooses the phylogenetic tree that minimizes the difference between the tree distances (phyletic distances) and the observed sequence differences.
Matrix methods for constructing trees utilize a table of sequence differences among all possible pairs of the sequences. These methods require only a knowledge of the number of sequence differences and not the actual changes. Thus, matrix procedures are very useful for data in cases where the actual macromolecular sequences have not been determined (i.e. for electrophoretic and immunological comparisons of proteins, and DNA hybridization studies). Where matrix methods are used for protein sequence data, the sequence differences are often expressed in terms of minimum mutational distance (40). This distance is the minimum number of nucleotide substitutions required by the genetic code to account for the observed number of amino acid sequence differences between two proteins. Commonly used matrix methods include those of Fitch & Margoliash (40), Farris (4 1), and Moore, Goodman & Barnabas (42). Additional matrix methods have been proposed (42a, 42b).
Fitch (43), Fitch & Farris (44), and Moore, Barnabas & Goodman (45) have developed maximum parsimony methods for constructing the ancestral sequence codons from protein sequences using the genetic code. These methods select the phylogenetic tree that has the minimum total length. The procedures of both Fitch (43, 44) and Moore et al (45) begin with an initial branching order for the sequences. The initial branching order is either assumed from non molecular evidence (46) or calculated by a matrix method (42). Modifications of this initial order can occur with the determination of the ancestral sequences.
Dayhoff (8) has developed an ancestral sequence procedure that builds a phylogenetic tree by simultaneously determining a branching order and an ancestral sequence at each branch point. This procedure determines a minimum length tree, but does not consider the genetic code.
How accurately the reconstructed tree describes the pathways of sequence ancestry depends on the amount of parallelism and convergence that
Ann
u. R
ev. B
ioch
em. 1
977.
46:5
73-6
39. D
ownl
oade
d fr
om w
ww
.ann
ualr
evie
ws.
org
by U
nive
rsid
ade
de S
ao P
aulo
(U
SP)
on 1
0/07
/13.
For
per
sona
l use
onl
y.

580 WILSON, CARLSON & WHITE
has occurred during the evolution of the sequences (47). For example, consider three sequences-A, B, and C. Jf the number of convergent substitutions between A and C is greater than the number of substitutions shared between A and B due to commOn ancestry, then the phylogenetic tree will be constructed incorrectly. That is, A and C will show more common ancestry on the tree than will A and B (48). Parallelism and convergence definitely occur in protein sequence evolution (48) but usually not often enough to make evolutionary biochemists construct grossly incorrect trees. Phylogenetic trees constructed from orthologous sequences usually agree in branching order with the expectations of nonmolecular data (8, 46, 49) (for exceptions see the section on anomalous rates of protein evolution). In addition, there is some evidence that the branching order of an evolutionary tree is, to a first approximation, independent of the protein studied (49a).
Although there have been successive improvements in phylogenetic methods, there is still need for more work. It would be extremely useful if phylogenetic methods could indicate possible ambiguities in the branching order due to the existence of nearly equivalent alternative trees. Secondly, there is a need for a more quantitative examination of the extent of agreement between molecular and nonmolecular phylogenetic trees, as well as between the trees produced from different sorts of macromolecules, for a given set of species. These studies will give us a more complete understanding of molecular phylogenetic trees and their utility for studies of evolutionary rates.
MULTIPLE SUBSTITUTIONS AT THE SAME SITE The percent sequence difference, defined as the number of amino acid positions at which two protein sequences differ per hundred residues, is useful only over a narrow range. When phyletic distances as estimated by the procedures of Fitch (43), Fitch & Farris (44), and Moore, Goodman & Barnabas (42) are compared with percent sequence difference, an approximately linear relationship is
. observed for protein sequences differing by about 25% or less. Thus, when the percent sequence difference exceeds this value, it is preferable to use phyletic distances for evolutionary rate calculations.
Many non phyletic corrections for multiple substitutions have been developed. These range from minimal mutation distance (40) to the Poisson correction (37, 50), random evolutionary hits (38, 39), the accepted point mutation correction (8), and the augmentation correction (5 1 ). Although some of these corrections have been criticized (52-54), most of these methods give distances that correlate linearly with each other and with phyletic distance (5 1 , 52, 55, 56). It is not clear at the moment which one of these methods is the best correction for multiple substitutions at the same site.
Ann
u. R
ev. B
ioch
em. 1
977.
46:5
73-6
39. D
ownl
oade
d fr
om w
ww
.ann
ualr
evie
ws.
org
by U
nive
rsid
ade
de S
ao P
aulo
(U
SP)
on 1
0/07
/13.
For
per
sona
l use
onl
y.
BIOCHEMICAL EVOLUTION 5 8 1
DIVERGENCE TIMES Evolutionary rate calculations depend on estimates of both distance and time of divergence. Divergence requires the separation of one species into two non-interbreeding species (57-59). Once two species no longer interbreed, their macromolecules can evolve independently. Since it often takes a million years to achieve complete reproductive isolation between two species (57), rates of macromolecular evolution are usually based on comparisons of species that separated more than a million years ago.
Reliable estimates of absolute rates depend on reliable estimates of divergence times. The precision and objectivity associated with measurement of molecular-sequence differences usually hold for the isotopic dating of fossils as well. Accurate dating of fossils is not, however, the only requirement for estimation of divergence times-a fact that is overlooked in certain articles on radiometric dating (60). No matter how accurately the fossils are dated, paleontological estimates of divergence times can be plagued with uncertainty and subjectivity.
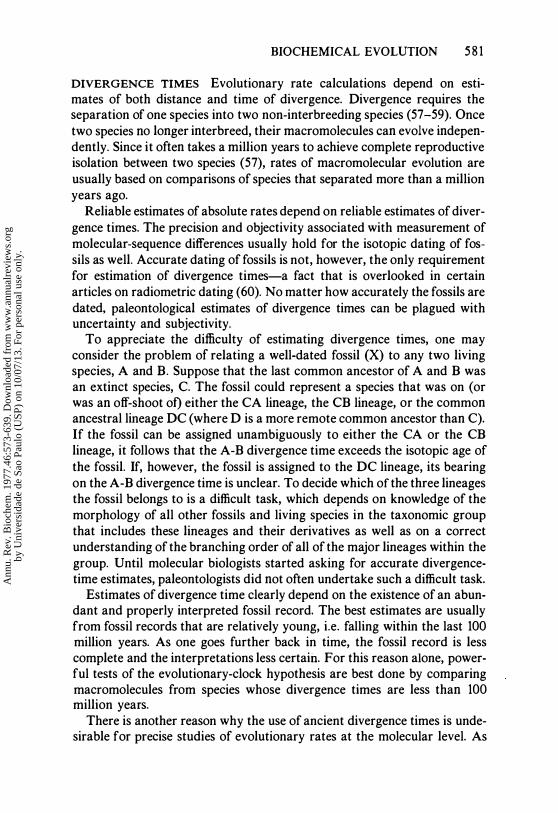
To appreciate the difficulty of estimating divergence times, one may consider the problem of relating a well-dated fossil (X) to any two living species, A and B. Suppose that the last common ancestor of A and B was an extinct species, C. The fossil could represent a species that was on (or was an off-shoot ot) either the CA lineage, the CB lineage, or the common ancestral lineage DC (where D is a more remote common ancestor than C). If the fossil can be assigned unambiguously to either the CA or the CB lineage, it follows that the A-B divergence time exceeds the isotopic age of the fossil. If, however, the fossil is assigned to the DC lineage, its bearing on the A-B divergence time is unclear. To decide which of the three lineages the fossil belongs to is a difficult task, which depends on knowledge of the morphology of all other fossils and living species in the taxonomic group that includes these lineages and their derivatives as well as on a correct understanding of the branching order of all of the major lineages within the group. Until molecular biologists started asking for accurate divergencetime estimates, paleontologists did not often undertake such a difficult task.
Estimates of divergence time clearly depend on the existence of an abundant and properly interpreted fossil record. The best estimates are usually from fossil records that are relatively young, i.e. falling within the last 100 million years. As one goes further back in time, the fossil record is less complete and the interpretations less certain. For this reason alone, powerful tests of the evolutionary-clock hypothesis are best done by comparing macromolecules from species whose divergence times are less than 100 million years.
There is another reason why the use of ancient divergence times is undesirable for precise studies of evolutionary rates at the molecular level. As
Ann
u. R
ev. B
ioch
em. 1
977.
46:5
73-6
39. D
ownl
oade
d fr
om w
ww
.ann
ualr
evie
ws.
org
by U
nive
rsid
ade
de S
ao P
aulo
(U
SP)
on 1
0/07
/13.
For
per
sona
l use
onl
y.

582 WILSON, CARLSON & WHITE
discussed previously, the greater the time depth considered, the harder it is to estimate reliably the number of substitutions fixed, owing to the greater likelihood of repeated changes at the same nucleotide site (5 1 , 56, 6 1 ). In addition, there is a higher probability of fixing gene duplications, thereby increasing the chance of inadvertently comparing macromolecules that are paralogous rather than orthologous.
Our discussion begins, therefore, with the rates of evolution of macromolecules in mammals. The mammals are a young group whose fossil record is unusually good and has been studied intensively so that we have fairly reliable information about the times of common ancestry of the lineages leading to many of the living species of mammals, particularly the carnivores and ungulates (62-66).
Protein Sequences The most rigorous published examination of the degree to which se
quence evolution depends on time is that of Fitch & Langley (54, 67). They estimated phyletically the minimum number of nucleotide substitutions required to account for the sequence differences found between various polypeptides of selected mammalian species. The combined estimates for seven polypeptides (namely, cytochrome c, myoglObin, hemoglobin achain, hemoglobin j3-chain, insulin C peptide, fibrinopeptide A, and fibrinopeptide B) are plotted in Figure 1 against the time since the species separated. Clearly, there has been an approximately constant rate of fixation of those nucleotide substitutions which produced amino acid substitutions in these seven polypeptides during the past 120 million years.
When a plot of nucleotide substitutions fixed per codon versus time is made for each class of polypeptides, each is seen to have its own characteristic rate of evolution (50)-cytochrome c, for example, has evolved consistently more slowly than fibrinopeptides. These differences in evolutionary rate between protein classes are discussed later (see the section "Basis for the Clock"). Our immediate concern is with the matter of rate constancy. Figure 1 shows that approximate rate constancy applies to a wide variety of protein types.
Owing to uncertainties in paleontologically estimated divergence times, it is difficult to determine the irregularity of the evolutionary clock from simple inspection of plots like that in Figure 1 . To estimate the variation in the evolutionary clock, an analysis of evolutionary rates must be made that does not depend on absolute estimates of divergence times (see the section on stochastic variation).
An analysis comparable to that illustrated in Figure 1 has not been done with groups other than mammals because protein sequence data are limited for nonmammals and many of these groups have poor fossil records.
Ann
u. R
ev. B
ioch
em. 1
977.
46:5
73-6
39. D
ownl
oade
d fr
om w
ww
.ann
ualr
evie
ws.
org
by U
nive
rsid
ade
de S
ao P
aulo
(U
SP)
on 1
0/07
/13.
For
per
sona
l use
onl
y.

100 III c a
-; -+0-
III .c :::J (fJ 50 Ol
"0
0 Ol u :::J
Z
BIOCHEMICAL EVOLUTION 583
III
Seven c .9
Polypeptides 15 +0-
2 III C
_ a III "0
.a 0
10 Jl U 0
OlO "0 -
� 0 Ol 5 � c-
U :::l Z
50 100 a
Divergence Time (millions of years)
Figure 1 The evolutionary clock. The estimates of time elapsed since various mammalian species separated appear on the abscissa and are based on fossil evidence. The points represent time estimates made by L Van Valen (personal communication to W. M. Fitch) and published by Fitch & Langley (67). To illustrate the uncertainty in these time estimates, we have added horizontal bars; they are based on information summarized by Romer (62, 371), Van Valen (63, 64), Lillegraven (65), and McKenna (66). This figure contains no intra-primate data because of the great paleontological uncertainty regarding divergence times within the higher primates (see text). The number of nucleotide substitutions estimated by phylogenetic inference to have been fixed in seven polypeptides was calculated by Fitch & Langley (67), using a maximum likelihood procedure, and is given by the ordinate on the left. The peptides are cytochrome c, myoglobin, hemoglobin a-chain, hemoglobin ,a-chain, fibrinopeptide A, fibrinopeptide B, and insulin C peptide. As the total number of codons compared was 578, the number of nucleotide substitutions fixed may be converted, as on the ordinate scale at the right, to nucleotide substitutions per 100 codons.
Protein Immunology
Further evidence for the existence of an evolutionary clock in both mammals and other vertebrates comes from quantitative immunological comparison of proteins such as serum albumin and transferrin. The microcomplement fixation method has been particularly useful in this regard (68-70), as it is very sensitive to small differences in amino acid sequence and is economical in its use of materials (71-77). To calibrate this method, comparative studies were made with homologous series of pure globular monomeric proteins of known amino acid sequence. A strong correlation (r = 0.9) was found to exist between immunological distance, measured by the microcomplement fixation technique, and the percentage of sites at
Ann
u. R
ev. B
ioch
em. 1
977.
46:5
73-6
39. D
ownl
oade
d fr
om w
ww
.ann
ualr
evie
ws.
org
by U
nive
rsid
ade
de S
ao P
aulo
(U
SP)
on 1
0/07
/13.
For
per
sona
l use
onl
y.

584 WILSON, CARLSON & WHITE
which amino acid substitutions have been fixed. The calibration line relating immunological distance and percent sequence difference is essentially the same for bird lysozymes (76, 78), bacterial azurins (77), plant plastocyanins (79), and mammalian ribonucleases (80). The same relationship may hold for mammalian albumins and the a-subunits of bacterial tryptophan synthetases. A similarly strong correlation exists between the degree of antigenic difference and the degree of sequence difference among mammalian cytochromes c (76), although a technique other than microcomplement fixation was used. Although the molecular basis for the sequenceimmunology correlation is uncertain, the empirical observations leave no doubt that, with the proper immunization precautions and the use of microcomplement fixation, rabbit antisera can be useful tools for estimating the approximate degree of sequence difference between naturally occurring globular, monomeric proteins. This procedure is generally useful for comparing proteins that differ in amino acid sequence over the range of 0% to 30%.
Nei (81) has reanalyzed the sequence-immunology relationship for bird lysozymes. He finds that immunological distance is more directly related to the accumulated number of amino acid substitutions per 1 00 residues than to the percent amino acid sequence differences. The accumulated number of amino acid substitutions is the percent sequence difference corrected for multiple substitutions at the same amino acid position by a Poisson method. The generality of this observation awaits further testing with other proteins for which sequence and immunological data are available.
During the past decade, the serum albumins of more than 1000 pairs of vertebrate species were compared by microcomplement fixation. Albumin is an ideal protein for evolutionary studies, as it consists of a single polypeptide chain of 580 residues (82) that represents more structural gene material than the seven combined polypeptides examined by Fitch (54). As shown in Figure 2 for two groups of mammals with a good fossil record (i.e. carnivores and ungulates), the correlation between albumin immunological distance and paleontological estimates of divergence time is strong (r = 0.96). Comparable studies of such nonmammalian groups as frogs, lizards, and crocodilians yielded rates similar to those for mammals (45, 83-88). The frog fossil record is so poor, however, that divergence times had to be estimated not only from fossil evidence but also from evidence from continental drift studies (45, 87). To illustrate this approach one may consider the tree frog subfamily Hylinae, which occurs predominantly in Australia and the New World. Studies of plate tectonics indicate that the New World and Australia were connected by way of a temperate Antarctica until about 60-70 million years ago. If the breaking of the land bridge were the event that interrupted gene flow between Australian and American tree frogs, one would expect from Figure 2 an immunological distance of 124 ± 10 between
Ann
u. R
ev. B
ioch
em. 1
977.
46:5
73-6
39. D
ownl
oade
d fr
om w
ww
.ann
ualr
evie
ws.
org
by U
nive
rsid
ade
de S
ao P
aulo
(U
SP)
on 1
0/07
/13.
For
per
sona
l use
onl
y.

BIOCHEMICAL EVOLUTION 585
the albumins of Australian and American tree frogs. Consistent with this expectation, the mean value observed was 129 ± 1 5. An analogous study with a group of mammals that live only in Australia and the New World gave an Australian-American albumin distance of 103 ± 19. Regardless of the exact time of continental separation, therefore, the mean rate of albumin divergence has been similar in frogs and mammals. In the future, the judicious use of the continental-drift approach will probably allow the evolutionary-clock hypothesis to be tested in many taxonomic groups, both plant and animal, that have poor fossil records.
Protein Electrophoresis Electrophoresis is another technique allowing examination of the relationship between time and the number of substitutions fixed. After two populations (x and y) separate, mutations causing amino acid substitutions that
OJ U
§ 100 Ui is c u
'61 o
g 50 :::3 E E
Albumin r = 0.96
OO������--�30--�--�---6LO--J
Divergence Time (millions of years)
Figure 2 Albumin as an evolutionary clock in mammals. The estimates of time elapsed since various species separated are based on fossil evidence. The species included are carnivores and ungulates, whose fossil record is unusually good (148). For each divergence considered, the horizontal bar shows the range of time estimates obtained from Van Valen (see Figure 1) and other sources (62, 372, 373); this range does not represent the possible outer limits of divergence times. The immunological distance values were obtained by comparing the albumins of various species with the microcomplement fixation test. The values may be found in (83, 142, 295, 374). The line of best fit obtained by the least-squares method is y = 1.9t - 4, where y is immunological distance and t is time in millions of years.
Ann
u. R
ev. B
ioch
em. 1
977.
46:5
73-6
39. D
ownl
oade
d fr
om w
ww
.ann
ualr
evie
ws.
org
by U
nive
rsid
ade
de S
ao P
aulo
(U
SP)
on 1
0/07
/13.
For
per
sona
l use
onl
y.

586 WILSON. CARLSON & WHITE
alter the net charge on proteins take place and become fixed independently in the two populations. By comparing the proteins encoded by a large number of structural genes, preferably 40 or more, one can determine the fraction (J) of those structural genes at which the two populations are identical electrophoretically. This fraction declines rapidly as time of divergence increases. By considering information or assumptions about the mean length of the polypeptide chains compared (I), the electrophoretic detectability of amino acid substitutions (c), and the amount of genetic polymorphism detected electrophoretically within each population, one can calculate m. the average number of amino acid substitutions fixed per codon since the population separated. The following equation, which is derived from those of Nei ( 1 8), may be used for this calculation: m = -(l/cl)loge[J/(JxJy)'h]. The term Jx is the probability of electrophoretic identity (at all of the structural gene loci examined) between two randomly chosen haploid genomes within population x. The term Jy is similarly defined with respect to population y. There is evidence that c is about 0.27 and I about 300 for the average polypeptide chain used in such electrophoretic studies (89).
This method is very useful for discriminating between the proteins of closely related organisms. It cannot be used reliably for comparing distantly related proteins because proteins differing by more than eight amino acid substitutions are likely to differ by more than one electrophoretically detectable substitution.
In the past few years, population biologists have produced protein electrophoretic estimates of the "genetic distance" between a very large number of populations and species (90-92). Although there is indirect evidence that m is correlated with time elapsed since divergence. direct evidence is fragmentary; few of the electrophoretic studies were done with populations whose history is well-established from fossil evidence. One line of indirect evidence is that albumin immunological distance correlates both with time elapsed since divergence (Figure 2) and with electrophoretic estimates of m among vertebrates (93, 94). Another line of indirect evidence has been claimed from work with Hawaiian flies. In the absence of fossil evidence, Carson (95) assumed that the species age is a function of island age. This is a questionable assumption because although the present islands are young, the Hawaiian archipelago is old (96). Islands in that region arise by volcanic action and soon disappear by erosion. Given the evanescent nature of volcanic islands and the propensity of flies for island hopping, a given species could be older or younger than the island it now inhabits. It is not surprising, therefore, that electrophoretic measures of m are only roughly correlated with divergence times inferred from island age (95). Nei (18), Ayala (9 1), and Avise (92) present additional indirect evidence that m is related to divergence time.
Ann
u. R
ev. B
ioch
em. 1
977.
46:5
73-6
39. D
ownl
oade
d fr
om w
ww
.ann
ualr
evie
ws.
org
by U
nive
rsid
ade
de S
ao P
aulo
(U
SP)
on 1
0/07
/13.
For
per
sona
l use
onl
y.

DNA Annealing
BIOCHEMICAL EVOLUTION 587
DNA annealing techniques have also provided indirect evidence consistent with the existence of an evolutionary clock. The most pertinent results come from work with that fraction of whole-genome DNA known as nonrepetitious, single-copy, or unique DNA. Heteroduplexes are formed between the unique fractions from two species. The resistance of the heteroduplexes to thermal denaturation is then compared with that of homo duplex DNA. The difference in thermostability (�T) appears, by extrapolation from studies with synthetic polymers (89), to equal approximately the percentage of base pair sites at which substitutions have been fixed. That is, � T in degrees Celsius equals percent sequence difference. Because DNA sequences differing by 20% or more do not usually anneal with high specificity (97, 98), this method cannot be used to compare distantly related species.
As will be apparent in a later section on molecular evolution in primates, most of the species compared by this method are primates or rodents whose divergence times are uncertain and controversial. Although a direct test of the clock hypothesis is thus impossible with published DNA data, an indirect test can be made. I The �T values observed in mammalian DNA studies (98-104) correlate well with albumin immunological distances ( 105, 106) as well as with Fitch & Langley estimates (67) of the number of amino acid-producing nucleotide substitutions fixed in the genes coding for seven polypeptide chains. This is consistent with clocklike evolution at the DNA level.
EVOLUTIONARY CLOCK-THE OBJECTIONS
Since the evolutionary-clock hypothesis was first proposed, many apparent discrepancies and objections have been raised to refute it. These objections were derived from empirical results that were claimed to be inconsistent with constant rates of sequence evolution. In the following sections we explore these objections in detail. Our review of the evidence indicates that while the clock may exhibit irregularities, they are usually minor and within the definition of a probabilistic evolutionary clock. Although the evolutionary clock does not appear to be as regular as a simple Poisson process, it is sufficiently regular to serve as an extremely useful tool-a tool that allows the evolution of biological processes to be studied in a quantitative manner with respect to time.
Molecular Evolution in Primates
SLOWDOWN OR RECENT DIVERGENCE? An apparently major exception to the molecular evolutionary clock arose from attempts to reconcile
Ann
u. R
ev. B
ioch
em. 1
977.
46:5
73-6
39. D
ownl
oade
d fr
om w
ww
.ann
ualr
evie
ws.
org
by U
nive
rsid
ade
de S
ao P
aulo
(U
SP)
on 1
0/07
/13.
For
per
sona
l use
onl
y.
588 WILSON, CARLSON & WHITE
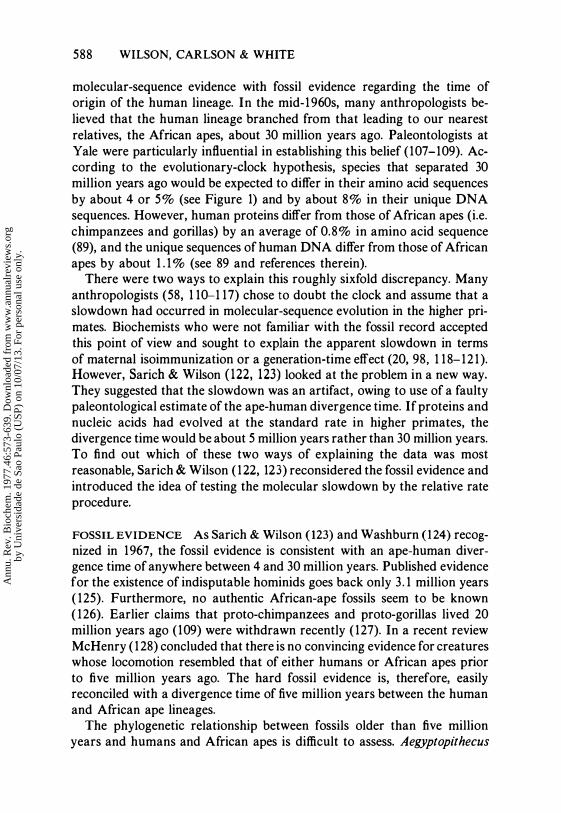
molecular-sequence evidence with fossil evidence regarding the time of origin of the human lineage. In the mid-1960s, many anthropologists believed that the human lineage branched from that leading to our nearest relatives, the African apes, about 30 million years ago. Paleontologists at Yale were particularly influential in establishing this belief (107-109). According to the evolutionary-dock hypothesis, species that separated 30 million years ago would be expected to differ in their amino acid sequences by about 4 or 5% (see Figure 1) and by about 8% in their unique DNA sequences. However, human proteins differ from those of African apes (i.e. chimpanzees and gorillas) by an average of 0.8% in amino acid sequence (89), and the unique sequences of human DNA differ from those of African apes by about 1 . 1 % (see 89 and references therein).
There were two ways to explain this roughly sixfold discrepancy. Many anthropologists (58, 1 10-1 17) chose to doubt the clock and assume that a slowdown had occurred in molecular-sequence evolution in the higher primates. Biochemists who were not familiar with the fossil record accepted this point of view and sought to explain the apparent slowdown in terms of maternal isoimmunization or a generation-time effect (20, 98, 1 1 8-12 1 ). However, Sarich & Wilson (122, 123) looked at the problem in a new way. They suggested that the slowdown was an artifact, owing to use of a faulty paleontological estimate of the ape-human divergence time. If proteins and nucleic acids had evolved at the standard rate in higher primates, the divergence time would be about 5 million years rather than 30 million years. To find out which of these two ways of explaining the data was most reasonable, Sarich & Wilson ( 122, 123) reconsidered the fossil evidence and introduced the idea of testing the molecular slowdown by the relative rate procedure.
FOSSIL EVIDENCE As Sarich & Wilson (123) and Washburn (1 24) recognized in 1967, the fossil evidence is consistent with an ape-human divergence time of anywhere between 4 and 30 million years. Published evidence for the existence of indisputable hominids goes back only 3 . 1 million years ( 125). Furthermore, no authentic African-ape fossils seem to be known ( 126). Earlier claims that proto-chimpanzees and proto-gorillas lived 20 million years ago (109) were withdrawn recently ( 127). In a recent review McHenry ( 1 28) concluded that there is no convincing evidence for creatures whose locomotion resembled that of either humans or African apes prior to five million years ago. The hard fossil evidence is, therefore, easily reconciled with a divergence time of five million years between the human and African ape lineages.
The phylogenetic relationship between fossils older than five million years and humans and African apes is difficult to assess. Aegyptopithecus
Ann
u. R
ev. B
ioch
em. 1
977.
46:5
73-6
39. D
ownl
oade
d fr
om w
ww
.ann
ualr
evie
ws.
org
by U
nive
rsid
ade
de S
ao P
aulo
(U
SP)
on 1
0/07
/13.
For
per
sona
l use
onl
y.

BIOCHEMICAL EVOLUTION 589
may be taken as an example. Although there is no doubt that this primate fossil is nearly 30 million years old, judgment about its phylogenetic position has varied. It could be on (or derived from) either the African ape lineage, the human lineage, or the common ancestral lineage for apes and humans. Early studies indicated that Aegyptopithecus belonged to the ape lineage ( 108, 109). This led to the inference that the ape-human split occurred before Aegyptopithecus lived. On the basis of later studies, however, Aegyptopithecus was assigned to the common ancestral lineage ( 126, 1 29, 1 30). Consequently, the ape-human split may have taken place more recently than 30 million years ago.
There are similar doubts about the more widely publicized Ramapithecus fossils dated at 14 million years before present. These fossils were at first assigned tentatively to the human lineage ( 126, 1 3 1 , 1 32). The implication was that the ape-human split occurred at least 14 million years ago. More careful study of the Ramapithecus material revealed that the first reconstruction of these fossil fragments was incorrect; the new reconstruction is less humanlike and now it is unclear whether to assign Ramapithecus to the human lineage or to the common ancestral lineage for African apes and humans ( 1 33). Experiences like these serve as a reminder that while it is relatively easy for paleontologists to date fossils, it is far harder for them to date divergence events objectively and reliably, especially when the fossil record is as sparse as that for primates older than five million years.
The failure of some biochemists to appreciate the need for distinguishing paleontological fact from paleontological speculation has been apparent in studies of molecular evolutionary rates in primates other than African apes and humans. For instance, the use of speculative estimates of divergence times led Doolittle (20) to infer that in primates a nonlinear relationship exists between time and substitutions fixed (Figure 3, dashed line). We may consider the time of divergence between the human lineage and that leading to Old World monkeys (Figure 3)-some paleontologists speculate that this time was 45 million years ( 107) or 30 million years ( 126). As indicated by the horizontal black bar, however, the oldest known fossils to be widely acknowledged as bona fide Old World monkeys are barely 20 million years old (l09, 1 26, 1 34). Similar discrepancies are shown for the other primate groups on which the curve in Figure 3 is based. When the paleontological facts are considered, the possibility of a rather constant rate of fixation of substitutions throughout primate evolution is by no means ruled out. Our criticism of Doolittle's interpretation applies with equal force to the interpretations made about primate evolutionary rates by Goodman et al ( 120, 1 35-138), Kohne et al (98, 99), Langley & Fitch ( 1 39), Benveniste & Todaro ( 104), and Tashian et al ( 140). In the future, it would be helpful if workers in molecular biology were to become more familiar with the quality of the
Ann
u. R
ev. B
ioch
em. 1
977.
46:5
73-6
39. D
ownl
oade
d fr
om w
ww
.ann
ualr
evie
ws.
org
by U
nive
rsid
ade
de S
ao P
aulo
(U
SP)
on 1
0/07
/13.
For
per
sona
l use
onl
y.

590 WILSON, CARLSON & WHITE
Loris Group
NW Monkeys
o.W Monkeys
Gibbon
Chimpanzee
Hard Fossil Evidence
'" '"
./
/ I
I /
1 10 / 1 roc,
0/ -<.,.§' / .::..ro
/ � / �o o / v'::> / Qro
/ / C?
Millions of Years
I I
/ (/) c 0
-15 ::J --(/)
..c ::J
if) (])
10 " -0 (]) () ::J
z 5 � 0
Figure 3 The problem of relating fibrinopeptide evolution to time of divergence in primates. The percent nucleotide substitutions required to account for the amino acid sequence differences between human fibrinopeptides and those of various other creatures are taken from Doolittle (20). The time scale refers to the time since the creatures had a common ancestor with humans. The thick horizontal bars show the time span through which there is conclusive evidence that the lineage leading to a given group of creatures was already separate from that leading to humans. The bars provide minimum estimates of divergence times. The fossil evidence on which these bars are based is mainly that presented by Simons (126) and several others (127, 129, 130, 375, 376). The curved line results from use of speculative divergence times (empty circles) and is taken from (20). The real time of divergence between humans and a given group of creatures could lie anywhere between the time corresponding to the right-hand end of the horizontal bar and a time equal to or slightly greater than that indicated by the empty circle. Hence, the possibility of a linear relationship between percent nucleotide substitutions and real divergence time is not excluded.
fossil evidence regarding divergence times before drawing firm conclusions about rates of evolution.
RELATIVE RATE TEST Besides evaluating the fossil evidence, Sarich & Wilson introduced the relative rate test ( 106, 1 22, 1 23, 14 1- 143) to detect whether molecular sequences had evolved unusually slowly in the lineage leading to the human and African ape group. Perhaps the most thorough and pertinent test is the one shown in Figure 4, in which the group comprising humans and African apes is considered as A, the Old World monkey
Ann
u. R
ev. B
ioch
em. 1
977.
46:5
73-6
39. D
ownl
oade
d fr
om w
ww
.ann
ualr
evie
ws.
org
by U
nive
rsid
ade
de S
ao P
aulo
(U
SP)
on 1
0/07
/13.
For
per
sona
l use
onl
y.

BIOCHEMICAL EVOLUTION 59 1
group is designated as B. and the common ancestor of the two groups is called C. As external-reference species (E), one may use New World monkeys. prosimians. and other placental mammals. In this test. we ask whether a, the average amount of sequence evolution in the lineage leading from C to humans and African apes, is less than b, the average amount of sequence evolution in the lineage leading from C to Old World monkeys. The most pertinent data currently available for this test are the amino acid sequences of eight polypeptide chains. The a and b values given below are the phyletically inferred number of nucleotide substitutions fixed, as determined by ancestral sequence methods (10, 5 1 , 56, 78, 140, 144). The a value, followed by the corresponding b value, appears in parentheses after the name of each of the following polypeptides: hemoglobin a-chain ( 1 , 3.2), hemoglobin J3-chain (3, 3.4) fibrinopeptides A and B (3, 4), carbonic anhydrase I (4.7, 5 .8), cytochrome c ( 1 , 0), myoglobin (5.5, 1 . 5), and lysozyme c (10, 4). The total value of a for the eight polypeptides (28.3) is greater than the total b value (20.9). This result gives no support to the idea of a molecular evolutionary slowdown specific to the lineage leading to humans and African apes.
When rate tests were applied to immunological comparisons of albumins, there was likewise no indication of a slowdown specific to the ape-human lineage (106, 1 22, 123, 141-143). A similar result was obtained in analogous studies of primate transferrins (106). The rate tests made with immunological data were criticized because they ignored the problem of multiple substitutions at the same amino acid site (1 14). As all of the immunological comparisons involved proteins whose percent sequence difference was well below 25, corrections for multiple substitutions are likely to be minor, as pointed out earlier in the section on multiple substitutions at the same site. In the case of unique DNA comparisons made with the annealing method,
a .----.... A
c b L...-___ .... B
---<
o
L...-________ ... E
Figure 4 Phylogenetic tree for three hypothetical living species, A, B, and E. C is the last common ancestor of A and B, and D is the common ancestor of A, B, and E. The amounts of molecular change that have occurred along the A and B lineages are indicated by a and h.
Ann
u. R
ev. B
ioch
em. 1
977.
46:5
73-6
39. D
ownl
oade
d fr
om w
ww
.ann
ualr
evie
ws.
org
by U
nive
rsid
ade
de S
ao P
aulo
(U
SP)
on 1
0/07
/13.
For
per
sona
l use
onl
y.

592 WILSON, CARLSON & WHITE
the extent of change in the ape-human lineage was inferred by Kohne et al (99) to be roughly the same as in the Old World monkey lineage.
Although the above tests give no evidence for an evolutionary slowdown specific to macromolecules of the ape-human group, the possibility that all primates have experienced retarded molecular evolution merits consideration. A suitable test involves designating all primates as A in Figure 4, other orders of placental mammals as B, and the common ancestor of placental mammals as C. The multiple outside-reference points used in this case were vertebrates other than placental mammals. According to this test, hemoglobin evolution has indeed been slower in the primate lineage than in other orders of placental mammals by a factor of about 1 .5 (56). By contrast, cytochrome c evolution has been several times faster in primates than in other orders (5 1). The rate of myoglobin evolution in the primate lineage has been about equal to that in other orders since the common ancestor of placental mammals lived (56). So far as this relative rate test is concerned, these are the proteins for which the most adequate data exist.
Our overall conclusion, based on analysis of published results of numerous relative rate tests, is that these tests provide no convincing evidence for a slowdown in molecular sequence evolution that is specific either to the ape-human group or to primates as a whole. Thus, it seems possible to reconcile the primate molecular evidence with both the hard fossil evidence
. and the hypothesis that sequence evolution has proceeded at standard rates in primates as a whole and in the human lineage in particular.
The Generation-Time Hyp othesis
HISTORICAL BACKGROUND It has been proposed that sequence evolution is primarily dependent on the number of generations since divergence from an ancestral gene and only secondarily dependent on time (98, 99, 1 45). Since the number of generations per unit time is roughly similar for most species of mammals, sequence evolution would appear to progress with an absolute time dependence. However, for species with unusually short generation times (many generations per unit time), protein and DNA evolution should be faster than in species with unusually long generations (few generations per unit time). Although the evidence supporting this hypothesis is weak, it has been widely accepted (20, 34, 103, 1 04, 1 1 5, 1 46).
The evidence that Kohne and others (98, 99) presented for the generation-time hypothesis came from hybridization studies with the nonrepetitive DNA of several short-generation-time rodents and several long-generationtime primates. Specifically, they measured the number of nucleotide differences between rat and mouse DNA, human and chimpanzee DNA, and human and gibbon DNA. Using paleontologically estimated divergence
Ann
u. R
ev. B
ioch
em. 1
977.
46:5
73-6
39. D
ownl
oade
d fr
om w
ww
.ann
ualr
evie
ws.
org
by U
nive
rsid
ade
de S
ao P
aulo
(U
SP)
on 1
0/07
/13.
For
per
sona
l use
onl
y.

BIOCHEMICAL EVOLUTION 593
times for the three species pairs, they then calculated the number of nucleotide substitutions per year. The calculated rates appeared to be correlated with generation time. That is, by dividing the rates by the number of generations per year for each species pair, these workers obtained what appeared to be a constant substitution rate when expressed as nucleotide substitutions per generation. However, as pointed out by Sarich & Wilson ( 142), this evidence depends on the particular divergence times the DNA workers used. These in turn depend on one possible interpretation of the fossil record. If this interpretation is incorrect, the generation-time effect could be an artifact. In particular, if the rat-mouse divergence was more ancient, and the man-chimpanzee and man-gibbon divergences were more recent, the generation-time effect would disappear.
It is particularly unfortunate that some workers have based the generation-time hypothesis on a rat-mouse divergence time of ten million years (98, 103, 147). In fact, the fossil record of murid rodents is so poorly known (62, 1 48, 149) that the divergence time between the rat and mouse lineages could easily be anywhere from 5 to 35 million years ago.
TEST OF THE HYPOTHESIS To avoid the uncertainty in the estimation of divergence times, the relative rate test can be used to evaluate the effect of generation length on the rate of sequence evolutiori. As discussed earlier, the essence of the rate test is simply to compare the number of sequence substitutions that have accumulated along two lineages of organisms since their divergence from a common ancestor. No knowledge of divergence times is required. More specifically, the number of sequence substitutions that have accumulated along the lineages of both the short- (a) and the long- (b) generation-time organisms since their divergence from a common ancestor are calculated. This is done by phylogenetic analysis of the protein or nucleic acid sequence data. If the generation-time hypothesis is correct, then the ratio of those numbers of substitutions per lineage (a 1 b) should reflect the generation-time differential between those two lineages.
To test the generation-time hypothesis, we can compare this observed effect (alb) with an expected generation-time effect for each short-generation-time-Iong-generation-time species pair. This expected effect can be calculated from the average generation time for each lineage since their divergence from a common ancestor. Let this time be S for the lineage leading to the species with short generation times and L for the lineage leading to the species with long generations. The ratio LIS is the actual generation-time differential, the expected generation-time effect.
We have obtained a and b values for a diverse set of 12 sequenced polypeptides from the short-generation-time mammals-rodent, rabbit, and tree shrew-and the long-generation-time mammals-humans, whale, and
Ann
u. R
ev. B
ioch
em. 1
977.
46:5
73-6
39. D
ownl
oade
d fr
om w
ww
.ann
ualr
evie
ws.
org
by U
nive
rsid
ade
de S
ao P
aulo
(U
SP)
on 1
0/07
/13.
For
per
sona
l use
onl
y.

594 WILSON, CARLSON & WHITE
elephant. These values were taken from phylogenetic trees calculated for the following proteins: ribonuclease ( 1 50), lysozyme ( 1 5 1), lactalbumin ( 10, 1 5 1), myoglobin ( 1 52, 1 53), a- and l3-hemoglobin chains ( 138), cytochrome c ( 1 54), fibrinopeptides ( 1 55), insulin (8), and carbonic anhydrases I and II ( 140). Figure 5 shows a plot of a vs b for these proteins for each short-generation-Iong-generation-time species pair. Each numbered circle on the graph represents the a and b values for a particular protein and species pair.
The L and S values for these long- and short-generation-time organisms were calculated as follows. Generation time, as defined by Kohne (98), is gestation time plus time to reach a fertile state. To estimate the average generation time along a lineage, one considers the fossil record and the fact that there is a correlation between body size and generation time ( 1 56). The common ancestors of these mammals were small insectivores ( 1 57). Based on body size, a conservative estimate of their generation time would be about one year. Assuming that generation time and body size changed at an approximately linear rate from the time when the common ancestor lived until the present, one can estimate the average generation time for any lineage by averaging the present-day generation time with this ancestral generation time. We used the following estimates of present-day generation times: 0.33 years for rodents, 0.4 years for tree shrews ( 1 1 5), 1 year for rabbits, 10 years for whales and elephants, and Kohne's (98) conservative estimate of 10 years for humans. When the average generation time per lineage is calculated, the LIS ratios vary from 8.3 to 5 .5 for these species pairs. This range for the expected generation-time effect is shown in Figure 5 by two lines having slopes of 8 .3 and 5 .5 . The expectation of the absolute time-dependent evolutionary clock (LIS = 1) is also shown in this figure.
Inspection of Figure 5 reveals that the a and b values fall around the line predicted by the absolute time-dependent model. None of the values falls exclusively within the range predicted by the generation-time hypothesis. Linear regression analysis of the a vs b values gives a line with a slope of 1 .0 (correlation coefficient = 0.78). Thus, once uncertain divergence times are removed from the analysis, no generation-time effect is seen in proteinsequence evolution.
The generation-time hypothesis has also been investigated with an immunological approach. No generation-time effect was evident when the serum albumins of humans and mice ( 1 58) or humans and tree shrews ( 142) were compared.
In the past, some workers ( 1 35) have singled out a specific protein with a large number of sequence changes on a short-generation lineage as evidence for a generation-time effect. However, as shown in Figure 5, when all of the data are considered, such a discrepancy is most likely due to
Ann
u. R
ev. B
ioch
em. 1
977.
46:5
73-6
39. D
ownl
oade
d fr
om w
ww
.ann
ualr
evie
ws.
org
by U
nive
rsid
ade
de S
ao P
aulo
(U
SP)
on 1
0/07
/13.
For
per
sona
l use
onl
y.

BIOCHEMICAL EVOLUTION 595
random variation in the evolutionary clock (see the section on stochastic variation). To demonstrate that some factor is influencing protein evolution on a particular lineage, several different molecules must be investigated. It must be demonstrated that the deviations from the clock are in one direction and significantly greater than that expected from stochastic variability.
Since most of the sequence work on orthologous proteins has been done in mammals, most of the data that bear on the generation-time hypothesis involve these organisms. There are, however, some essentially nonmammalian data that relate to the generation-time hypothesis. The sequences of 5S RNA from various vertebrates, eukaryotic microorganisms, and prokaryotes have been determined. When these sequences are used to construct a phylogenetic tree ( 10, 1 59), the eukaryotic branches show no obvious generation-time effect. That is, the lineages leading to vertebrates and yeast show comparable amounts of change. A similar result is evident from a comparison of the evolutionary rates of wheat and yeast cytochromes c (39) or of mammal and insect cytochromes c ( 1 60). However, because these are such ancient divergence events, there is the possibility that substitutions in the variable region of the molecule may have approached saturation (56).
Plants seem particularly suitable for further testing of the hypothesis that years are more important than generations for molecular-sequence evolution. Generations of trees can be longer, by a factor of at least ten, than those of herbaceous annuals ( 16 1). As the amino acid sequences of cytochromes c, plastocyanins, or ferredoxins of numerous herbaceous annuals are known ( 162), it is desirable to obtain comparable information for several species oflong-generation trees. The few tree species for which amino acid sequence information is available (e.g. Leucaena) are not ideal for testing this hypothesis because their generations do not seem especially long. In the absence of relevant sequence evidence, we must be content to cite semiquantitative immunological evidence that suggests that protein evolution has not been significantly retarded in trees of the family Pinaceae ( 1 63) even though these trees (including pines, firs, cedars, and spruces) have very long generations as a general rule.
CELL GENERA nONS The generation-length hypothesis raises a question about the source of mutations. One possibility is that most mutations arise continuously through processes such as error-prone DNA repair or heat mutagenesis (3 1 , 1 64). The germ cells of higher organisms spend relatively long amounts of time in nondividing states and may accumulate a majority of their mutations by processes that are independent of cell generations. Consequently, rates of mutation might be proportional to absolute time instead of number of cell divisions. Another possibility is that most mutations are caused by errors in DNA replication that arise at the time of cell
Ann
u. R
ev. B
ioch
em. 1
977.
46:5
73-6
39. D
ownl
oade
d fr
om w
ww
.ann
ualr
evie
ws.
org
by U
nive
rsid
ade
de S
ao P
aulo
(U
SP)
on 1
0/07
/13.
For
per
sona
l use
onl
y.

596 WILSON, CARLSON & WHITE
1 00 0
en c: 0 C � Q) c: 80 Q)
(..') -... 0 .c (/) .c .� 3: � 60 0 Q) c: :.:J c: c: 0 ... -If)
U 40 ... � If) c: 0 -:l -iii 20 .0 ;::,
(/) Q)
:g -0 Q) u :l
Z
Pred i c t ed Absol u te Ti me @
Effect
20 Nucleot ide Substitut ions Per C i stron
In Lineage With Long Genera t i ons ( b )
30
Ann
u. R
ev. B
ioch
em. 1
977.
46:5
73-6
39. D
ownl
oade
d fr
om w
ww
.ann
ualr
evie
ws.
org
by U
nive
rsid
ade
de S
ao P
aulo
(U
SP)
on 1
0/07
/13.
For
per
sona
l use
onl
y.

BIOCHEMICAL EVOLUTION 597
division . If this is true, we might expect the number of mutations to depend on the number of germ-cell divisions that occur in a given period of time.
Vogel & Rathenberg (27) attempted to calculate the number of replication cycles during germ-cell development in rodents and primates. Because it is quite difficult to measure the number of cell-division cycles per generation and to obtain an estimate of the average number for a particular lineage throughout its history, we do not find their analysis convincing. Using the cell-division data cited by Vogel & Rathenberg (27), our calculations suggest that the number of cell divisions in the mouse lineage may exceed that in the human lineage by a factor of only 2. Thus the expected generationtime effect on sequence evolution may be very small if it is stated in terms of cell generation. The data in Figure 5 are not sufficient to distinguish between this hypothesis, based on cell generations, and the one based on absolute time.
Figure 5 Test of the generation-time hypothesis. This test is based on comparison of protein sequence evolution in mammals whose generations are long with that in mammals whose generations are short. The numbers of nucleotide substitutions that have accumulated in structural genes of short- (a) and long- (b) generation-time organisms since their divergence from a common ancestor are inferred from the amino acid sequence comparisons and given by the ordinate and the abscissa, respectively. The number of substitutions predicted by the generation-time hypothesis and the absolute-time hypothesis are shown by the straight lines. The inferred numbers of nucleotide substitutions in the structural genes of short- and longgeneration-time organisms are shown by the circles. Each circle represents a comparison of two orthologous proteins, one from a short-generation-time organism and one from a long-generation-time organism. These numbers of nucleotide substitutions were taken from phylogenetic trees of sequenced proteins. The text contains references to the published trees that we used. Information from unpublished trees was provided by 1. 1. Beintema, W. Gaastra, 1. A. Lenstra, G. W. Welling, and W. M. Fitch for ribonuclease.
The proteins used in this plot are the following: carbonic anhydrase I: H-Rb (18); carbonic anhydrase II: H-Rb (23); cytochrome c: GW-Rb (1), GW-M (2), H-Rb (13), H-M (14); fibrinopeptides: H-Rb (11), HRt (12); a-hemoglobin chains: H-Rb (9), H-M (10); {3-hemoglobin: H-Rb (15), H-M (19), E-Rb (22), E-M (24); insulin: H-RM (3), H-Rb (4), SW-RM (5), SW-Rb (6), E-RM ( 7 ), E-Rb (8); lactalbumin: H-G (16); lysozyme: H-Rt (21); myoglobin: H-T (17), SpW-T (20); and ribonuclease: PW-Z (25). The numbers in parentheses refer to the numbered circles in the figure. Abbreviations for the species compared are the following: E, elephant; G, guinea pig; GW, gray whale; H, human; M, mouse; PW, pike whale; Rb, rabbit; RM, rat and mouse insulins 1 and 2; Rt, rat; Z, average for rat, muskrat, and South American hystricomorph rodents; SpW, sperm whale; SW, sei whale; and T, treeshrew.
Ann
u. R
ev. B
ioch
em. 1
977.
46:5
73-6
39. D
ownl
oade
d fr
om w
ww
.ann
ualr
evie
ws.
org
by U
nive
rsid
ade
de S
ao P
aulo
(U
SP)
on 1
0/07
/13.
For
per
sona
l use
onl
y.

598 WILSON, CARLSON & WHITE
A nomalous Rates of Protein Evolution
Our discussion of objections to the evolutionary clock has thus far considered molecular evolution in primates and the generation-time hypothesis. We now examine cases in which a protein lineage appears without explanation to show a large acceleration or deceleration relative to homologous proteins in other lineages. Our discussion first deals with cases where molecular and classical phylogenetic trees yield conflicting branching orders. The remaining sections examine rates of protein evolution calculated from paleontologically estimated divergence times in plants and birds.
MOLECULAR VS CLASSICAL PHYLOGENIES When sequence difference data are fitted on a phylogenetic tree whose branching order is assumed from non molecular evidence, one sometimes finds a lineage that shows anomalously large amounts of sequence change. When, however, the branching order is determined from the molecular data, the anomalous lineage falls outside the group of lineages with which it is classically associated and the apparent acceleration disappears. Before it can be decided whether one is dealing with an authentic case of an anomalously high rate of evolution, several possibilities must be considered.
Consider three species-A, B, and E. Assume that the classical phylogenetic relationship for these species is as shown in Figure 4, and that B is the anomalous lineage. In the molecular phylogeny the position of species B and E are interchanged. There are three possible explanations for this dilemma.
First, the classical phylogeny is correct for this protein and the sequence on the B lineage has undergone accelerated evolution. This evolution must have occurred so that all of the substitutions that the proteins from species A and B hold uniquely in common (i.e. substitutions along the DC lineage, Figure 4) were changed. Furthermore, some of the positions that all three sequences hold uniquely in common (when compared to homologous proteins from species outside this group of organisms) were also changed. Thus, the sequences from species A and E would be more similar to each other than either is to species B.
The second possibility is that the classical phylogenetic tree is correct for the species, but incorrect for this protein. That is, sequence B is paralogous to sequences A and E rather than orthologous. This situation could arise in the following manner. Consider a gene duplication arising in the common ancestral lineage of all three species. During the subsequent divergence of these three species, each organism could lose one of its two genes coding for this protein. This loss would occur so that species A and E retained orthologous genes, while species B retained a paralogous gene. The sequence differences for this protein in species A and E reflect the divergence
Ann
u. R
ev. B
ioch
em. 1
977.
46:5
73-6
39. D
ownl
oade
d fr
om w
ww
.ann
ualr
evie
ws.
org
by U
nive
rsid
ade
de S
ao P
aulo
(U
SP)
on 1
0/07
/13.
For
per
sona
l use
onl
y.

BIOCHEMICAL EVOLUTION 599
of these two species from each other. However, the B-A or B-E sequence differences reflect the ancient gene-duplication event.
The third possibility is that the classical phylogeny is incorrect and that the molecular phylogeny accurately reflects the true branching order of the three species.
To distinguish among these various possibilities, sequence comparisons for other macromolecules from these species can be undertaken. If the other proteins show the classical phylogenetic relationship, then either B is an example of a species-specific rate increase, or a paralogous comparison is being made. In contrast, if all of the molecular phylogenies agree, then the non molecular phylogeny may be incorrect. It is unlikely that these other macromolecules from species B would also be paralogous when compared to the macromolecules from species A and E. However, it is possible that all of these proteins could have experienced accelerated evolution. This would require all sequence positions containing residues common and unique to the A and B lineages (and some between the B, A, and E lineages) to have changed in all of these proteins. It is difficult to choose between a molecular phylogeny and a classical phylogeny that requires species-specific rate accelerations in several proteins. To aid in this choice, the morphological and paleontological evidence on which the classical phylogeny was based should be reevaluated. This evidence may be weak and easily reconcilable with a molecular phylogeny and the evolutionary clock. Alternatively, compelling nonmolecular data would persuade one to accept a classical phylogeny and species-specific rates of evolution in several proteins.
Recent studies of bird egg-white lysozymes exemplify these points. The lysozyme from the chachalaca (78), a chickenlike bird, could have been considered an example of a species-specific acceleration in protein evolution. The chicken and chachalaca are classified in the same order of birds, whereas the duck is placed in another order. However, chicken and duck lysozymc::5 are more similar in sequence to each other than either is to the chachalaca lysozyme. Of the three possible explanations for this dilemma, the most likely appears to be that the classical phylogenetic scheme is incorrect. Immunological studies on transferrin, serum albumin, and ovalbumin show the same relationship between duck, chicken, and chachalaca as was found with lysozyme (49a). The classical phylogeny of these birds was based on the morphological similarity between the chachalaca and chicken. If the chachalaca and chicken have been morphologically conservative, or if they represent examples of convergent morphological evolution, the morphological and molecular data can be easily reconciled.
Goose egg-white lysozyme was another apparent example of an anomalous rate of evolution. Although chicken and duck lysozymes c are similar in amino acid sequence and show extensive immunological cross-reactivity,
Ann
u. R
ev. B
ioch
em. 1
977.
46:5
73-6
39. D
ownl
oade
d fr
om w
ww
.ann
ualr
evie
ws.
org
by U
nive
rsid
ade
de S
ao P
aulo
(U
SP)
on 1
0/07
/13.
For
per
sona
l use
onl
y.

600 WILSON, CARLSON & WHITE
neither of these lysozymes cross-reacts with goose lysozyme. Yet the duck and goose are close relatives (belonging to the same bird family), whereas the chicken belongs to an entirely different order. Thus, goose lysozyme could have been considered to be the product of greatly accelerated sequence evolution in the goose lineage, until the question ofits homology was raised ( 1 65). Subsequent amino acid sequence data ( 1 66, 1 67) showed that goose lysozyme was the product of a completely different genetic locus, i.e. it was nonhomologous or analogous to lysozymes c. Furthermore, in contrast to the studies of lysozymes, immunological comparison of albumins and transferrins ( 1 68, 1 69) from these species support the close phylogenetic relationship between the duck and goose and the assignment of the chicken to a different order. Hence, what appeared to be a case of an anomalous rate increase in the goose lineage was actually an artifact caused by comparing nonhomologous proteins
The rattlesnake cytochrome c presents a problem that has not yet been resolved ( 170, 1 7 1 ). According to nonmolecular evidence, there is little doubt that the divergence of the snakes and birds was more recent than the divergence of mammals from the common ancestor of these organisms. Comparison of the cytochrome c sequences from the rattlesnake, mammals, and birds indicates that the mammal and bird sequences are more similar to each other than either is to the snake. Jukes & Holmquist ( 1 72) have cited this as an example of a "species-specific" acceleration in evolutionary rate in the snake lineage. Although the current phylogenetic view might be incorrect (54), our analysis indicates that the insulin sequences of rattlesnakes, birds, and mammals ( 10) are consistent with the non molecular evidence. It is possible that rattlesnake cytochrome c represents an example of a paralogous comparison. It is noteworthy that duplication of the cytochrome c gene has occurred in vertebrates ( 173). Further studies on other proteins from these three groups of organisms might help to resolve this problem.
Guinea pig insulin may be the best example of an anomalous rate of evolution. It is very different from the insulins of other mammals ( 1 74, 1 75), and seems to be evolving at a much faster rate. The possibility that hystricomorph insulins are the product of an early duplication in the gene coding for insulin would not account for all of the sequence evolution that is observed. Futhermore, phylogenetic tree analyses of insulins, ribonucleases, cytochromes c, and a-Iactalbumins are consistent with the classical taxonomic position of the guinea pig.
It is quite possible that future studies will uncover more unequivocal examples of deviations from constant rates of sequence evolution. This does not necessarily mean that the evolutionary-clock phenomenon is invalid. Moreover, such exceptions may provide useful information about the forces that act on a particular macromolecule or organism at the molecular level.
Ann
u. R
ev. B
ioch
em. 1
977.
46:5
73-6
39. D
ownl
oade
d fr
om w
ww
.ann
ualr
evie
ws.
org
by U
nive
rsid
ade
de S
ao P
aulo
(U
SP)
on 1
0/07
/13.
For
per
sona
l use
onl
y.
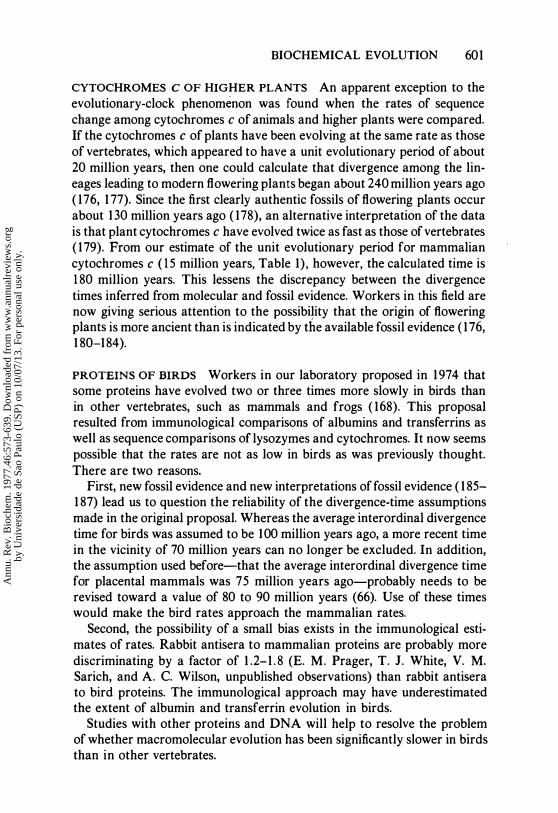
BIOCHEMICAL EVOLUTION 601
CYTOCHROMES C OF HIGHER PLANTS An apparent exception to the evolutionary-clock phenomenon was found when the rates of sequence change among cytochromes c of animals and higher plants were compared. If the cytochromes c of plants have been evolving at the same rate as those of vertebrates, which appeared to have a unit evolutionary period of about 20 million years, then one could calculate that divergence among the lineages leading to modern flowering plants began about 240 million years ago ( 176, 1 77). Since the first clearly authentic fossils of flowering plants occur about 1 30 million years ago ( 178), an alternative interpretation of the data is that plant cytochromes c have evolved twice as fast as those of vertebrates ( 1 79). From our estimate of the unit evolutionary period for mammalian cytochromes c ( 1 5 million years, Table 1) , however, the calculated time is 1 80 million years. This lessens the discrepancy between the divergence times inferred from molecular and fossil evidence. Workers in this field are now giving serious attention to the possibility that the origin of flowering plants is more ancient than is indicated by the available fossil evidence ( 1 76, 1 80-184).
PROTEINS OF BIRDS Workers in our laboratory proposed in 1 974 that some proteins have evolved two or three times more slowly in birds than in other vertebrates, such as mammals and frogs ( 168). This proposal resulted from immunological comparisons of albumins and transferrins as we1l as sequence comparisons of lysozymes and cytochromes. It now seems possible that the rates are not as low in birds as was previously thought. There are two reasons.
First, new fossil evidence and new interpretations offossil evidence ( 1 85-1 87) lead us to question the reliability of the divergence-time assumptions made in the original proposal. Whereas the average interordinal divergence time for birds was assumed to be 100 million years ago, a more recent time in the vicinity of 70 million years can no longer be excluded. In addition, the assumption used before-that the average interordinal divergence time for placental mammals was 75 million years ago-probably needs to be revised toward a value of 80 to 90 million years (66). Use of these times would make the bird rates approach the mammalian rates.
Second, the possibility of a sma1l bias exists in the immunological estimates of rates. Rabbit antisera to mammalian proteins are probably more discriminating by a factor of 1 .2-1 . 8 (E. M. Prager, T. J. White, V. M. Sarich, and A. C. Wilson, unpublished observations) than rabbit antisera to bird proteins. The immunological approach may have underestimated the extent of albumin and transferrin evolution in birds.
Studies with other proteins and DNA will help to resolve the problem of whether macromolecular evolution has been significantly slower in birds than in other vertebrates.
Ann
u. R
ev. B
ioch
em. 1
977.
46:5
73-6
39. D
ownl
oade
d fr
om w
ww
.ann
ualr
evie
ws.
org
by U
nive
rsid
ade
de S
ao P
aulo
(U
SP)
on 1
0/07
/13.
For
per
sona
l use
onl
y.

602 WILSON, CARLSON & WHITE
Rates of Sequence Evolution following a Gene Duplication
One of the mechanisms by which an organism may acquire a new function is through duplication of a structural gene ( 1 88). With two copies of the gene available to an organism, one copy may continue to provide the original function while the second accumulates mutations that may alter its function. In such cases, it is perhaps reasonable to expect accelerated sequence change in the gene acquiring the new function, and thus a departure from clocklike behavior. A few cases of gene duplication have been examined from this standpoint, most notably the globin duplications and the lactalbumin-lysozyme duplication. Although there may usually be accelerated sequence evolution following gene duplication, we find the evidence equivocal.
Lactalbumin is similar to lysozyme c in length of the polypeptide chain, arrangement of disulfide bridges, and three-dimensional structure; in addition, the two proteins are 40% similar in amino acid sequence ( 1 89, 1 90). Because of the extensive sequence homology, it was proposed that lactalbumin arose by duplication of the lysozyme structural gene. As lactalbumin, a milk protein that regulates lactose synthesis, has been detected so far only in mammals (19 1), it was further proposed that the duplication occurred when the mammary gland originated, i.e. when mammals arose (roughly 1 75-200 million years ago) (50, 192). Since lysozyme c sequences are known only for birds and mammals (78, 1 5 1), it is of interest to compare this time with the bird-mammal divergence time. Those reptiles which gave rise to the mammals probably separated from the reptiles from which birds arose somewhere between 260 and 320 million years ago (62, 1 93). So, there is a proposal that the gene duplication was recent compared with the bird-mammal split. Accordingly, mammalian lysozymes ought to show more sequence resemblance to lactalbumin than to bird lysozymes, if sequence evolution is purely clocklike. However, this expectation is not fulfilled. Instead, mammalian lysozymes are more similar to bird lysozymes than to lactalbumins in amino acid sequence ( 1 5 1 , 1 89).
There are two ways of explaining this result. Dickerson (50, 1 92) explained it by saying that the lactalbumin gene underwent accelerated evolution as it acquired the new biological function and lost the old. Support for the idea of a speedup in lactalbumin evolution appeared to come from calculations showing that the rate of sequence change among lactalbumins was two or three times that among lysozymes (8, 50). However, when more sequences became known, it was clear that the average rate of sequence change in mammalian lysozymes has been about equal to that in lactalbumin since the placental mammals arose [( 1 5 1), see Table 1] .
The alternative explanation is that the lactalbumin-lysozyme duplication took place long before the mammary gland evolved and before the bird-
Ann
u. R
ev. B
ioch
em. 1
977.
46:5
73-6
39. D
ownl
oade
d fr
om w
ww
.ann
ualr
evie
ws.
org
by U
nive
rsid
ade
de S
ao P
aulo
(U
SP)
on 1
0/07
/13.
For
per
sona
l use
onl
y.

BIOCHEMICAL EVOLUTION 603
mammal split. If the duplication was that ancient, it is easy to understand how there can be greater sequence resemblance between bird and mammal lysozymes than between either of these and lactalbumin. An ancient duplication also enables one to explain the fact that lactalbumins are as similar to bird lysozymes as to mammal lysozymes ( 1 5 1). It is notable that the ancient divergence explanation makes no appeal to rate acceleration and is thus consistent with the evolutionary clock.
In the absence of reliable information about the time of duplication, one cannot choose between the two alternative explanations. To obtain additional information about the duplication time, it would be worthwhile to make a careful systematic search for lactalbumin like proteins in vertebrates other than mammals. The problem may turn out to be analogous to that involving the protein hormone, prolactin, whose major function in mammals is to stimulate milk secretion. Suppose prolactin were known only from mammals. Although it would be tempting to attribute prolactin's extensive homology with growth hormone (8) to a gene duplication that took place when the mammary gland originated, the fact is that prolactin is distributed widely in nonmammals, including fishes, where it has an osmoregulatory function ( 194). As the result of careful studies on taxonomic distribution and function, it is now clear that the prolactin-growth hormone duplication predated the fish-tetrapod divergence. The lactalbumin-lysozyme divergence could likewise be ancient, in which case Dickerson's argument (50, 192) for rate acceleration concomitant with acquisition of a new function would lack support.
Some workers (5 1 , 1 37, 1 38, 1 95) proposed that early evolution of globin sequences in vertebrates proceeded at a faster rate than later evolution. Gene duplications separated the myoglobin from the hemoglobin lineages and the a- from the fl-hemoglobin lineages. The evidence for accelerated rates of sequence change during early globin evolution was inferred from paleontologically estimated divergence times that are speculative. In particular, the time between the various gene duplications and early branching events could be increased by two- to fivefold, which would markedly decrease the apparent rates of change along these lineages. Even if we accept these speculative times, it appears from their analysis that the fastest rates of change for positions involved in new heterotetrameric functions actually precede the hemoglobin a-f3 chain duplication. This obviously contradicts the prediction of a rate increase following a gene duplication.
Uncertainty in the branching order of some of the ancient molecular events may also affect the globin rate estimates. It is well-known that globins have undergone many gene duplications even within the period of mammalian evolution ( 10, 196, 1 97). Hence, when lineages that diverged very long ago are compared, there is a high risk that undetected gene duplications will have been fixed, and that estimates of rates are being made
Ann
u. R
ev. B
ioch
em. 1
977.
46:5
73-6
39. D
ownl
oade
d fr
om w
ww
.ann
ualr
evie
ws.
org
by U
nive
rsid
ade
de S
ao P
aulo
(U
SP)
on 1
0/07
/13.
For
per
sona
l use
onl
y.

604 WILSON, CARLSON & WHITE
from comparisons of paralogous genes. If the branching order of the lamprey globin-vertebrate myoglobin, hemoglobin-myoglobin, and hemoglobin, a- and l3-chain divergences is different from that inferred from the maximum parsimony method, the conclusions about evolutionary rates may be altered.
We have tried to summarize some of the problems associated with estimating rates of sequence evolution following ancient duplications. Although the cases we have discussed do not convince us that a rate acceleration normally occurs following a gene duplication, we are optimistic that this question can be resolved. The best prospects for a comprehensive analysis are those duplications which have occurred within the period of mammalian evolution, where we may be able to fix the times of duplication with more assurance.
Stochastic Variation
The evolutionary rate of orthologous proteins appears to be subject to small fluctuations. Earlier in this review we also dealt with possible large deviations. We suggest that the small fluctuations are consistent with a stochastic evolutionary clock, and probably represent its inherent error. An accurate measure of this variation would be extremely useful for two reasons: 1 . it would allow us to attach an error to divergence-time estimates based on the clock, and 2. it might tell us something about the underlying mechanisms of molecular evolution.
The small fluctuations in evolutionary rate are revealed by phylogenetic tree analysis for an orthologous series of proteins. For each protein in the series, one estimates the number of substitutions that have accumulated along the lineage leading to that protein from the common ancestor. If these values are compared, a range is obtained. For cytochrome c, the phylogenetic tree of Moore et al (5 1 ) shows a range of 1 8-34 nucleotide substitutions per lineage since the time when the common ancestor of the multicellular animals lived. These values represent a range in evolutionary rates, since each lineage has evolved for the same period of time. However, as no divergence times are explicitly used in this calculation, the variation in those rates is not due to uncertainties in paleontologically estimated divergence times.
Figure 6 shows a bar graph of these nucleotide substitutions per cytochrome c lineage versus the number of lineages showing a particular nucleotide substitution/lineage value (i.e. the frequency). The data clearly describe a unimodal distribution. A distribution such as this fits well with the idea of a stochastic evolutionary clock, where the probability of a substitution occurring per lineage per unit time across all orthologous protein lineages is roughly the same.
Ann
u. R
ev. B
ioch
em. 1
977.
46:5
73-6
39. D
ownl
oade
d fr
om w
ww
.ann
ualr
evie
ws.
org
by U
nive
rsid
ade
de S
ao P
aulo
(U
SP)
on 1
0/07
/13.
For
per
sona
l use
onl
y.

BIOCHEMICAL EVOLUTION 605
1 5�--------r---------r---------r--------.
If) <ll 01 1 0 o OJ c: :.::::i
Variability of the Evolutionary Clock
Nucleotide Substitutions Per Lineage
Figure 6 Evolutionary clock variation, minimum estimate for cytochromes c. On the abscissa are plotted the phyletically inferred nucleotide substitutions per lineage (for each sequenced animal cytochrome c) since its divergence from the common ancestral multicellular animal cytochrome c gene. The ordinate is the number of lineages that have values within a particular range of nucleotide substitutions per lineage (e.g. three lineages have values within 1 8-20 nucleotide substitutions per lineage). These nucleotide substitutions per lineage are the nonaugmented values taken from the phylogenetic tree constructed by Moore et al (S 1). The distribution shown probably represents a minimum estimate of the variation of the evolutionary clock.
Some workers ( 1 35, 198) have pointed to the range of values like that given above as invalidating the evolutionary clock. However, as implied by Figure 6, the clock is probabilistic, not metronomic (67). Holmquist and co-workers (56) compared pairs oflineages and found some examples where the number of substitutions per lineage differ by a factor of about two. This has also been taken as an invalidation of the evolutionary clock. Clearly, these values could just be numbers from different ends of a distribution.
Although Figure 6 is useful for illustrative purposes, it most likely does not represent the true fluctuation of the evolutionary clock. The data are biased due to the hierarchical nature of the phylogenetic tree from which the data were taken. That is, because the tree is branched, many of the cytochrome c lineages share a common ancestry after their divergence from the common ancestral animal cytochrome c gene. Thus the values for the
Ann
u. R
ev. B
ioch
em. 1
977.
46:5
73-6
39. D
ownl
oade
d fr
om w
ww
.ann
ualr
evie
ws.
org
by U
nive
rsid
ade
de S
ao P
aulo
(U
SP)
on 1
0/07
/13.
For
per
sona
l use
onl
y.

606 WILSON, CARLSON & WHITE
number of nucleotide substitutions per lineage are not independent of each other. This would have the effect of reducing the actual variation seen in Figure 6, although exactly how much it is reduced is unclear. However, a plot like Figure 6 might be taken as a minimum estimate of the variation of the clock.
One might think that an easy way to estimate the variation in evolutionary rates would be to normalize the data by dividing the sequence substitutions between two species by their paleontologically estimated divergence times. Thus, one would not be dependent on tracing many intersecting lineages back to a common ancestor. Ohta & Kimura ( 1 99) have done this and found that the mean number of substitutions per unit time was equal to 1 . 5-2.5 times the variance (standard deviation squared). Unfortunately, these estimates are subject to the criticism that uncertainties in the paleontologically estimated divergence times might be responsible for this variation.
For a good estimate of the variation, the ideal procedure would be to examine a protein phylogeny where many lineages diverged simultaneously from a common ancestral sequence. These species should not share a common ancestry after this initial radiation. This would be a direct approach to calculating the variation. The number of substitutions per lineage on this phylogeny would not be subject to the biases discussed above. They would allow us to examine the frequency distribution of the variation in evolutionary rates for orthologous proteins. Unfortunately, no adequate case of such a species radiation has been analyzed by molecular methods. There have been, however, attempts to estimate this variation by an indirect approach (54, 67, 139) and by an approximate direct approach (8 1). Neither of these approaches utilized paleontologic ally estimated divergence times.
Fitch & Langley (67) obtained an estimate of this variation indirectly from their study on molecular evolutionary rates. They tested the hypothesis that the variation in evolutionary rates among orthologous proteins fits a Poisson distribution. A composite phylogenetic tree was constructed for sequences of cytochromes c, hemoglobins, fibrinopeptides, myoglobins, and insulin C peptide from mammals. The branching order was assumed from non molecular evidence, and the number of nucleotide substitutions per lineage was calculated by an ancestral-sequence parsimony procedure that utilized the genetic code. Using a maximum likelihood method, Fitch & Langley tested the fit of the observed number of nucleotide substitutions per lineage with those expected from a Poisson process. Their conclusion was that the variation observed was about twice that expected for a Poisson process. Thus, the standard deviation was equal to about (2M)1!2, where M equals the mean number of nucleotide substitutions per lineage since divergence from a common ancestor (54). In terms of Figure 6 where the
Ann
u. R
ev. B
ioch
em. 1
977.
46:5
73-6
39. D
ownl
oade
d fr
om w
ww
.ann
ualr
evie
ws.
org
by U
nive
rsid
ade
de S
ao P
aulo
(U
SP)
on 1
0/07
/13.
For
per
sona
l use
onl
y.

BIOCHEMICAL EVOLUTION 607
sample mean is 26, the standard deviation according to Fitch (54) would be about (2 X 26)112 = 7.2, whereas the standard deviation of the plotted values is only 3 .8 .
An approximate direct approach to estimating the variation of protein evolution is simply to compare protein lineages that share only a small portion of their total length in common since divergence from a common ancestor. This type of approach was used by N ei (8 1) to calculate the variance of the immunological distance as measured by microcomplement fixation with serum albumin. The variance he obtained was two times larger than the mean when the mean was small (about ten immunological distance units), and the ratio of the variance to the mean increased with increasing mean. This variance includes not only the stochastic error of the clock, but also the error of using the microcomplement fixation procedure to measure sequence differences.
Besides the magnitude of the fluctuation in the evolutionary clock, there is another question related to its "source" in an empirical sense. That is, if an organism's cytochrome c evolves fast, will its hemoglobin also be evolving fast? Or will its hemoglobin be just as likely to be evolving slowly? To put the question another way, are small "lineage specific" rates responsible for these fluctuations in the evolutionary clock? One way in which the answer to these questions could be approached is by the following analysis. Assume we have two unrelated proteins (A and B) for which phylogenetic trees have been drawn from sequence data. Assume further that the two proteins have been sequenced from the same species (AJ , A2, A3, etc; B J , B2, B3, etc). Let al3 be the phyletic distance from the common ancestral gene of AI and A3 to sequence AJ , and let a3 1 be the phyletic distance from this same common ancestor to A3. The distance from the common ancestor of AI and A2 to A2 would be a2 1 and so on. Let this same nomenclature hold for Bt . B2, B3, etc as well. Now if "lineage specific" rates are responsib!e for the fluctuations of the evolutionary clock, then a 12/a2 1 � b12lb2 1 , a 1 3/a3 1 � b13lb3 1 , a23/a32 � b23/b32, etc. This means that if a particular lineage has undergone accelerated evolution in the A protein, it is likely also to have undergone accelerated evolution in B. Thus, if a 1 2 > a2 1 , then it is likely that b l 2 > b2 1 . That is, if there are "lineage specific" rates, there should be a positive correlation between the phyletic distance ratios for the A protein and those for the B protein. If, however, the fluctuations in distance are random with respect to different proteins on the same lineage, then the phyletic distance ratios for the A protein should show no correlation with those for the B protein.
Immunological data available on serum albumin and transferrin from seven species of birds ( 165) and sequence data on p�hemoglobin chains and myoglobin from seven species of mammals (56) can be analyzed in this way.
Ann
u. R
ev. B
ioch
em. 1
977.
46:5
73-6
39. D
ownl
oade
d fr
om w
ww
.ann
ualr
evie
ws.
org
by U
nive
rsid
ade
de S
ao P
aulo
(U
SP)
on 1
0/07
/13.
For
per
sona
l use
onl
y.

608 WILSON, CARLSON & WHITE
Transferrin and albumin give a range of ratios from 2.00 to 0.25 and a correlation coefficient of -0.39. The .a-hemoglobin-myoglobin data give a range of 2.6 to 0.29 with a correlation coefficient of -0. 1 8. Since there is no positive correlation, this analysis suggests that there are no obvious "lineage specific" rates and the fluctuation in evolutionary rate of proteins between and among lineages is random.
Whereas the expected standard deviation for radioactive decay equals (counts) I12, the standard deviation for the evolutionary clock appears to be approximately (2 X number ofsubstitutions)1/2. The fluctuation in the clock does not appear to be due to biases in particular lineages toward slow or fast rates. The rates of evolution of functionally unrelated proteins on the same lineage appear to be independent, at least to a first approximation. (Similarly, the rates of decay of two different dilute radioisotopes in the same sample are independent.) Following Nei (8 1 ), if the evolutionary clock is used for divergence time estimates, then t = cy where y is the number of substitutions per lineage (or between species), c is the evolutionary rate constant I (substitutions per million years), and t is the estimated time. The variance of these quantities is given by Nei (8 1) : V(t) = c2 V(y). Since V(y) � (2 X number of substitutions) 112
, we should be able to reduce the percentage error of t by increasing the number of unrelated macromolecules compared from the species of interest.
In the future more work is needed in continuing to define empirically the error of the clock for different proteins and for different methods of comparing protein sequences. An unbiased empirically derived frequency distribution of evolutionary rates similar to Figure 6 would be useful in testing probabilistic models for molecular evolution. A good estimate of the standard deviation of the molecular clock would be useful in indicating those lineages where a dramatic change in the evolution of a particular protein may have taken place (see earlier section on anomalous rates of protein evolution).
BASIS FOR THE CLOCK
Different Rates for Different Functional Classes of Proteins
Although sequence evolution generally goes on at an approximately constant rate for proteins within a given functional class, that rate is not necessarily the same for proteins having different functions. Table 1 summarizes the average rates of evolutionary change in amino acid sequence for
IThis rate constant contains an error that is not inherent in the evolutionary clock, but is the result of the error in paleontologically estimated divergence times. This error is difficult to evaluate.
Ann
u. R
ev. B
ioch
em. 1
977.
46:5
73-6
39. D
ownl
oade
d fr
om w
ww
.ann
ualr
evie
ws.
org
by U
nive
rsid
ade
de S
ao P
aulo
(U
SP)
on 1
0/07
/13.
For
per
sona
l use
onl
y.

BIOCHEMICAL EVOLUTION 609
50 different classes of polypeptide chain. For the most slowly evolving proteins listed, histones 3 and 4, it takes several hundred million years for a difference of one percent (i.e. one substitution per 100 amino acid residues) to accumulate between two lineages. At the other extreme are the immunoglobulins, fibrinopeptides, and venom toxins, which evolve much more rapidly. A 1 % sequence difference arises every million years in such proteins. The average rates of protein evolution thus vary over a range of more than lOO-fold.
How can one explain this wide range of evolutionary rates? It is usual to assume, in the absence of evidence to the contrary, that the probability of mutation is essentially the same for every amino acid site in every protein. The differences in evolutionary rate are thought to be due to differences in the probability of fixation of mutations. One is thus introduced to the idea of functional constraints.
FUNCTIONAL CONSTRAINTS According to this hypothesis the probability of fixation is directly proportional to the probability that an amino acid substitution would be compatible with maintenance of the function of the protein. This idea is quite old (26, 200) and has been developed further by Ohno (201 ), Dickerson (50), and Zuckerkandl (202, 203).
Although every amino acid site in a protein may be presumed to have a function, the sites differ from one another with respect to the number of residues that can fulfill the function of that site. At certain positions in the active site of an enzyme or hormone, replacement of an active residue by any other residue would not be tolerated. A mutation causing such a replacement would inactivate the protein and thus be disadvantageous. Natural selection would prevent it from becoming fixed in a population of organisms. By contrast, there are other sites in a protein at which the function can be fulfilled by either of two or more residues.
Studies with proinsulin provide one of the best illustrations of the use of the functional-constraint hypothesis to explain different rates of evolution at different sites within a protein. The C peptide forms a bridge between the A and B peptide regions of proinsulin and ensures that A and B pair properly during folding of the nascent protein. Once the correct pairing has taken place, the C peptide is removed enzymatically. Although the C peptide has no role in insulin function, it has a crucial role in the production of a functional insulin molecule (204). This role can be fulfilled in bovine insulin by a variety of synthetic bridge compounds (205). Thus experimental evidence implies that great variation in the amino acid sequence of the C peptide could be tolerated without interfering greatly with its role in insulin folding. Consistent with this great tolerance for sequence variation in the laboratory, the C peptide is found, as illustrated in Table 1 , to have
Ann
u. R
ev. B
ioch
em. 1
977.
46:5
73-6
39. D
ownl
oade
d fr
om w
ww
.ann
ualr
evie
ws.
org
by U
nive
rsid
ade
de S
ao P
aulo
(U
SP)
on 1
0/07
/13.
For
per
sona
l use
onl
y.

6 10 WILSON, CARLSON & WHITE
Table 1 Rates of protein evolutiona
Unit evolutionary
Protein period Protein
Histones Hormones (cant.) H4 400 Prolactin H 3 330 Growth hormone H2A 60 Lutropin (11) H2B 60 Insulin C peptideb H I 8 Oxygen-binding proteins
f'ibrous proteins Myoglobin Collagen (a-I) 36 Hemoglobin (a) Crystallin (aA) 2 2 Hemoglobin (11)
In tracellular enzymes Secreted enzymes Glutamate dehydrogenase 5 5 Trypsinogen Triosephosphate Lysozyme
dehydrogenase 20 Ribonuclease Triosephosphate isomerase 1 9 Immunoglobulins Lactate dehydrogenase H4 1 9 'Y-chains (C) Lactate dehydrogenase M4 1 3 �-chains (C) Carbonic anhydrase B 4 ,,-chains (V) Carbonic anhydrase C 2 . 1 ,,-chains (C)
Electron carriers A-chains (V) Cytochrome c 1 5 'Y-chains (V) Cytochrome b s 1 1 Snake venom toxinse Plastocyanin 7 Long neurotoxins Ferredoxin 6 Cytotoxins
Hormones Short neurotoxins Glucagon 43 Other proteins Corticotropin 24 Parvalbumin Insulinb 1 4 Albumin Thyrotropin (m 9 Lactalbumin Lipotropin ({J) 8 Fibrinopeptide A Lutropin (a) 7 Casein (,,) Proparathyrin 7 Fibrinopeptide B
Unit evolu tionary
period
5 4 3 1 .9
6 3 . 7 3 . 3
6 2.5 2.3
1 .7 1 .7 1 .0 0.9 0.8 0.7
0.9 0.9 0.8
5 3 2 .3 1 .7 1 .4 1 . 1
a Unit evolutionary period i s the average time, i n million of years, required for a 1 % difference in amino acid sequence to arise between two lineages. I t is thus a n inverse measure of rate of protein evolution. Most of the sequence data on which this table is based appear in Dayhoff (8-10). Additional data were obtained for histones (35 8), crystallin (35 9 , 360), dehydrogenases (306), carbonic anhydrases ( 140), plastocyanin (79), lysozyme ( 1 5 1 ) , and casein (361) . The times of divergence assumed are generally similar to those used by Dayhoff ( 1 0) and Fitch & Langley (67). Because paleontological estimates are more unreliable for more remote divergences, our rate estimates are based predominantly on relatively recent divergence times, i.e. within the last 1 00 million
Ann
u. R
ev. B
ioch
em. 1
977.
46:5
73-6
39. D
ownl
oade
d fr
om w
ww
.ann
ualr
evie
ws.
org
by U
nive
rsid
ade
de S
ao P
aulo
(U
SP)
on 1
0/07
/13.
For
per
sona
l use
onl
y.

BIOCHEMICAL EVOLUTION 6 1 1
evolved very rapidly. In fact, the rate is an order of magnitude greater than that observed for insulin, the part of the molecule that carries out the hormonal function. Other studies with hemoglobin, cytochrome c, and various enzymes of known three-dimensional structure also show that the functional-constraint idea is useful for explaining why evolution can occur faster at some sites than at others within the same protein (20, 160).
By analogy, the functional-constraint idea has also been used to explain why different classes of proteins evolve at different rates. The proteins that evolve most slowly are supposed to have the highest proportion of sites at which the functional constraints are particularly severe. According to this view, nearly every mutation that could occur in the gene for histone 4 would be deleterious to the function of that histone, unless the mutation were a silent, third-position change. Conversely, the most rapidly evolving proteins are supposed to have the largest proportion of sites at which more than one residue would be compatible with function. Fibrinopeptides are often cited as examples of the latter type ( 16). Although this sort of explanation is plausible, we are not aware of direct experimental evidence showing rigorously that histone function is especially sensitive to amino acid substitution or that fibrinopeptide function is especially insensitive to amino acid substitution. Experimental studies would require that quantitative in vitro assays for the specific functions of histone 4 and fibrinopeptides be available. These have not been developed for histones, fibrinopeptides, or, indeed, most of the proteins whose evolutionary rates are listed in Table 1 . Precise in vitro assays are generally available only for the enzymes and globins. With these it may be possible to test whether the specific functions of rapidly evolving proteins like lysozyme, ribonuclease, carbonic anhydrase, and hemoglobin are less sensitive, by a factor of 5, to substitutions than are conservative proteins like the glycolytic enzymes.
Perhaps the best opportunity for testing the functional-constraint hypothesis for explaining rate differences among functional classes of proteins
years. Most of our rate estimates come from comparison of mammalian proteins, since
the mammalian fossil record is especially well-known. For a similar reason, our rate estimates for plant proteins arc based on flowering plants, whose average interordinal divergence time is assumed to be 1 5 0 million years. To correct for repeated substitu
tions at the same amino acid site, Dayhoff's Table 29 ( 1 0) was used. In the case of
cytochrome c, globins, fibrinopeptides, insulin C peptide, and carbonic anhydrases,
however, we used the number of phylogenetically inferred substitutions reported by
Fitch & Langley (67) and Tashian et al ( 1 40). bThe insulin sequence of the guinea pig and its close relatives (hystricomorphs) were
not included.
c Calculated by comparing possibly orthologous sequences of different species within the cobra genus Naja and assuming that this group arose 18 million years ago (62).
Ann
u. R
ev. B
ioch
em. 1
977.
46:5
73-6
39. D
ownl
oade
d fr
om w
ww
.ann
ualr
evie
ws.
org
by U
nive
rsid
ade
de S
ao P
aulo
(U
SP)
on 1
0/07
/13.
For
per
sona
l use
onl
y.

6 1 2 WILSON, CARLSON & WHITE
will corne from bacterial proteins. With bacteria, one can determine, by a combination of mutational and evolutionary studies, whether proteins whose specific function is very sensitive to missense mutations, e.g. lac repressor (206), have evolved more slowly than those proteins which are rather insensitive \0 such mutations, e.g. ,a-galactosidase (207), the a-subunit of tryptophan synthase (208), or the aminotransferase in the histidine biosynthetic pathway (29).
DISPENSABILITY It is not clear whether the functional-constraint factor can by itself account completely for the diverse rates observed among different classes of proteins. Another factor may need to be considered. We propose that the rate of protein evolution (R) depends on both the functional-constraint factor and a dispensability factor. If we define P as the probability that a base substitution will be compatible with the function of a protein and Q as the probability that an organism can survive and reproduce without the protein, then we have R j = !(P;)!(Q;), where !(Q;) ;z! O. With this relationship in mind we can explain how two hypothetical proteins, A and B, could evolve at very different rates in spite of having identical P values. Suppose that a functional A protein is less dispensable for survival and reproduction of the organism than is B (i.e. QA < QB)' Survival is possible without B because the organism has backup systems for the B function, in the form of other proteins that can fulfill the missing function. Hence the amino acid sequence of B would be prone to drift, i.e. to fixation of mildly deleterious mutations. Substitutions could accumulate more freely in B than in A; thus, according to the equation above, the indispensable protein (A) should evolve slowly compared with the more dispensable protein (B), although A and B are identical in regard to the functional-constraint factor.
Most of the slowly evolving proteins listed on the left side of Table 1 , with values for the unit evolutionary period (UEP) greater than 10, probably fall into the indispensable category. Without cytochrome c, for instance, a vertebrate could not obtain energy and would die. By contrast, many of the rapidly evolving proteins, with UEP values of three or less, may be fairly dispensable.
Serum albumin may be an example of a dispensable protein. This is shown by the existence of analbuminemic humans, who are homozygous for a defect in albumin synthesis. Although they have less than 1 % of the normal concentration of serum albumin, their health is nearly normal and they are fertile (209). Albumin has many important functions in humans and other vertebrates (2 10). Besides contributing greatly to the colloid osmotic pressure of blood, and thereby to the exchange of nutrients and waste products across the capillary wall, albumin functions specifically in
Ann
u. R
ev. B
ioch
em. 1
977.
46:5
73-6
39. D
ownl
oade
d fr
om w
ww
.ann
ualr
evie
ws.
org
by U
nive
rsid
ade
de S
ao P
aulo
(U
SP)
on 1
0/07
/13.
For
per
sona
l use
onl
y.

BIOCHEMICAL EVOLUTION 613
the transport of fatty acids, bilirubin, and other small molecules from one cell type to another and in addition has a direct nutritive function. Albumin could easily have a low P value comparable to that of cytochrome c. Nevertheless, there are other proteins in serum that can carry out the albumin functions, although perhaps not as well as albumin does, and for this reason, albumin may have a high Q value. The net result is that it evolves quite rapidly (UEP '" 3).
The case of albumin is not unique. Several other serum proteins are known to be moderately dispensable (2 1 1); that is, humans lacking one of these proteins can often survive and reproduce, although their health is not completely normal. As a general rule, other serum proteins evolve about as rapidly as albumin or even more rapidly, according to immunological and electrophoretic evidence (94, 2 1 2).
Lysozyme is another dispensable protein that evolves rapidly (UEP � 2.5). Although lysozyme appears to function in defense against bacterial invaders (213), a vertebrate has many other ways of coping with invading bacteria. For example, mutant rabbits with a lysozyme deficiency are healthy (2 14).
Immunoglobulins evolve extremely fast (UEP � 1) and may be dispensable. The immune response to a given antigen involves the synthesis of many immunoglobulins, which are the products of numerous structural genes. If one of those structural genes were missing or inactive, the organism would still produce antibodies to the antigen. Although immunoglobulins, as a class, fulfill an important function in the vertebrate organism, it is reasonable to suppose that any particular immunoglobulin structural gene is dispensable.
Although we have not conducted an exhaustive search of the scattered literature on null alleles (2 15) and on other evidence concerning the ability of organisms to function in the absence of particular gene products, it seems likely that numerous examples of moderately or highly dispensable proteins will be found among all of the rapidly evolving functional classes of proteins, i.e. not only secreted enzymes, immunoglobulins, and serum proteins but also snake venom toxins, milk proteins, egg-white proteins, and, perhaps, some hormones.
One problem for the future will be to devise tests for assessing the relative importance of functional constraints and dispensability as factors in protein evolution.
Neutralists versus Positive Selectionists Having discussed factors that affect the freedom of sites or proteins to evolve, we feel that it is worthwhile to consider the driving force for se-
Ann
u. R
ev. B
ioch
em. 1
977.
46:5
73-6
39. D
ownl
oade
d fr
om w
ww
.ann
ualr
evie
ws.
org
by U
nive
rsid
ade
de S
ao P
aulo
(U
SP)
on 1
0/07
/13.
For
per
sona
l use
onl
y.

614 WILSON, CARLSON & WHITE
quence change. Two competing theories have been offered. According to the neutral theory, most of the substitutions that accumulate in the course of evolution are neutral from the standpoint of natural selection; that is, the mutant residue is equivalent to the residue that it replaced, so far as function is concerned (2 16-2 1 8). Alternatively, according to the positive-selection theory, most of the substitutions are fixed because they are advantageous (2 19-22 1). The last decade has witnessed a controversy between advocates of the two theories. Although the controversy remains unsettled ( 1 5, 1 8, 24, 222-226), we emphasize that both theories assume that many substitutions are eliminated by natural selection because they are deleterious to function and, furthermore, that advantageous mutations have a role in protein evolution.
The neutral theory makes use of the mathematical expectation that the chance that a newly arisen neutral mutation will undergo random fixation is lI2lY, where N is the number of breeding individuals in a population of diploid organisms (2 16-2 1 8). It also considers the chance that a neutral mutation will arise in the population. If u is the neutral mutation rate per gamete (per locus per unit time) in a population whose size remains constant through time, then 2Nu is the mutation rate per population (per locus per unit time). It follows that the rate of fixation of neutral mutations is 2 Nu X lI2N Thus, the fixation rate per population (k) equals the mutation rate per gamete (u), i.e. k = u. This means that the rate of neutral evolution is independent of population size (N) and depends only on the mutation rate to neutral alleles.
With such a theory, one can explain the evolutionary clock. To the extent that u is constant for a protein from species to species, the rate of neutral evolution will be constant. One can also explain why different functional classes of proteins can have different rates of neutral evolution. The value of u is determined by P and Q (see the section on dispensability). If a protein has low P and Q values, few mutations could be neutral and it would have a low u value.
In contrast, the positive-selectionist theory assumes that the rate of fixation of favorable mutants equals 4Nsuf' where S is a measure of selective advantage and uf is the mutation rate to favorable mutants ( 1 5, 227). To explain the clock, this model requires the product of lY, s, and uf to be constant over time and in different species from very different environments and with different population sizes. Van Valen (228) has proposed an ecological hypothesis explaining how selection pressure might remain approximately constant for all species over time.
The neutral theory was proposed in part to explain the constant rates of sequence change of proteins derived from very different organisms. Moreover, it was difficult to see how the selective forces acting on species from
Ann
u. R
ev. B
ioch
em. 1
977.
46:5
73-6
39. D
ownl
oade
d fr
om w
ww
.ann
ualr
evie
ws.
org
by U
nive
rsid
ade
de S
ao P
aulo
(U
SP)
on 1
0/07
/13.
For
per
sona
l use
onl
y.

BIOCHEMICAL EVOLUTION 6 15
very different environments and wit� different population sizes could possibly yield similar rates of sequence change. Consequently, the evolutionary clock became associated with the neutral theory. A simple model likened the clock to a Poisson process where the rate of mutation to neutral alleles (or probability of occurrence of a neutral allele per unit time) was constant in different lineages and through time for orthologous proteins. As discussed previously (see the section on stochastic variation), Langley & Fitch ( 1 39) showed that the variation of the clock was greater than that expected from a simple Poisson process like radioactive decay. This has been interpreted as indicating that a significant number of the mutations seen in orthologous proteins are not neutral ( 198). Instead, these mutations may be advantageous ( 1 39) or slightly deleterious ( 16, 229, 230). However, the use of the Poisson distribution as the probabalistic model for the neutral-mutation hypothesis may have been an oversimplification. It seems reasonable to propose, for example, that the rate of occurrence of neutral mutations might itself be subject to fluctuations. This could be the result of random changes in the number of sites that can fix a neutral mutation with time in a particular protein (23 1). Thus, although the variation of the evolutionary clock is greater than that of a Poisson process, this does not invalidate the neutral hypothesis, as Penny (6 1) pointed out.
The discovery that proteins differing greatly in amino acid sequence can be very similar in function was interpreted as evidence for the neutral theory (2 1 8, 232). Perutz & Lehmann (233) listed 48 electrophoretically detectable mutant human hemoglobins that were not associated with clinical symptoms. Studies of cytochromes c from different species indicated that they reacted equally well with bovine cytochrome oxidase (234, 235). However, other workers (236, 237) were able to detect functional differences in the reactivities of closely related cytochromes c with cytochrome oxidase. Some hemoglobins (238) and cytochromes c ( 198) that differ in sequence now appear to differ, albeit slightly, in function. However, functional nonequivalence among proteins differing in amino acid sequence does not necessarily imply that the changes are advantageous. It is possible that cytochrome c and cytochrome oxidase might have accumulated complementary neutral substitutions in each of two species A and B after their divergence from a common ancestor. This could have occurred in such a way that the functional reactivity of each cytocnrome c with its own oxidase was physiologically equivalent to the ancestral state. Yet the reactivity of cytochrome c from species A with cytochrome oxidase from species B might be functionally nonequivalent compared with reactivity with its own (species A) cytochrome oxidase.
Another aspect of the selectionist-neutralist controversy concerns enzyme polymorphisms, i.e. protein diversity among individual members of
Ann
u. R
ev. B
ioch
em. 1
977.
46:5
73-6
39. D
ownl
oade
d fr
om w
ww
.ann
ualr
evie
ws.
org
by U
nive
rsid
ade
de S
ao P
aulo
(U
SP)
on 1
0/07
/13.
For
per
sona
l use
onl
y.

6 16 WILSON, CARLSON & WHITE
a species (224, 230, 232, 239-246). Attempts to resolve these conflicting theories by determining the frequencies of different alleles in natural populations have been inconclusive.
Zuckerkandl (247) recently proposed an essentially selectionist theory that includes elements of the neutral theory. According to him, a protein fluctuates around a suboptimal state, with regard to general properties such as solubility and charge. He assumes that because one cannot optimize all of the properties simultaneously, there is a continual competition for optimization of each property. The result is an endless series of fixations, even in a constant environment. These fixations are viewed as evolutionary noise, albeit with a selective component. This kind of evolution may be responsible for the evolutionary clock.
It is proving difficult to distinguish between the predictions of the selectionist and neutralist theories. Some workers regard the resolution of this problem as the major one confronting molecular evolutionists. We disagree. Although it will certainly be of interest to find the source of the main driving force for sequence evolution in proteins, we must face the fact that sequence evolution and phenotypic evolution can proceed at independent rates (see the section "Organismal Rates versus Molecular Rates", which follows). The task of finding the molecular basis of adaptive evolution at the organismal level will remain. The opportunity to test and use proteins to probe phylogenetic relationships of species and populations will still be there. The empirical use of proteins as devices for dating divergence events and thus for estimating rates of evolution at other biological levels (ranging from the chromosomal to the morphological level) will continue.
ORGANISMAL RATES VERSUS
MOLECULAR RATES
We have already alluded to the observation that amino acid and nucleotide sequences evolve at fairly steady rates that seem virtually independent of rates of organismal evolution (248). Molecular evolutionists were slow to recognize this surprising and intriguing fact. They had assumed that organismal evolution depends on sequence evolution in proteins and expected a simple relationship between the two types of evolution. In particular it was expected that morphologically conservative organisms should have experienced slower macromolecular evolution than organisms that had evolved unusually rapidly at the morphological level. To date, however, there is no convincing evidence that the proteins or nucleic acids of conservative creatures are conservative in regard to their amino acid or nucleotide sequences.
Other factors contributed to the misunderstanding. Molecular evolution-
Ann
u. R
ev. B
ioch
em. 1
977.
46:5
73-6
39. D
ownl
oade
d fr
om w
ww
.ann
ualr
evie
ws.
org
by U
nive
rsid
ade
de S
ao P
aulo
(U
SP)
on 1
0/07
/13.
For
per
sona
l use
onl
y.

BIOCHEMICAL EVOLUTION 6 17
ists were justifiably impressed by the observation that the phylogenetic trees constructed from macromolecular sequences usually resemble those based on morphological evidence, with regard to branching order (40, 87, 249). This congruence in branching order is explained simply by supposing that when a species splits into two non-interbreeding species, divergence between the two species can then begin to take place at both the morphological and the sequence level. Congruence in branching order does not require, however, that the rate of morphological change following speciation be geared to the rate of sequence change.
Another line of evidence reinforced the impression that macromolecular sequence evolution was related in a simple way to organismal evolution. A correlation was observed between the degree of sequence difference, estimated by electrophoretic comparison of many proteins, and the taxonomic distance between organisms (90-92). This correlation probably results from the tendency of both organismal and sequence evolution to proceed generally at fairly steady · rates. If sequence change and organismal change are each correlated with time, they will seem correlated with each other. The correlation does not necessarily imply a cause-and-effect relationship. To probe more deeply the relationship between organismal and sequence evolution, one must choose for study two or more groups of organisms whose rates of organismal change contrast greatly.
Frogs'versus Mammals
The vertebrates are well-suited for such a study. Some vertebrate lineages have experienced faster rates of phenotypic evolution than others. Placental mammals, for instance, have experienced rapid organismal evolution compared with lower vertebrates, of which frogs are a typical example. Although there are thousands of frog species living today, they are so uniform phenotypically that zoologists put them all in a single order (Anura), whereas placental mammals are divided into at least 1 6 orders. The anatomical diversity represented by bats, whales, cats, and people is unparalleled among frogs, but frogs are a much older group than placental mammals. The present-day frogs are not easily distinguishable morphologically from those living 90 million years ago. In contrast, during this same period, mammals have become extremely different in morphology from their progenitors. By way of illustration, the frog genus Xenopus was already in existence 90 million years ago, when the common ancestor of all placental mammals lived (250). Clearly, organismal evolution has been slow in frogs relative to mammals; yet at the molecular sequence level, evolution has been just as rapid. This is apparent from immunological comparison of albumins, electrophoretic comparison of many enzymes, sequencing of hemoglobins, and annealing studies with DNA (248).
Ann
u. R
ev. B
ioch
em. 1
977.
46:5
73-6
39. D
ownl
oade
d fr
om w
ww
.ann
ualr
evie
ws.
org
by U
nive
rsid
ade
de S
ao P
aulo
(U
SP)
on 1
0/07
/13.
For
per
sona
l use
onl
y.

6 1 8 WILSON, CARLSON & WHITE
This contrast between rates of evolution at the two levels accounts for the fact that frogs that are very similar phenotypically can differ greatly at the sequence level. Species offrogs that are similar enough to be included within a single genus can differ as much at the sequence level as does a bat from a whale. While frog genes have been evolving at standard rates, their phenotypes have been changing slowly compared with mammalian phenotypes.
Other Organisms
Other examples of such contrasts are now known in a variety of taxonomic groups, ranging from bacteria (25 1 , 252), protozoa (253), and plants ( 1 63) to snails (254), worms (255), reptiles (256), birds ( 1 65, 249), and primates (89, 256a). A notable bacterial case concerns the c-type cytochromes. Within a single small family of non sulfur purple photosynthetic bacteria (the Rhodospirillaceae), Ambler et al (252) encountered far larger differences among these cytochromes than among all of the eukaryotic cytochromes (both plant and animal) examined to date. Another noteworthy example concerns ape and human evolution. Since humans and chimpanzees had a common ancestor, much more phenotypic change has occurred in the human lineage than in that of the chimpanzee (257). No such tendency is evident at the sequence level, in either proteins or nucleic acids (89). In spite of having evolved at an unusually high organismal rate, the human lineage does not appear to have undergone accelerated sequence evolution (89).
Blue-green A lgae
Blue-green algae provide an outstanding example of slow morphological evolution. Fossils resembling blue-green algae occur in rocks 3 X 10⁹ years old (258). Mayr (259) estimated that the tempo of phenotypic evolution has been 109 times lower in blue-green algae than in higher animals. It is therefore of interest to examine the recent claims that sequence evolution has proceeded unusually slowly in the ferredoxins (260), plastocyanins (26 1 ), and cytochromes f (261 ) of blue-green algae. We are skeptical of these claims because, as with primate evolution, there is great uncertainty about the times of divergence of the species whose proteins were compared. The fossil record for blue-green algae is extremely difficult to interpret phylogenetically. Owing to the very simple morphology of these algae, phylogenetic relationships are not well worked out, either among the living species or between living and fossil forms (258, 262).
Some workers propose that there is a major phylogenetic gap between the unicellular blue-green algae and the filamentous forms (258) and point to
Ann
u. R
ev. B
ioch
em. 1
977.
46:5
73-6
39. D
ownl
oade
d fr
om w
ww
.ann
ualr
evie
ws.
org
by U
nive
rsid
ade
de S
ao P
aulo
(U
SP)
on 1
0/07
/13.
For
per
sona
l use
onl
y.
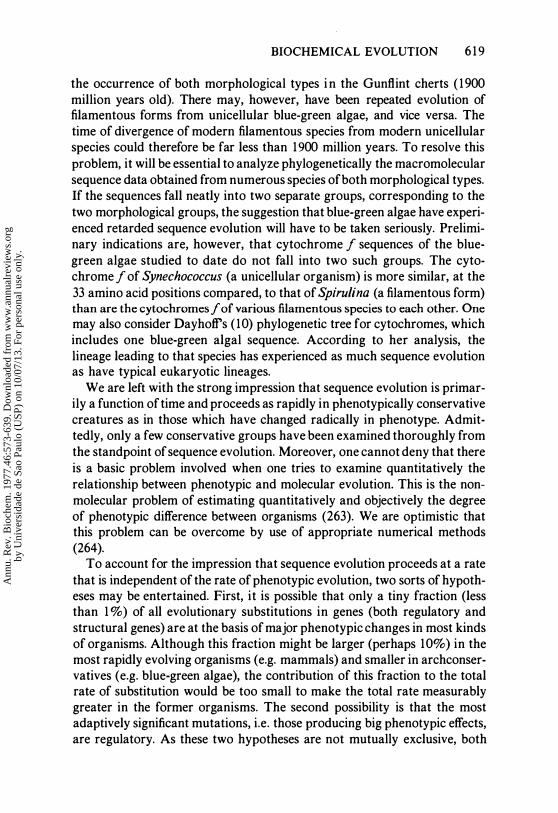
BIOCHEMICAL EVOLUTION 6 1 9
the occurrence of both morphological types i n the Gunflint cherts ( 1900 million years old). There may, however, have been repeated evolution of filamentous forms from unicellular blue-green algae, and vice versa. The time of divergence of modern filamentous species from modern unicellular species could therefore be far less than 1900 million years. To resolve this problem, it will be essential to analyze phylogenetically the macromolecular sequence data obtained from numerous species of both morphological types. If the sequences fall neatly into two separate groups, corresponding to the two morphological groups, the suggestion that blue-green algae have experienced retarded sequence evolution will have to be taken seriously. Preliminary indications are, however, that cytochrome f sequences of the bluegreen algae studied to date do not fall into two such groups. The cytochrome f of Synechococcus (a unicellular organism) is more similar, at the 33 amino acid positions compared, to that of Spirulina (a filamentous form) than are the cytochromes f of various filamentous species to each other. One
may also consider Dayhoff's (10) phylogenetic tree for cytochromes, which includes one blue-green algal sequence. According to her analysis, the lineage leading to that species has experienced as much sequence evolution as have typical eukaryotic lineages.
We are left with the strong impression that sequence evolution is primarily a function of time and proceeds as rapidly in phenotypically conservative creatures as in those which have changed radically in phenotype. Admittedly, only a few conservative groups have been examined thoroughly from the standpoint of sequence evolution. Moreover, one cannot deny that there is a basic problem involved when one tries to examine quantitatively the relationship between phenotypic and molecular evolution. This is the nonmolecular problem of estimating quantitatively and objectively the degree of phenotypic difference between organisms (263). We are optimistic that this problem can be overcome by use of appropriate numerical methods (264).
To account for the impression that sequence evolution proceeds at a rate that is independent of the rate of phenotypic evolution, two sorts of hypotheses may be entertained. First, it is possible that only a tiny fraction (less than 1 %) of all evolutionary substitutions in genes (both regulatory and structural genes) are at the basis of major phenotypic changes in most kinds of organisms. Although this fraction might be larger (perhaps 10%) in the most rapidly evolving organisms (e.g. mammals) and smaller in archconservatives (e.g. blue-green algae), the contribution of this fraction to the total rate of substitution would be too small to make the total rate measurably greater in the former organisms. The second possibility is that the most adaptively significant mutations, i.e. those producing big phenotypic effects, are regulatory. As these two hypotheses are not mutually exclusive, both
Ann
u. R
ev. B
ioch
em. 1
977.
46:5
73-6
39. D
ownl
oade
d fr
om w
ww
.ann
ualr
evie
ws.
org
by U
nive
rsid
ade
de S
ao P
aulo
(U
SP)
on 1
0/07
/13.
For
per
sona
l use
onl
y.

620 WILSON, CARLSON & WHITE
may turn out to be correct. The second hypothesis may be tested more easily, and evidence for it is now reviewed briefly.
REGULATORY EVOLUTION
Following publication of the classical model of gene regulation in bacteria (264a), many biologists considered the possible evolutionary role of regulatory mutations (37, 57, 265-27 1).
Acquisition of New Functions by Microbes
Direct evidence for the evolutionary importance of regulatory mutations comes from experiments with bacterial populations. Bacteria are, in several ways, ideal organisms with which to study the mechanism of evolution. First, bacterial populations adapt rapidly in the laboratory to new situations. This is because one can work with large populations having short generation times. Second, bacteria are relatively simple genetically, having only a few thousand genes per cell. Third, the biochemistry and genetics of some bacteria are so well known that one can hope to gain a precise molecular understanding of how they adapt to a well-defined change in environment. Much progress toward such an understanding has come from studies in which the environmental change is the appearance of a novel chemical.
When a bacterial population encounters a novel carbon compound, rare individuals may by chance carry a mutation that permits metabolic utilization of the compound. The mutants have a selective advantage if no other carbon source is available. Laboratory studies reveal that the primary event permitting such adaptation to a new resource is often a regulatory mutation. The regulatory mutant often produces a high concentration of an enzyme that has weak activity on the new compound because of chance chemical resemblance between the compound and the normal substrate. By virtue of having perhaps 100 times more of this enzyme than the wild-type bacteria do, the mutant can metabolize the new compound at a biologically significant rate (248, 272-276).
In most of the cases examined, the mutations involved appear to be in regulatory genes analogous to those of the lac operon, i.e. genes that regulate transcription of the gene coding for the enzyme that acts on the new compound. In other cases, the mutation raises the effective concentration of the enzyme by a mechanism not involving regulatory genes. This type of mutation is of importance in enabling yeast to use exogenous organic phosphates as a source of phosphate (277). The mutation brings about an intracellular redistribution of a phosphatase. These "wall" mutants differ from the wild type by having a high concentration of the phosphatase associated with the cell wall.
Ann
u. R
ev. B
ioch
em. 1
977.
46:5
73-6
39. D
ownl
oade
d fr
om w
ww
.ann
ualr
evie
ws.
org
by U
nive
rsid
ade
de S
ao P
aulo
(U
SP)
on 1
0/07
/13.
For
per
sona
l use
onl
y.

BIOCHEMICAL EVOLUTION 62 1
Another way of raising the effective concentration of a gene product that by chance can participate in a new metabolic process was uncovered in studies of leucine biosynthesis. By deleting a gene coding for the D polypeptide, which is a component of an enzyme in the leucine biosynthetic pathway of Salmonella, a nonrevertible strain incapable of leucine biosynthesis was obtained. It has been suggested that this enzyme normally contains two polypeptides: C, which carries the catalytic site, and D, which stabilizes the catalytic subunit. Certain point mutations were found to restore the ability of this strain to synthesize leucine. These mutations map at a locus (sup Q) coding for a protein, X, which normally complexes with a protein known as new D. However, in the sup Q mutants, X is inactive and new D is free to complex with C. So, the sup Q mutation raises the effective concentration of new D, which by chance has the ability to bind to C and permit C to catalyze the missing reaction in leucine biosynthesis (278).
The common feature of the mutations that initially confer a new metabolic ability in evolutionary experiments with microbes is the raising of the effective concentration of a protein that by chance already has a low, but appropriate, specificity. It is rare to find cases in which the primary event is a mutation in the gene coding for the enzyme that acts on the novel compound (277, 279).
When continued selection is applied for improvement in the new metabolic ability, secondary mutations are favored. These may include mutations that raise the level of a permease, which by chance recognizes the novel compound and facilitates its entry (280). Another type of secondary mutation is duplication of the structural gene coding for the enzyme ( 1 88, 277, 28 1) . The duplication has the effect of raising the concentration of the rate-limiting enzyme.
Eventually, in such experiments, one may find mutations within the gene coding for the rate-limiting enzyme. These structural gene mutations may alter the active site of the enzyme so that its reactivity with the novel compound increases. This further accelerates the metabolism of the new compound. Such mutations have not often been observed in evolutionary experiments, even though biochemists have looked hard for them ( 1 88, 277, 279, 282).
One would expect that if the old function of the enzyme that was recruited for the new function is to be retained along with the new function, there would need to be a further series of mutations fixed, although this has not yet been observed in the laboratory. There would first be selection for specificity-modifying mutations within one of the duplicate genes and against such mutations in the other structural gene. Following this, a complex series of regulatory changes would be expected. These would restore the original system for regulating the unmodified structural gene and impose a new system for regulating the modified structural gene.
Ann
u. R
ev. B
ioch
em. 1
977.
46:5
73-6
39. D
ownl
oade
d fr
om w
ww
.ann
ualr
evie
ws.
org
by U
nive
rsid
ade
de S
ao P
aulo
(U
SP)
on 1
0/07
/13.
For
per
sona
l use
onl
y.

622 WILSON, CARLSON & WHITE
Much remains to be done with these "evolution in the test tube" experiments. It is clear already, however, that the primary event in microbial acquisition of new metabolic abilities is usually the fixation of a mutation that is regulatory, in that it raises the effective concentration of a protein that by chance already has the specificity required to permit metabolism of the novel compound.
Changing Enzyme Levels in Animal Evolution We suspect that regulatory mutations have had a major role in the adaptive evolution of multicellular animals too, but the evidence is indirect.
First, let us review evidence that regulatory evolution has occurred in these organisms. This is shown by many examples in which the concentration of a well-known protein produced by a given cell type (or tissue) varies from one species to another. Table 2 contains a partial list of examples from
Table 2 Species differences in concentration of specific proteinsa
Cell type Protein Species compared or tissue Reference
Acyl desaturase ruminant vs rabbit m ammary gland 285 Alcohol dehydrogenase mouse vs rat kidney 3 6 2b
Amylase human vs dog salivary gland 363
Arginase mammal vs bird liver 292 ATP-citrate lyase rat vs ruminant liver 286 Fructose diphosphatase ruminant vs rat m ammary gland 285
NADP-isocitrate dehydrogenase ruminan t vs ra t mammary gland 285
Lactate dehydrogenase (M4) pheasant vs petrel breast muscle 364 human vs ruminant liver 365
iJ-lactoglobulin ruminant vs human m am mary gland 366
Lysozyme c human vs cow mammary gland 285 human vs rabbit tear gland 2 1 4 chicken vs goose oviduct 367
Lysozyme g goose vs penguin oviduct 3 6 7 NA DP-malate dehydrogenase rat vs ruminant m ammary gland 285 Myoglobin whale vs human skeletal muscle 368 Nerve growth factor mouse vs rat salivary gland 3 6 2 , 369b ,c
Ovomacroglobulin chicken vs turkey oviduct 3 7 0 Penalbumin penguin vs chicken oviduct 249 Pyruvate carboxylased rat vs ruminant adipose tissue 286 Ribonuclease ruminant vs human pancreas 2 8 7 , 2 8 8
a The concentration found in t h e species o n t h e left exceeds that in the species on the right by an order o f magnitude or more.
bS. Ohno, personal communication. c A. M. Longo and E. E . Penhoet, personal communication. dMitochondrial form .
Ann
u. R
ev. B
ioch
em. 1
977.
46:5
73-6
39. D
ownl
oade
d fr
om w
ww
.ann
ualr
evie
ws.
org
by U
nive
rsid
ade
de S
ao P
aulo
(U
SP)
on 1
0/07
/13.
For
per
sona
l use
onl
y.
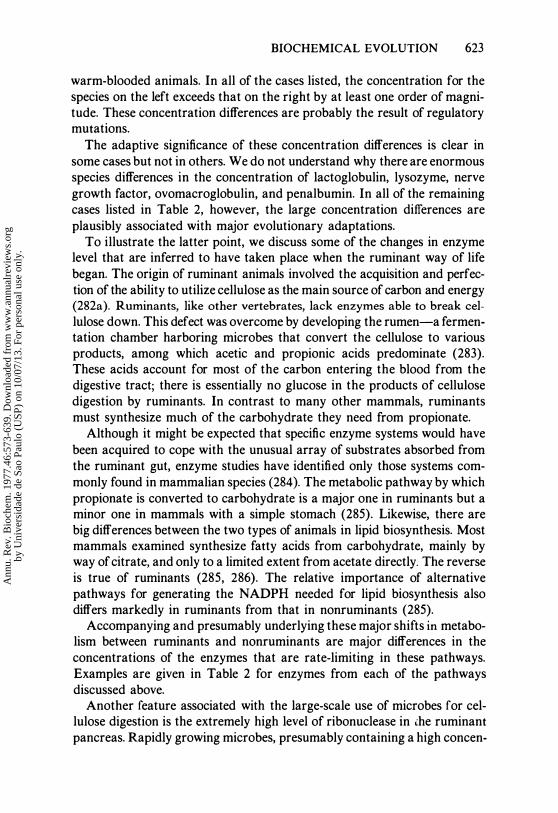
BIOCHEMICAL EVOLUTION 623
warm-blooded animals. In all of the cases listed, the concentration for the species on the left exceeds that on the right by at least one order of magnitude. These concentration differences are probably the result of regulatory mutations.
The adaptive significance of these concentration differences is clear in some cases but not in others. We do not understand why there are enormous species differences in the concentration of lactoglobulin, lysozyme, nerve growth factor, ovomacroglobulin, and penalbumin. In all of the remaining cases listed in Table 2, however, the large concentration differences are plausibly associated with major evolutionary adaptations.
To illustrate the latter point, we discuss some of the changes in enzyme level that are inferred to have taken place when the ruminant way of life began. The origin of ruminant animals involved the acquisition and perfection of the ability to utilize cellulose as the main source of carbon and energy (282a). Ruminants, like other vertebrates, lack enzymes able to break cellulose down. This defect was overcome by developing the rumen-a fermentation chamber harboring microbes that convert the cellulose to various products, among which acetic and propionic acids predominate (283). These acids account for most of the carbon entering the blood from the digestive tract; there is essentially no glucose in the products of cellulose digestion by ruminants. In contrast to many other mammals, ruminants must synthesize much of the carbohydrate they need from propionate.
Although it might be expected that specific enzyme systems would have been acquired to cope with the unusual array of substrates absorbed from the ruminant gut, enzyme studies have identified only those systems commonly found in mammalian species (284). The metabolic pathway by which propionate is converted to carbohydrate is a major one in ruminants but a minor one in mammals with a simple stomach (285). Likewise, there are big differences between the two types of animals in lipid biosynthesis. Most mammals examined synthesize fatty acids from carbohydrate, mainly by way of citrate, and only to a limited extent from acetate directly. The reverse is true of ruminants (285, 286). The relative importance of alternative pathways for generating the NADPH needed for lipid biosynthesis also differs markedly in ruminants from that in nonruminants (285).
Accompanying and presumably underlying these major shifts in metabolism between ruminants and nonruminants are major differences in the concentrations of the enzymes that are rate-limiting in these pathways. Examples are given in Table 2 for enzymes from each of the pathways discussed above.
Another feature associated with the large-scale use of microbes for cellulose digestion is the extremely high level of ribonuclease in .he ruminant pancreas. Rapidly growing microbes, presumably containing a high concen-
Ann
u. R
ev. B
ioch
em. 1
977.
46:5
73-6
39. D
ownl
oade
d fr
om w
ww
.ann
ualr
evie
ws.
org
by U
nive
rsid
ade
de S
ao P
aulo
(U
SP)
on 1
0/07
/13.
For
per
sona
l use
onl
y.

624 WILSON, CARLSON & WHITE
tration of ribosomes, pass into the intestine where they are digested by various enzymes including pancreatic ribonuclease (287). By contrast, humans and most other primates tested do not have a continual rapid influx of microbes into the intestine and have a thousand times less ribonuclease per gram of pancreas (287, 288). It seems likely that an enormous derepression of pancreatic ribonuclease took place when ruminants originated.
These several cases of altered enzyme levels were probably as important as the altered morphology for the origin of ruminants. If so, regulatory mutations had a major role in evolution of the ruminant way of life.
Changing patterns of enzyme levels may also underlie the major adaptive shifts that vertebrates underwent as they colonized the land and as their embryonic development became less dependent on an aqueous habitat. We refer especially to evolutionary change in the alternative pathways by which excess amino groups, arising from protein catabolism, are metabolized and excreted. The story of these metabolic changes, one of the classics of comparative biochemistry (289), involves excretion of amino groups first as ammonia (in early, jawless fishes) and later as urea (in lungfishes, amphibians, and mammals), or uric acid (in birds and reptiles). The enzymes for these pathways occur widely, probably in all vertebrates (290, 291). Thus the mammals, which excrete their excess amino groups as urea, have high levels of all of the urea-pathway enzymes, especially arginase, and low levels of the enzymes for de novo synthesis of purines and uric acid. Conversely, birds, which excrete their excess amino groups mainly as uric acid, have high levels of the purine biosynthetic enzymes and a low level of arginase (292-295). It appears that the major differences in nitrogenous excretory metabolism among vertebrates are due chiefly to differences in the relative concentrations of enzymes.
The examples discussed above lead to the suggestion that major metabolic shifts are usually achieved by altering patterns of expression of genes coding for enzymes. Occasionally, of course, the combined processes of regulatory change, gene duplication, and structural gene change are required in order to develop a new specificity-as occurred in the case of lactalbumin evolution from lysozyme. On the basis of present knowledge, however, it is not necessary to postulate any role for gene duplication or structural gene evolution to account for the metabolic shifts discussed above.
It is important to recognize that, although the above interpretations may seem reasonable, the evidence is indirect. Direct molecular genetic analysis is still required to demonstrate rigorously that regulatory evolution has occurred in the pathways discussed.
Ann
u. R
ev. B
ioch
em. 1
977.
46:5
73-6
39. D
ownl
oade
d fr
om w
ww
.ann
ualr
evie
ws.
org
by U
nive
rsid
ade
de S
ao P
aulo
(U
SP)
on 1
0/07
/13.
For
per
sona
l use
onl
y.
Hybrid Inviability
BIOCHEMICAL EVOLUTION 625
A second line of evidence consistent with the regulatory hypothesis has been described ( 105, 1 69, 248, 296). This evidence requires consideration of interspecific hybridization. Although there are many natural barriers to fertilization of an egg by sperm of another species, these are usually not absolute. Supposing an interspecific zygote forms, one can ask what chance it has of developing into a viable adult. Embryonic development involves an orderly program of expression of many genes that were inactive in the zygote (297). If the two genomes in an interspecific zygote are similarly regulated, so that a given block of genes will be turned on at the same time in one genome as in the other, orderly development of a hybrid organism can be expected. However, should the patterns of gene expression differ, the probability of an interspecific zygote developing successfully would be low. In accordance with this view, organismal hybrids derived from extremely different parental species often show signs of breakdowns in gene regulation (298, 299).
As pointed out before, frogs have evolved much more slowly in morphology than have mammals. If regulatory evolution has also been slower in frogs than in mammals, one would expect that frog species should retain the potential to hybridize with one another much longer than mammals do. Since the rate of albumin evolution in frogs has been approximately equal to that in mammals, one expects to find small albumin immunological distances among mammals capable of hybridizing, whereas among hybridizable frogs one should encounter large immunological distances. The albumin distances are in accordance with this expectation. The mean albumin distance between hybridizable mammalian species is 3.2 units, whereas the corresponding distance for hybridizable frogs is 36 units ( 105). Using albumin as a clock, one can estimate that it takes about two million years for a distance of 3.2 units to arise and about 2 1 million years for a distance of 36 units to arise ( 1 69). Thus mammals have lost the potential for interspecific hybridization about ten times faster than frogs have (Table 3). This is consistent with the possibility that regulatory mutations affecting embryonic development have been fixed more often in mammalian evolution than in frog evolution.
GENE DUPLICATION
A major role in adaptive evolution has been ascribed to gene duplication ( 1 88, 20 1), since this is the process by which new genes arise. With two copies of a gene available to an organism, one copy may continue to provide
Ann
u. R
ev. B
ioch
em. 1
977.
46:5
73-6
39. D
ownl
oade
d fr
om w
ww
.ann
ualr
evie
ws.
org
by U
nive
rsid
ade
de S
ao P
aulo
(U
SP)
on 1
0/07
/13.
For
per
sona
l use
onl
y.

626 WILSON, CARLSON & WHITE
Table 3 Comparison of mean rates of evolution at various levels in mammals and frogsa
Property
Amino acid sequences Hybrid inviability Chromosome number Chromosome arm number Speciation Anatomy
a Based on (45 , 105, 3 13).
Mammal rate/frog rate
10 1 1 14 5
3-20b
bBased on preliminary attempts to compare quantitatively the mean rate of anatomical change in mammals with that in frogs (A. C. Wilson, unpublished work).
the original function while the other accumulates mutations that may alter its function. An example would be the evolution of lactalbumin from lysozyme. Thus, gene duplication allows the complexity of organisms to increase. Consequently, it may have an important role in the origin of higher, i.e. more complex, organisms such as the vertebrates, which have several hundred times more DNA than do bacteria.
Although a role for gene duplication in the creation of new genes cannot be doubted, we must temper this statement by recalling the evidence discussed in the section on regulatory evolution. That is, new metabolic activities arise frequently in bacterial evolution experiments and in vertebrate evolution by regulatory evolution alone. Gene duplication is not essential for the origin of new metabolic functions.
We direct attention to the relationship between gene duplication and regulatory evolution. First, one may consider the case of duplication of a regulatory gene, followed by functional divergence in the control properties of the two copies. Second, there is the case of duplicating both a structural gene and an adjacent regulatory gene; the two regulatory genes could then diverge functionally without functional divergence in the structural genes. A third case would be duplication of a structural gene followed by a gene rearrangement, which brings one of the copies under the influence of another set of regulatory genes. These three cases provide opportunities for new biological functions to develop without any functional change occurring in structural genes.
Many cases of duplicate structural genes have been inferred from studies at the protein level, especially in higher organisms. The globin chains of hemoglobin (a, /3, ,)" 8) and myoglobin are the most famous example (300). Many other examples are known (8, 10, 301-304). It is impressive that these duplicate structural genes are regulated independently in the majority of cases examined, even though the gene products are quite similar or even
Ann
u. R
ev. B
ioch
em. 1
977.
46:5
73-6
39. D
ownl
oade
d fr
om w
ww
.ann
ualr
evie
ws.
org
by U
nive
rsid
ade
de S
ao P
aulo
(U
SP)
on 1
0/07
/13.
For
per
sona
l use
onl
y.

BIOCHEMICAL EVOLUTION 627
identical in biochemical function. The f3- and a-chains of hemoglobin, for instance, are quite alike in oxygen-binding properties, but one chain (f3) is synthesized 30 times more rapidly than the other (30, 305). It is more usual to find that one of the duplicate genes is expressed in a given cell type and the other is expressed in another cell type or at another time during embryonic development. Isoenzymes are in this category. The H4 and M4 isoenzymes oflactate dehydrogenase are homologous to each other in amino acid sequence (306) but are the products of genes that are regulated independently. Whereas the H gene is expressed most actively in heart muscle, the M gene is most active in white skeletal muscle. Both enzymes catalyze the interconversion of lactate and pyruvate, but lactate dehydrogenase in the heart participates almost exclusively in the aerobic pathway of lactate oxidation, whereas in white skeletal muscle the enzyme functions in the production of lactate by anaerobic glycolysis. Small differences in catalytic properties between the isoenzymes, especially in susceptibility to pyruvate inhibition, have been interpreted to mean that one is better suited for lactate oxidation (H4) and the other for pyruvate reduction (M4), but this has been disputed (307, 308). It could well be that the catalytic differences between isoenzymes are less significant adaptively than their striking regulatory differences.
Although the creation of genes with new functions is its most important role, gene duplication is also the mechanism by which multiple copies of the genes for ribosomal RNA, histones, and transfer RNA are produced (20 1 , 309). These multiple copies provide one solution to the problem of synthesizing an enormous amount of gene product. However, they also provide molecular evolutionists with an intriguing problem. The multiple copies typically occur as clusters of tandemly arranged repetitious genes. Within a given species, there is impressive homogeneity in base sequence throughout a cluster, yet, between closely related species, there may be marked differences in sequence. Despite the fact that evolution goes on in these sequences, homogeneity within clusters is maintained. If each gene within a cluster evolved independently, great heterogeneity would be expected. Of the various mechanisms proposed for the maintenance of sequence homogeneity within a tandem array, the most plausible are crossover fixation (3 10) and truncation selection (34).
GENE REARRANGEMENT
Studies of chromosomal evolution have recently produced results that may be relevant to an understanding of regulatory evolution, speciation, and phenotypic evolution (3 1 1-3 14) . Rates of chromosomal evolution can be estimated approximately by comparing microscopically the chromosomes
Ann
u. R
ev. B
ioch
em. 1
977.
46:5
73-6
39. D
ownl
oade
d fr
om w
ww
.ann
ualr
evie
ws.
org
by U
nive
rsid
ade
de S
ao P
aulo
(U
SP)
on 1
0/07
/13.
For
per
sona
l use
onl
y.

628 WILSON, CARLSON & WHITE
of one species with those of another species whose time of divergence from the first species is known (from fossil or protein evidence). By chromosomal evolution, we mean evolutionary change in the number of chromosomes per genome and in the number of chromosomal arms per genome. Such changes may be brought about by mutations affecting the arrangement of large blocks of genes. These rearrangements include fusions, fissions, translocations, and inversions as well as heterochromatin addition; we refer to them collectively as chromosomal mutations.
Chromosomal mutations can have three effects. First, they can bring genes into new regulatory relationships with one another so that altered patterns of gene expression can result (248, 27 1 , 296, 3 1 5). Second, by linking tightly two polymorphic genes that were hitherto far apart in the genome, a chromosomal mutation can produce a particular combination of alleles (a supergene) that is unlikely to be destroyed by recombination (58). Third, the chromosome mutation can act as a sterility barrier because, in heterozygotes, the mutant chromosome cannot pair properly with the wildtype homologue and, in consequence, meiosis is defective. Thus the heterozygote will often have low fertility. By acting as a barrier to gene flow between a mutant population and the wild-type population, chromosomal mutations may facilitate the process of speciation (3 13 , 3 14, 3 1 6, 3 1 7).
Rates of chromosomal evolution have been highest, as a general rule, in those groups of organisms which have speciated most rapidly and evolved unusually rapidly at the phenotypic level (3 1 2-3 14). Mammals, for instance, have generally evolved much faster in all three respects than have most lower vertebrates, e.g. frogs (Table 3). Likewise, among plants, the herbaceous flowering plants have evolved faster in all of these respects than have the cycads or conifers ( 1 63, 3 1 2).
These correlations might be explained by supposing that chromosomal mutations act chiefly as sterility barriers facilitating speciation, which, in turn, facilitates phenotypic evolution. It is also possible that chromosomal mutations influence phenotypic evolution directly by acting as regulatory mutations. These matters are discussed further elsewhere, along with a consideration of the influence of population structure and dynamics on fixation of chromosomal mutations and point mutations in regulatory genes (3 12-3 14).
HORIZONTAL GENE TRANSFER
Gene transfer within a bacterial species is an important mechanism for the acquisition of new functional capabilities in a single generation. The suggestion has also been made that extrachromosomal elements may have a major effect On the evolution of prokaryotic and eukaryotic organisms through the direct exchange of genetic information between phylogenetically remote
Ann
u. R
ev. B
ioch
em. 1
977.
46:5
73-6
39. D
ownl
oade
d fr
om w
ww
.ann
ualr
evie
ws.
org
by U
nive
rsid
ade
de S
ao P
aulo
(U
SP)
on 1
0/07
/13.
For
per
sona
l use
onl
y.

BIOCHEMICAL EVOLUTION 629
biological species (3 1 8-32 1). The evidence for genetic transfer between species comes mainly from studies of plasmids and phages in bacteria (for review see 322, 323). In higher organisms, Benveniste & Todaro have shown that type-C viral genes can be transferred between distantly related mammals, incorporated into their germ lines, and subsequently inherited as cellular genes (102). With respect to even larger units of genetic information, such as eukaryotic organelles, evidence for the theory of an endosymbiotic origin for the chloroplasts of green plants has continued to accumulate (324-326). Although these exciting findings have generated much interest and speculation about the importance of horizontal transfer in evolutionary processes, there is also considerable evidence that is inconsistent with a major adaptive role for these factors (327). Fortunately, this hypothesis can soon be tested directly in several well-characterized systems.
Plasmid Evolution
The acquisition of transferable multiple-drug resistance by a wide variety of clinically important microorganisms is perhaps the most dramatic example of evolution mediated by extrachromosomal elements (for reviews see 322, 328-33 1). In clinical isolates of resistant bacteria, resistance is usually associated with R plasmids, which carry structural genes for enzymes that inactivate antibiotics (332-335; see 334 for nomenclature). Such R plasmids can replicate independently of a bacterial chromosome and can be transferred among the members of a bacterial population through conjugation in a single generation, thus bypassing the slower process of inheritance through cell division. Conjugative plasmids may also be transferred among different bacterial genera (327, 330), or even different families. Furthermore, it is possible for two plasmids with different host specificities to exchange resistance genes in a host that can co-maintain both plasmids, followed by their redistribution to bacteria unable to host one of the parent plasmids (336). By such a process, resistance genes might be transferred among unrelated and conjugally noninterfertile bacteria. Conjugative plasmids have not been documented in eukaryotes, although an extrachromosomal element is responsible for drug resistance in yeast (337, 338), and many eukaryotes contain small circular DNAs of unknown function (see 339 and references therein).
It should be possible to elucidate the evolutionary origin of the structural genes that specify antibiotic-modifying enzymes. Two possibilities can be envisaged. First, modifying enzymes with a particular substrate specificity that are isolated from diverse bacterial species may have had a common origin in a single prokaryotic species with subsequent extensive horizontal transfer. Alternatively, such enzymes may have had multiple origins among prokaryotes followed by limited genetic transfer among closely related species. R plasmid and chromosomally determined /3-lactamases (340-
Ann
u. R
ev. B
ioch
em. 1
977.
46:5
73-6
39. D
ownl
oade
d fr
om w
ww
.ann
ualr
evie
ws.
org
by U
nive
rsid
ade
de S
ao P
aulo
(U
SP)
on 1
0/07
/13.
For
per
sona
l use
onl
y.
630 WILSON, CARLSON & WHITE
346), chloramphenicol acetyltransferases (347-349), and aminoglycosidemodifying enzymes (350) have been compared from a variety of bacterial species. The results are not sufficient to distinguish between these two possibilities.
Quantitative estimates of the degree of sequence homology among antibiotic-modifying enzymes would help to determine both the origin of resistance genes and the extent of their horizontal transfer. It is particularly important to use more informative techniques, such as amino acid sequencing or microcomplement fixation, than those used to date. For example, isoelectric focusing cannot necessarily distinguish between proteins that are very different in amino acid sequence (35 1). Also, immunodiffusion methods are insensitive (77). Once quantitative data are obtained, molecular phylogenies of homologous modifying enzymes should be constructed and tested for congruency with phylogenies based on other proteins and classical taxonomic characters. Although it is quite possible that examples of unusually close sequence resemblance between antibiotic-modifying enzymes isolated from distantly related bacteria will be found, the existing evidence does not indicate that these enzymes are any more similar in sequence than one would expect from comparison of other proteins such as alkaline phosphatases, azurins, or tryptophan synthetases, or from classical estimates of taxonomic distance.
Virogene Evolution
It is well-known that bacteriophages can transfer host and plasmid genes by the process of transduction and that these genes can be incorporated into the chromosome of the recipient bacterium. The possible role of this process in bacterial evolution is reviewed elsewhere (32 1 , 323).
In higher organisms, viruses can infect species from very different taxonomic groups, c.g. alfalfa mosaic virus in plants and arboviruses in insects and primates (32 1). Although many authors have speculated about a possible role for viruses in the evolution of higher organisms (3 19, 321), the ability of viruses to transfer host chromosomal genes between higher organisms has not been documented. It is possible that host chromosomal transfer and recombination may be mediated by the primate virus SV 40; work in this area is progressing rapidly (352, 353).
The best evidence for the transfer of genetic material between mammalian species that are remotely related phylogeneticaUy comes from studies of type-C RNA-containing viruses. Benveniste & Todaro used DNA hybridization techniques to measure sequence homology between the cellular DNA of various mammals and DNA probes prepared from endogenous type-C viruses. Their results suggest that primate viral genes infected an ancestor of the domestic cat and subsequently became part of its chromosomal DNA ( 102). Type-C viral genes were also apparently introduced into
Ann
u. R
ev. B
ioch
em. 1
977.
46:5
73-6
39. D
ownl
oade
d fr
om w
ww
.ann
ualr
evie
ws.
org
by U
nive
rsid
ade
de S
ao P
aulo
(U
SP)
on 1
0/07
/13.
For
per
sona
l use
onl
y.

BIOCHEMICAL EVOLUTION 63 1
the pig lineage through trans-species infection by an ancestral murine virus (103). These workers' conclusions regarding the rates of evolution of virogene sequence and the time of the horizontal transfer appear to be invalidated, however, by their assumptions about a generation-length effect ( 103, 104), the murid rodent fossil record (103), and the extreme nonreciprocity observed in some of their annealing tests ( 103).
Exp ectations of a Genetic-Transfer Hyp othesis
In view of the willingness of many biologists to accept the hypothesis that extrachromosomal elements may play an important role in the evolution of organisms, it is worthwhile to examine some of the testable expectations of this hypothesis. The most rigorous published analysis of the significance of gene transfer to genetic relatedness among species is that of Sanderson with the Enterobacteriaceae (327). He suggests that if free exchange of genes has occurred between different bacterial genera and species, one might expect evolutionary patterns in DNA sequence complementarity, protein structure, and linkage maps to have been obscured. In contrast to these expectations, DNA hybridization studies showed a high degree of concordance with classical taxonomic views (327). Furthermore, protein sequence studies of tryptophan synthetases (33) and immunological comparisons of alkaline phosphatases (354) generally agreed with the results of nucleic acid methods as well as other methods of estimating taxonomic distance. Sanderson concluded that there is no evidence for free and random reshuffling of chromosomal genes during the evolution of Enterobacteriaceae.
The extent and significance of horizontal gene transfer could be assessed further by searching for unusual interspecific similarity between single genes against a background of diversity of other genes (47). We choose to call this the phylogenetic congruency test. For example, a quantitative immunological comparison of the plasmid-associated J3-galactosidases of enteric bacteria (355) could be used to construct a phylogeny that could be tested for congruency with a phylogeny of alkaline phosphatases (354). In addition, if horizontal gene transfer has been a major factor in the evolution of blue-green algae, an ancient group that is infected by numerous cyanophages (377), we might expect them to be genetically homogeneous. Thus, sequence comparisons of blue-green algal 5S RNAs ( 1 59), 1 6S ribosomal RNAs (325, 326), phycobiliproteins (356), ferredoxins (260), plastocyanins (261), and cytochromesf(261 ) should produce molecular phylogenies that are congruent. Among higher organisms, the sequence resemblance of enzymes in the pathway leading to the synthesis of tetrodotoxin might be compared in the puffer fish, octopus, and salamander (357).
In summary, extrachromosomal elements may be an important factor in the acquisition of a limited number of genetic characters both within a species and among closely related organisms. The question of whether
Ann
u. R
ev. B
ioch
em. 1
977.
46:5
73-6
39. D
ownl
oade
d fr
om w
ww
.ann
ualr
evie
ws.
org
by U
nive
rsid
ade
de S
ao P
aulo
(U
SP)
on 1
0/07
/13.
For
per
sona
l use
onl
y.

632 WILSON, CARLSON & WHITE
integration of genes transferred by plasm ids or viruses between phylogenetically remote species has been repeatedly used in adaptive evolution remains to be demonstrated. Such demonstrations will require application of phylogenetic congruency tests. Significant incongruities are rare in those taxonomic groups which have been well-studied from a molecular phylogenetic point of view.
CONCLUSIONS AND PROSPECTS
The molecular clock came as a surprise and is having a major impact on evolutionary biology. It allows the properties of organisms, even those with a poor fossil record, to be viewed easily from a time perspective. That is, rates of evolutionary change can be calculated whether the properties are chromosomal, morphological, or behavioral. By comparing these various rates, one can identify important evolutionary parameters at different levels of organization. It is on this basis that regulatory evolution is postulated as being at the basis of morphological evolution.
We anticipate that exciting developments in the next decade will result from using the new techniques of sequencing DNA and cloning genes. These methods will reveal substitutions that are not detected by protein comparisons. They may also permit regulatory gene evolution to be examined directly. Finally, these approaches may provide a high-resolution method for studying evolutionary changes in gene arrangement.
ACKNOWLEDGMENTS
We thank S. M. Beverley, W. M. Fitch, M. Goodman, R. Holmquist, M. Nei, and E. M. Prager for commenting on the manuscript.
Literature Cited
I . Kenyon, D. H., Steinman, G. 1 969. Biochemical Predestination. New York: McGraw-Hill. 301 pp.
2. Eigen, M. 197 1 . Naturwissenschaften 58:465-523
3. Miller, S. L., Orgel, L. E. 1 974. The Origins of Life on the Earth. New York: Prentice-Hall. 229 pp.
4. Ponnamperuma, C., Gabel, N. W. 1974. In Evolution in the Microbial World. ed. M. J. Carlile, J. J. Skehel. Cambridge, England: Cambridge Univ. Press. 430 pp.
5. Nolan, C., Margoliash, E. 1968. Ann. Rev. Biochem. 37:727-90
6. Smith, ·E. 1970. The Enzymes 1 :267-
339 7. Margoliash, E. 1972. Harvey Lect.
66:1 77-248
8. Dayhoff, M. 0., ed. 1 972. Atlas of Protein Sequence and Structure. Vol. 5. Silver Spring, Md: Natl. Biomed. Res. Found. 4 1 8 pp.
9. Dayhoff. M. 0., ed. 1 973. See Ref. 8, 5:Suppl. I, pp. 1-1 14
10. Dayhoff, M. 0., ed. 1976. See Ref. 8, 5:Suppl. 2, pp. 1-345
I I . Fitch, W. M. 1 973. Ann. Rev. Genet. 7:343-80
12. Arnheim. N. Jr. 1 973. In The Antigens, ed. M. Sela, 1 :377-416. New York: Academic. 573 pp.
1 3. Wu, T. T., Fitch, W. M., Margoliash, E. 1 974. Ann. Rev. Biochem. 43:539-66
14. Williams, J. 1974. In MTP Int. Rev. Sci., ed. H. Gutfreund, 1 : 1-56. Baltimore: Univ. Park Press. 4 1 1 pp.
Ann
u. R
ev. B
ioch
em. 1
977.
46:5
73-6
39. D
ownl
oade
d fr
om w
ww
.ann
ualr
evie
ws.
org
by U
nive
rsid
ade
de S
ao P
aulo
(U
SP)
on 1
0/07
/13.
For
per
sona
l use
onl
y.

BIOCHEMICAL EVOLUTION 633
15 . Lewontin, R. C. 1974. The Genetic Basis 0/ Evolutionary Change. New York: Columbia Univ. 346 pp.
1 6. Kimura, M., Ohta, T. 1974. Proc. Natl. Acad. Sci. USA 7 1 :2848-52
1 7. Acher, R. 1974. Angew. Chem. Int. Edit. 1 3 : 1 86-97
18 . Nei, M. 1975. Molecular Population Genetics and Evolution. New York: Elsevier. 288 pp.
19. Salthe, S. N. 1975. Am. Zool. 1 5:295-3 1 4
20. Doolittle, R . F . 1977. In The Proteins. ed. H. Neurath, R. L. Hill, Vol. 4. New York: Academic. 3rd ed. In press
2 1 . Zuckerkandl, E. 1977. In Molecular Anthropology. ed. M. Goodman, R. E. Tashian, pp. 387-447. New York: Plenum. 462 pp.
22. Le Cam, L. M., Neyman, J., Scott, E. L. 197 1 . Proc. 6th Berkeley Symp. Mathematical Statistics ana Probability. Berkeley: Univ. Calif. Press. 369 pp.
23. Smith, H. H. 1972. Evolution a/Genetic Systems. New York: Gorden & Breach. 580 pp.
24. Ayala, F. J., ed. 1976. Molecular Evolution. Sunderland, Mass: Sinauer. 277 pp.
25. Hood, L., Doolittle, R. F. 1976. Fed. Proc. 34:2077-173
26. Zuckerkandl, E., Pauling, L. 1962. In Horizons in Biochemistry, ed. M. Kasha, B. Pullman, pp. 189-225. New York: Academic. 604 pp.
27. Vogel, F., Rathenberg, R. 1975. Adv. Human Genet. 5:223-3 1 8
28. Jukes, T . H . 1975. Biochim. Biophys. Res. Commun. 66: 1-8
29. Whitfield, H. J. Jr., Martin, R. G., Ames, B. N. 1966. J. MoL Bioi. 2 1 :335-55
30. Harris, H. 1975. Principles 0/ Human Biochemical Genetics. Cambridge, England: Cambridge Univ. Press. 473 pp. 2nd ed.
3 1 . Drake, J. W., Baltz, R. H. 1976. Ann. Rev. Biochem. 45: 1 1-37
32. Robertson, H. D., Jeppesen, P. G. N. 1972. J. Mol. DiaL 68:417-28
33. Li, S. L., Denney, R. M., Yanofsky, C. 1973. Proc. Natl. Acad. Sci. USA 70: 1 1 12-16
34. Salser, W. , Isaacson, J . 1977. Prog. Nucleic Acid Res. 19:205-20
35. Grunstein, M., Schedl, P., Kedes, L. 1976. J. MoL Dial. 104:35 1-69
36. Fitch, W. M., Margoliash, E. 1970. Evol. DiaL 4:67-109
37. Zuckerkandl, E., Pauling, L. 1 965. In Evolving Genes and Proteins. ed. V.
Bryson, H. J. Vogel, p. 97. New York: Academic. 629 pp.
38. Holmquist, R., Cantor, C., Jukes, T. 1972. J. MoL Bioi. 64: 145-6 1
39. Jukes, T. H., Holmquist, R. 1 972. J. Mol. BioL 64: 163-79
40. Fitch, W. M., Margoliash, E. 1 967. Science 1 55:279-84
4 1 . Farris, J. S. 1972. Am. Nat. 106:645-68 42. Moore, G. W., Goodman, M., Bar
nabas, J. 1 973. J. Theor. Bioi. 38: 423-57
42a. Beyer, W. A., Smith, T. F., Stein, M. L., Ulam, S. M. 1974. Math. Biosci. 19:9-25
42b. Waterman, M. S., Smith� T. F., Beyer, W. A. 1976. Adv. Math. 20: 367-87
43. Fitch, W. M. 1971 . Syst. Zool. 20: 406-16
44. Fitch, W. M., Farris, J . S. 1 974. J. Mol. Evo/. 3 :263-78
45. Moore, G. W., Barnabas, J., Goodman, M. 1 973. J. Theor. BioI. 38:459-85
46. Fitch, W. M. 1976. J. Mol. Evol. 8 : 13�
47. Sneath, P. H. A. 1974. See Ref. 4, pp. 1�
48. Peacock, D., Boulter, D. 1975. J. Mol. Bioi. 95:51 3-27
49. Maxson, L. R., Sarich, V. M., Wilson, A. C. 1975. Nature 255:397-400
49a. Prager, E. M., Wilson, A. C. 1976. J. Mol. Evol. 9:45-57
50. Dickerson, R. E. 1 97 1 . J. Mol Evol. 1 :26-45
5 1 . Moore, G. W., Goodman, M., Callahan, C., Holmquist, R., Moise, H. 1976. J. Mol. BioI. 105:1 5-37
52. Nei, M., Chakraborty, R. 1976. J. Mol. EvoL 7:3 \ 3-23
53. Uzzell, T., Corbin, K. W. 197 1 . Science 1 72: 1089-96
54. Fitch, W. M. 1976. See Ref. 24, pp. 1 60--78
55. Holmquist, R. 1972. J. MoL Evol. 1 :2 1 1-22
56. Holmquist, R., Jukes, T. H., Moise, H., Goodman, M., Moore, G. W. 1976. J. Mol. BioL 105:39-74
57. Mayr, E. 1970. Populations. Species and Evolution. Cambridge Mass: Harvard Univ. Press. 453 pp.
58. Dobzhansky, T. 1 970. Genetics 0/ the Evolutionary Process. New York: Columbia Univ. Press. 505 pp. 2nd ed.
59. Bush, G. L. 1975. Ann. Rev. Ecol. Syst. 6:339-64
60. Fleming, S. 1 976. New Scientist 7 1 :6-8 6 1 . Penny, D. 1 976. J. Mol. Evol. 8:95-1 1 6 62. Romer, A . S . 1 966. Vertebrate Paleon-
Ann
u. R
ev. B
ioch
em. 1
977.
46:5
73-6
39. D
ownl
oade
d fr
om w
ww
.ann
ualr
evie
ws.
org
by U
nive
rsid
ade
de S
ao P
aulo
(U
SP)
on 1
0/07
/13.
For
per
sona
l use
onl
y.

634 WILSON, CARLSON & WHITE
tology. Chicago: Univ. Chicago Press. 468 pp. 3rd ed.
63. Van Valen, L. 197 1 . Evolution 25: 420-28
64. Van Valen, L. 197 1 . Evolution 25: 523-29
65. Lillegraven, J. A. 1974. Ann. Rev. Ecol. Syst. 5:263-83
66. McKenna, M. 1975. In Phylogeny of the Primates, ed. F. Szalay, W. F. Luckett, pp. 21-46. New York: Plenum. 483 pp.
67. Fitch, W. M., Langley, C. H. 1976. Fed. Proc. 35:2092-97
68. Wasserman, E., Levine, L. 1961. J. 1mmunol. 87:290-95
69. Levine, L., Van Vunakis, H. 1967. Methods Enzymol. 1 1 :928-36
70. Champion, A. B., Prager, E. M., Wachter, D., Wilson, A. C. 1974. In
Biochemical and Immunological Taxonomy of Animals, ed. C. A. Wright, pp. 397-416. New York: Academic. 490 pp.
71 . Reichlin, M., Hay, M., Levine, L. 1964. Immunochemistry 1 :2 1-30
72. Wilson, A. C., Kaplan. N. 0., Levine. L., Pesce, A., Reichlin, M., Allison, W. S. 1964. Fed. Proc. 23: 1258-66
73. Sarich, V. M .• Wilson, A. C. 1966. Science 1 54:1 563-66
74. Amheim, N. Jr., Wilson, A. C. 1967. J. Dial Chem. 242:3951-56
75. Cocks. G. T . • Wilson, A. C. 1969. Science 164:1 88-89
76. Prager, E. M., Wilson, A. C. 197 1 . J. Dial Chem. 246:5978-89
77. Champion, A. B., Soderberg, K. L., Wilson, A. C., Ambler, R. P. 1975. J. Mol. Evol. 5:291-305
78. Jolles, J., Schoentgen, F., Jolles, P., Prager, E. M., Wilson, A. C. 1976. J. Mol. Evol. 8 :59-78
79. Wallace, D. G., Boulter, D. 1976. Phytochemistry 15 : 1 37-41
80. Welling, G. W., Groen, G., Beintema, 1. J., Emmens, M., Schroder, F. P. 1976. Immunochemistry 1 3:653-58
8 1 . Nei, M. 1977. J. Mol Evol. In press 82. Brown, J. R. 1976. Fed. Proc. 35:
2 141-44 83. Wallace, D. G., Maxson, L. R., Wilson,
A. C. 197 1 . Proc. Natl. Acad. Sci. USA 68:3 127-29
84. Gorman, G. C., Wilson, A. C., Nakanishi, M. 197 1 . Syst. Zool. 20: 167-85
85. Wallace, D. G., Wilson, A. C. 1972. J. Mol. Evol. 2:72-86
86. Wallace, D. G., King, M.-C., Wilson, A. C. 1973. Syst. Zool. 22: 1-13
87. Maxson, L. R., Wilson, A. C. 1975. Syst. ZooL 24: 1-15
88. Bisbee, C. A., Baker, M. A., Wilson, A. C., Hadji-Azimi, I., Fischberg, M. 1977. Science 195:785-86
89. King, M.-C., Wilson, A. C. 1975. Science 1 88: 107-16
90. Selander, R. K., Johnson, W. E. 1973. Ann. Rev. Ecol. Syst. 4:75-9 1
9 1 . Ayala, F. J. 1975. Evol. Dial. 8: 1-78 92. Avise, J. C. 1976. See Ref. 24, pp.
106-22 93. Case, S. M., Haneline, P. G., Smith, M.
F. 1975. Syst. Zool. 24:281-95 94. Sarich, V. M. 1977. Nature 265:24-28 95. Carson, H. L. 1976. Nature 259:395-96 96. Wilson, J. T. 1963. Sci. Am. 208(4):86-
100 97. Britten, R. J., Kohne, D. E. 1968.
Science 16 1 :529-40 98. Kohne, D. E. 1970. Q. Rev. Biophys.
33:1-48 99. Kohne, D. E., Chiscon, J. A., Hoyer, B.
H. 1972. J. Hum. Evol. 1 :627-44 100. Hoyer, B. H., van de Velde, N. W.,
Goodman, M., Roberts, R. B. 1972. J. Hum. Evol. 1 :645-50
101 . Benveniste, R. E., Todaro, G. J. 1974. Proc. Natl Acad Sci USA 71 :45 1 3- 1 g
102. Benveniste, R. E., Todaro, G. J. 1 974. Nature 252:456-59
103. Benveniste, R. E., Todaro, G. J. 1975. Proc. Nat!. Acad. Sci. USA 72:4090-94
104. Benveniste, R. E., Todaro, G. J. 1976. Nature 261 : 101-8
105. Wilson, A. C., Maxson, L. R., Sarich, V. M. 1974. Proc. Natl. Acad. Sci. USA 71 :2843-47
106. Sarich, V. M., Cronin, J. 1977. See Ref. 2 1 , pp. 139-67
107. Simons, E. L. 1964. Sci. Am. 2 1 1 (1): 50-62
108. Simons, E. L. 1967. Sci. Am. 2 17(6): 28-35
109. Pilbeam, D. 1970. The Evolution of Man. New York: Funk & Wagnalls. 216 pp.
1 10. Buettner-Janusch, J. 1969. Trans. NY Acad. Sci. 3 1 : 1 28-38
1 1 1 . Simons, E. L. 1969. Ann. NY Acad. Sci. 167(1):3 19-3 1
1 12. Leakey, L. S. B. 1970. Proc. Natl. Acad. Sci. USA 67:746-48
1 1 3. Read, D. W., Lestrel, P. E. 1970. Science 168:578-80
1 14. Uzzell, T., Corbin, K. W. 197 1 . Science 1 72: 1089-96
1 1 5. Lovejoy, C. 0., Burstein, A. H., Heiple, K. G. 1972. Science 176:803-5
1 16. Read, D. W. 1975. Syst. Zool. 24: 209-2 1
1 1 7. Mayr, E. 1970. Populations, Species and Evolution. Cambridge, Mass: Harvard Univ. Press. 453 pp.
Ann
u. R
ev. B
ioch
em. 1
977.
46:5
73-6
39. D
ownl
oade
d fr
om w
ww
.ann
ualr
evie
ws.
org
by U
nive
rsid
ade
de S
ao P
aulo
(U
SP)
on 1
0/07
/13.
For
per
sona
l use
onl
y.
BIOCHEMICAL EVOLUTION 635
1 1 8. Goodman, M. 1961. Hum. Bioi. 33: 1 3 1-62
1 19. Goodman, M. 1972. Hum. BioI. 34: 104-50
1 20. Goodman, M. 1963. Hum. Bioi. 35: 377--424
1 2 1 . Williams, C. A. 1964. In Evolutionary and Genetic Biology of Primates, ed. J. Buettner-Janusch, 2:25-74. New York: Academic. 330 pp.
1 22. Sarich, V. M., Wilson, A. C. 1967. Proc. Nat/. A cad. Sci. USA 58:142-48
123. Sarich, V. M., Wilson, A. C. 1967. Science 158 : 1200-3
1 24. Washburn, S. 1967. Proc. R. Anthropol. Inst., pp. 2 1-27
125. Johanson, D. C., Taieb, M. 1976. Nature 260:293-97
126. Simons, E. L. 1972. Primate Evolution. New York: Macmillan. 322 pp.
1 27. Andrews, P. 1974. Nature 249 : 1 88-90 1 28. McHenry, H. M. 1975. Science 190:
425-3 1 129. Fleagle, J. G., Simons, E. L., Conroy,
G. C. 1975. Science 1 89:1 35-37 1 30. Conroy, G. C. 1976. Nature 262:
684-86 1 3 1 . Pilbeam, D. 1968. Nature 219 : 1 335-38 1 32. Pilbeam, D. R. 1969. Bull. Peabody Mu
seum Nat. Hist. 3 1 : 1-185 1 33. Walker, A. C., Andrews, P. 1973. Na
ture 244:3 1 3-14 1 34. Von Koenigswald, G. H. R. 1969. In
Fossil Vertebrates of Africa, ed. L. S . B. Leakey, 1 :39-5 1 . New York: Academic. 102 pp.
1 35. Goodman, M., Barnabas, J., Matsuda, G., Moore, G. W. 197 1 . Nature 233: 604-1 3
1 36. Goodman, M. 1974. Ann. Rev. Anthropol. 3:203-28
1 37. Goodman, M., Moore, G. W., Barnabas, J., Matsuda, G. 1974. 1. MoL EvoL 3 : 1-48
138. Goodman, M., Moore, G. W., Matsuda, G. 1975. Nature 253:603-8
1 39. Langley, C. H., Fitch, W. M. 1 974. 1. Mol. Evol. 3 : 1 6 1-77
140. Tashian, R. E., Goodman, M., Ferrell, R. E., Tanis, R. J. 1977. See Ref. 2 1 , pp. 201-19
141 . Wilson, A. C., Sarich, V. M. 1969. Proc. Natl. Acad. Sci. USA 63:1088-93
142. Sarich, V. M., Wilson, A. C. 1973. Science 179: 1 144--47
143. Sarich, V. M. 1973. In Yearbook of Physical Anthropology, ed. J. BuettnerJanusch, 1 7:98- 1 1 2. Washington DC: Am. Assoc. Phys. Anthropol.
144. Wooding, G. L., Doolittle, R. F. 1972. J. Hum. Evo/. 1 :553-63
145. Laird, C. D., McConaughy, B. L., McCarthy, B. J. 1969. Nature 224: 149-54
146. Hood, L. E., Wilson, J. H., Wood, W. B. 1975. Molecular Biology of Eukaryotic Cells. Menlo Park, Calif: Benjamin. 343 pp.
147. Rice, N. R. 1 972. See Ref. 23, pp. 44-79 148. Anderson, S., Jones, J. K. 1967. Recent
Mammals of the World. New York: Ronald. 453 pp.
149. Michaux, J. 1971. C. R. Acad. Sci. Ser. D 273 :314-17
1 50. Welling, G. W. , Leijenaar-Van den Berg, G., Van Dijk, B., Van den Berg, A., Groen, G., Gaastra, W., Emmens, M., Beintema, 1. 1. 1975. Biosystems 6:239--45
1 5 1 . White, T. J., Mross, G. A., Osserman, E. F., Wilson, A. C. 1977. Biochemistry 16:1 730-36
1 52. Romero-Herrera, A. E., Lehmann, H., Joysey, K. A., Friday, A. E. 1973. Nature 246:389-95
1 53. Lehmann, H., Romero-Herrera, A. E. 1974. Ann. NY Acad. Sci. 241 :380-91
1 54. Carlson, S. S., Mross, G. A., Wilson, A. c., Mead, R. T., Wolin, L. D., Bowers, S. F., Foley, N. T., Muijsers, A. 0., Margoliash, E. 1977. Biochemistry 16: 1737-42
1 55. Goodman, M. 1973. Symp. Zool. Soc. London 33:339-75
1 56. Bonner, J. T. 1965. Size and Cycle; An Essay on the Structure of Biology. Princeton, NJ: Princeton Univ. Press. 2 1 9 pp.
1 57. Romer, A. S. 1962. The Vertebrate Body. Philadelphia: Saunders. 643 pp.
158. Sarich, V. M. 1972. Biochem. Genet. 7:205-1 2
1 59. Hori, H. 1975. 1. Mol. Evo!. 7:75-86 1 60. Dickerson, R. E., Timkovich, R. 1975.
The Enzymes 1 1 :397-547 161 . Molisch, H. 1938. The Longevity of
Plants. Lancaster, Pa: Science. 226 pp. 1 62. Boulter, D. 1974. Curro Adv. Plant Sci.
8:1-16 163 . Prager, E. M., Fowler, D. P. , Wilson,
A. C. 1976. Evolution 30:637--49 1 64. Baltz, R. H., Bingham, P. M., Drake, J.
W. 1976. Proc. Natl. Acad. Sci. USA 73: 1269-73
165. Arnheim, N. Jr., Steller, R. 1970. Arch. Biochem. Biophys. 141 :656-61
166. Canfield, R. E., Kammerman, S., Sobel, J. H., Morgan, F. J. 197 1 . Nature New Bio!. 232: 16-18
167. Morgan, F. J., Arnheim, N. Je. 1974. See Ref. 2 1 3. pp. 8 1-88
1 68. Prager, E. M., Brush, A. H., Nolan, R.
Ann
u. R
ev. B
ioch
em. 1
977.
46:5
73-6
39. D
ownl
oade
d fr
om w
ww
.ann
ualr
evie
ws.
org
by U
nive
rsid
ade
de S
ao P
aulo
(U
SP)
on 1
0/07
/13.
For
per
sona
l use
onl
y.

636 WILSON, CARLSON & WHITE
A., Nakanishi, M., Wilson, A. C. 1974. J. Mol. Evol. 3 :243-62
1 69. Prager, E. M., Wilson, A. C. 1 975. Proc. Natl. A cad. Sci. USA 72:200-4
1 70. Penny, D. 1974. J. Mol. Evol. 3: 1 79-88 1 7 1 . Holmquist, R., Jukes, T. H. 1 975. J.
Mol. Evol. 4:377-8 1 1 72. Jukes, T. H., Holmquist, R. 1 972.
Science 177:530-32 173. Hennig, B. 1 975. Eur. J. Biochem.
55:1 67-83 174. Smith, L. F. 1966. Am. J. Med. 40:
662-66 1 75. Blundell, T. L., Wood, S. P. 1 975. Na
ture 257: 1 97-203 1 76. Ramshaw, J. A. M., Richardson, D. L.,
Meat yard, B. T., Brown, R. H., Richardson, M., Thompson, E. W., Boulter, D. 1 972. New Phytol. 7 1 :773-79
1 77. Boulter, D., Ramshaw, J. A. M., Thompson, E. W., Richardson, M., Brown, R. H. 1972. Proc. R. Soc. London Ser. B 1 8 1 :441-45
1 78. Sporne, K. R. 1 975. The Morphology oj Angiosperms. New York: St. Martin's Press. 207 pp.
179. Cronquist, A. 1976. Britfonia 28:1-27 1 80. Meeuse, A. D. J. 1967. Acta Bot. Neerl.
1 6:33-41 1 8 1 . Ramshaw, J. A. M., Peacock, D., Meat
yard, B. T., Boulter, D. 1 974. Phytochemistry 1 3:2783-89
1 82. Boulter, D. 1975. Colloq. Int. CNRS 235:37 1-77
1 83. Beck, C. B., ed. 1976. Origin and Early Evolution of Angiosperms. New York: Columbia Univ. Press. 342 pp.
1 84. Hughes, N. F. 1976. Palaeobiology of Angiosperm Origins. New York: Cambridge Univ. Press. 242 pp.
1 85. Bakker, R. T. 1 975. Sci. Am. 232(4): 58-78
1 86. Osmolska, H. 1976. Nature 262:683-84 1 87. Ostrom, J. H. 1 976. Bioi. J. Linnean
Soc. 8:9 1-182 1 88. Hartley, B. 1974. See Ref. 4, pp. 1 5 1-82 1 89. Hill, R. L., Brew, K. 1 975. In Advances
in Enzymology, ed. A. Meister, 43:4 1 1-90. New York: Wiley. 627 pp.
1 90. Warme, P. K., Momany, F. A., Kimball, S. V., Tuttle, R. W., Scheraga, H. A. 1 974. Biochemistry 1 3 :768-82
1 9 1 . Hooper, K. E., McKenzie, H. A. 1 974. Mol. Cell. Biochem. 3:93-108
1 92. Dickerson, R. E., Geis, I. 1 969. The Structure and Action of Proteins. London: Benjamin. 1 20 pp.
1 93. Reig, O. A. 1967. Science 1 57:565-68 1 94. Bern, H. A. 1 975. Am. Zool. 1 5 :937-48 1 95. Goodman, M. 1976. See Ref. 24, pp.
14 1-59
196. Duffy, L. K., Genaux, C. T., Stratton, L. P. 1976. Biochem. Genet. 14:809-2 1
197. Gilman, J. G. 1976. Biochem. J. 1 59: 43-53
198. Margoliash, E., Ferguson-Miller, S., Kang, C. H., Brautigan, D. L. 1976. Fed. Proc. 35:2124--30
1 99. Ohta, T., Kimura, M. 1 97 1 . J. Mol. Evol. 1 : 1 8-25
200. Anfinsen, C. B. 1 959. The Molecular Basis of Evolution. New York: Wiley. 228 pp.
201 . Ohno, S. 1970. Evolution by Gene Duplication. New York: Springer-Verlag. 1 60 pp.
202. Zuckerkandl, E. 1 975. J. Mol. Evol. 7: 1-58
203. Zuckerkandl, E. 1976. J. Mol. Evol. 7 : 167-84
204. Tager, H. S., Steiner, D. F. 1 974. Ann. Rev. Biochem. 43:509-38
205. Busse, W.-D., Carpenter, F. H. 1 976. Biochemistry 1 5 : 1 649-57
206. Shineberg, B. 1974. J. Bacterial. 1 19: 500-7
207. Langridge, J. 1974. Aust. J. Bioi. Sci. 27:32 1-30
208. Yanofsky, C. 197 1 . J. Am. Med. Assoc. 2 1 8: 1026-35
209. Gitlin, D., Gitlin, J. D. 1 975. In The Plasma Proteins, ed. F. W. Putman, 2:321-74. New York: Academic. 436 pp.
2 1 0. Peters, T. 1975. See Ref. 209, 1 : 1 33-8 1 2 1 1 . Putman, F. W., ed. 1 975. The Plasma
Proteins, Vols. 1, 2. New York: Academic. 48 1 pp., 436 pp.
2 1 2. Bauer, K. 1 974. Humangenetik 2 1 : 1 79-92
2 1 3. Osserman, E. F., Canfield, R. E., Beychok, S. eds. 1 974. Lysozyme. New York: Academic. 641 pp.
2 1 4. Prieur, D. J., Olson, H. M., Young, D. M. 1 974. Am. J. Pathol. 77:283-98
2 1 5. O'Brien, S. J. 1973. Nature 242:52-54 2 1 6. Kimura, M. 1 968. Nature 2 1 7:624--26 2 1 7. Kimura, M. 1969. Proc. Natl. Acad. Sci.
USA 63: 1 1 8 1-88 2 1 8. King, J. L., Jukes, T. H. 1969. Science
1 64:788-98 2 1 9. Richmond, R. C. 1970. Nature 225:
1025-28 220. Clarke, B. 1 970. Nature 228: 1 59-60 22 1 . Clarke, B. 1970. Science 1 68 : 1009- 1 1 222. Crow, J. F. 1976. Fed. Proc. 35:2083-86 223. King, J. L. 1 976. Fed. Proc. 35:2087-9 1 224. Selander, R. K. 1 976. See Ref. 24, pp.
2 1-45 225. Milkman, R. 1976. Trends Biochem.
Sci. 1 : 1 52-54 226. Kimura, M. 1976. Trends Biochem. Sci.
1 : 1 52-54
Ann
u. R
ev. B
ioch
em. 1
977.
46:5
73-6
39. D
ownl
oade
d fr
om w
ww
.ann
ualr
evie
ws.
org
by U
nive
rsid
ade
de S
ao P
aulo
(U
SP)
on 1
0/07
/13.
For
per
sona
l use
onl
y.

BIOCHEMICAL EVOLUTION 637
227. Kimura, M., Ohta, T. 197 1 . J. Mol. Evol. 1 : 1-\7
228. Van Va1en, L. 1974. J. Mol. Evol. 3:89-101
229. Ohta, T. 1973. Nature 246:96-98 230. Ohta, T. 1974. Nature 252:35 1-54 2 3 1 . Fitch, W. M., Markowitz, E. 1 970. Bio
chem. Genet. 4:579-93 232. Amheim, N. Jr., Taylor, C. E. 1969.
Nature 223:900-3 233. Perutz, M. F., Lehmann, H. 1 968. Na
ture 2 1 9:902-9 234. Byers, V. S., Lambeth, D., Lardy, H.
A., Margoliash, E. 1 97 1 . Fed. Proc. 30: 1286 (Abstr.)
235. Smith, L., Nava, M. E., Margoliash, E. 1 973. In Oxidases and Related Redox Systems, ed. T. E. King, H. S. Mason, M. Morrison, 2:629-47. Baltimore: Univ. Park Press. 883 pp.
236. Yamanaka, T., Okunuki, K. 1964. J. BioI. Chem. 239: 1 8 1 3-17
237. Yamanaka, T. 1 967. Nature 2 1 3 : 1 1 83-86
238. Riggs, A. 1976. Fed. Proc. 35:2 1 1 5- 1 8 239. Kimura, M . , Ohta, T . 1 97 1 . Nature
229:467-69 240. Nei, M., Tateno, Y. 1975. Proc. Natl.
Acad. Sci. USA 72:2758-60 241 . Kimura, M., Ohta, T. 1975. Proc. Natl.
Acad. Sci. USA 62:2761-64 242. Harris, H. 1976. Fed. Proc. 34:2079-82 243. Johnson, G. B. 1976. See Ref. 24, pp.
46-59 244. Valentine, J. W. 1976. See Ref. 24, pp.
78-94 245. Soule, M. 1976. See Ref. 24, pp. 60-77 246. Nei, M., Chakraborty, R., Fuerst, P. A.
1 976. Proc. Natl. Acad. Sci. USA 73:4164-68
247. Zuckerkandl, E. 1976. J. Mol. Evol. 7:269-3 12
248. Wilson, A. C. 1 975. Stadler Genet. Symp. 7:1 17-34
249. Ho, C. Y-K., Prager, E. M., Wilson, A. E., Osuga, D. T., Feeney, R. E. 1 976. J. Mol. EvoL 8:27 1-82
250. Estes, R. 1975. Herpetelogica 3 1 : 263-78
25 1 . Stanier, R. Y, Wachter, D., Gasser, C., Wilson, A. C. 1970. J. Bacteriol. 102:351-62
252. Ambler, R. P., Meyer, T. E., Kamen, M. D. 1976. Proc. Natl. Acad. Sci. USA 73:472-75
253. Borden, D., Whitt, G. S., Nanney, D. L. 1973. J. ProtozooL 20:693-700
254. Gould, S. J., Woodruff, D. S., Martin, J. P. 1974. Syst. Zool. 23:5 1 8-35
255. Grassle, J. P., Grassle, J. F. 1 976. Science 1 92:567-69
256. Mao, S., Dessauer, H. C. 1 97 1 . Compo Biochem. Physiol. 40A:669-80
256a. Cronin, J. E., Sarich, V. M. 1976. Nature 260:700-2
257. Simpson, G. G. 1963. In Classification and Human Evolution, ed. S. L. Washburn, pp. 1-3 1 . Chicago: Aldine, 371 pp.
258. Schopf, J. W. 1974. Evol. BioI. 7: 1-43 259. Mayr, E. 1 976. Evolution and Diversity
of Life. Cambridge, Mass: Harvard Univ. Press. 721 pp.
260. Wada, K., Hase, T., Matsubara, H. 1 975. J. Biochem. 78:637-39
261 . Aitken, A. 1976. Nature 263:793-95 262. Stanier, R. Y., Kunisawa, R., Mandel,
M., Cohen-Bazire, G. 1971 . Bacteriol. Rev. 35 : 17 1-205
263. Schopf, T. J. M., Raup, D. M., Gould, S. J., Simberloff, D. S. 1 975. Paleobiology 1 :63-70
264. Sneath, P. H. A., Sokal, R. R. 1973. Numerical Taxonomy. San Francisco: Freeman. 573 pp.
264a. Jacob, F., Monod, J. 1961 . J. Mol. BioI. 3:3 1 8-56
265. Wallace, B. 1963. Can. J. Genet. Cytol. 5:239-53
266. Zuckerkandl, E. 1963. See Ref. 257, p. 243
267. Lerner, S. A., Wu, T. T., Lin, E. C. C. 1964. Science 146: 1 3 1 3-15
268. Britten, R. J . , Davidson, E. H. 1969. Science 165:349-57
269. Stebbins, G. L. 1969. The Basis of Progressive Evolution. Chapel Hill: Univ. North Carolina Press. 1 50 pp.
270. Ohno, S. 1972. J. Hum. Evol. 1 :65 1-62 27 1 . Wallace, B., Kass, T. 1 974. Genetics
77:541-58 272. Cocks, G. T., Aguilar, J., Lin, E. C. C.
1 974. J. Bacteriol. 1 1 8:83-88 273. Mortlock, R. P. 1 976. Adv. Microbiol.
Physiol. 13 :2-55 274. Ornston, L. N., Parke, D. 1976. Trans.
Biochem. Soc. 4:468-73 275. Dagley, S. 1975. Essays Biochem.
1 1 :81-138 276. Wu, T. T. 1976. J. Gen. Microbiol.
94:246-56 277. Adams, J., Hansche, P. E. 1974. Genet
ics 76:327-38 278. Kemper, J. 1 974. J. Bacteriol. 1 20:
1 1 76-85 279. Hall, B., Hartl, D. L. 1975. Genetics
8 1 :427-58 280. Wu, T. T., Lin, E. C. c., Tanaka, S.
1968. J. Bacteriol. 96:447-56 28 1 . Rigby, P. W. J., Burleigh, B. D., Hart
ley, B. S. 1974. Nature 25 1 :200-4 282. Clarke, P. H. 1974. See Ref. 4, pp. 1 83-
2 1 7
Ann
u. R
ev. B
ioch
em. 1
977.
46:5
73-6
39. D
ownl
oade
d fr
om w
ww
.ann
ualr
evie
ws.
org
by U
nive
rsid
ade
de S
ao P
aulo
(U
SP)
on 1
0/07
/13.
For
per
sona
l use
onl
y.

638 WILSON, CARLSON & WHITE
282a. Janis, C. 1 976. Evolution 30:757-74 283. Hungate, R. E. 1 966. The Rumen and
its Microbes. New York: Academic. 533 pp.
284. Brown, R. E. 1969. Fed. Proc. 28: 2 16-1 7
285. Larson, B . L., Smith, V . R . 1 974. Lactation, Vo1s. 1-3. New York: Academic. 5 16 pp., 458 pp., 425 pp.
286. Ballard, F. J., Hanson, R. W., Kronfe1d, D. S. 1969. Fed. Proc. 28:2 1 8-3 1
287. Barnard, E. A. 1 969. Nature 22 1 : 340-44
288. Beintema, J. J., Scheffer, A. J. , Van Dijk, H., Welling, G. W., Zwiers, H. 1973. Nature New Biol 241 :76-78
289. Baldwin, E. 1 948. An Introduction to Comparative Biochemistry. Cambridge, England: Cambridge Univ. Press. 1 64 pp. 3rd ed.
290. Campbell, J. W., ed. 1970. Comparative Biochemistry of Nitrogen Metabolism, Vol. 2. London: Academic. 9 1 6 pp.
29 1 . Ratner, S. 1 973. Adv. Enzymol. 39: 1 -90 292. Brown, G. W. 1966. Arch. Biochem.
Biophys. 1 14: 1 84-94 293. Vorhaben, 1. E., Campbell, 1. W. 1972.
J. BioL Chem. 247:2763-67 294. Matsuda, Y., Kuroda, Y., Kobayashi,
K., Katunuma, N. 1 973. J. Biochem. 73:29 1-98
295. Ba1insky, J. B., Chema1y, S. M., Currin, A. E., Lee, A. R., Thompson, R. L., van der Westhuizen, D. R. 1976. Compo Biochem. Physiol. 54B:549-55
296. Wilson, A. C. 1 976. See Ref. 24, pp. 225-34
297. Church, R. B., Brown, I. R. 1 972. Results Probl. Cell Differen. 3 : 1 1-24
298. Ohno, S. 1969. In Heterospecific Genome Interaction, ed. V. Defendi, pp. 1 37-50. Philadelphia: Wistar Inst. 1 80 pp.
299. Whitt, G. S., Childers, W. F., Cho, P. L. 1 973. J. Hered. 64:55-6 1
300. Ingram, V. 1963. The Hemoglobins in Genetics and Evolution. New York: Columbia Univ. Press. 1 65 pp.
301 . Markert, C. L., ed. 1 975. !sozymes, Vols. 1-4. New York: Academic. 856 pp., 890 pp., 1034 pp., 965 pp.
302. Masters, C., Holmes, R. 1975. Haemoglobin, !soenzymes and Tissue Differentiation. Amsterdam: North-Holland. 308 pp.
303. Lim, S. T., Kay, R. M., Bailey, G. S. 1 975. J. Bioi. Chem. 250: 1 790-1800
304. Lim, S. T., Bailey, G. S. 1977. Biochem. Genet. In press
305. Lehmann, H., Huntsman, R. G. 1 966. Man s Haemoglobins. Amsterdam: North-Holland. 3 3 1 pp.
306. Eventoff, W., Rossmann, M. G., Taylor, S. S., Torif, H.-J., Meyer, H., Keil, W., Kiltz, H.-H. 1977. Proc. Natl. Acad. Sd USA, Vol. 74. In press
307. Everse, J., Kaplan, N. O. 1973. Adv. Enzymol. 37:63-133
308. Vesell, E. S . , Pool, P. E. 1966. Proc. Natl. Acad. Sci. USA 55:756-62
309. Birnstiel, M., Telford, J., Weinberg, E., Stafford, D. 1 974. Proc. Natl. Acad. Sci. USA 7 1 :2900-4
3 10. Smith, G. P. 1976. Science 1 9 1 : 528-35 3 1 1 . Wilson, A. C., Sarich, V. M., Maxson,
L. R. 1 974. Proc. Natl. Acad. Sci. USA 7 1 :3028-30
3 12. Levin, D. A., Wilson, A. C. 1976. Proc. Natl. Acad. Sci. USA 73:2086-90
3 1 3. Bush, G. L., Case, S. M., Wilson, A. c., Patton, J. L. 1 977. Proc. NatL Acad. Sci. USA, Vol. 74. In press
3 14. Wilson, A. C., Bush, G. L., Case, S. M., King, M.-C. 1975. Proc. Natl. Acad. Sci. USA 72:5061-65
3 1 5. Bahn, E. 1 9 7 1 . Hereditas 67:79-82 3 16. Grant, V. 1 973. Plant Speciation. New
York: Columbia Univ. Press. 435 pp. 3 1 7. White, M. J. D. 1 968. Science 1 59:
1 065-70 3 1 8. Anderson, E. S. 1966. Nature 209:
637-38 3 19. Zhdanov, V. M., Tikhonenko, T. I.
1 974. Adv. Virus Res. 1 9:36 1-93 320. Cohen, S. N. 1976. Nature 263:73 1 -38 321. Reanney, D. 1 976. Bacteriol. Rev.
40:552-90 322. Anderson, E. S. 1968. Ann. Rev. Mi
crobiol. 22: 1 3 1-80 323. Jones, D., Sneath, P. H. A. 1970. Bac
teriol. Rev. 34:40-8 1 324. Bonen, L., Doolittle, W. F. 1 975. Proc.
Natl. Acad. Sci. USA 72:23 1 0-14 325. Bonen, L., Doolittle, W. F. 1 976. Na
ture 261 :669-73 326. Zablen, L. B., Kissil, M. S., Woese, C.
R., Buetow, D. E. 1975. Proc. Natl. Acad. SCI: USA 72:241 8-22
327. Sanderson, K. E. 1 976. Ann. Rev. Microbiol. 30:327-49
328. Novick, R. P. 1969. Bacteriol Rev. 33:2 1 0-35
329. Watanabe, T. 1963. Bacteriol. Rev. 27:87- 1 1 5
330. Clowes, R. C. 1972. Bacteriol. Rev. 36:36 1-405
3 3 1 . Lacey, R. W. 1 975. Bacteriol Rev. 39: 1-32
332. Benveniste, R., Davies, J. 1973. Ann. Rev. Biochem. 42:47 1-506
333. Tanaka, N., Cramer, J. H., Rownd, R. H. 1 976. J. Bacteriol. 1 27:619-36
334. Novick, R. P., Clowes, R. C., Cohen, S.
Ann
u. R
ev. B
ioch
em. 1
977.
46:5
73-6
39. D
ownl
oade
d fr
om w
ww
.ann
ualr
evie
ws.
org
by U
nive
rsid
ade
de S
ao P
aulo
(U
SP)
on 1
0/07
/13.
For
per
sona
l use
onl
y.

BIOCHEMICAL EVOLUTION 639
N., Curtiss, R. III, Datta, N., Falkow, S. 1976. Bacteria!' Rev. 40: 1 68-89
335. Richmond, M. H., Wiedeman, B. 1974. See Ref. 4, pp. 59-85
336. Olsen, R. H., Wright, C. D. 1 976. J. BacteriaL 128 :228-34
337. Guerineau, M., Grandchamp, C., Slonimski, P. P. 1 976. Proc. Natl. Acad. Sci. USA 73:3030-34
338. Hollenberg, C. P., Degelmann, A., Kustermann-Kuhn, B., Royer, H. D. 1976. Proc. Natl. Acad. Sci. USA 73:2072-76
339. Stanfield, S., Helinski, D. R. 1976. Cell 9:333--45
340. Ambler, R. P., Meadway, R. I. 1 969. Nature 222:24-26
341. Richmond, M. H., Sykes, R. B. 1973. Adv. Microbial. Physiol. 9:3 1-88
342. Hedges, R. W., Datta, N., Kontomichalou, P., Smith, J. T. 1974. J. Bacterial 1 1 7:56-62
343. Dale, J. W., Smith, J. T. 1974. J. Bacteriol. 1 19:35 1-56
344. Matthew, M., Harris, A. M., Marsball, M. J., Ross, G. W. 1975. J. Gen. Microbial. 88:169-78
345. Heffron, F., Sublett, R., Hedges, R. W., Jacob, A., Falkow, S. 1975. J. Bacterial. 122:250-56
346. Bobrowski, M. M., Matthew, M., Barth, P. T., Datta, N., Grinter, N. J., Jacob, A. E., Kontomichalou, P., Dale, J. W., Smith, J. T. 1 976. J. Bacterial. 1 25: 149-57
347. Shaw, W. V. 1 97 1 . Ann. NY Acad. Sci. 1 82:234--42
348. Foster, T. J., Shaw, W. V. 1973. Antimicrab. Agents Chemother. 3:99-1 04
349. Sands, L. C., Shaw, W. V. 1973. Antimicrab. Agents Chemother. 3:299-305
350. Benveniste, R., Davies, J. 1 973. Proc. Natl. Acad. Sci. USA 70:2276-80
3 5 1 . Barlow, G. H., Margoliash, E. 1 966. J. Biol Chem. 24 1 : 1473-77
352. Ketner, G., Kelly, T. J. Ir. 1976. Proc. Natl. Acad. Sci. USA 73: 1 102-6
353. Rozenb1att, S., Mulligan, R. C., Gorecki, M., Roberts, B. E., Rich, A. 1976. Proc. Natl. Acad. Sci. USA 73:2747-5 1
354. Cocks, G. T., Wilson, A. C. 1 972. J. Bacteriol. 1 10:793-802
355. Guiso, N., Ullmann, A. 1976. J. Bacterial. 127:69 1-97
356. Glazer, A. N., Apell, G. S., Hixson, C. S., Bryant, D. A., Rimon, S., Brown, D. M. 1976. Proc. Natl. Acad. Sci. USA 73:428-31
357. Evans, M. H. 1 972. Int. Rev. Neurobiol 1 5 :83-166
358. Koostra, A., Bailey, G. S. 1976. FEBS Lett. 68:76-78
359. De Jong, W. W., van der Ouderaa, F. J., Versteeg, M., Groenewoud, G., Van Amelsvoort, 1. M., Bloemendal, H. 1 975. Eur. J. Biochem. 53:237-42
360. De long, W. W., Terwindt, E. C., B1oemenda1, H. 1975. FEBSLett. 58:3 1 0-13
3 6 1 . Jolles, P. 1 975. Mol. Cell Biochem. 7:73-85
362. Ohno, S. 1 976. Cell 7:3 1 5-2 1 363. Bernfeld, P. 1962. In Comparative Bio
chemistry, ed. M. Florkin, H. S. Mason, 3:355-425. New York: Academic. 959 pp.
364. Wilson, A. C., Cahn, R. D., Kaplan, N. O. 1963. Nature 197:33 1-34
365. Fine, I. H., Kaplan, N. 0., Kuftinec, D. 1 963. Biochemistry 2: 1 16-2 1
366. McKenzie, H. A., ed. 197 1 . Milk Proteins, Vols. 1 , 2. New York: Academic. 552 pp., 5 1 9 pp.
367. Prager, E. M., Wilson, A. C., Arnheim, N. 1 974. J. Bioi. Chem. 249:7295-97
368. Kendrew, I. C., Parrish, R. G., Marrack, J. R., Orlans, E. S. 1 954. Nature 174:946-49
369. Lyon, M. F., Hendry, I., Short, R. V. 1 973. J. Endocrinol 53:357
370. Feeney, R. E., Allison, R. G. 1969. Evolutionary Biochemistry of Proteins. New York: Wiley-Interscience. 290 pp.
3 7 1 . Romer, A. S. 1 967. Notes and Comments on Vertebrate Paleontology. Chicago: Univ. Chicago Press. 304 pp.
372. Pilgrim, G. E. 1946. J. Linn. Soc. Zool. 4 1 :272-86
373. Gentry, A. W. 1970. Fossil Vertebrates of Africa 2:243-323
374. Saricb, V. M. 1969. Syst. Zool. 1 8:286-95, 41 6-22
375. Hoffstetter, R. 1 974. J. Hum. Evol. 3:327-50
376. Gingerich, P. D. 1976. Papers on Paleontology 1 5 : 1- 140. Ann Arbor: Univ. Michigan Press
377. Padan, E., Shilo, M. 1973. Bacteriol. Rev. 37:343-70
Ann
u. R
ev. B
ioch
em. 1
977.
46:5
73-6
39. D
ownl
oade
d fr
om w
ww
.ann
ualr
evie
ws.
org
by U
nive
rsid
ade
de S
ao P
aulo
(U
SP)
on 1
0/07
/13.
For
per
sona
l use
onl
y.