Biochemical and Epigenetic Insights into L-2 ... › content › ... · Yusuke Sato6, Seishi...
15
Translational Cancer Mechanisms and Therapy Biochemical and Epigenetic Insights into L-2-Hydroxyglutarate, a Potential Therapeutic Target in Renal Cancer Sandeep Shelar 1 , Eun-Hee Shim 1 , Garrett J. Brinkley 1 , Anirban Kundu 1 , Francesca Carobbio 1 , Tyler Poston 1 , Jubilee Tan 1 , Vishwas Parekh 2 , Daniel Benson 1 , David K. Crossman 3 , Phillip J. Buckhaults 4 , Dinesh Rakheja 5 , Richard Kirkman 1 , Yusuke Sato 6 , Seishi Ogawa 6 , Shilpa Dutta 7 , Sadanandan E. Velu 7 , Ethan Emberley 8 , Alison Pan 8 , Jason Chen 8 , Tony Huang 8 , Devin Absher 9 , Anja Becker 10 , Conrad Kunick 10 , and Sunil Sudarshan 1 Abstract Purpose: Elevation of L-2-hydroxylgutarate (L-2-HG) in renal cell carcinoma (RCC) is due in part to reduced expression of L-2-HG dehydrogenase (L2HGDH). However, the contribution of L-2-HG to renal carcinogenesis and insight into the biochem- istry and targets of this small molecule remains to be elucidated. Experimental Design: Genetic and pharmacologic approaches to modulate L-2-HG levels were assessed for effects on in vitro and in vivo phenotypes. Metabolomics was used to dissect the biochemical mechanisms that promote L-2-HG accumulation in RCC cells. Transcriptomic analysis was utilized to identify relevant targets of L-2-HG. Finally, bioinformatic and metabolomic analyses were used to assess the L-2-HG/L2HGDH axis as a function of patient outcome and cancer progression. Results: L2HGDH suppresses both in vitro cell migration and in vivo tumor growth and these effects are mediated by L2HGDH's catalytic activity. Biochemical studies indicate that glutamine is the predominant carbon source for L-2-HG via the activity of malate dehydrogenase 2 (MDH2). Inhibition of the glutamine-MDH2 axis suppresses in vitro phenotypes in an L-2-HG–dependent manner. Moreover, in vivo growth of RCC cells with basal elevation of L-2-HG is suppressed by gluta- minase inhibition. Transcriptomic and functional analyses demonstrate that the histone demethylase KDM6A is a target of L-2-HG in RCC. Finally, increased L-2-HG levels, L2HGDH copy loss, and lower L2HGDH expression are associated with tumor progression and/or worsened prognosis in patients with RCC. Conclusions: Collectively, our studies provide biochemical and mechanistic insight into the biology of this small molecule and provide new opportunities for treating L-2-HG–driven kidney cancers. Clin Cancer Res; 24(24); 6433–46. Ó2018 AACR. Introduction Cancer-associated mutations in metabolic enzymes have led to the identification of oncometabolites including fumarate, succi- nate, and D-2-hydroxyglutarate (D-2-HG; refs. 1–7). A unifying theme among these oncometabolites is their ability to compet- itively inhibit a-ketoglutarate (a-KG)-dependent dioxygenases (aKGD; refs. 8–15). Members of the aKGDs include the TET (ten eleven translocation) enzymes (TETs 1–3) that hydroxylate 5-methylcytosine (5-mC) to 5-hydroxymethylcytosine (5-hmC), which can promote DNA demethylation (16), the Jumonji family of histone lysine demethylases, and prolyl hydroxylases (PHDs 1–3), which regulate hypoxia-inducible factors 1a and 2a (HIF-1a, HIF-2a). In leukemia, bioinformatic and functional studies indi- cate that a relevant target of D-2-HG is TET2 (12, 17). However, the relevant target(s) of D-2-HG, fumarate, and succinate in other malignancies as well as the contribution to tumorigenesis remains less well characterized. For example, the in vivo efficacy of mutant IDH inhibitors for glioma has yielded conflicting results (18–20). Elevations of the L-enantiomer of 2-HG (L-2-HG) are present in clear cell renal cell carcinoma (ccRCC), the most common his- tology (21, 22). Recent studies have also demonstrated increases of L-2-HG in the setting of hypoxia, mitochondrial dysfunction, and acidic conditions (23–29). Similar to D-2-HG, L-2-HG can competitively inhibit dioxygenases due to structural similarity to a-KG. Correspondingly, increased DNA and/or histone methyl- ation has been found in the setting of raised L-2-HG (28–30). However, the underlying biochemistry, relevant targets, and con- tribution to tumor growth of this small molecule in renal cancer 1 Department of Urology, University of Alabama at Birmingham, Birmingham, Alabama. 2 Department of Pathology, University of Alabama at Birmingham, Birmingham, Alabama. 3 Department of Genetics, University of Alabama at Birmingham, Birmingham, Alabama. 4 South Carolina College of Pharmacy, University of South Carolina, Columbia, South Calorina. 5 Department of Pathol- ogy, University of Texas Southwestern Medical Center, Dallas, Texas. 6 Graduate School of Medicine, University of Tokyo, Japan. 7 Department of Chemistry, University of Alabama at Birmingham, Birmingham, Alabama. 8 Calithera Biosciences, South San Francisco, California. 9 HudsonAlpha Institute for Bio- technology, Huntsville, Alabama. 10 Institut f€ ur Medizinische und Pharmazeu- tische Chemie, Technische Universit€ at Braunschweig, Braunschweig, Germany. Note: Supplementary data for this article are available at Clinical Cancer Research Online (http://clincancerres.aacrjournals.org/). Corresponding Author: Sunil Sudarshan, University of Alabama at Birmingham, WTI 420C, Birmingham, 35294. Phone: 205-934-2898; Fax: 205-934-2954; E-mail: [email protected] doi: 10.1158/1078-0432.CCR-18-1727 Ó2018 American Association for Cancer Research. Clinical Cancer Research www.aacrjournals.org 6433 on July 24, 2020. © 2018 American Association for Cancer Research. clincancerres.aacrjournals.org Downloaded from Published OnlineFirst August 14, 2018; DOI: 10.1158/1078-0432.CCR-18-1727
Transcript of Biochemical and Epigenetic Insights into L-2 ... › content › ... · Yusuke Sato6, Seishi...

Translational Cancer Mechanisms and Therapy
Biochemical and Epigenetic Insights intoL-2-Hydroxyglutarate, a Potential TherapeuticTarget in Renal CancerSandeep Shelar1, Eun-Hee Shim1, Garrett J. Brinkley 1, Anirban Kundu1,Francesca Carobbio1, Tyler Poston1, Jubilee Tan1, Vishwas Parekh2, Daniel Benson1,David K. Crossman3, Phillip J. Buckhaults4, Dinesh Rakheja5, Richard Kirkman1,Yusuke Sato6, Seishi Ogawa6, Shilpa Dutta7, Sadanandan E. Velu7, Ethan Emberley8,Alison Pan8, Jason Chen8, Tony Huang8, Devin Absher9, Anja Becker10,Conrad Kunick10, and Sunil Sudarshan1
Abstract
Purpose: Elevation of L-2-hydroxylgutarate (L-2-HG) in renalcell carcinoma (RCC) is due in part to reduced expression ofL-2-HG dehydrogenase (L2HGDH). However, the contributionof L-2-HG to renal carcinogenesis and insight into the biochem-istry and targets of this small molecule remains to be elucidated.
Experimental Design: Genetic and pharmacologicapproaches to modulate L-2-HG levels were assessed foreffects on in vitro and in vivo phenotypes. Metabolomics wasused to dissect the biochemical mechanisms that promoteL-2-HG accumulation in RCC cells. Transcriptomic analysiswas utilized to identify relevant targets of L-2-HG. Finally,bioinformatic and metabolomic analyses were used toassess the L-2-HG/L2HGDH axis as a function of patientoutcome and cancer progression.
Results: L2HGDH suppresses both in vitro cell migrationand in vivo tumor growth and these effects are mediated by
L2HGDH's catalytic activity. Biochemical studies indicate thatglutamine is the predominant carbon source for L-2-HG viathe activity of malate dehydrogenase 2 (MDH2). Inhibition ofthe glutamine-MDH2 axis suppresses in vitro phenotypes in anL-2-HG–dependent manner. Moreover, in vivo growth of RCCcells with basal elevation of L-2-HG is suppressed by gluta-minase inhibition. Transcriptomic and functional analysesdemonstrate that the histone demethylase KDM6A is a targetof L-2-HG in RCC. Finally, increased L-2-HG levels, L2HGDHcopy loss, and lower L2HGDH expression are associated withtumor progression and/or worsened prognosis in patientswith RCC.
Conclusions:Collectively, our studies provide biochemicalandmechanistic insight into the biology of this smallmoleculeand provide new opportunities for treating L-2-HG–drivenkidney cancers. Clin Cancer Res; 24(24); 6433–46. �2018 AACR.
IntroductionCancer-associated mutations inmetabolic enzymes have led to
the identification of oncometabolites including fumarate, succi-nate, and D-2-hydroxyglutarate (D-2-HG; refs. 1–7). A unifying
theme among these oncometabolites is their ability to compet-itively inhibit a-ketoglutarate (a-KG)-dependent dioxygenases(aKGD; refs. 8–15). Members of the aKGDs include the TET (teneleven translocation) enzymes (TETs 1–3) that hydroxylate5-methylcytosine (5-mC) to 5-hydroxymethylcytosine (5-hmC),which can promote DNA demethylation (16), the Jumonji familyof histone lysine demethylases, and prolyl hydroxylases (PHDs1–3),which regulate hypoxia-inducible factors 1a and2a (HIF-1a,HIF-2a). In leukemia, bioinformatic and functional studies indi-cate that a relevant target ofD-2-HG is TET2 (12, 17). However, therelevant target(s) of D-2-HG, fumarate, and succinate in othermalignancies as well as the contribution to tumorigenesis remainsless well characterized. For example, the in vivo efficacy of mutantIDH inhibitors for glioma has yielded conflicting results (18–20).
Elevations of the L-enantiomer of 2-HG (L-2-HG) are present inclear cell renal cell carcinoma (ccRCC), the most common his-tology (21, 22). Recent studies have also demonstrated increasesof L-2-HG in the setting of hypoxia, mitochondrial dysfunction,and acidic conditions (23–29). Similar to D-2-HG, L-2-HG cancompetitively inhibit dioxygenases due to structural similarity toa-KG. Correspondingly, increased DNA and/or histone methyl-ation has been found in the setting of raised L-2-HG (28–30).However, the underlying biochemistry, relevant targets, and con-tribution to tumor growth of this small molecule in renal cancer
1Department of Urology, University of Alabama at Birmingham, Birmingham,Alabama. 2Department of Pathology, University of Alabama at Birmingham,Birmingham, Alabama. 3Department of Genetics, University of Alabama atBirmingham, Birmingham, Alabama. 4South Carolina College of Pharmacy,University of South Carolina, Columbia, South Calorina. 5Department of Pathol-ogy, University of Texas Southwestern Medical Center, Dallas, Texas. 6GraduateSchool of Medicine, University of Tokyo, Japan. 7Department of Chemistry,University of Alabama at Birmingham, Birmingham, Alabama. 8CalitheraBiosciences, South San Francisco, California. 9HudsonAlpha Institute for Bio-technology, Huntsville, Alabama. 10Institut f€ur Medizinische und Pharmazeu-tische Chemie, Technische Universit€at Braunschweig, Braunschweig, Germany.
Note: Supplementary data for this article are available at Clinical CancerResearch Online (http://clincancerres.aacrjournals.org/).
Corresponding Author: Sunil Sudarshan, University of Alabama at Birmingham,WTI 420C, Birmingham, 35294. Phone: 205-934-2898; Fax: 205-934-2954;E-mail: [email protected]
doi: 10.1158/1078-0432.CCR-18-1727
�2018 American Association for Cancer Research.
ClinicalCancerResearch
www.aacrjournals.org 6433
on July 24, 2020. © 2018 American Association for Cancer Research. clincancerres.aacrjournals.org Downloaded from
Published OnlineFirst August 14, 2018; DOI: 10.1158/1078-0432.CCR-18-1727

remain poorly understood. Elevations of L-2-HG in RCC aredue to reduced expression of L-2-HG dehydrogenase(L2HGDH). L2HGDH is considered an enzyme of metaboliterepair to counter the "off-target" activity of intermediary metab-olism enzymes including lactate dehydrogenase (LDH) andmalate dehydrogenases (MDH), particularly under acidic con-ditions (23, 26, 31–33). Inheritance of biallelic mutantL2HGDH results in a rare inborn error of metabolism referredto as L-2-HG aciduria that has been linked with brain tumors(34–39). The concept that small molecules can promote malig-nancy has now presented novel therapeutic opportunities. Inthe case of IDH gain-of-function mutations in leukemia, whichresult in raised D-2-HG levels, specific inhibitors that selectivelyinhibit mutant IDH (as opposed to wild-type IDH) are nowapproved for use. On the basis of these data, we determined thecontribution of L-2-HG to the malignant phenotype of RCC.We also outline the biochemical axis that promotes L-2-HGaccumulation as well as epigenetic targets. Collectively, ourdata demonstrate that L-2-HG promotes tumor growth in RCC,and therefore, identifies potential strategies for RCCs withraised levels of this small molecule.
Materials and MethodsCell culture
Renal cell lines were acquired from ATCC except RXF-393(NCI) and OSRC-2 (Riken). Cells acquired from ATCC, NCI, andRiken were characterized via short tandem repeat profiling. Ascells were passaged for less than 3 months after resuscitation andwere periodically screened for Mycoplasma using a PCR-basedassay, no further authentication was performed. HEK293T andHK-2 cells weremaintainedwith DMEM containing 10%FBS andpenicillin/streptomycin. A498 cells were cultured in MEM con-taining 10%FBS and penicillin/streptomycin. RXF-393,OS-RC-2,and769-P cellsweremaintained inRPMI containing 10%FBSandpenicillin/streptomycin. For L-2-HG isotopologue analysis, cellswere incubated in media without L-glutamine for 4 hours andthen incubated for 6 hours in media containing 2 mmol/LL-Glutamine-13C5 (Sigma).
Glutaminase/MDH inhibitors and L-2-HG ester treatmentsGlutaminase inhibitor (CB-839, Calithera Biosciences) was
dissolved in DMSO and cells were treated with CB-839(1 mmol/L) for 48–72 hours with replacement of CB-839 forevery 24 hours. MDH inhibitor, a derivative of benzylpaullones(4k), was dissolved inDMSOand cells were treatedwith 1mmol/Lfor 48 hours (40). L-2-HG ester was generated as reported previ-ously (21). For effects on phenotypes in HK-2 renal epithelialcells, cells were continuously cultured in the indicated concen-tration of ester for 7–10 days followed by wound-healing assays.
Lentivirus-based generation of stable cell linesL2HGDH and L2HGDH A241G cDNA was inserted into
LV2606 (kindly provided by John Kappes, University of Alabamaat Birmingham, Birmingham, AL). For L2HGDH or MDH knock-down, the following shRNAs in pLKO.1 vector (Sigma)were used:shL2HGDH (sh3, TRCN0000064323), shL2HGD (sh4,TRCN0000064324), and shL2HGDH (sh5, TRCN0000064325),shMDH1 (TRCN0000275199), shMDH1 (TRCN0000028484),and shMDH2 (TRCN0000028485). For EZH2 knockdown,shRNA lentiviral vectors for human EZH2 gene (EZH2 shRNA)and control shRNA were kindly provided by Soory Varambally(UAB, University of Alabama at Birmingham, Birmingham,AL). To generate stable cell lines, lentiviral plasmids weretransfected with packaging vectors into HEK293T cells usingcalcium phosphate method. Supernatants from transfectedHEK293T cells were collected after 72 hours, filtered, andapplied to cells. Viral transduced cells were selected in culturemedium containing puromycin. All transduced cells representpolyclonal populations.
siRNA-mediated knockdown of KDM6AA498 cells stably expressing L2HGDH were treated with
30 nmol/L of control siRNA (#D-001800-01), KDM6A siRNA#1(#J-014140-10), and KDM6A siRNA#2 (# J-014140-12)ON-TARGET plus siRNA (Dharmacon) using LipofectamineRNAiMAX (Invitrogen, catalog no. 13778030) transfection reagentfor 72 hours. Cells were again treated with 30 nmol/L of controlsiRNA, KDM6A siRNA#1, and KDM6A siRNA#2 for 48 hours.
2-HG measurements2-HG enantiomer analysis (i.e., D- and L-2-HG quantification)
of samples was performed as described previously (21). For total2-HG (D-2-HGþ L-2-HG) measurement of samples from in vitrostudies, cell pellets were washed in 1� cold PBS three times.Metabolites were extracted with 10% cold trichloroacetic acid(TCA) and the precipitate was removed by centrifugation. TCA inthe supernatant was removed by vortexing with 4 volumes of 1,1,2-trichlorotrifluoroethane (FREON)-trioctylamine (Sigma) mixtureand the upper aqueous layer was collected for analysis after centri-fugation. Samples were analyzed by ion chromatography coupledwith negative electrospray mass spectrometry (RFIC-MS; Dionex)and 2-HGwas determined by selected ionmonitoring (SIM 147.1).2-HG in cell extracts was quantified by using a calibration curve of2-HG and normalized to protein content.
Animal studiesImmunodeficient nude (Nu/Nu) mice were obtained from
Jackson Laboratory or Charles River and fed with standardchow diet. Cells were mixed with equal volume of MatrigelMatrix (Corning, #354230) and injected (RXF-393 ¼ 1 � 106,
Translational Relevance
The small-molecule L-2-hydroxyglutarate (L-2-HG) is ele-vated in clear cell renal cell carcinoma, the most commonhistology of kidney cancer, due to loss of the enzyme L-2-HGdehydrogenase (L2HGDH). Either pharmacologic or geneticapproaches to raise intracellular levels of L-2-HG promotein vitro tumor phenotypes in nontransformed renal epithelialcells. In turn, reexpression of L2HGDH in kidney cancer cellsreduced in vivo tumor growth. Biochemical studies indicatethat the glutamine/malate dehydrogenase 2 (MDH2) axispromotes L-2-HG elevation. Transcriptomic and functionalanalyses demonstrate that the histone demethylase KDM6A isa target of L-2-HG inRCC. In addition, our studies indicate thatalterations of the L-2-HG/L2HGDHare associatedwithpatientoutcomes and tumor progression. Collectively, our data dem-onstrate that L-2-HG is a bona fide oncometabolite in kidneycancer thereby providing opportunities for novel approachesto this malignancy.
Shelar et al.
Clin Cancer Res; 24(24) December 15, 2018 Clinical Cancer Research6434
on July 24, 2020. © 2018 American Association for Cancer Research. clincancerres.aacrjournals.org Downloaded from
Published OnlineFirst August 14, 2018; DOI: 10.1158/1078-0432.CCR-18-1727
A498 ¼ 2 � 106 and OSRC-2 ¼ 1.5 � 106 cells/injection)subcutaneously in the flanks of 5–6 weeks-old nude (Nu/Nu)mice. Caliper measurements of growing tumors were taken peri-odically and the tumor volume was calculated. For glutaminaseinhibition study, Caki-1 human clear cell renal cell carcinomacells weremixed 1:1withMatrigel and implanted subcutaneouslyin the flanks into female scid/bg mice (Charles River; 2.5 � 106
cells/mouse). On day 16 postimplant, mice were randomized tothe following two groups (n ¼ 10 mice per group): (i) vehicle(25% hydroxyl-propyl-b-cyclodextrin) orally twice daily bygavage; or (ii) CB-839 at 200 mg/kg orally twice daily by gavage.For all in vivo studies, tumors were measured with calipers andtumor volume was calculated using the formula ¼ (a � b2/2)where "b" is the smallest diameter and "a" is the largest perpen-dicular diameter.
RNA extraction and qRT-PCRTotal RNA from cultured cells were extracted using TRIzol
reagent (Invitrogen). cDNA was synthesized using QuantiTectreverse transcription kit (Qiagen). qRT-PCR was done usingTaqMan expression assay probes (Invitrogen) for humanL2HGDH (Hs00227575), SPOCK2 (Hs00360339), and SHISA2(Hs01590823) in QuantStudio 6K Flex Real-Time PCR System(Applied Biosystems). RPLP0 probe (Hs99999902) was used asinternal control, and DDCt method was used to calculate relativemRNA levels.
Western blot analysisa-L2HGDH(Proteintech, #15707-1-AP,GeneTex, #GTX32695),
a-5hmc (Active Motif, #39791), a-KDM6A (GeneTex,#GTX120873), a-MDH2 (Abcam, #ab96193), a-H3K27Me3(Millipore, #07-449), a-H3 (Cell Signaling Technology,#9715), a-EZH2 (Cell Signaling Technology, #5246), and b-actin(Abcam, #ab20272)were used as permanufacturers' instructions.
Dot blot analysis of 5-hydroxymethylation (5-hmC)Blotting of genomic DNA was performed as described previ-
ously (21). Membranes were then blocked with 5%milk in TBSTfor 30 minutes and were incubated with anti-5-hmC antibody(Active Motif) overnight at 4�C and horseradish peroxidase–conjugated anti-rabbit IgG secondary antibody for 1 hour at roomtemperature. After washing three times with TBST, the membranewas treated with ECL and scanned.
Wound-healing assayConfluent cell monolayers in 6-well culture dishes were
wounded by making a scratch using a pipette tip. Phase-contrast/bright field pictures were taken of the wounded area atday 0 and wound healing on the time point as mentioned in therespective figures. Distances between the wounded area wasmeasured using ImageJ software and percentage migration/wound healing was calculated with a percentage of distancecoverage by migrating cells into the scratch wound area.
Boyden chamber cell migration assayCells were harvested by trypsinization, washed with PBS,
and resuspended into serum-free culture medium. A total of5–10 � 103 cells/100–200 mL in serum-free medium was loadedinto moistened top chamber and 600 mL of complete culturemedium containing 10%FBSwas loaded into bottom chamber ofTranswell (Corning) plate. Cells were incubated for 16 hours.
Nonmigrated cells (top chamber) were scrapped off using cottonswab and the migrated cells trapped into the membrane werestained with Diff-Quik Stain kit (Siemens). Bright field images ofthe migrated cells were capture and quantified per mm2 of themembrane.
Microarray analysisTotal RNA was isolated from A498 cells stably expressing
control vector and L2HGDH and purity was assessed by gelelectrophoresis (Agilent 2100 Bioanalyzer). Transcriptional pro-filing experiments were then carried out using the IlluminaHumanHT-12 V4 Array. Data were analyzed using GeneSpringGX software. Differences between treatment groups were deter-mined by an unpaired t test and the multiple testing correctionmethod of Benjamini Hochberg. A corrected P value (q value) wasthen calculated to correct for false-positive discoveries. Heatmapswere created with R using the gplot heatmap.2 package.
TCGA Gene expression, correlation, and outcome analysisClinical and RNASeq (V2) raw data for normal and tumor
samples (Kidney renal clear cell carcinoma) were downloadedfrom TCGA website (https://tcga-data.nci.nih.gov). In-housedeveloped parser was used to process and extract clinical infor-mation and gene expression levels of L2HGDH (http://ualcan.path.uab.edu; ref. 41). For survival analysis, patients were orderedby expression level and split into top50%andbottom50%.Usingthis information, a two condition (high expression vs. lowexpression) Kaplan–Meier survivability plot was generated usingthe survival library in R.
Statistical analysisStatistical analyses were carried out using GraphPad Prism6
software. Comparisons between groups for statistical significancewere performed with a two-tailed unpaired t test. P < 0.05 wasconsidered statistically significant in all cases.
Study approvalAll animal studies were approved by the Institutional Animal
Care and Use Committee.
ResultsL2HGDH knockdown promotes in vitro tumor phenotypes inrenal epithelial cells
Prior studies demonstrating an increased prevalence of braintumors in the context of L-2-HG aciduria suggest that L2HGDHmay have tumor suppressor properties. We therefore examinedthe effects of reduced L2HGDH expression in HK-2 immortalizedrenal epithelial cell that have relatively high basal L2HGDHexpression compared with RCC cells. Using shRNA, we created3 distinct knockdown pools that demonstrated reduced expres-sion of L2HGDH at the mRNA and protein levels (Fig. 1A;Supplementary Fig. S1A). Consistent with the role of L2HGDHin L-2-HG metabolism, knockdown clones demonstrated elevat-ed cellular levels of 2-HG as determined by gas chromatography–mass spectroscopy (Supplementary Fig. S1B). As a functionalreadout of raised 2-HG levels, we assessed the effects of L2HGDHknockdown on DNA 5-hyroxymethylcytosine (5-hmC) levels asprior studies demonstrate that L-2-HG can competitively inhibita-KG dioxygenases including the TET enzymes. Consistent withthese findings, L2HGDH knockdown led to reduced DNA 5-hmC
The L-2-HG/L2HGDH Axis in Kidney Cancer
www.aacrjournals.org Clin Cancer Res; 24(24) December 15, 2018 6435
on July 24, 2020. © 2018 American Association for Cancer Research. clincancerres.aacrjournals.org Downloaded from
Published OnlineFirst August 14, 2018; DOI: 10.1158/1078-0432.CCR-18-1727
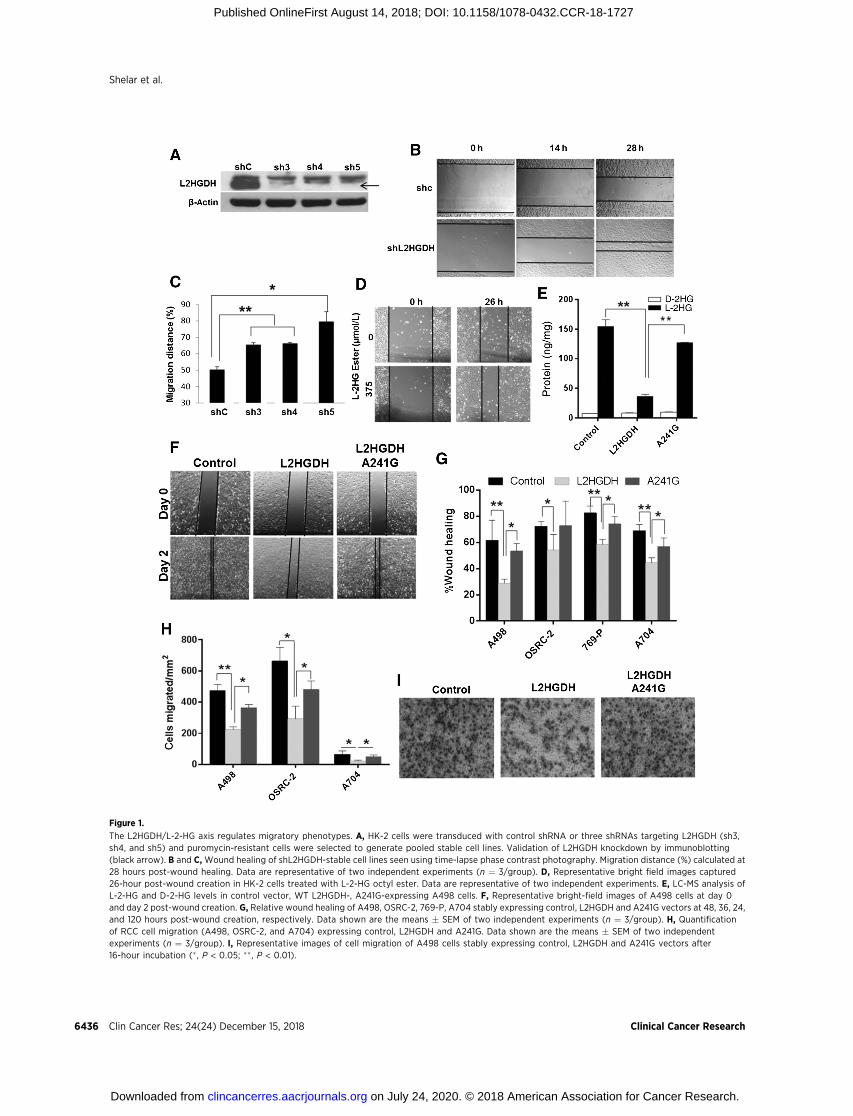
Figure 1.
The L2HGDH/L-2-HG axis regulates migratory phenotypes. A, HK-2 cells were transduced with control shRNA or three shRNAs targeting L2HGDH (sh3,sh4, and sh5) and puromycin-resistant cells were selected to generate pooled stable cell lines. Validation of L2HGDH knockdown by immunoblotting(black arrow). B and C, Wound healing of shL2HGDH-stable cell lines seen using time-lapse phase contrast photography. Migration distance (%) calculated at28 hours post-wound healing. Data are representative of two independent experiments (n ¼ 3/group). D, Representative bright field images captured26-hour post-wound creation in HK-2 cells treated with L-2-HG octyl ester. Data are representative of two independent experiments. E, LC-MS analysis ofL-2-HG and D-2-HG levels in control vector, WT L2HGDH-, A241G-expressing A498 cells. F, Representative bright-field images of A498 cells at day 0and day 2 post-wound creation. G, Relative wound healing of A498, OSRC-2, 769-P, A704 stably expressing control, L2HGDH and A241G vectors at 48, 36, 24,and 120 hours post-wound creation, respectively. Data shown are the means � SEM of two independent experiments (n ¼ 3/group). H, Quantificationof RCC cell migration (A498, OSRC-2, and A704) expressing control, L2HGDH and A241G. Data shown are the means � SEM of two independentexperiments (n ¼ 3/group). I, Representative images of cell migration of A498 cells stably expressing control, L2HGDH and A241G vectors after16-hour incubation (� , P < 0.05; �� , P < 0.01).
Shelar et al.
Clin Cancer Res; 24(24) December 15, 2018 Clinical Cancer Research6436
on July 24, 2020. © 2018 American Association for Cancer Research. clincancerres.aacrjournals.org Downloaded from
Published OnlineFirst August 14, 2018; DOI: 10.1158/1078-0432.CCR-18-1727

levels in renal epithelial cells (Supplementary Fig. S1C). L2HGDHknockdown resulted in a modest increase in proliferation in HK-2cells (Supplementary Fig. S1D).We investigated additional in vitrophenotypes and found that knockdown of L2HGDH promoted amigratory phenotype as assessed by awound-healing scratch assay(Fig. 1B and C). To assess whether these effects were related toraised cellular levels of L-2-HG, we treated HK-2 cells with exog-enous L-2-HG octyl ester which expectedly raised cellular levels of2-HG (Supplementary Fig. S1E). L-2-HG ester treatment alsopromoted a migratory phenotype in HK-2 cells phenocopying theresults of L2HGDHknockdown (Fig. 1D; Supplementary Fig. S1F).
L2HGDH suppresses migratory phenotypes in RCC cellsOn the basis of these data, we assessed the effects of L2HGDH
reconstitution on RCC migratory phenotypes. Consistent withprior data from our group (21), we identified multiple RCC lineswith reduced L2HGDH expression and raised L-2-HG levelsrelative to HK-2 cells (Supplementary Fig. S2). We stably trans-duced RCC cells withWT L2HGDH cDNA or control vector. As anadditional control, we stably transduced RCC cells with aL2HGDH point mutant (A241G) that results in a substitution oflysine with glutamate (K81E) previously reported in patients withL-2-HG aciduria and found to lack catalytic activity (39, 42).Protein expression was confirmed by immunoblotting (Supple-mentary Fig. S3A). Inmultiple lines tested,WT L2HGDHwas ableto significantly lower L-2-HG levels, whereas only slight reduc-tions in L-2-HG were noted with the A241G mutant (Fig. 1E;Supplementary Fig. S3B and S3C). Consistent with increased TETactivity due to reduced L-2-HG, 5-hmC levels were increased inWT cells relative to control vector or A241G-transduced cells(Supplementary Fig. S3D-E). Similar to our loss-of-function stud-ies, L2HGDH restoration in RCC cells reduced migration asdetermined by scratch assay (Fig. 1F and G; Supplementary Fig.S4A–S4C). As an orthogonal assay, we assessed the effects ofL2HGDH on migration via a Boyden chamber assay. In multipleRCC lines tested, WT L2HGDH suppressed Boyden chambermigration relative to either control or A241-mutant cells (Fig.1H and I; Supplementary Fig. S4D and S4E). These data demon-strate that L2HGDH's catalytic activity can suppressRCCmigration.
L2HGDH suppresses RCC growth in vivoThese data prompted us to examine the effects of L2HGDH
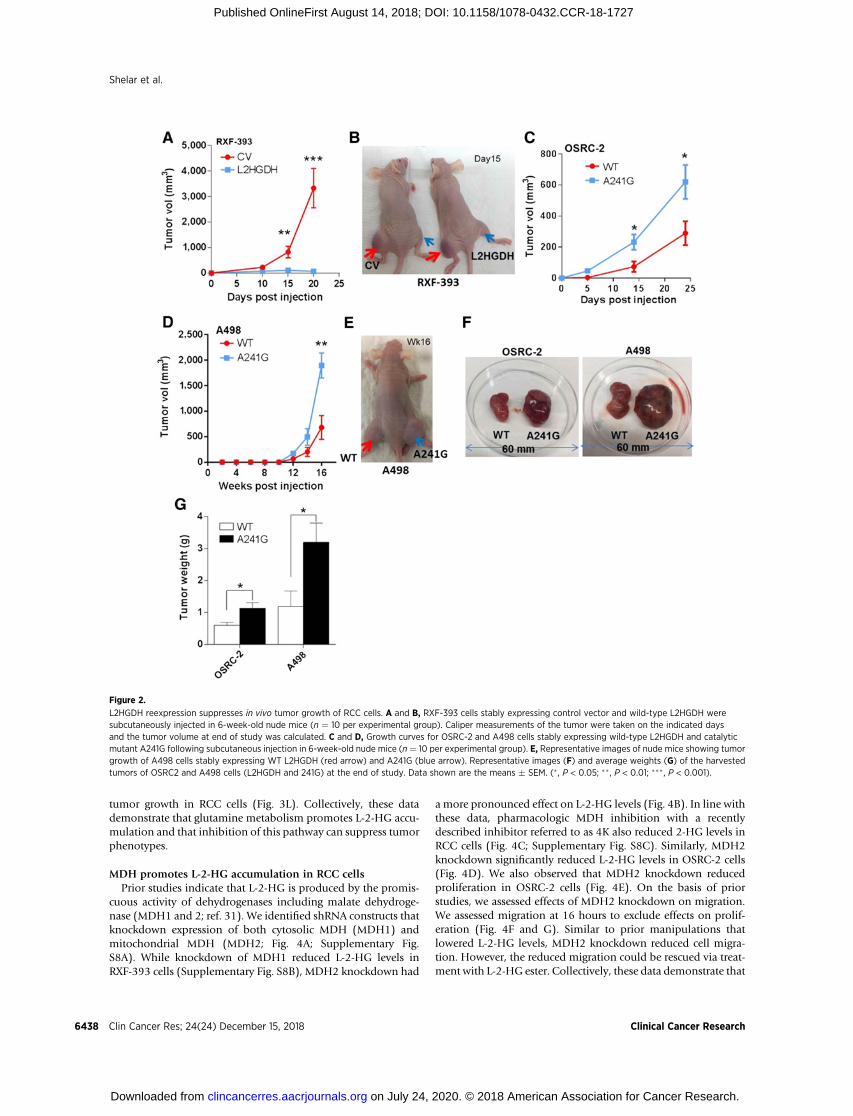
in vivo.We stably expressed L2HGDH inRXF-393RCCcells, whichwe previously demonstrated to express low levels of L2HGDHand had high levels of L-2-HG. Notably, L2HGDH restorationsuppressed tumor growth (Fig. 2A and B). End-of-study analysisof tumor explants confirmed continued expressionof L2HGDHinRCC cells (Supplementary Fig. S5). We next assessed whetherL2HGDH's catalytic activity was required for effects on growthsuppression. In both OSRC-2 and A498 RCC lines, tumors withWT L2HGDH grew more slowly than tumors expressing theA241G mutant (Fig. 2C–E). End-of-study tumors for WT tumorswere of less weight than A241G-mutant tumors (Fig. 2F and G).Collectively, these data demonstrate that L2HGDH suppressionof in vivo tumor growth is dependent on catalytic activity.
Biochemical analysis of the carbon source for L-2-HG in RCCcells
These data prompted us to delineate the biochemical mechan-isms that promote L-2-HG accumulation in the setting ofreduced L2HGDH expression. Prior studies demonstrate that
a-ketoglutarate (a-KG) is the source for L-2-HG (31, 43).Two potential exogenous sources for a-KG include glucose andglutamine. Glutamine has previously been shown to be thepredominant source of L-2-HG in hypoxic cancer cells (SF188gliobastoma line) as well as activated T cells (23, 28). Culture ofRCC cells with elevated basal L-2-HG levels in the absence ofglucose resulted in a modest reduction in total 2-HG levels (Fig.3A). In contrast, culture of cells in the absence of glutamineresulted in a dramatic reduction of total 2-HG levels (Fig. 3A).Enantiomer resolution of 2-HG demonstrated that glutaminedeprivation markedly reduced L-2-HG levels in RCC cells (Sup-plementary Fig. S6A and S6B). Reductions of D-2-HG were alsoevident in cells cultured in the absence of glutamine. Wenext determined whether glutamine is a direct carbon source forL-2-HG in RCC cells. Isotopologue studies with glutamine fullylabeled with C13 (U-13C5) was used to determine whether andhowmany carbons fromglutamine are incorporated into L-2-HG.In both A498 and RXF-393 RCC cells, the predominant form ofL-2-HG derived from U-13C5 glutamine is the mþ5 fraction (C13label incorporated into all 5 molecules of L-2-HG; Fig. 3B;Supplementary Fig. S6C). These data are consistent with theworking model that L-2-HG is generated by the direct reductionof a-KG to L-2-HG. The next most predominant isotopologueidentified in A498 RCC lines is the mþ3 fraction (C13 labelincorporation into 3 carbons). These data would be consistentwith a-KG going through a round of the TCA cycle, which wouldresult in the loss of 2 labeled carbons. L2HGDH reexpression inA498 cells led to reduced accumulation of labeled L-2-HG fol-lowing incubationwithU-13C5 as demonstrated by reduced levelsof mþ5 and mþ3 L-2-HG isotopologues (Fig. 3C).
The contribution of glutamine to L-2-HG in RCC cells led us toconsider whether inhibition of glutamine metabolism couldimpact L-2-HG levels in RCC cells. A key step in glutamineutilization by cells is the conversion to glutamate by glutaminase.Recent studies demonstrate that glutaminase can be pharmaco-logically targeted (44). We therefore examined the effects of theglutaminase inhibitor CB-839 on L-2-HG metabolism in RCCcells. CB-839 treatment of RCC cells under glutamine containingconditions led to a significant reduction of cellular glutamateconsistent with glutaminase inhibition (Supplementary Fig.S6D). Glutaminase inhibition led to a significant reduction ofL-2-HG levels inmultiple RCC lines (Fig. 3D–F). Small moleculesincluding both D- and L-2-HG have been shown to competitivelyinhibitaKGdioxygenase including the TETs (1–3),which catalyzethe conversion of DNA 5-methylC to 5-hydroxymethyl cytosine(5-hmC). Given the significant reductions of L-2-HG followingglutaminase inhibition, we assessed for effects onDNA5-hmC. Inboth A498 and RXF-393 cells, glutaminase inhibition resulted inincreased DNA 5-hmC levels as determined via dot blot assayindicating that lowering of L-2-HG levels results in activation ofTET activity (Fig. 3G). Given that CB-839 effectively lowers L-2-HG levels in RCC cells, we next assessed for effects on cellularmigration. InCaki-1RCCcells, CB-839 reduced cellularmigrationas determined by transwell migration assay (Fig. 3H and I) as wellas scratch assay (Fig. 3J and K). Similar results on migration asdetermined by scratch assay were found in OSCR-2 and RXF-393cells (Supplementary Fig. S7A–S7D). Moreover, for both assaysevaluated, L-2-HG ester treatment was able to rescue the effects ofglutaminase inhibition indicating that the effects of CB-839 onmigration were in part mediated by lowering L-2-HG levels.Furthermore, glutaminase inhibition was able to suppress in vivo
The L-2-HG/L2HGDH Axis in Kidney Cancer
www.aacrjournals.org Clin Cancer Res; 24(24) December 15, 2018 6437
on July 24, 2020. © 2018 American Association for Cancer Research. clincancerres.aacrjournals.org Downloaded from
Published OnlineFirst August 14, 2018; DOI: 10.1158/1078-0432.CCR-18-1727
tumor growth in RCC cells (Fig. 3L). Collectively, these datademonstrate that glutamine metabolism promotes L-2-HG accu-mulation and that inhibition of this pathway can suppress tumorphenotypes.
MDH promotes L-2-HG accumulation in RCC cellsPrior studies indicate that L-2-HG is produced by the promis-
cuous activity of dehydrogenases including malate dehydroge-nase (MDH1 and 2; ref. 31). We identified shRNA constructs thatknockdown expression of both cytosolic MDH (MDH1) andmitochondrial MDH (MDH2; Fig. 4A; Supplementary Fig.S8A). While knockdown of MDH1 reduced L-2-HG levels inRXF-393 cells (Supplementary Fig. S8B), MDH2 knockdown had
a more pronounced effect on L-2-HG levels (Fig. 4B). In line withthese data, pharmacologic MDH inhibition with a recentlydescribed inhibitor referred to as 4K also reduced 2-HG levels inRCC cells (Fig. 4C; Supplementary Fig. S8C). Similarly, MDH2knockdown significantly reduced L-2-HG levels in OSRC-2 cells(Fig. 4D). We also observed that MDH2 knockdown reducedproliferation in OSRC-2 cells (Fig. 4E). On the basis of priorstudies, we assessed effects of MDH2 knockdown on migration.We assessed migration at 16 hours to exclude effects on prolif-eration (Fig. 4F and G). Similar to prior manipulations thatlowered L-2-HG levels, MDH2 knockdown reduced cell migra-tion. However, the reduced migration could be rescued via treat-ment with L-2-HG ester. Collectively, these data demonstrate that
Figure 2.
L2HGDH reexpression suppresses in vivo tumor growth of RCC cells. A and B, RXF-393 cells stably expressing control vector and wild-type L2HGDH weresubcutaneously injected in 6-week-old nude mice (n ¼ 10 per experimental group). Caliper measurements of the tumor were taken on the indicated daysand the tumor volume at end of study was calculated. C and D, Growth curves for OSRC-2 and A498 cells stably expressing wild-type L2HGDH and catalyticmutant A241G following subcutaneous injection in 6-week-old nude mice (n ¼ 10 per experimental group). E, Representative images of nude mice showing tumorgrowth of A498 cells stably expressing WT L2HGDH (red arrow) and A241G (blue arrow). Representative images (F) and average weights (G) of the harvestedtumors of OSRC2 and A498 cells (L2HGDH and 241G) at the end of study. Data shown are the means � SEM. (� , P < 0.05; �� , P < 0.01; ��� , P < 0.001).
Shelar et al.
Clin Cancer Res; 24(24) December 15, 2018 Clinical Cancer Research6438
on July 24, 2020. © 2018 American Association for Cancer Research. clincancerres.aacrjournals.org Downloaded from
Published OnlineFirst August 14, 2018; DOI: 10.1158/1078-0432.CCR-18-1727

Figure 3.
The role of glutamine in L-2-HG metabolism. A, A498 and RXF-393 cells were incubated in media containing either 5 mmol/L glucose and/or 2 mmol/L L-glutaminefor 24 hours. Total 2-HG level was measured. B, L-2-HG isotopologue analysis showing abundance of 13C labeled L-2-HG in A498 cells starved for glutaminefor 4 hours and treated with 2 mmol/L 13C5 L-glutamine for 6 hours. C, L-2-HG isotopologue analysis showing abundance of 13C labelled L-2-HG in A498 cells(control and L2HGDH) starved for glutamine for 4 hours and then incubated with 2 mmol/L 13C5 L-glutamine for 6 hours. D–F, Relative L-2-HG and D-2-HG levels ofA498 (D), RXF-393 (E), and Caki-1 (F) RCC cells treated with glutaminase inhibitor CB-839 (1 mmol/L) for 72 hours. G, Dot blot analysis of 5hmc levels inA498 and RXF-393 cells treated with CB-839 (1 mmol/L) for 72 hours. Top, immunoblot analysis for 5hmc. Bottom, methylene blue (MB) staining for total gDNA.H–K, Caki-1 cells were treated with CB-839 (1 mmol/L) for 48 hours with or without L-2-HG (1 mmol/L). Cells were harvested and then assessed for migrationvia Boyden chamber assay (H and I) and scratch assay (J and K). Data shown are the means � SEM of two independent experiments (n ¼ 3/groups).L, Growth curve of Caki-1 tumor xenografts in nude mice treated with vehicle or CB-839.
The L-2-HG/L2HGDH Axis in Kidney Cancer
www.aacrjournals.org Clin Cancer Res; 24(24) December 15, 2018 6439
on July 24, 2020. © 2018 American Association for Cancer Research. clincancerres.aacrjournals.org Downloaded from
Published OnlineFirst August 14, 2018; DOI: 10.1158/1078-0432.CCR-18-1727

MDH2 promotes L-2-HG accumulation and that inhibition ofMDH2 can suppress in vitro tumor phenotypes in RCC cells withraised L-2-HG.
L-2-HG suppresses targets of H3K27 trimethylation(H3K27me3)
Small molecules including both D- and L-2-HG as well asfumarate and succinate have been shown to inhibit enzymesinvolved in histone and DNA methylation and therefore couldimpact gene expression. For deeper insight into L-2-HG's effects,we performed comparative studies between A498/CV (high L-2-HGcells) andA498/L2HGDH(lowL-2-HGcells).Geneexpressionarray
analysis comparing A498/CV and A498/L2HGDH cells reveals thatgenes reexpressed upon lowering L-2-HG cells are enriched fortargets ofpolycombrepressor complex2 (PRC2)and/orH3K27me3target genes (Fig. 5A and B). PRC2 lays down the repressiveH3K27me3 mark. Consistent with these data, WT L2HGDH low-eredH3K27me3 levels in RCC cells, whereas the A241Gmutant didnot (Fig. 5C). We validated that WT L2HGDH could increaseexpression of these target genes relative to control vector orA241G transduced cells (Fig. 5D). Given that L-2-HG can compet-itively inhibit lysine histone demethylases (KDM), these data led usto consider KDMs that demethylate H3K27me3. Recurring muta-tions of KDM6A (also referred to asUTX), which encodes a H3K27
Figure 4.
Knockdown of MDH lowers L-2-HG andsuppresses in vitro tumor phenotypes in RCCcells. OSRC-2 and RXF-393 cells weretransduced with PLKO control and shMDH2vectors. A, Western blot analysis of MDH2knockdown in RXF-393 and OSRC-2 cells.B, Intracellular L-2-HG and D-2-HG level inshMDH2 transduced RXF-393 cells. C, RXF-393cells were treated with MDH inhibitor (4k,1 mmol/L) for 48 hours, harvested, and assayedfor total 2-HG levels. D, Intracellular L-2-HG andD-2-HG levels in PLKO and shMDH2 transducedOSRC-2 cells. E, Proliferation of OSRC-2 cellstransduced with control PLKO and shMDH2vector. Data shown are themeans� SEMof twoindependent experiments (n ¼ 3/group).F and G, OSRC-2 cells transduced with shMDH2were treated with or without L-2-HG ester(0.5 and 1 mmol/L) for 48 hours and allowed tomigrate in Boyden's chamber for 16 hours.F, Representative images of OSRC-2 cellsmigrated in Boyden chamber. G, Quantificationof OSRC-2 cells migrated in Boyden chamber.Data shown are the means � SEM of twoindependent experiments (n ¼ 3/group;� , P < 0.05; �� , P < 0.01; ��� , P < 0.001).
Shelar et al.
Clin Cancer Res; 24(24) December 15, 2018 Clinical Cancer Research6440
on July 24, 2020. © 2018 American Association for Cancer Research. clincancerres.aacrjournals.org Downloaded from
Published OnlineFirst August 14, 2018; DOI: 10.1158/1078-0432.CCR-18-1727

demethylase, have been identified in renal cancer (45, 46). Wethereforeutilized siRNA toknockdown the expressionofKDM6A inA498 cells transduced withWT L2HGDH (A498/L2HGDH), whichhas reduced migration relative to either control or A241G-mutantcells (Fig. 1G and H). Immunoblotting confirmed knockdown ofKDM6A at the protein level (Fig. 5E). KDM6A knockdown in A498/L2HGDH cells enhanced migration and therefore phenocopied theenhanced migration of high L-2-HG cells (Fig. 5F and G). On thebasis of these data, we assessed the effects of PRC2 inhibition inparental A498 cells, which have high basal levels of L-2-HG. The
catalytic subunitofPRC2,EZH2(enhancerof zestehomologue2), isrequired forH3K27methyltransferase activity. Knockdownof EZH2in A498 cells, confirmed by immunoblotting, resulted in reducedH3K27me3 levels (Fig. 5H). Notably, EZH2 knockdown resulted inreduced cell migration as determined by transwell chamber assay(Fig. 5I and J).
Translational analysis of the L-2-HG/L2HGDH axis in RCCGiven these data, we next examined the translational signifi-
cance of the L-2-HG/L2HGDH axis in the context of RCC. Using
Figure 5.
High L-2-HG inhibits activity of histone lysine demethylase to promote H3K27 trimethylation in RCC cells. A, Heatmap of PRC2/H3K27me3 target genes withincreased expression upon L2HGDH restoration (n ¼ 3/group). B, GSEA of genes with increased expression upon L2HGDH restoration. C, Immunoblots ofH3K27Me3 levels in A498 and OSRC-2 cells expressing control, WT L2HGDH, and L2HGDH A241G. D, Relative mRNA levels of SPOCK2 and SHISA2 in A498 cellsstably expressing control, WT L2HGDH, and L2HGDH-mutant A241G measured using qRT-PCR. E, A498 cells expressing L2HGDH were treated with the indicatedsiRNA and then assessed by immunoblotting for KDM6A protein levels. F, Representative images of A498/L2HGDH cells treated with the indicated siRNAmigratedthrough a transwell insert. G, Quantification of migration of A498/L2HGDH cells treated with the indicated siRNA. Data shown are the means � SEM of twoindependent experiments (n ¼ 3/group). H, Immunoblot for EZH2 and H3K27me3 in A498 cells transduced with control or EZH2 shRNA. I, Representative imagesof A498 cells transduced with the indicated shRNA migrated through a transwell insert. J, Quantification of migration of A498 cells transduced with theindicated shRNA. Data shown are the means � SEM of two independent experiments (n ¼ 3/group; � , P < 0.05; �� , P < 0.01).
The L-2-HG/L2HGDH Axis in Kidney Cancer
www.aacrjournals.org Clin Cancer Res; 24(24) December 15, 2018 6441
on July 24, 2020. © 2018 American Association for Cancer Research. clincancerres.aacrjournals.org Downloaded from
Published OnlineFirst August 14, 2018; DOI: 10.1158/1078-0432.CCR-18-1727

the TCGA dataset, we examined the outcomes of patients withRCC as a function of L2HGDH expression. Notably, patient withtumors in the lower 50% of L2HGDH expression had reducedsurvival (Fig. 6A). Correspondingly, lower L2HGDH mRNAexpression was associated with higher tumor stage and grade(Fig. 6B and C). A primary mechanism by which L2HGDHexpression is reduced is via copy loss of L2HGDH. We previouslydemonstrated using the TCGA dataset that copy loss was associ-
atedwith reduced expression (21). The L2HGDH gene is located at14q, a commonly deleted region in ccRCC. Chromosomal lossesof 14q resulting in loss of heterozygosity (LOH) has previouslybeen shown to be associated with worsened prognosis in patientswith ccRCC (47, 48). We therefore analyzed the relationshipbetween 14q LOH and L2HGDH expression based on a recentdata set that examined both the genomic and transcriptomiclandscape of 100 ccRCCs (49). 14q LOH was identified in 42 of
Figure 6.
Prognostic significance of L2HGDH expression in patients with RCC. A, Kaplan–Meier survival curve analysis in patients from TCGA dataset with tumorsexpressing low L2HGDH mRNA expression (bottom 50%) relative to patients with tumors with high L2HGDH expression (upper 50%). Expression of L2HGDH(transcript per million) in increasing grades (grade 1–4; B) and stages (stage 1–4; C) of kidney tumors of patients from TCGA dataset. D, Relative L2HGDH mRNAexpression as a function of 14q LOH. Data extracted from Sato and colleagues. E, Percentage survival curve of patients from TCGA dataset as a function ofL2HGDH copy number. F, Relative total (DþL)-2-HG levels in normal, primary, and metastatic kidney RCC deposits. G, D-2-HG and L-2-HG levels in metastatictumor deposits (n ¼ 3). H, Graphical representation of biochemical axis of L-2-HG accumulation in RCC and therapeutic potential of glutaminase and MDHinhibitors to lower L-2-HG (� , P <0.05; ��, P <0.01).
Shelar et al.
Clin Cancer Res; 24(24) December 15, 2018 Clinical Cancer Research6442
on July 24, 2020. © 2018 American Association for Cancer Research. clincancerres.aacrjournals.org Downloaded from
Published OnlineFirst August 14, 2018; DOI: 10.1158/1078-0432.CCR-18-1727

100 ccRCC tumors (Supplementary Table S1). Consistent withprior studies, deletion was the primary mechanism for LOH (asopposed to alternatemechanism such as copy neutral LOH). LOHat the L2HGDH locus was present in 38 of these 42 cases (Sup-plementary Table S1). Moreover, 14q LOH tumors demonstratereduced L2HGDHexpression relative to tumorswithout 14q copynumber alterations (Fig. 6D). These data further support copy lossas a mechanism of reduced L2HGDH expression and that theL2HGDH locus is commonly included in 14q losses present inccRCC.Consistentwith these data, LOHat the L2HGDH locuswasassociated with worsened survival in the TCGA dataset (Fig. 6E).Death from ccRCC is most commonly due to progression ofdisease that results in metastasis. We performed unbiased meta-bolomic profiling in normal kidney, primary tumors, and met-astatic RCC tissues (manuscript in preparation). Consistent withprior studies, we identified elevations of total 2-HG levels inprimary tumors relative to normal kidney (Fig. 6F). However,metastatic tissues had even higher total 2-HG levels comparedwith either primary tumors or normal kidney (Fig. 6F). Weconfirmed that the predominant enantiomer contributing to thetotal 2-HG pool in metastatic tissues was the L(S) enantiomer(Fig. 6G). Collectively, our translational studies support thebiological relevance of the L-2-HG/L2HGDH axis to renal carci-nogenesis identified by the in vitro and in vivo data presented.
DiscussionHere we provide clear evidence that the L-2-HG/L2HGDH axis
has biological significance to renal carcinogenesis. In particular, ourin vivo studies demonstrate that restoration of L2HGDH can sup-press tumor growth. Moreover, our studies demonstrate that sup-pression of tumor growth is related to L2HGDH's catalytic activitythereby bolstering the notion that L-2-HG is a bona fide oncome-tabolite that contributes to renal tumorigenesis. These data are inline with data from patients with L-2-HG aciduria in which L-2-HGlevels aremarkedly elevated. Anotablefinding from this rare diseaseis multiple reports of patients with brain tumors suggesting thatL2HGDH has tumor suppressor functions consistent with our datain RCC (34, 37, 38, 50, 51). In addition to brain tumors, a Wilms'tumor of the kidney has also been reported in a L-2-HG aciduriapatient (52). Wilms' tumor is a common renal tumor affectingindividuals in the pediatric population. To date, clear cell renaltumors have not been reported in these patients. However, patientswith this disease process have significant neurological sequelae thatmay shorten lifespan relative to patients typically affected by RCCwho are usually diagnosed in the seventh decade and beyond.
Although the concept of oncometabolites is well established, wewould like to highlight that these are among the only data todemonstrate that lowering levels of a metabolite via a geneticapproach (i.e., L2HGDH restoration) can impact tumor growthin vivo. In vivo studies on the role of fumarate and succinate arelacking. Rohle and colleagues reported that IDH1 knockdown viashRNA in IDH1-mutant (heterozygous) TS603 glioma cells couldsuppress tumor growth (18). One caveat to this study is that theIDH knockdown approach could not exclude effects on tumorgrowthmediated by thewild-type IDH1 allele present in these cells.This is particularly relevant as recent studies by Clavert and collea-gues demonstrate that nonmutated IDH1 is overexpressed inglioblastoma and that knockdown of wild type IDH1 can suppressglioma growth in vivo. Studies on the use of IDH inhibitorsfor glioma have yielded conflicting results in vivo (18, 19, 53).
Moreover, recent transgenic models have demonstrated conflictingresults on the roleofmutant IDH in gliomaprogression (54, 55). Incontrast, preclinical and clinical studies, particularly in leukemia,have provided clear rationale for the use of mutant IDH enzymeinhibitors to the point that they are now approved for use in thesetting of IDH mutation (56–58). However, the effects are likelyrelated to differentiation as in vitro studies in leukemia demonstratethatpharmacologic inhibitionofmutant IDHmayactually increaseproliferation (58, 59).Ourdataare also thefirst todemonstrate thatraised L-2-HG can promote a migratory phenotype. Prior studiesindicate that D-2-HG can promote mesenchymal phenotypes inbreast and colon cancer cells (60–62). However, L-2-HG failed toinduce this behavior in colon cancer cells (61). Collectively, thesedata indicate that context is important with regard to the effects ofeither 2-HG enantiomer on tumor biology/phenotypes.
Bioinformatic analyses demonstrate that copy loss of L2HGDHis linked with 14q losses in ccRCC. Loss of 14q is associated withworsened outcomes in patients with RCC (48, 63). Despite thesedata, the genes on 14q whose loss contributes to this clinicalphenotype remain to be characterized. Our data indicated thatL2HGDH is one of the relevant genes. Collectively, our datasupport a model in which 14q loss results in a cellular milieuthat leads to elevationof L-2-HG inRCC.Our studies demonstratepossible strategies to lower L-2-HG levels in RCC includingtargeting the source of L-2-HG in RCC via the glutamine axis orvia inhibition of MDH (Fig. 6H).
To date, studies on both 2-HGs have demonstrated that mul-tiple histone marks can be impacted. However, a major challengehas been identifying the relevant histone demethylases. Ourtranscriptomic studies indicate that KDM6A is a target of L-2-HGin RCC and are in agreement with mounting evidence demon-strating the importance of the H3K27 methylation axis in renalcancer. As noted before, mutations of KDM6A (also referred to asUTX), which encodes the enzyme that demethylates H3K27, havebeen reported in renal cancer (45, 46). Notably, multiple studieshave now reported that KDMs are HIF target genes, which isparticularly relevant in ccRCC in which inactivating mutations ofVHL and ensuingHIF stabilization is a common event (64–68). Arecent study by Chakraborty and colleagues indicated that VHL-defective RCC cells are dependent on the H3K27 methyltransfer-ase activity of EZH1 for cell survival to counter the HIF-mediatedinduction of KDMs (69).Multiple studies indicate the importanceof EZH2 in RCC phenotypes including in vivo tumor growth andtherapy resistance (70, 71). Our data, therefore, add another layerof regulation of this axis in RCC via metabolism due to L-2-HG'sability to act as a competitive inhibitor.
Our data may have biomarker implications for ccRCC, a majorgap in the kidney cancer field. As previously noted, the L2HGDHgene is located at 14q, a region whose loss is associated withpoorer outcomes. We previously established the connectionbetween reduced L2HGDHexpression and elevated L-2-HG levelsin ccRCC. Given that reduced L2HGDH expression is associatedwith worsened outcomes and increasing stage/grade, L-2-HGlevels in a tumor could serve as a biomarker that could dictatetherapy and/or render prognostic information.
Finally, our data add to the growing body of evidence thatinhibition of glutamine metabolism may have therapeutic rele-vance in renal cancer. These data have particular relevance givenour data demonstrating the role of glutamine metabolism inmaintaining L-2-HG levels in multiple RCC lines tested as wellas the in vivo efficacy of a glutaminase inhibitor in RCC cells with
The L-2-HG/L2HGDH Axis in Kidney Cancer
www.aacrjournals.org Clin Cancer Res; 24(24) December 15, 2018 6443
on July 24, 2020. © 2018 American Association for Cancer Research. clincancerres.aacrjournals.org Downloaded from
Published OnlineFirst August 14, 2018; DOI: 10.1158/1078-0432.CCR-18-1727

elevated L-2-HG levels. Recent studies in the context of clinicaltrials indicate that glutaminase inhibition may have efficacy in asubset of RCC patients (72). Efficacy of glutaminase inhibition inRCC in vivo has been linked with PARP sensitivity and oxidativestress (73, 74). Therefore, despite our rescue experiments withesterified L-2-HG in vitro, we cannot exclude effects on thesealternate pathways in vivo. Nevertheless, these data warrant futurestudies to explore whether L-2-HG could be utilized as a bio-marker for therapeutics that target glutamine metabolism.
In summary, our studies demonstrate that L2HGDH hastumor-suppressive effects and therefore support the concept ofL-2-HG as an oncometabolite in kidney cancer. By delineating themetabolic events that promote L-2-HG accumulation and thedownstream sequelae of this buildup, we provide new opportu-nities for therapeutic intervention in patientswith L-2-HG–drivenkidney tumors.
Disclosure of Potential Conflicts of InterestE. Emberley is a senior scientist and has ownership interest (including stock,
patents, etc.) at Calithera Biosciences. No potential conflicts of interest weredisclosed by other authors.
Authors' ContributionsConception and design: E.-H. Shim, G.J. Brinkley, S. SudarshanDevelopment of methodology: S. Shelar, E.-H. Shim, G.J. Brinkley, S. Dutta,S. E. Velu, E. Emberley, A. Becker, C. Kunick, S. Sudarshan
Acquisition of data (provided animals, acquired and managed patients,provided facilities, etc.): S. Shelar, E.-H. Shim, G.J. Brinkley, A. Kundu,F. Carobbio, T. Poston, J. Tan, V. Parekh, D. Benson, D. Rakheja, Y. Sato,S. Ogawa, S. E. Velu, A. Pan, J. Chen, T. Haung, D. Absher, S. SudarshanAnalysis and interpretation of data (e.g., statistical analysis, biostatistics,computational analysis): S. Shelar, E.-H. Shim, G.J. Brinkley, F. Carobbio,T. Poston, D. K. Crossman, P. J. Buckhaults, D. Rakheja, S. Dutta, S. E. Velu,T. Haung, D. Absher, S. SudarshanWriting, review, and/or revision of the manuscript: S. Shelar, E.-H. Shim,D. K. Crossman, D. Absher, S. SudarshanAdministrative, technical, or material support (i.e., reporting or organizingdata, constructingdatabases):D.K.Crossman,R. Kirkman,A. Becker, C.KunickStudy supervision: E. Emberley, S. SudarshanOther (grew andprovided cancer cells thatwere used for in vivo experiments):E. Emberley
AcknowledgmentsThe research reported in this article was supported by R01CA200653,
5I01BX002930, the UAB-HudsonAlpha Center for Genomic Medicine (toS. Sudarshan) and in part by the UAB Comprehensive Cancer Center(P30CA013148).
The costs of publication of this articlewere defrayed inpart by the payment ofpage charges. This article must therefore be hereby marked advertisement inaccordance with 18 U.S.C. Section 1734 solely to indicate this fact.
Received June 1, 2018; revised July 9, 2018; accepted August 8, 2018;published first August 14, 2018.
References1. Yan H, Parsons DW, Jin G, McLendon R, Rasheed BA, Yuan W, et al. IDH1
and IDH2 mutations in gliomas. N Engl J Med 2009;360:765–73.2. Amary MF, Bacsi K, Maggiani F, Damato S, Halai D, Berisha F, et al. IDH1
and IDH2 mutations are frequent events in central chondrosarcoma andcentral andperiosteal chondromasbut not in othermesenchymal tumours.J Pathol 2011;224:334–43.
3. Dang L, White DW, Gross S, Bennett BD, Bittinger MA, Driggers EM, et al.Cancer-associated IDH1 mutations produce 2-hydroxyglutarate. Nature2009;462:739–44.
4. Mardis ER, Ding L, Dooling DJ, Larson DE, McLellan MD, Chen K, et al.Recurring mutations found by sequencing an acute myeloid leukemiagenome. N Engl J Med 2009;361:1058–66.
5. Ward PS, Patel J, Wise DR, Abdel-Wahab O, Bennett BD, Coller HA, et al.The common feature of leukemia-associated IDH1 and IDH2mutations isa neomorphic enzyme activity converting alpha-ketoglutarate to 2-hydro-xyglutarate. Cancer Cell 2010;17:225–34.
6. Borger DR, Tanabe KK, Fan KC, Lopez HU, Fantin VR, Straley KS, et al.Frequent mutation of isocitrate dehydrogenase (IDH)1 and IDH2 incholangiocarcinoma identified through broad-based tumor genotyping.Oncologist 2012;17:72–9.
7. Wang P, Dong Q, Zhang C, Kuan PF, Liu Y, Jeck WR, et al. Mutations inisocitrate dehydrogenase 1 and 2 occur frequently in intrahepatic cholan-giocarcinomas and share hypermethylation targets with glioblastomas.Oncogene 2013;32:3091–100.
8. Isaacs JS, Jung YJ, Mole DR, Lee S, Torres-Cabala C, Chung YL, et al. HIFoverexpression correlates with biallelic loss of fumarate hydratase in renalcancer: novel role of fumarate in regulation of HIF stability. Cancer Cell2005;8:143–53.
9. Selak MA, Armour SM, MacKenzie ED, Boulahbel H, Watson DG, Mans-field KD, et al. Succinate links TCA cycle dysfunction to oncogenesis byinhibiting HIF-alpha prolyl hydroxylase. Cancer Cell 2005;7:77–85.
10. Smith EH, Janknecht R, Maher LJ III. Succinate inhibition of alpha-ketoglutarate-dependent enzymes in a yeast model of paraganglioma.Hum Mol Genet 2007;16:3136–48.
11. Lu C, Ward PS, Kapoor GS, Rohle D, Turcan S, Abdel-Wahab O, et al. IDHmutation impairs histone demethylation and results in a block to celldifferentiation. Nature 2012;483:474–8.
12. Figueroa ME, Abdel-Wahab O, Lu C, Ward PS, Patel J, Shih A, et al.Leukemic IDH1 and IDH2 mutations result in a hypermethylation phe-notype, disrupt TET2 function, and impair hematopoietic differentiation.Cancer Cell 2010;18:553–67.
13. Xu W, Yang H, Liu Y, Yang Y, Wang P, Kim SH, et al. Oncometabolite2-hydroxyglutarate is a competitive inhibitor of alpha-ketoglutarate-dependent dioxygenases. Cancer Cell 2011;19:17–30.
14. Chowdhury R, Yeoh KK, Tian YM, Hillringhaus L, Bagg EA, Rose NR, et al.The oncometabolite 2-hydroxyglutarate inhibits histone lysine demethy-lases. EMBO Rep 2011;12:463–9.
15. Xiao M, Yang H, Xu W, Ma S, Lin H, Zhu H, et al. Inhibition of alpha-KG-dependent histone and DNA demethylases by fumarate and succinate thatare accumulated in mutations of FH and SDH tumor suppressors. GenesDev 2012;26:1326–38.
16. Wu SC, Zhang Y. Active DNA demethylation: many roads lead to Rome.Nat Rev Mol Cell Biol 2010;11:607–20.
17. Losman JA, Looper RE, Koivunen P, Lee S, Schneider RK,McMahonC, et al.(R)-2-hydroxyglutarate is sufficient to promote leukemogenesis and itseffects are reversible. Science 2013;339:1621–5.
18. Rohle D, Popovici-Muller J, Palaskas N, Turcan S, Grommes C, Campos C,et al. An inhibitor of mutant IDH1 delays growth and promotes differen-tiation of glioma cells. Science 2013;340:626–30.
19. Tateishi K, Wakimoto H, Iafrate AJ, Tanaka S, Loebel F, Lelic N, et al.Extreme vulnerability of IDH1mutant cancers to NADþ depletion. CancerCell 2015;28:773–84.
20. Kopinja J, Sevilla RS, Levitan D, Dai D, Vanko A, Spooner E, et al. A brainpenetrant mutant IDH1 inhibitor provides in vivo survival benefit. Sci Rep2017;7:13853.
21. Shim EH, Livi CB, Rakheja D, Tan J, Benson D, Parekh V, et al. L-2-Hydroxyglutarate: an epigenetic modifier and putative oncometabolite inrenal cancer. Cancer Discov 2014;4:1290–8.
22. Chen K, Zhang J, Guo Z, Ma Q, Xu Z, Zhou Y, et al. Loss of 5-hydro-xymethylcytosine is linked to gene body hypermethylation in kidneycancer. Cell Res 2016;26:103–18.
23. Intlekofer AM, Dematteo RG, Venneti S, Finley LW, Lu C, Judkins AR, et al.Hypoxia inducesproductionof L-2-Hydroxyglutarate. CellMetab2015;22:304–11.
Shelar et al.
Clin Cancer Res; 24(24) December 15, 2018 Clinical Cancer Research6444
on July 24, 2020. © 2018 American Association for Cancer Research. clincancerres.aacrjournals.org Downloaded from
Published OnlineFirst August 14, 2018; DOI: 10.1158/1078-0432.CCR-18-1727

24. Mullen AR, Hu Z, Shi X, Jiang L, Boroughs LK, Kovacs Z, et al. Oxidation ofalpha-ketoglutarate is required for reductive carboxylation in cancer cellswith mitochondrial defects. Cell Rep 2014;7:1679–90.
25. OldhamWM, Clish CB, Yang Y, Loscalzo J. Hypoxia-Mediated Increases inL-2-hydroxyglutarate coordinate themetabolic response to reductive stress.Cell Metab 2015;22:291–303.
26. Nadtochiy SM, Schafer X, Fu D, Nehrke K,Munger J, Brookes PS. Acidic pHIs a metabolic switch for 2-Hydroxyglutarate generation and signaling.J Biol Chem 2016;291:20188–97.
27. Burr SP, Costa AS, Grice GL, Timms RT, Lobb IT, Freisinger P, et al.Mitochondrial protein lipoylation and the 2-oxoglutarate dehydrogenasecomplex controls HIF1alpha stability in aerobic conditions. Cell Metab2016;24:740–52.
28. Tyrakis PA, Palazon A, Macias D, Lee KL, Phan AT, Velica P, et al. S-2-hydroxyglutarate regulates CD8(þ) T-lymphocyte fate. Nature 2016;540:236–41.
29. Anso E, Weinberg SE, Diebold LP, Thompson BJ, Malinge S, SchumackerPT, et al. The mitochondrial respiratory chain is essential for haemato-poietic stem cell function. Nat Cell Biol 2017;19:614–25.
30. Ma S, Sun R, Jiang B, Gao J, Deng W, Liu P, et al. L2hgdh deficiencyaccumulates l-2-hydroxyglutarate with progressive leukoencephalopathyand neurodegeneration. Mol Cell Biol 2017;37:e00492–16.
31. Rzem R, Vincent MF, Van Schaftingen E, Veiga-da-Cunha M. L-2-hydro-xyglutaric aciduria, a defect of metabolite repair. J Inherit Metab Dis2007;30:681–9.
32. Intlekofer AM, Wang B, Liu H, Shah H, Carmona-Fontaine C, RustenburgAS, et al. L-2-Hydroxyglutarate production arises from noncanonicalenzyme function at acidic pH. Nat Chem Biol 2017;13:494–500.
33. Li H, Chawla G, Hurlburt AJ, Sterrett MC, Zaslaver O, Cox J, et al.Drosophila larvae synthesize the putative oncometabolite L-2-hydroxy-glutarate during normal developmental growth. Proc Natl Acad Sci U S A2017;114:1353–8.
34. Aghili M, Zahedi F, Rafiee E. Hydroxyglutaric aciduria and malignantbrain tumor: a case report and literature review. J Neurooncol 2009;91:233–6.
35. Barbot C, Fineza I, Diogo L, Maia M, Melo J, Guimaraes A, et al. L-2-Hydroxyglutaric aciduria: clinical, biochemical and magnetic resonanceimaging in six Portuguese pediatric patients. Brain Dev 1997;19:268–73.
36. Haliloglu G, Jobard F, Oguz KK, Anlar B, Akalan N, Coskun T, et al. L-2-hydroxyglutaric aciduria and brain tumors in children with mutations inthe L2HGDH gene: neuroimaging findings. Neuropediatrics 2008;39:119–22.
37. Moroni I, BugianiM,D'Incerti L,MaccagnanoC, RimoldiM, Bissola L, et al.L-2-hydroxyglutaric aciduria and brain malignant tumors: a predisposingcondition? Neurology 2004;62:1882–4.
38. Ozisik PA, Akalan N, Palaoglu S, Topcu M. Medulloblastoma in a childwith themetabolic disease L-2-hydroxyglutaric aciduria. PediatrNeurosurg2002;37:22–6.
39. Rzem R, Veiga-da-Cunha M, Noel G, Goffette S, Nassogne MC, Tabarki B,et al. A gene encoding a putative FAD-dependent L-2-hydroxyglutaratedehydrogenase is mutated in L-2-hydroxyglutaric aciduria. Proc Natl AcadSci U S A 2004;101:16849–54.
40. Becker A, Kohfeld S, Lader A, Preu L, Pies T, Wieking K, et al. Developmentof 5-benzylpaullones and paullone-9-carboxylic acid alkyl esters as selec-tive inhibitors of mitochondrial malate dehydrogenase (mMDH). Eur JMed Chem 2010;45:335–42.
41. Chandrashekar DS, Bashel B, Balasubramanya SAH, Creighton CJ, Ponce-Rodriguez I, Chakravarthi BVSK, et al. UALCAN: a portal for facilitatingtumor subgroup gene expression and survival analyses. Neoplasia2017;19:649–58.
42. Rzem R, Van Schaftingen E, Veiga-da-Cunha M. The gene mutated in l-2-hydroxyglutaric aciduria encodes l-2-hydroxyglutarate dehydrogenase.Biochimie 2006;88:113–6.
43. Struys EA, Gibson KM, Jakobs C. Novel insights into L-2-hydroxyglutaricaciduria: mass isotopomer studies reveal 2-oxoglutaric acid as the meta-bolic precursor of L-2-hydroxyglutaric acid. J Inherit Metab Dis 2007;30:690–3.
44. GrossMI,DemoSD,Dennison JB,Chen L, Chernov-RoganT,Goyal B, et al.Antitumor activity of the glutaminase inhibitor CB-839 in triple-negativebreast cancer. Mol Cancer Ther 2014;13:890–901.
45. Dalgliesh GL, Furge K, Greenman C, Chen L, Bignell G, Butler A, et al.Systematic sequencing of renal carcinoma reveals inactivation of histonemodifying genes. Nature 2010;463:360–3.
46. van Haaften G, Dalgliesh GL, Davies H, Chen L, Bignell G, Greenman C,et al. Somatic mutations of the histone H3K27 demethylase gene UTX inhuman cancer. Nat Genet 2009;41:521–3.
47. Kroeger N, Klatte T, Chamie K, Rao PN, Birkhauser FD, Sonn GA, et al.Deletions of chromosomes 3p and 14q molecularly subclassify clear cellrenal cell carcinoma. Cancer 2013;119:1547–54.
48. Monzon FA, Alvarez K, Peterson L, Truong L, Amato RJ, Hernandez-McClain J, et al. Chromosome 14q loss defines a molecular subtype ofclear-cell renal cell carcinoma associated with poor prognosis. Mod Pathol2011;24:1470–9.
49. Sato Y, Yoshizato T, Shiraishi Y, Maekawa S, Okuno Y, Kamura T, et al.Integrated molecular analysis of clear-cell renal cell carcinoma. Nat Genet2013;45:860–7.
50. PatayZ,Orr BA, Shulkin BL,Hwang SN, Ying Y, Broniscer A, et al. Successivedistinct high-grade gliomas in L-2-hydroxyglutaric aciduria. J InheritMetabDis 2015;38:273–7.
51. Patay Z, Mills JC, Lobel U, Lambert A, Sablauer A, Ellison DW. Cerebralneoplasms in L-2 hydroxyglutaric aciduria: 3 new cases and meta-analysisof literature data. AJNR Am J Neuroradiol 2012;33:940–3.
52. Rogers RE, Deberardinis RJ, Klesse LJ, Boriack RL, Margraf LR, Rakheja D.Wilms tumor in a child with L-2-hydroxyglutaric aciduria. Pediatr DevPathol 2010;13:408–11.
53. Pusch S, Krausert S, Fischer V, Balss J, Ott M, Schrimpf D, et al. Pan-mutantIDH1 inhibitor BAY 1436032 for effective treatment of IDH1 mutantastrocytoma in vivo. Acta Neuropathol 2017;133:629–44.
54. Waitkus MS, Pirozzi CJ, Moure CJ, Diplas BH, Hansen LJ, Carpenter AB,et al. Adaptive evolution of the GDH2 allosteric domain promotesgliomagenesis by resolving IDH1(R132H)-Induced metabolic liabilities.Cancer Res 2018;78:36–50.
55. Philip B, Yu DX, Silvis MR, Shin CH, Robinson JP, Robinson GL, et al.Mutant IDH1 promotes glioma formation in vivo. Cell Rep 2018;23:1553–64.
56. Kats LM, Vervoort SJ, Cole R, Rogers AJ, Gregory GP, Vidacs E, et al. Apharmacogenomic approach validates AG-221 as an effective andon-targettherapy in IDH2 mutant AML. Leukemia 2017;31:1466–70.
57. Yen K, Travins J, Wang F, DavidMD, Artin E, Straley K, et al. AG-221, a first-in-class therapy targeting acute myeloid leukemia harboring oncogenicIDH2 mutations. Cancer Discov 2017;7:478–93.
58. Wang F, Travins J, DeLaBarre B, Penard-Lacronique V, Schalm S, Hansen E,et al. Targeted inhibition ofmutant IDH2 in leukemia cells induces cellulardifferentiation. Science 2013;340:622–6.
59. Chen C, Liu Y, Lu C, Cross JR, Morris JP IV, Shroff AS, et al. Cancer-associated IDH2 mutants drive an acute myeloid leukemia that is suscep-tible to Brd4 inhibition. Genes Dev 2013;27:1974–85.
60. Mishra P, Tang W, Putluri V, Dorsey TH, Jin F, Wang F, et al. ADHFE1 is abreast cancer oncogene and induces metabolic reprogramming. J ClinInvest 2018;128:323–40.
61. Colvin H, Nishida N, Konno M, Haraguchi N, Takahashi H, Nishimura J,et al. Oncometabolite D-2-Hydroxyglurate directly induces epithelial-mesenchymal transition and is associated with distant metastasis incolorectal cancer. Sci Rep 2016;6:36289.
62. Grassian AR, Lin F, Barrett R, Liu Y, Jiang W, Korpal M, et al. Isocitratedehydrogenase (IDH) mutations promote a reversible ZEB1/microRNA(miR)-200-dependent epithelial-mesenchymal transition (EMT). J BiolChem 2012;287:42180–94.
63. Klatte T, RaoPN, deMartinoM, LaRochelle J, ShuchB, ZomorodianN, et al.Cytogenetic profile predicts prognosis of patients with clear cell renal cellcarcinoma. J Clin Oncol 2009;27:746–53.
64. Lee HY, Choi K, Oh H, Park YK, Park H. HIF-1-dependent induction ofJumonji domain-containing protein (JMJD) 3 under hypoxic conditions.Mol Cells 2014;37:43–50.
65. Wellmann S, Bettkober M, Zelmer A, Seeger K, FaigleM, Eltzschig HK, et al.Hypoxia upregulates the histone demethylase JMJD1A via HIF-1. BiochemBiophys Res Commun 2008;372:892–7.
66. Krieg AJ, Rankin EB, Chan D, Razorenova O, Fernandez S, Giaccia AJ.Regulation of the histone demethylase JMJD1A by hypoxia-induciblefactor 1 alpha enhances hypoxic gene expression and tumor growth. MolCell Biol 2010;30:344–53.
The L-2-HG/L2HGDH Axis in Kidney Cancer
www.aacrjournals.org Clin Cancer Res; 24(24) December 15, 2018 6445
on July 24, 2020. © 2018 American Association for Cancer Research. clincancerres.aacrjournals.org Downloaded from
Published OnlineFirst August 14, 2018; DOI: 10.1158/1078-0432.CCR-18-1727

67. Beyer S, Kristensen MM, Jensen KS, Johansen JV, Staller P. The histonedemethylases JMJD1A and JMJD2B are transcriptional targets of hypoxia-inducible factor HIF. J Biol Chem 2008;283:36542–52.
68. Xia X, Lemieux ME, Li W, Carroll JS, Brown M, Liu XS, et al. Integrativeanalysis of HIF binding and transactivation reveals its role in maintaininghistone methylation homeostasis. Proc Natl Acad Sci U S A 2009;106:4260–5.
69. Chakraborty AA, Nakamura E, Qi J, Creech A, Jaffe JD, Paulk J, et al. HIFactivation causes synthetic lethality between the VHL tumor suppressorand the EZH1 histone methyltransferase. Sci Transl Med 2017;9:eaal5272.
70. Liu L, Xu Z, Zhong L,WangH, Jiang S, LongQ, et al. EZH2 promotes tumorcell migration and invasion via epigenetic repression of E-cadherin in renalcell carcinoma. BJU Int 2016;117:351–62.
71. Adelaiye-Ogala R, Budka J, Damayanti NP, Arrington J, Ferris M, Hsu CC,et al. EZH2modifies sunitinib resistance in renal cell carcinoma by kinomereprogramming. Cancer Res 2017;77:6651–66.
72. Meric-Bernstam F, Tannir NM, Mier JW, DeMichele A, Telli ML, Fan AC.Phase 1 study of CB-839, a small molecule inhibitor of glutaminase (GLS),alone and in combination with everolimus (E) in patients (pts) with renalcell cancer (RCC). J Clin Oncol 2016;34:4568–4568.
73. Abu Aboud O, Habib SL, Trott J, Stewart B, Liang S, Chaudhari AJ, et al.Glutamine addiction in kidney cancer suppresses oxidative stress and canbe exploited for real-time imaging. Cancer Res 2017;77:6746–58.
74. Okazaki A, Gameiro PA, Christodoulou D, Laviollette L, Schneider M,Chaves F, et al. Glutaminase and poly(ADP-ribose) polymerase inhibitorssuppress pyrimidine synthesis and VHL-deficient renal cancers. J ClinInvest 2017;127:1631–45.
Clin Cancer Res; 24(24) December 15, 2018 Clinical Cancer Research6446
Shelar et al.
on July 24, 2020. © 2018 American Association for Cancer Research. clincancerres.aacrjournals.org Downloaded from
Published OnlineFirst August 14, 2018; DOI: 10.1158/1078-0432.CCR-18-1727

2018;24:6433-6446. Published OnlineFirst August 14, 2018.Clin Cancer Res Sandeep Shelar, Eun-Hee Shim, Garrett J. Brinkley, et al. Potential Therapeutic Target in Renal CancerBiochemical and Epigenetic Insights into L-2-Hydroxyglutarate, a
Updated version
10.1158/1078-0432.CCR-18-1727doi:
Access the most recent version of this article at:
Material
Supplementary
http://clincancerres.aacrjournals.org/content/suppl/2018/08/14/1078-0432.CCR-18-1727.DC1
Access the most recent supplemental material at:
Cited articles
http://clincancerres.aacrjournals.org/content/24/24/6433.full#ref-list-1
This article cites 74 articles, 23 of which you can access for free at:
Citing articles
http://clincancerres.aacrjournals.org/content/24/24/6433.full#related-urls
This article has been cited by 3 HighWire-hosted articles. Access the articles at:
E-mail alerts related to this article or journal.Sign up to receive free email-alerts
Subscriptions
Reprints and
To order reprints of this article or to subscribe to the journal, contact the AACR Publications Department at
Permissions
Rightslink site. Click on "Request Permissions" which will take you to the Copyright Clearance Center's (CCC)
.http://clincancerres.aacrjournals.org/content/24/24/6433To request permission to re-use all or part of this article, use this link
on July 24, 2020. © 2018 American Association for Cancer Research. clincancerres.aacrjournals.org Downloaded from
Published OnlineFirst August 14, 2018; DOI: 10.1158/1078-0432.CCR-18-1727