BIM in New Zealand — an industry-wide view 2015€¦ · BIM in New Zealand — an industry-wide...
17
BIM in New Zealand — an industry-wide view 2015 Baseline information on the use of BIM across the New Zealand construction industry
Transcript of BIM in New Zealand — an industry-wide view 2015€¦ · BIM in New Zealand — an industry-wide...

BIM in New Zealand — an industry-wide view 2015Baseline information on the use of BIM across the New Zealand construction industry
Contents
BIM benchmark survey foreword 3
Who are the BIM control group? 4
BIM use in the workflow for our control group? 5
What is BIM being used for? 6
Barriers to BIM uptake 11
Enabling increased use of BIM within a practice 13
The benefits in increased use of BIM 15
The Government role as a client using BIM 16
Summary & conclusions 17
2
BIM in New Zealand — an industry-wide view 2015

BIM benchmark survey forewordThis is the second survey in, what is planned to be, a five year series that follow the progress of the introduction of Building Information Modelling (BIM) into New Zealand.
BIM was identified as a key strategy to produce a step change in productivity in the built environment. The BIM Acceleration Committee (BAC) was charged with responsibility for bringing this about. In facilitating this speedier uptake, the BIM Acceleration Committee
has been exceptionally fortunate to have had the continuing support of MBIE, BRANZ and a number of large private sector organisations all of whom share the view of the importance of BIM to the construction industry.
We are especially pleased to partner with EBOSS on this initiative. We thank them for their investment in managing and sponsoring this annual survey: with a commitment to do so for a full five years.
Our sincerest thanks also go to the control group of this survey who, by nature of their size, represent a significant proportion of the design and construction sector in New Zealand. The survey’s results will provide a clear view of how accelerating the use of BIM’s is progressing, as well as providing a method of identifying obstacles to this acceleration.
Finally, should any reader of this survey have any suggestions for improvement, please don’t hesitate to e-mail [email protected], or raise the issue at one of the regular BIM Network meetings which have been inaugurated in Christchurch, Wellington and Auckland (see BIM in NZ for more information).
Kind Regards,
Andrew RedingANDREW REDING
Chair, BIM Acceleration Committee
Building and Construction Industry Productivity Partnership
Formed in 2006 EBOSS hosts a comprehensive architectural product library, with an active audience of 35,000 architects, designers, main contractors and tradespersons. At EBOSS we are interested in improving the communication of BIM information through the construction value chain and appreciate the opportunity to partner with the BIM Acceleration Committee and sponsor this research initiative.
MATTHEW DUDERManaging Director [email protected]
eboss.co.nz
22 Degrees
AECOM NZ
Aquaheat Industries
Archaus Architects
Architectus
AS Built
Assemble
Auckland International Airport
Auckland University of Technology
Barnes Beagley Doherr
Beca
BGT Structures
Davis Langdon
Dominion Constructors
Envivo
Fletcher Construction
Ganellen
Hawkins Construction
Holmes Consulting Group
Ignite Architects
Jasmax
Jensen Steel
KTA
Maltbys
Mott MacDonald
MSC Consulting Group
MWH New Zealand
Nauhria Precast & Reinforcing
Naylor Love Construction
Norman Disney & Young
NZ Strong Construction
Opus International Consultants
Patterson Architects
Peddle Thorp
RCP
Stephenson & Turner
Structex
University of Canterbury
University of Otago
Victoria University of Wellington
Warren & Mahoney Architects
Wellington City Council
Woods
WSP
WT Partnership
Xigo
Control Group Organisations
3
BIM in New Zealand — an industry-wide view 2015
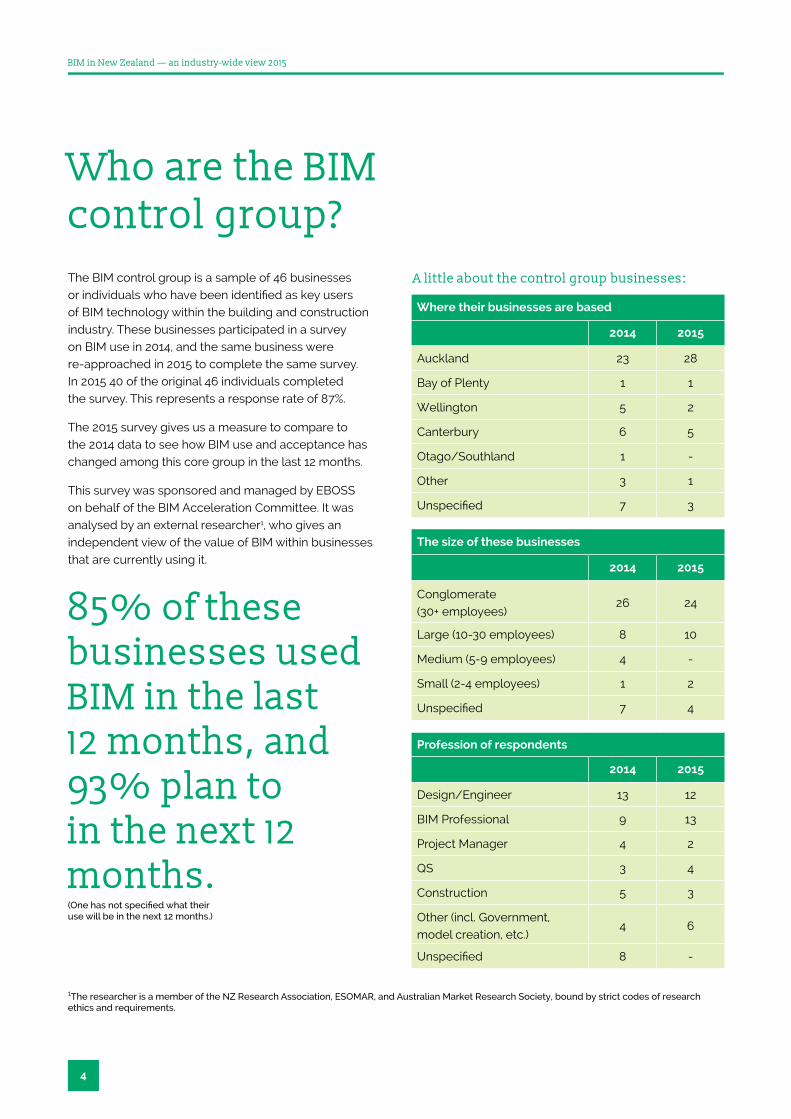
The BIM control group is a sample of 46 businesses or individuals who have been identified as key users of BIM technology within the building and construction industry. These businesses participated in a survey on BIM use in 2014, and the same business were re-approached in 2015 to complete the same survey. In 2015 40 of the original 46 individuals completed the survey. This represents a response rate of 87%.
The 2015 survey gives us a measure to compare to the 2014 data to see how BIM use and acceptance has changed among this core group in the last 12 months.
This survey was sponsored and managed by EBOSS on behalf of the BIM Acceleration Committee. It was analysed by an external researcher1, who gives an independent view of the value of BIM within businesses that are currently using it.
Who are the BIM control group?
Where their businesses are based
2014 2015
Auckland 23 28
Bay of Plenty 1 1
Wellington 5 2
Canterbury 6 5
Otago/Southland 1 -
Other 3 1
Unspecified 7 3
The size of these businesses
2014 2015
Conglomerate (30+ employees)
26 24
Large (10-30 employees) 8 10
Medium (5-9 employees) 4 -
Small (2-4 employees) 1 2
Unspecified 7 4
Profession of respondents
2014 2015
Design/Engineer 13 12
BIM Professional 9 13
Project Manager 4 2
QS 3 4
Construction 5 3
Other (incl. Government, model creation, etc.)
4 6
Unspecified 8 -
1The researcher is a member of the NZ Research Association, ESOMAR, and Australian Market Research Society, bound by strict codes of research ethics and requirements.
A little about the control group businesses:
85% of these businesses used BIM in the last 12 months, and 93% plan to in the next 12 months. (One has not specified what their use will be in the next 12 months.)
4
BIM in New Zealand — an industry-wide view 2015

Increasing BIM use is about two things – firstly increasing the number of businesses that utilise BIM in their projects, and secondly increasing the proportion of projects that each business uses BIM within.
We asked the control group in 2014 and 2015 to estimate the proportion of their projects that use BIM a) in the last 12 months; and b) in the next 12 months.
This gives us the proportion of projects using BIM in 2014 (actual), 2015 (predicted and actual), and 2016 (predicted). Responses to this question are shown in the chart below:
BIM use in the workflow for our control group?
Estimated proportion of projects that use BIM
No projects use BIM
Between 1-10% of
projects use BIM
Between 11-30% of
projects use BIM
Between 31-60% of
projects use BIM
Between 61-90%of
projects use BIM
From 91% to all
projects use BIM
0% 2%5%
26%
32%
10%
15%
7%
24%
20%
13%
20%
28%
25%20%
11%8%
28%
2014 actual 2015 predicted 2015 actual 2016 predicted
Base: 2014 n=46; 2015 n=40
25%
10%
32%33%
The average proportion of projects within each company that use BIM has increased 11 percentage points, from 34% of projects in 2014 to 45% in 2015.
5
BIM in New Zealand — an industry-wide view 2015

Survey participants were asked in which parts of the project lifecycle they had utilised BIM in the last 12 months, or planned to use it in the next 12 months. The chart below shows increase in actual use of BIM in each of the pre-planning, design, and construct phases. However the operate phase appears to have declined, with only 5% saying they’ve used BIM in this phase in
the last 12 months. Interestingly, the operate phase shows strong intention to use, though the reality doesn’t match intention. Some of the comments from open-ended questions highlight potential reasons for this – specifically that it isn’t as valued by clients as it could be, and the operate phase isn’t necessarily considered in the initial phases.
What is BIM being used for?
BIM use across project life cycle
Planning or pre-design Design Construct Operate
2014 ACTUAL PREDICTED2015 2016
83% 83%
93%
75% 78%
5%
33% 35%
61%
65%67%
59%
15%
BASE: All respondents 2014 n=46; 2015 n=40
Q. For which project life cycle stages has/will BIM be used? Please select all that apply.
6
BIM in New Zealand — an industry-wide view 2015

BIM uses in detailIf we look at what was actually used 2014 and 2015 (as opposed to predicted use) we can start to see some shifts in the types of BIM use. There have been large increases in use of Design Review, Spatial Programming,
and Construction System Design, alongside slight declines in the use of Building Preventative Maintenance, Asset Management, Digital Fabrication, and Record Modelling.
BIM uses (actual only) 2014 – 20153D Coordination
Design Review
Existing Conditions Modelling
Design Authoring
Site Analysis
Cost Estimation
Phase Planning (4D Modelling)
Spatial Programming
Construction System Design
Engineering Analysis – Structural
Record Modelling
3D Control and Planning
Engineering Analysis – Mechanical
Site Utilisation Planning
Engineering Analysis – Lighting
Engineering Analysis – Energy
Engineering Analysis – Other
Digital Fabrication
Engineering Analysis – Fire
Asset Management
Space Management and Tracking
Sustainability (Green Star / NABERS) Evaluation
Code Validation
Building System Analysis
Disaster Planning
Building (Preventative) Maintenance Scheduling
0 20% 40% 60% 83%
83%
75%
70%
55%
40%
38%
80%
60%
62%
47%
38%
29%
38%
38%
33%
30%
28%
25%
40%
24%
16%
22%
36%
18%
23%
23%
18%
15%
13%
13%
20%
18%
16%
11%
7%
16%
10%
10%
10%
5%
3%
3%
7%
16%
16%
4%
4%
2%
3%
0%
2%
7%
2014 actual 2015 actual
Base: All respondents 2014 n=46; 2015 n=40
Q. Which of the following BIM uses have you used in the last 12 months and how do you predict you will use in the 12 months ahead? Please select all that apply for each option.
7
BIM in New Zealand — an industry-wide view 2015
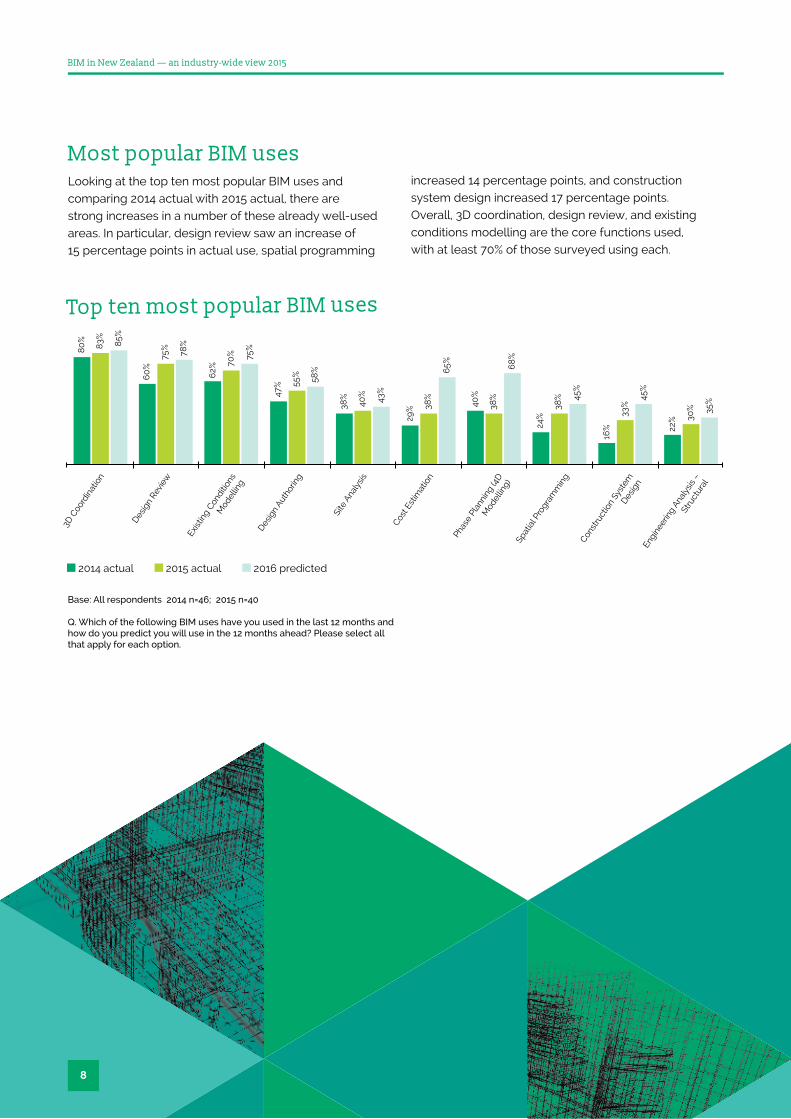
Most popular BIM usesLooking at the top ten most popular BIM uses and comparing 2014 actual with 2015 actual, there are strong increases in a number of these already well-used areas. In particular, design review saw an increase of 15 percentage points in actual use, spatial programming
increased 14 percentage points, and construction system design increased 17 percentage points. Overall, 3D coordination, design review, and existing conditions modelling are the core functions used, with at least 70% of those surveyed using each.
3D
Coo
rdin
atio
n
Exist
ing
Condi
tions
Mod
ellin
g
Site
Ana
lysis
Phas
e Pl
anni
ng (4
D
Mod
ellin
g)
Const
ruct
ion
Syst
em
Des
ign
Des
ign
Revie
w
Des
ign
Autho
ring
Cost E
stim
atio
n
Spat
ial P
rogr
amm
ing
Engi
neer
ing
Analy
sis –
Stru
ctur
al
Top ten most popular BIM uses
80
%
60
%
62%
47%
38%
29% 40
%
24%
16% 22
%
83%
75%
70%
55%
40%
38%
38%
38%
33%
30%
85%
78%
75%
58%
43%
65% 68
%
45%
45%
35%
2014 actual 2015 actual 2016 predicted
Base: All respondents 2014 n=46; 2015 n=40
Q. Which of the following BIM uses have you used in the last 12 months and how do you predict you will use in the 12 months ahead? Please select all that apply for each option.
8
BIM in New Zealand — an industry-wide view 2015
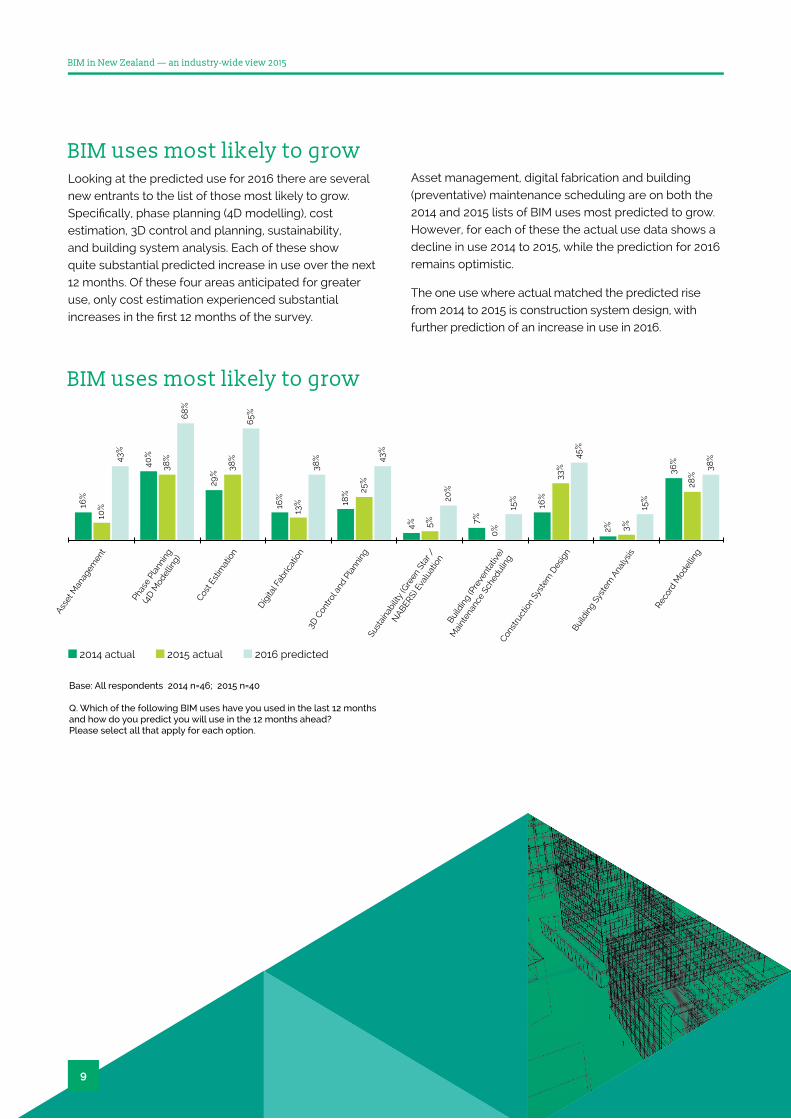
BIM uses most likely to growLooking at the predicted use for 2016 there are several new entrants to the list of those most likely to grow. Specifically, phase planning (4D modelling), cost estimation, 3D control and planning, sustainability, and building system analysis. Each of these show quite substantial predicted increase in use over the next 12 months. Of these four areas anticipated for greater use, only cost estimation experienced substantial increases in the first 12 months of the survey.
Asset management, digital fabrication and building (preventative) maintenance scheduling are on both the 2014 and 2015 lists of BIM uses most predicted to grow. However, for each of these the actual use data shows a decline in use 2014 to 2015, while the prediction for 2016 remains optimistic.
The one use where actual matched the predicted rise from 2014 to 2015 is construction system design, with further prediction of an increase in use in 2016.
Asset
Man
agem
ent
Cost E
stim
atio
n
3D C
ontro
l and
Pla
nnin
g
Build
ing
(Pre
vent
ativ
e)
Mai
nten
ance
Sch
edul
ing
Build
ing
Syst
em A
naly
sis
Phas
e Pl
anni
ng
(4D
Mod
ellin
g)
Dig
ital F
abric
atio
n
Sust
aina
bilit
y (G
reen
Sta
r /
NABER
S) E
valu
atio
n
Const
ruct
ion
Syst
em D
esig
n
Recor
d M
odel
ling
BIM uses most likely to grow
43%
10%16
%
38%
28%36
%
15%
3%2%
45%
33%
16%
15%
0%
7%
20%
5%4%
43%
25%
18%
38%
13%16
%
65%
38%
29%
68
%
38%
40%
2014 actual 2015 actual 2016 predicted
Base: All respondents 2014 n=46; 2015 n=40
Q. Which of the following BIM uses have you used in the last 12 months and how do you predict you will use in the 12 months ahead? Please select all that apply for each option.
99
BIM in New Zealand — an industry-wide view 2015
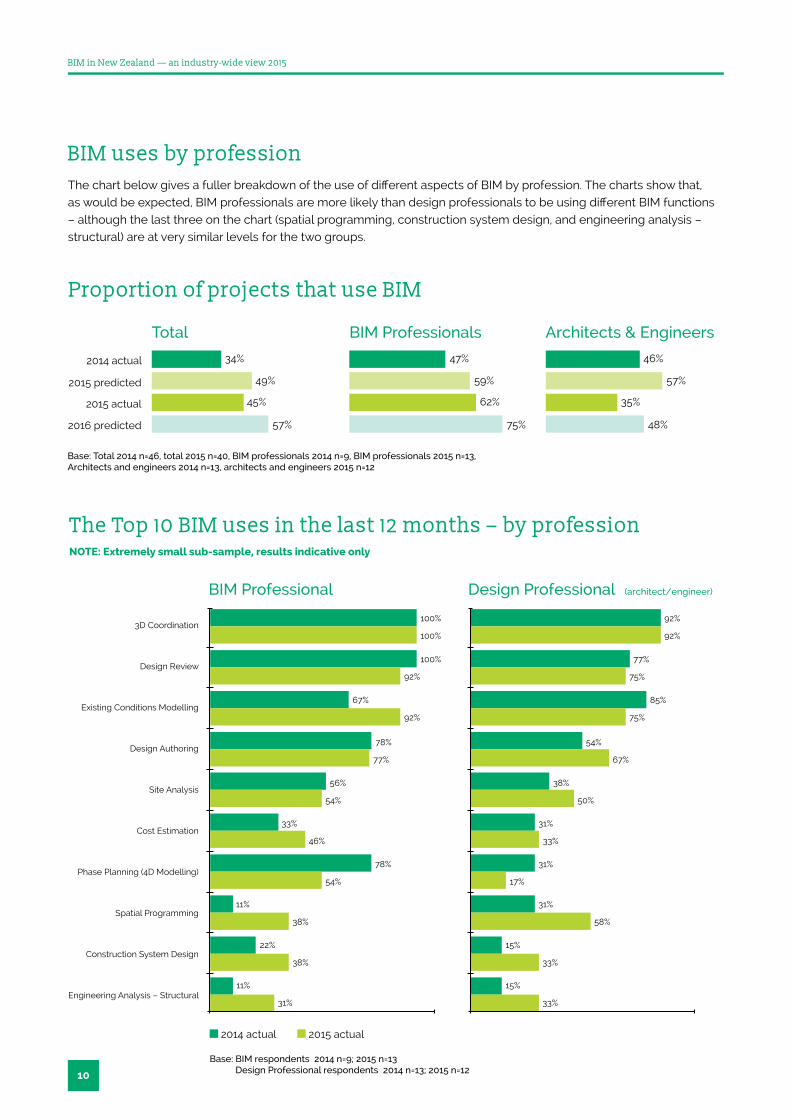
BIM uses by professionThe chart below gives a fuller breakdown of the use of different aspects of BIM by profession. The charts show that, as would be expected, BIM professionals are more likely than design professionals to be using different BIM functions – although the last three on the chart (spatial programming, construction system design, and engineering analysis – structural) are at very similar levels for the two groups.
Proportion of projects that use BIM
2014 actual
2015 actual
2015 predicted
2016 predicted
34% 47% 46%
45% 62% 35%
49% 59% 57%
57% 75% 48%
Total BIM Professionals Architects & Engineers
Base: Total 2014 n=46, total 2015 n=40, BIM professionals 2014 n=9, BIM professionals 2015 n=13, Architects and engineers 2014 n=13, architects and engineers 2015 n=12
The Top 10 BIM uses in the last 12 months – by profession NOTE: Extremely small sub-sample, results indicative only
3D Coordination
Design Review
Existing Conditions Modelling
Design Authoring
Site Analysis
Cost Estimation
Phase Planning (4D Modelling)
Spatial Programming
Construction System Design
Engineering Analysis – Structural
BIM Professional Design Professional
100%
100%
78%
33%
11%
67%
56%
78%
22%
11%
100%
92%
77%
46%
38%
92%
54%
54%
38%
31%
92%
77%
54%
31%
31%
85%
38%
31%
15%
15%
92%
75%
67%
33%
58%
75%
50%
17%
33%
33%
2014 actual 2015 actual
Base: BIM respondents 2014 n=9; 2015 n=13 Design Professional respondents 2014 n=13; 2015 n=12
(architect/engineer)
10
BIM in New Zealand — an industry-wide view 2015

At the consultant/sub-contractor level there is a lack of knowledge, and the subsequent inaccuracies in what they create, means those downstream and clients get a sub-optimal experience/understanding of BIM. This means that the benefit of BIM diminishes as clients don’t see the full value it can offer.
There appears to be divide between the BIM authors and the people selling BIM. The technical people being good on executing but not on knowing enough about construction and design. The lack of understanding from both sides needs some bridging with a greater sharing of knowledge from both parties.
Barriers to BIM uptake
“Project managers thinking they understand
BIM and want BIM but issue contracts that do
not allow for or include BIM. Lack of project
management and planning to allow design
teams the time frames required to work in a
cohesive manner. Project managers keeping
themselves between design team members
interrupting the integrated design process.”
“Discrepancy between those who have the
knowledge (i.e. more senior / experienced
designers) and those that are BIM-enabled /
software adept.”
“In the past, I might have said that bad quality
models from various subs or consultants
were an obstacle but we now make a real
effort to work only with BIM capable external
parties – or we simply have those disciplines
re-modelled in-house or elsewhere.”
As in 2014, survey participants were asked what they believed were the obstacles or issues their company has faced when using BIM. Ultimately, knowledge is the biggest issue across the board, but for different reasons.
11
BIM in New Zealand — an industry-wide view 2015
In addition, BIM is seen as adding significant time cost to a project and mentioned as only really being used on the bigger projects that can handle that cost.
“Only been adopted on larger
projects and still dependant on
the consultants’ ability to resource
and to have adopted BIM.”
“Most projects, especially those of a certain size,
do not warrant the additional time required to produce
the equivalent quality documentation during the
design phase. This means most design jobs are not
financially viable in BIM.”
The clients do not understand the potential benefits of BIM over the life of a building. This may be because their experience of BIM has been sub-optimal, or it could be that those selling BIM don’t understand the benefits to clients. In these cases, BIM is at risk of being seen as a buzzword that doesn’t deliver on its promise.
“Clients understanding of their requirements and future
use of BIM is an obstacle, likewise consultants’ ability to
deliver/perform as expected/agreed. There is still a lack of
understanding within our own company of what BIM is and that
it isn’t just the environment in which we design, there is more
to it and that it is a collaborative effort, we can’t develop and
deliver BIM without consultants and/or contractors involved
and playing the same game.”
12
BIM in New Zealand — an industry-wide view 2015

Enabling increased use of BIM
“Train and employ more
BIM people. Educate site
teams how to extract
benefits of BIM.”“Make sure the key decision
makers in company and in
project understand the BIM
process (in projects) and
the implications it has on
the design (and business)
processes.”
“Increased Client
awareness of BIM
would allow for a more
educated approach to
the implementation of
lifecycle uses."
“Consultants would need to
regularly keep their models
up to date with all changes,
and be trained how to
model accurately.”
“I would like to see greater
maturity from design
consultants in terms of
sharing models. Let’s lose
the FOR INFORMATION
ONLY disclaimers and be
accountable for the quality
of our models.”
More people specifically trained in BIM.
A clear definition of BIM project outcomes for clients and consultants, and at more senior levels in the industry.
More accurate modelling from consultants.
Survey participants were asked what would enable their company to use BIM more often, similar themes to those from 2014 emerged. While several referenced the recent industry training as being a positive start, there needs to be more of this.
“ Education within the practice and industry about how to undertake BIM projects. The recent industry training was a start, however the cost of it seemed to be prohibitive to getting more senior management along. I do believe there may be a change to this happening in the future.”
Responses to this question specifically talked about:
13
BIM in New Zealand — an industry-wide view 2015

“Increased client awareness of BIM would allow for a more
educated approach to the implementation of lifecycle
uses. This would engage BIM teams earlier in the process,
increasing the accuracy and reliability of data streams and
reinforcing the collaborative effort.”
The education around BIM needs to be holistic – starting with clients (creating client demand for BIM up front and the client understanding of the BIM outcomes longer term). Within this there then needs to be greater transparency and sharing across the ecosystem so that the industry can work together to improve the quality of the work being done.
“The industry has moved on a lot in 12 months. Construction is starting to adopt. Operation is where effort is needed.”
“Needs to be an industry
adopted standard rather
than an option dependant
on whether the client wants
to pay the extra costs for
the smaller projects.”
Becoming the industry adopted standard.
“Being the first thing
that project managers/
consultants talk about.
Becoming a service to the
company rather than a tool
the company uses when
needed.”
Talking about BIM right at the beginning stages of a project, before it reaches design.
14
BIM in New Zealand — an industry-wide view 2015

The upshot of enabling wider use of BIM is clear – better coordination at all levels. Those who are using BIM now talk about the additional benefit being coordination between disciplines and greater efficiency as a result. The coordination comes from better communication, better clarity and understanding of the design, and fewer issues across the project.
The benefits of that improved coordination for consultants and contractors is that they can start to build a better reputation among clients, ultimately impacting their bottom line.
The benefits in increased use of BIM
“Ability to provide a far better coordinated design. Benefits beyond that have not really been tested beyond our borders (QS, Contractor, etc.). But to be honest the buzz around BIM has faded for me. Nothing significant has changed in the 10 years since I first heard the term.”
“Efficiency gains major reduction in rework.”
“Early identification of design and build-ability issues. Greater collective understanding of design. Greater accuracy in terms of quantification and estimation. Greater awareness of issues with construction sequence and programme. Attractive to prospective staff members.”
“Our BIM teams have benefited from better coordination of design consultants models, and the use of metadata to reliably control scheduling and documentation. Also effective coordination of sub-contractor fabrication models using BIM, has expedited the construction process resulting in reduced construction problems, time extensions and cost claims.”
“Being able to demonstrate to a client that “this is what we did” compared to “this is what is required” (scenario comparing tender work vs. actual work).”
“Vastly improved coordination. Improved reputation with clients. More to come, watch this space.”
15
BIM in New Zealand — an industry-wide view 2015

Survey participants were asked about the importance of the government’s role as a client in accelerating the development and use of BIM in New Zealand. As the chart below shows, the government’s role as a client remains critical – government and industry partnerships playing a strong role in BIM acceleration and development. In 2015 only 11% stated they thought the government’s role was unimportant or detrimental to development.
The Government role as a client using BIM
The importance of the Government’s role as a client in accelerating the development and use of BIM within New Zealand
15%
3%
4% 4% 22%
16%
30%
32%
24%
41%
Una
nsw
ered
Det
rimen
tal t
o Acc
eler
atio
nN
ot Im
porta
nt
Som
ewha
t Im
porta
nt
Very
Impo
rtant
Vital t
o Acc
eler
atio
n
8%
2015
2014
BASE: All respondents 2014 n=46; 2015 n=40
Q. Do you consider Government’s role as a client to be an important factor in accelerating the development and use of BIM within New Zealand?
16
BIM in New Zealand — an industry-wide view 2015
Summary & conclusions
Twelve months on from the first survey of the BIM control group, the data shows positive momentum in the use of BIM among these businesses. In 2014 34% of projects used BIM and this has increased to 45% in 2015. In particular there have been increases in the use of BIM in both the design and construct phases of the project lifecycle (design 67% in 2014, 83% in 2015; construct 59% in 2014, 75% in 2015).
It is interesting to look at the actual increase versus the predicted increase in BIM use in 2015, in an effort to understand what we might see in 2016. The actual use of BIM in 2015 was 45% of projects, while the prediction was that it would be used in 49% of projects. This slight difference seems to largely come from overly optimistic predictions from those in design and engineering roles – who anticipated using BIM in 57% of projects, but actually saw a decline in use from 46% in 2014 to 35% in 2015.
By contrast, predictions from BIM professionals were more accurate, with the actual use of 62% of projects exceeding the predicted 59%, and representing a strong increase from the 47% of projects in 2014.
Looking to 2016 a continued increased used of BIM is predicted. It is anticipated BIM will be used in 57% of projects, particularly in the use of Asset Management, Phase Planning (4D Modelling), Cost Estimation, and Digital Fabrication.
Survey participants were asked to provide comment on obstacles they see to using BIM more within their businesses and what is needed to increase the use of BIM. Several of the comments centred on a need to link up industry knowledge and expertise with BIM operation.
In addition to this, several talked about the need to ensure clients were receiving the full value from BIM projects to ensure they continued to include BIM in future projects. From the perspective of survey participants this means ensuring the operate (i.e. facilities and asset management) side of BIM is utilised – realising the value over the lifecycle of the building, not just in the design and construct phases.
Beyond this, the role of the government as a client is increasingly important. When “unanswered” responses are removed from 2014, the proportion saying the Government’s role is very or vitally important has gone from 54% in 2014 to 73% in 2015.
The BIM control group is a sample of 46 businesses or individuals who have been identified as key users of BIM technology within the building and construction industry. These businesses participated in a survey on BIM use in 2014, and the same businesses were re-approached in 2015 to complete the same survey. In 2015 40 of the original 46 organisations completed the survey. This represents a response rate of 87%.
In conclusion, therefore, we can be pleased at the continuing increase in BIM usage amongst the benchmark survey group and the intentions for increased use in the future, but more needs to be done in increasing usage of BIM models for asset and facilities management purposes. This may reflect the difficulty involved for those managing assets to move from a reactive maintenance to a planned maintenance regime, and is an area the BIM Acceleration Committee (BAC) will place more emphasis on in the upcoming year.
BAC welcome any suggestions industry participants may have on barriers to BIM acceptance, and what may be done to overcome these; and hopes that the recent formation of BIM Networks in Christchurch, Wellington and Auckland will facilitate industry feedback.
Finally, our huge thanks go again to EBOSS for managing and sponsoring this survey, and to the control group for their time, effort and generosity in participating.
17
BIM in New Zealand — an industry-wide view 2015