![My Journey to Billionaire Club[1]](https://static.fdocuments.us/doc/165x107/55cf9aa2550346d033a2ad9a/my-journey-to-billionaire-club1.jpg)
BILLIONAIRE CENSUS 2018 - wealthx.com · can be attributed both to inheritance and to self-made...
35
BILLIONAIRE CENSUS 2018 APPLIED WEALTH INTELLIGENCE
-
Upload
phungquynh -
Category
Documents
-
view
215 -
download
0
Transcript of BILLIONAIRE CENSUS 2018 - wealthx.com · can be attributed both to inheritance and to self-made...
BILLIONAIRE CENSUS 2018
APPLIED WEALTH INTELLIGENCE
© WEALTH-X 2018
THIS PUBLICATION IS FOR YOUR INFORMATION ONLY AND IS NOT INTENDED AS AN OFFER,
OR A SOLICITATION OF AN OFFER, TO BUY OR SELL ANY PRODUCT OR OTHER SPECIFIC SERVICE.
ALL INFORMATION AND OPINIONS INDICATED ARE SUBJECT TO CHANGE WITHOUT NOTICE.
NEW YORK142 W. 36TH STREET, 12TH FLOORNEW YORK, NY 10018UNITED STATES+1 877 887 8454
LONDON3RD FLOOR, NUFFIELD HOUSE, 41-46 PICCADILLY LONDON W1J 0DSUNITED KINGDOM +44 (0)20 3745 3000
DUBAI5TH FLOOR, SHEIKH RASHID TOWER DUBAI WORLD TRADE CENTRE PO BOX 487177 UNITED ARAB EMIRATES+971 4 889 5042
BILLIONAIRE CENSUS 2018

WEALTH-X BILLIONAIRE CENSUS 2018
TABLE OF CONTENTS
EXECUTIVE SUMMARY __________________________________________ 1
INTRODUCTION _______________________________________________ 2
GLOBAL BILLIONAIRE MAP _____________________________________ 3
BILLIONAIRE PERFORMANCE IN 2017 _____________________________ 5
THE VOLATILITY EFFECT _______________________________________ 7
BILLIONAIRE WEALTH TIERS ____________________________________ 11
TOP 10 BILLIONAIRE COUNTRIES _______________________________ 15
TOP 10 BILLIONAIRE CITIES ____________________________________ 17
TODAY’S BILLIONAIRES - ASSET HOLDINGS, INDUSTRY, GENDER AND WEALTH SOURCE ________________________________ 19
BILLIONAIRE INTERESTS, PASSIONS, AND HOBBIES ________________ 25
BILLIONAIRE ALMA MATERS ___________________________________29
BILLIONAIRE PHILANTHROPY __________________________________ 31
METHODOLOGY ______________________________________________ 35
ABOUT WEALTH-X ___________________________________________35
1WEALTH-X BILLIONAIRE CENSUS 2018
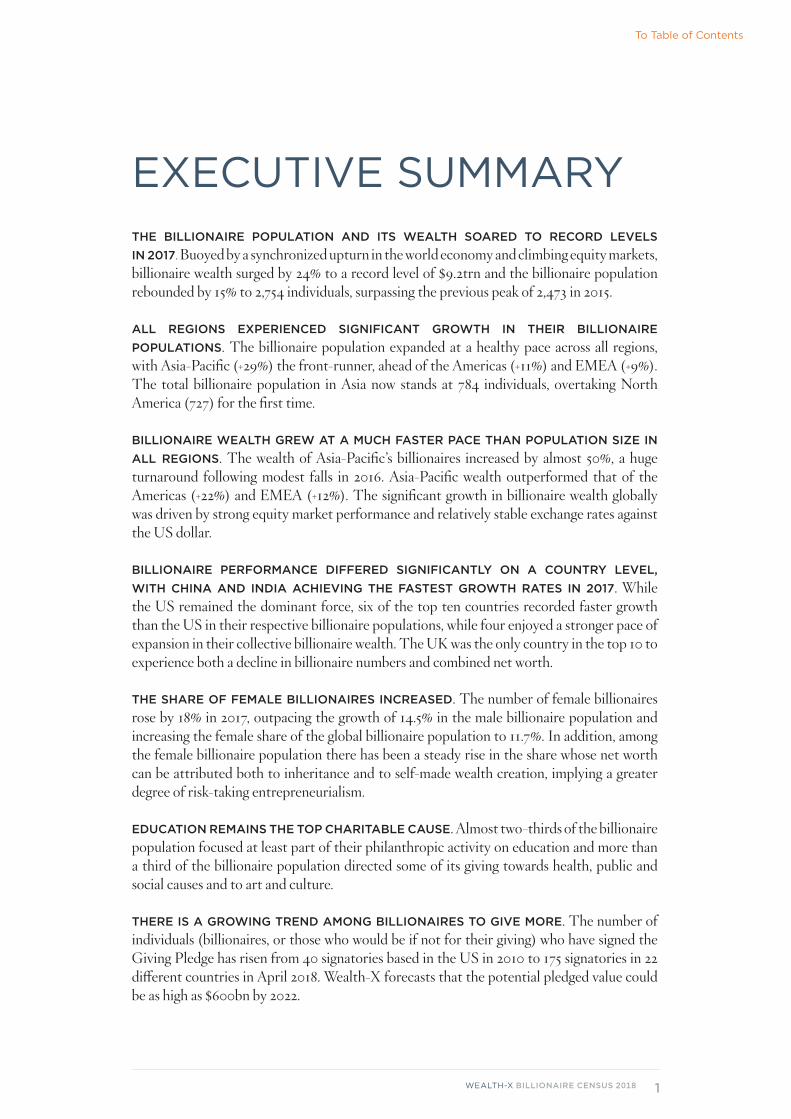
EXECUTIVE SUMMARYTHE BILLIONAIRE POPULATION AND ITS WEALTH SOARED TO RECORD LEVELS IN 2017. Buoyed by a synchronized upturn in the world economy and climbing equity markets, billionaire wealth surged by 24% to a record level of $9.2trn and the billionaire population rebounded by 15% to 2,754 individuals, surpassing the previous peak of 2,473 in 2015.
ALL REGIONS EXPERIENCED SIGNIFICANT GROWTH IN THEIR BILLIONAIRE POPULATIONS. The billionaire population expanded at a healthy pace across all regions, with Asia-Pacific (+29%) the front-runner, ahead of the Americas (+11%) and EMEA (+9%). The total billionaire population in Asia now stands at 784 individuals, overtaking North America (727) for the first time.
BILLIONAIRE WEALTH GREW AT A MUCH FASTER PACE THAN POPULATION SIZE IN ALL REGIONS. The wealth of Asia-Pacific’s billionaires increased by almost 50%, a huge turnaround following modest falls in 2016. Asia-Pacific wealth outperformed that of the Americas (+22%) and EMEA (+12%). The significant growth in billionaire wealth globally was driven by strong equity market performance and relatively stable exchange rates against the US dollar.
BILLIONAIRE PERFORMANCE DIFFERED SIGNIFICANTLY ON A COUNTRY LEVEL, WITH CHINA AND INDIA ACHIEVING THE FASTEST GROWTH RATES IN 2017. While the US remained the dominant force, six of the top ten countries recorded faster growth than the US in their respective billionaire populations, while four enjoyed a stronger pace of expansion in their collective billionaire wealth. The UK was the only country in the top 10 to experience both a decline in billionaire numbers and combined net worth.
THE SHARE OF FEMALE BILLIONAIRES INCREASED. The number of female billionaires rose by 18% in 2017, outpacing the growth of 14.5% in the male billionaire population and increasing the female share of the global billionaire population to 11.7%. In addition, among the female billionaire population there has been a steady rise in the share whose net worth can be attributed both to inheritance and to self-made wealth creation, implying a greater degree of risk-taking entrepreneurialism.
EDUCATION REMAINS THE TOP CHARITABLE CAUSE. Almost two-thirds of the billionaire population focused at least part of their philanthropic activity on education and more than a third of the billionaire population directed some of its giving towards health, public and social causes and to art and culture.
THERE IS A GROWING TREND AMONG BILLIONAIRES TO GIVE MORE. The number of individuals (billionaires, or those who would be if not for their giving) who have signed the Giving Pledge has risen from 40 signatories based in the US in 2010 to 175 signatories in 22 different countries in April 2018. Wealth-X forecasts that the potential pledged value could be as high as $600bn by 2022.
To Table of Contents
2WEALTH-X BILLIONAIRE CENSUS 2018
INTRODUCTIONThe new edition of the Wealth-X Billionaire Census reveals there was a dramatic improvement in billionaire performance in 2017. There are now more billionaires than ever before, powered by a dynamic growth in the number of billionaires in Asia (which, for the first time, overtook North America) and a vibrant technology sector. In a rapidly shifting geopolitical environment, the influence on the world economy of this most exclusive group of individuals is continuing to rise.
In this report we explore the drivers behind this growth, the power of financial markets and the impact of key political developments on billionaire net worth. We examine regional trends, from the rapid expansion of ultra wealth in Asia-Pacific to the more subdued growth in Europe, and highlight the substantial gains in net worth achieved by the world’s billionaires.
We analyze the main asset holdings, industry concentration and sources of wealth in the billionaire population and again draw on our extensive knowledge base to rank the leading billionaire countries and cities of the world. The report also delves into the interests and passions of the world’s billionaire population, surveying the expansion of billionaire investment across the sporting landscape and a growing interest in art collection. We consider the powerful ‘network effect’ among the world’s leading educational institutions for producing billionaires, and explore how growing social pressures on the super affluent to contribute to society are driving changes in philanthropic behavior. We also look ahead to consider some of the implications for wealth creation in 2018 of a potential return to volatility in financial markets.
Wealth-X’s comprehensive database of billionaires (as defined by net worth) provides an unrivaled insight into the status of the world’s wealthiest individuals, the constantly changing structure of the billionaire population and the emerging trends for future wealth creation.
To Table of Contents
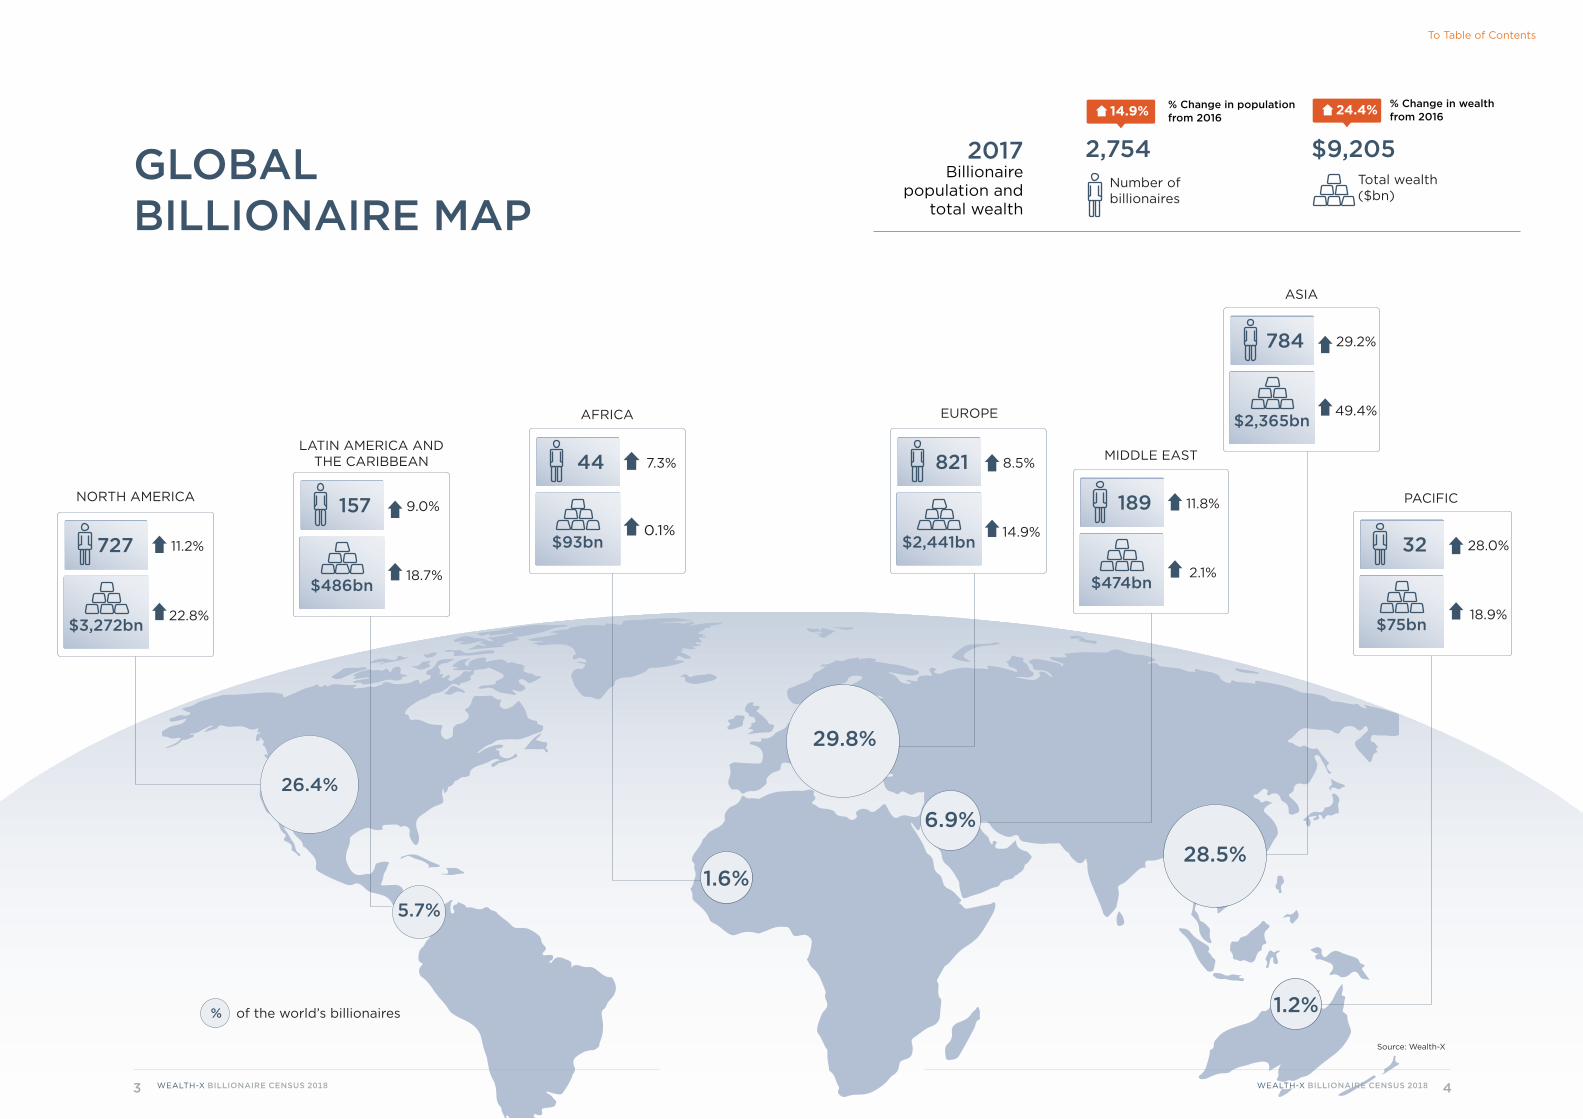
GLOBAL BILLIONAIRE MAP
% Change in wealth from 201624.4%% Change in population
from 201614.9%
2017Billionaire
population and total wealth
2,754Number of billionaires
$9,205Total wealth ($bn)
29.8%
26.4%
of the world’s billionaires%
AFRICA
$93bn0.1%
44 7.3%
EUROPE
$2,441bn14.9%
821 8.5% MIDDLE EAST
$474bn
189 11.8%
2.1%
ASIA
$2,365bn49.4%
784 29.2%
NORTH AMERICA
$3,272bn22.8%
727 11.2%
LATIN AMERICA AND THE CARIBBEAN
$486bn18.7%
157 9.0% PACIFIC
$75bn18.9%
32 28.0%
28.5%
6.9%
5.7%
1.6%
1.2%
GLOBAL BILLIONAIRE MAP
% Change in wealth from 201624.4%% Change in population
from 201614.9%
2017Billionaire
population and total wealth
2,754Number of billionaires
$9,205Total wealth ($bn)
Source: Wealth-X
4WEALTH-X BILLIONAIRE CENSUS 20183 WEALTH-X BILLIONAIRE CENSUS 2018
To Table of Contents
5WEALTH-X BILLIONAIRE CENSUS 2018
LOW VOLATILITY AND HIGH RETURNS
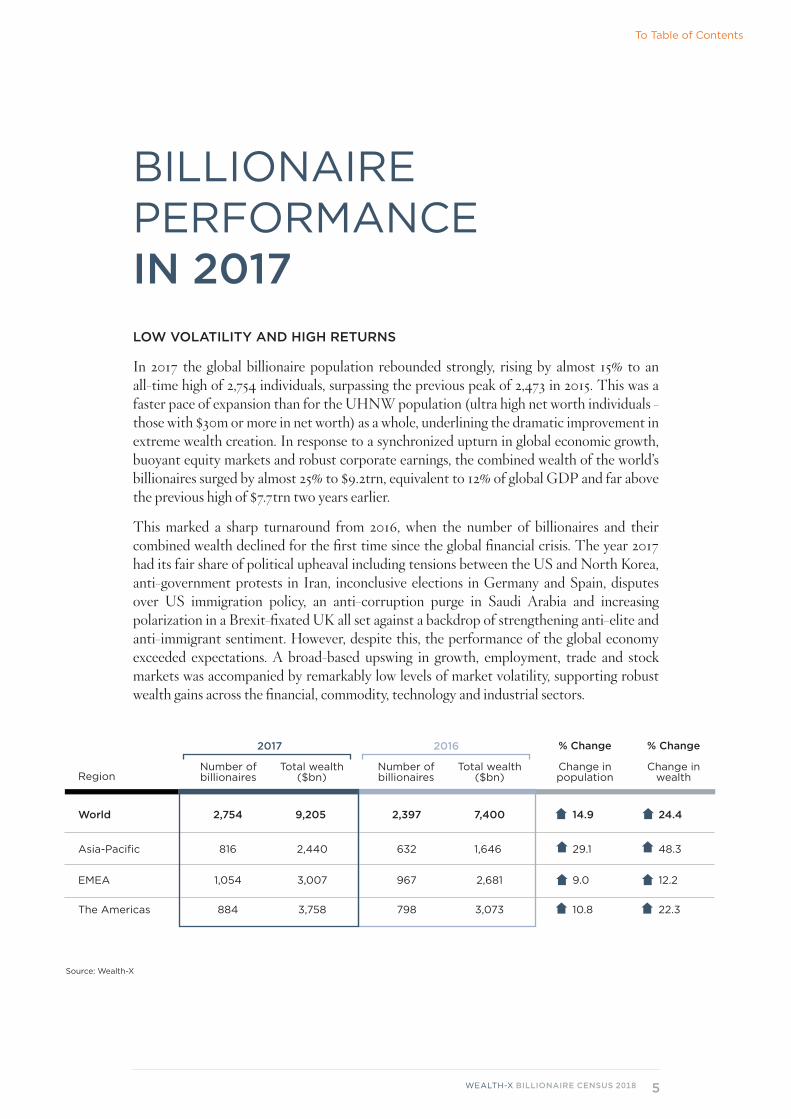
In 2017 the global billionaire population rebounded strongly, rising by almost 15% to an all-time high of 2,754 individuals, surpassing the previous peak of 2,473 in 2015. This was a faster pace of expansion than for the UHNW population (ultra high net worth individuals - those with $30m or more in net worth) as a whole, underlining the dramatic improvement in extreme wealth creation. In response to a synchronized upturn in global economic growth, buoyant equity markets and robust corporate earnings, the combined wealth of the world’s billionaires surged by almost 25% to $9.2trn, equivalent to 12% of global GDP and far above the previous high of $7.7trn two years earlier.
This marked a sharp turnaround from 2016, when the number of billionaires and their combined wealth declined for the first time since the global financial crisis. The year 2017 had its fair share of political upheaval including tensions between the US and North Korea, anti-government protests in Iran, inconclusive elections in Germany and Spain, disputes over US immigration policy, an anti-corruption purge in Saudi Arabia and increasing polarization in a Brexit-fixated UK all set against a backdrop of strengthening anti-elite and anti-immigrant sentiment. However, despite this, the performance of the global economy exceeded expectations. A broad-based upswing in growth, employment, trade and stock markets was accompanied by remarkably low levels of market volatility, supporting robust wealth gains across the financial, commodity, technology and industrial sectors.
BILLIONAIRE PERFORMANCE IN 2017
Region
2017 2016
Asia-Pacific
EMEA
The Americas
816
1,054
884
2,440
3,007
3,758
632
967
798
1,646
2,681
3,073
29.1
9.0
10.8
48.3
12.2
22.3
Number of billionaires
Number of billionaires
Change in population
Total wealth ($bn)
Total wealth ($bn)
Change in wealth
World 2,754 9,205 2,397 7,400 14.9 24.4
Source: Wealth-X
% Change % Change
To Table of Contents
6WEALTH-X BILLIONAIRE CENSUS 2018
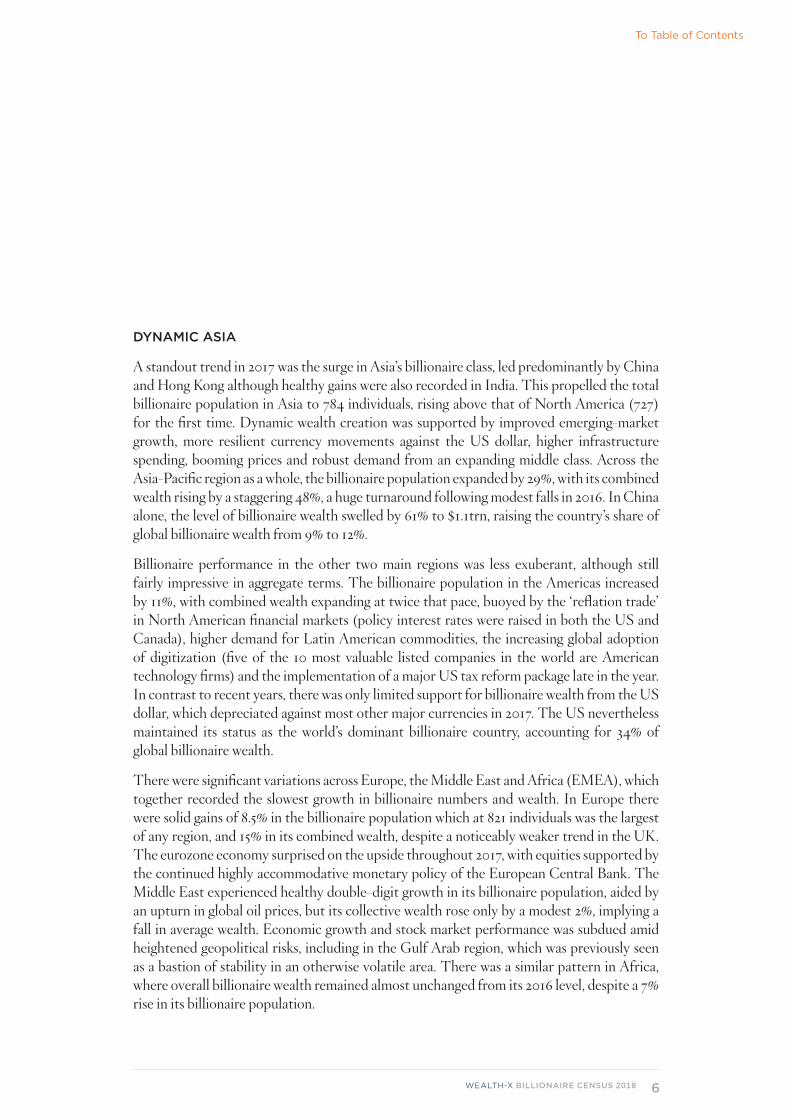
DYNAMIC ASIA
A standout trend in 2017 was the surge in Asia’s billionaire class, led predominantly by China and Hong Kong although healthy gains were also recorded in India. This propelled the total billionaire population in Asia to 784 individuals, rising above that of North America (727) for the first time. Dynamic wealth creation was supported by improved emerging-market growth, more resilient currency movements against the US dollar, higher infrastructure spending, booming prices and robust demand from an expanding middle class. Across the Asia-Pacific region as a whole, the billionaire population expanded by 29%, with its combined wealth rising by a staggering 48%, a huge turnaround following modest falls in 2016. In China alone, the level of billionaire wealth swelled by 61% to $1.1trn, raising the country’s share of global billionaire wealth from 9% to 12%.
Billionaire performance in the other two main regions was less exuberant, although still fairly impressive in aggregate terms. The billionaire population in the Americas increased by 11%, with combined wealth expanding at twice that pace, buoyed by the ‘reflation trade’ in North American financial markets (policy interest rates were raised in both the US and Canada), higher demand for Latin American commodities, the increasing global adoption of digitization (five of the 10 most valuable listed companies in the world are American technology firms) and the implementation of a major US tax reform package late in the year. In contrast to recent years, there was only limited support for billionaire wealth from the US dollar, which depreciated against most other major currencies in 2017. The US nevertheless maintained its status as the world’s dominant billionaire country, accounting for 34% of global billionaire wealth.
There were significant variations across Europe, the Middle East and Africa (EMEA), which together recorded the slowest growth in billionaire numbers and wealth. In Europe there were solid gains of 8.5% in the billionaire population which at 821 individuals was the largest of any region, and 15% in its combined wealth, despite a noticeably weaker trend in the UK. The eurozone economy surprised on the upside throughout 2017, with equities supported by the continued highly accommodative monetary policy of the European Central Bank. The Middle East experienced healthy double-digit growth in its billionaire population, aided by an upturn in global oil prices, but its collective wealth rose only by a modest 2%, implying a fall in average wealth. Economic growth and stock market performance was subdued amid heightened geopolitical risks, including in the Gulf Arab region, which was previously seen as a bastion of stability in an otherwise volatile area. There was a similar pattern in Africa, where overall billionaire wealth remained almost unchanged from its 2016 level, despite a 7% rise in its billionaire population.
To Table of Contents
7WEALTH-X BILLIONAIRE CENSUS 2018
THE VOLATILITY EFFECT
As we have highlighted, 2017 was an excellent year for the billionaire population and for net wealth creation. In this section we delve a little deeper into some of the main drivers of this improved performance, consider key geopolitical developments and their impact on net worth volatility and – mindful of an adjustment in financial-market sentiment in early 2018 – assess the near-term prospects for billionaire wealth creation.
NO FEAR
Perhaps the biggest surprise of all in 2017 was the lack of market surprises. Following a difficult period for the billionaire population in 2016, when asset portfolios were buffeted constantly by volatile shifts in capital markets and geopolitical instability, it is reasonable to assume that billionaire expectations heading into 2017 were not especially optimistic. And yet over the course of the year global equity bourses trended steadily higher, consumer and business demand firmed at an unexpectedly healthy rate, world trade strengthened to a six-year high and market volatility subsided to remarkably low levels. The Vix index, the ‘fear gauge’ commonly used in financial markets, declined to an all-time low in November, while its average reading in 2017 implied it was the least volatile year in decades.
More than anything, these developments emphasized that changes in billionaire wealth at an aggregate level remain far more closely linked to market forces than to the underlying political environment. The latter remained fraught with risk as civil unrest intensified across the Middle East, nuclear tensions ratcheted up between the US and North Korea, and populist anti-elite sentiment continued to spread, encouraged in no small part by the increasingly polarized tone of political discourse in the US and the UK.
TAX BILL TRUMPS ALL
The Donald Trump presidency introduced increased levels of unpredictability to US policymaking that would have been unimaginable only several years ago, characterized by grandiose announcements, often chaotic governance and regular stirring of America’s culture wars that reflected reasonably successful efforts to shore up the president’s political base and distract from legislative disappointments. Despite this unpromising backdrop, however, economic and capital markets flourished, driven by two dominant themes that while at times contradictory, provided strong support across a wide range of financial markets and industry sectors, delivering wealth gains for many of the world’s billionaires.
To Table of Contents

8WEALTH-X BILLIONAIRE CENSUS 2018
Most of the first half of the year saw markets still preoccupied with low inflation and concerns that growth might fade. This continued to underpin bond markets, as loose monetary policy also offered support to equities, not the least in the strongly performing secular growth sectors of tech and healthcare. A subdued US dollar encouraged capital inflows into many emerging economies, the reverse of developments in 2016, while commodity-exporting countries benefited from rising prices of oil and other raw material inputs.
From September onwards market sentiment shifted direction, as the ‘reflation trade’ gathered momentum on the back of the synchronized global upturn, further signs of a gradual normalization of global monetary policy and rising expectations of fiscal expansion in the US. These factors were equity-positive for sectors such as energy, retail, industry and financials, supporting a broad-based pick-up in capital market returns. The US tax reform bill was finally passed in December, with the contents of the legislation – which included cuts in corporate tax and more generous exemptions to gift and estate taxes – not only providing a substantial boost to billionaire wealth but also opening up numerous tax-planning opportunities over the coming years.
ASIAN REVIVAL
Among the world’s leading billionaire countries, the three that recorded the strongest growth in total net worth in 2017 – China, India and Hong Kong (see the section on Top 10 Billionaire countries) – clearly benefited from a much improved economic environment. However, new wealth creation can also be attributed in part to domestic policy initiatives. In China, gradual market openings and measures to liberalize property rights were aimed at stimulating private-sector investment alongside strong government support to expand the global market share of local firms in high-value sectors, such as robotics and semiconductors.
Across India, ongoing efforts to improve the business environment via tax reforms, infrastructure spending and market deregulation delivered positive investor gains and boosted net worth among the ultra rich. This momentum is likely to continue, as the combination of a young and expanding workforce, high savings rate and rapid urbanization drive one of Asia’s fastest-growing economies. For Hong Kong, increasing integration with mainland China is providing opportunities for wealth generation. Expansion of the Closer Economic Partnership Arrangement has strengthened the territory’s investment and trade rights in China compared with other foreign investors, while financial intermediation has been enhanced by changes to investors’ access to interbank markets and a direct trading link between the Hong Kong and Shenzhen bourses.
To Table of Contents
9WEALTH-X BILLIONAIRE CENSUS 2018
The robust gains in billionaire numbers and combined net worth in these countries in 2017 marked a welcome turnaround compared with developments a year earlier, when all three suffered a hit to their respective billionaire populations and total wealth (a severe hit, in the case of Hong Kong). It serves as a reminder of the significant exposure of the billionaire class to market adjustments (both up and down), particularly in Asia and Latin America, where great wealth is more unstable, partly owing to less diversified portfolios than in Europe and the US.
START-UPS, AND DOWNS
Amid the relatively serene progress of global billionaire wealth creation in 2017, some pockets of market-driven volatility did emerge, highlighting the fluctuating fortunes of extreme wealth creators and the challenges of wealth preservation. The crude oil market has experienced more than its share of instability over recent years and this continued, entering bear market territory in mid-2017 before a final-quarter rally driven by OPEC production cuts. In the technology sector, a growing number of ‘unicorn’ start-ups (private companies valued at over $1bn, backed by investors placing big bets on their future success) has opened up a niche channel for accelerated wealth generation for some individuals although, as events throughout the year showed, it can be a transitory visit into the billionaire class.
More extreme still, the advent of blockchain technology and the exposure of hyper-speculative cryptocurrencies to a wider audience introduced a whole new level of elasticated volatility to net worth. On one hand, this created the world’s first-ever cryptocurrency billionaire, Chris Larsen. On the other, it propelled the likes of the Winklevoss brothers in and out of billionaire status in a short space of time. The broader point to take from such developments is that the possibility of being thrust from sub-UHNW levels straight into the billionaire population can no longer be considered largely the preserve of young heirs and heiresses, who join via inheritance or wealth transfer planning.
POLITICS MATTERS
While economics may largely trump geopolitics at a global level when examining the impact on billionaire wealth, political developments at a localized level can still have a notable effect on a country’s billionaire population and the conditions for wealth preservation. A case in point is Saudi Arabia, where an ongoing reform drive headed by the crown prince and defense
To Table of Contents

10WEALTH-X BILLIONAIRE CENSUS 2018
minister, Mohammed bin Salman Al Saud, encompassed a major anti-corruption purge (viewed in some quarters as an effort to weaken would-be rivals within the royal family) that led to the arrest of more than 200 individuals, including princes, prominent businessmen and public officials. Most were subsequently released after reaching financial settlements with the authorities that included asset confiscation. Not surprisingly the latest estimate of combined billionaire wealth in the country took a tumble in 2017.
In Russia, billionaire net worth expanded on an aggregate basis, supported in part by the improvement in oil prices and a gradual upturn in the domestic economy. However, the size of the country’s billionaire class declined, possibly linked to the squeeze on parts of the Russian financial, energy and defense sectors from EU and US sanctions (new targeted sanctions on a small number of prominent wealthy individuals and their related companies were announced by the US in April 2018). Meanwhile, the billionaire class in the UK took a Brexit hit from a slowdown of the economy – contrasting sharply with the improved trend across the euro-zone – and from the fallout related to the country’s gradual diminishment on the global stage and the government’s handling of exit negotiations.
A RETURN TO VOLATILITY?
Following a bumper year for financial markets and billionaire net worth in 2017, the jury is still out on the prospects for wealth creation and preservation in 2018. The overall global economic backdrop remained strong in the first quarter and official full-year growth projections for the world’s leading economies point to another year of healthy expansion. Global employment is still rising steadily, inflationary pressures are relatively benign and monetary policy is still loose (notwithstanding an expected further gradual withdrawal from post-crisis stimulus measures by major central banks this year). The recent US tax reform is likely to provide a modest boost to growth in the world’s largest economy, eurozone fundamentals are much improved from several years ago and the broad outlook for Asia remains positive.
It should be noted, however, that the buoyant mood of markets in late 2017 has since become more tempered in response to a moderate pull-back in global activity indicators, a US-led rise in protectionism and deeper geopolitical concerns in the Middle East. The Vix index jumped by its largest amount in six years in the opening quarter of 2018 as global stock markets fell amid some investor unease over the escalation of global trade tensions, the prospect of higher interest rates and perhaps a dawning reality that the decade-long flow of abundant and cheap central bank liquidity is now being steadily tightened. No one really knows what the consequences of this shift away from easy money will be for financial markets. Some investors may be wary of the elevated price-earnings ratio of US stocks (at its highest level since the dotcom bubble) or the risk of an unexpected slowdown in China. How will the technology sector react to the Facebook data privacy scandal or President Trump’s criticism of Amazon? One thing is clear. For now, at least, volatility has returned.
To Table of Contents
12WEALTH-X BILLIONAIRE CENSUS 201811 WEALTH-X BILLIONAIRE CENSUS 2018
BILLIONAIRE WEALTH TIERS
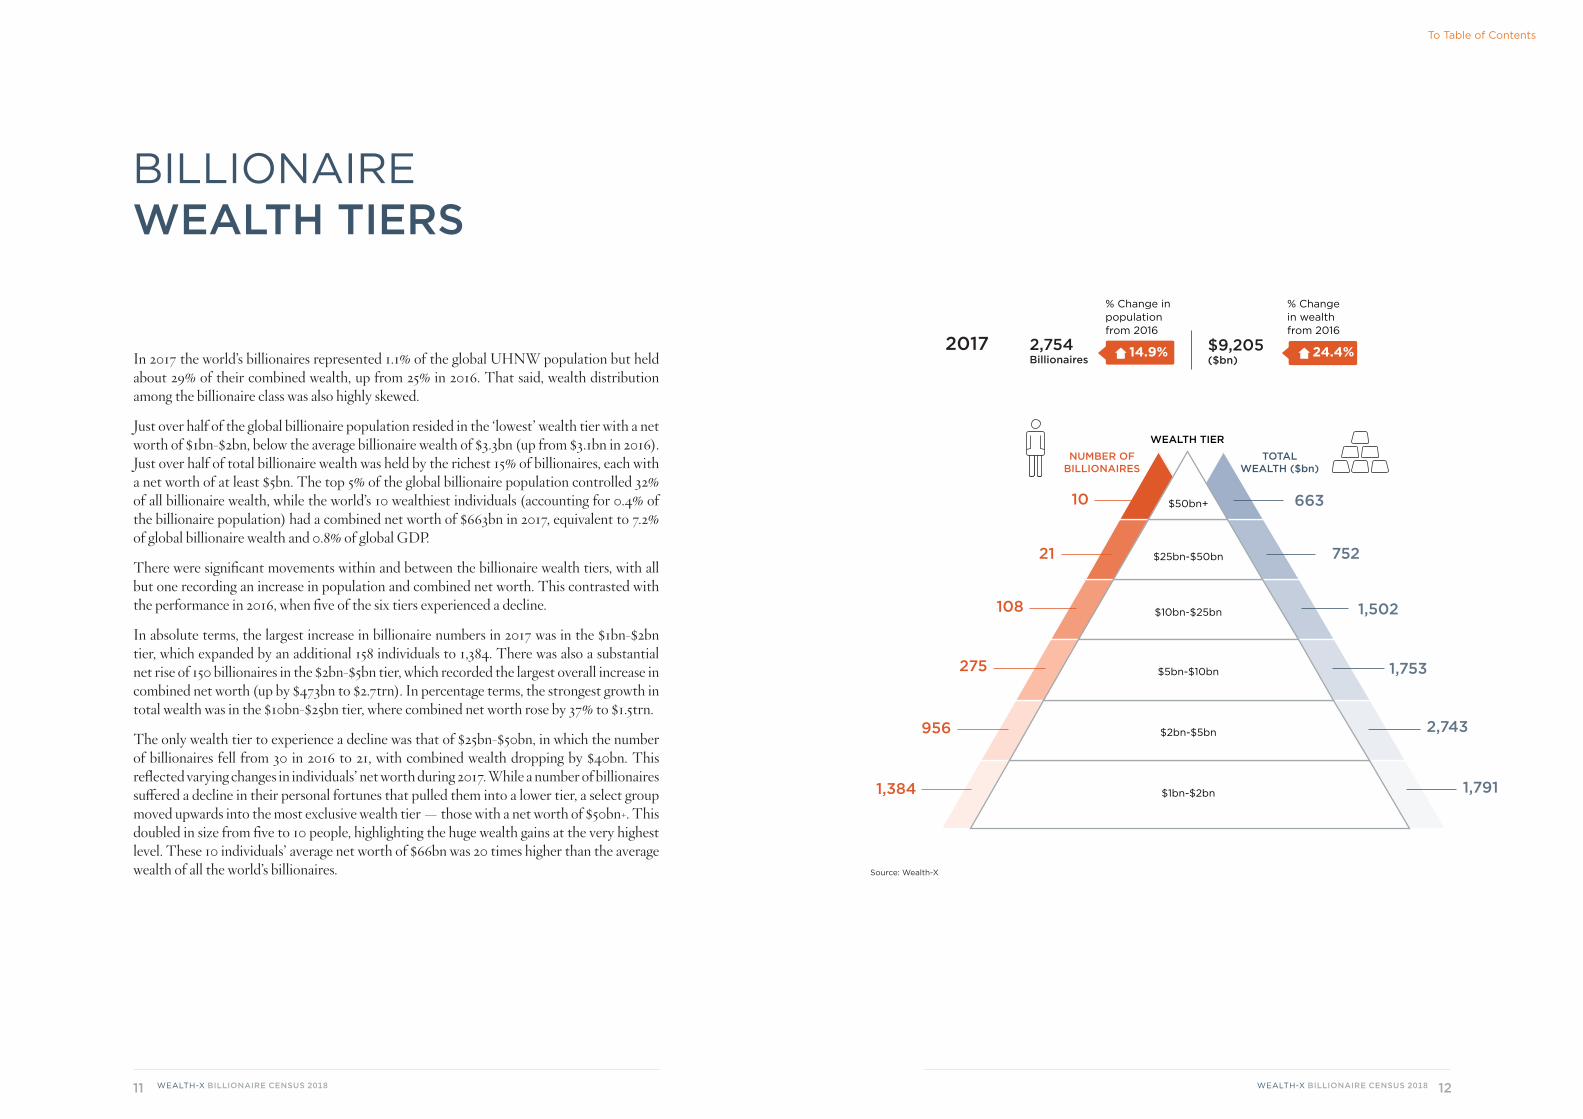
In 2017 the world’s billionaires represented 1.1% of the global UHNW population but held about 29% of their combined wealth, up from 25% in 2016. That said, wealth distribution among the billionaire class was also highly skewed.
Just over half of the global billionaire population resided in the ‘lowest’ wealth tier with a net worth of $1bn-$2bn, below the average billionaire wealth of $3.3bn (up from $3.1bn in 2016). Just over half of total billionaire wealth was held by the richest 15% of billionaires, each with a net worth of at least $5bn. The top 5% of the global billionaire population controlled 32% of all billionaire wealth, while the world’s 10 wealthiest individuals (accounting for 0.4% of the billionaire population) had a combined net worth of $663bn in 2017, equivalent to 7.2% of global billionaire wealth and 0.8% of global GDP.
There were significant movements within and between the billionaire wealth tiers, with all but one recording an increase in population and combined net worth. This contrasted with the performance in 2016, when five of the six tiers experienced a decline.
In absolute terms, the largest increase in billionaire numbers in 2017 was in the $1bn-$2bn tier, which expanded by an additional 158 individuals to 1,384. There was also a substantial net rise of 150 billionaires in the $2bn-$5bn tier, which recorded the largest overall increase in combined net worth (up by $473bn to $2.7trn). In percentage terms, the strongest growth in total wealth was in the $10bn-$25bn tier, where combined net worth rose by 37% to $1.5trn.
The only wealth tier to experience a decline was that of $25bn-$50bn, in which the number of billionaires fell from 30 in 2016 to 21, with combined wealth dropping by $40bn. This reflected varying changes in individuals’ net worth during 2017. While a number of billionaires suffered a decline in their personal fortunes that pulled them into a lower tier, a select group moved upwards into the most exclusive wealth tier — those with a net worth of $50bn+. This doubled in size from five to 10 people, highlighting the huge wealth gains at the very highest level. These 10 individuals’ average net worth of $66bn was 20 times higher than the average wealth of all the world’s billionaires.
NUMBER OF BILLIONAIRES
TOTAL WEALTH ($bn)
$1bn-$2bn
$2bn-$5bn
$5bn-$10bn
$10bn-$25bn
$25bn-$50bn
$50bn+10
21
108
275
956
1,384
663
752
1,502
1,753
2,743
1,791
WEALTH TIER
$9,205 ($bn)
2,754Billionaires
2017 24.4%
% Change in wealth from 2016
% Change in population from 2016
Source: Wealth-X
14.9%
To Table of Contents

13WEALTH-X BILLIONAIRE CENSUS 2018
Wealth tier ($)
GROWTH RATE 2016-2017
ABSOLUTE CHANGE 2016-2017
$25bn-50bn
$10bn-25bn
$5bn-10bn
Number of billionaires
Number of billionaires
Total wealth ($bn)
Total wealth ($bn)
$50bn +
$2bn-5bn
$1bn-2bn
Total
-30%
19%
15%
100%
19%
13%
-5%
37%
29%
110%
21%
-14%
-40
402
396
347
473
226
-9
17
36
5
150
158
Source: Wealth-X
15% 24% 357 1,804
To Table of Contents
14WEALTH-X BILLIONAIRE CENSUS 2018
rising above that of NORTH AMERICA (727) for the first time.
ASIA EXPANDED TO 784 INDIVIDUALS,
Led by China, Hong Kong and India, the total BILLIONAIRE POPULATION in
To Table of Contents
15 WEALTH-X BILLIONAIRE CENSUS 2018
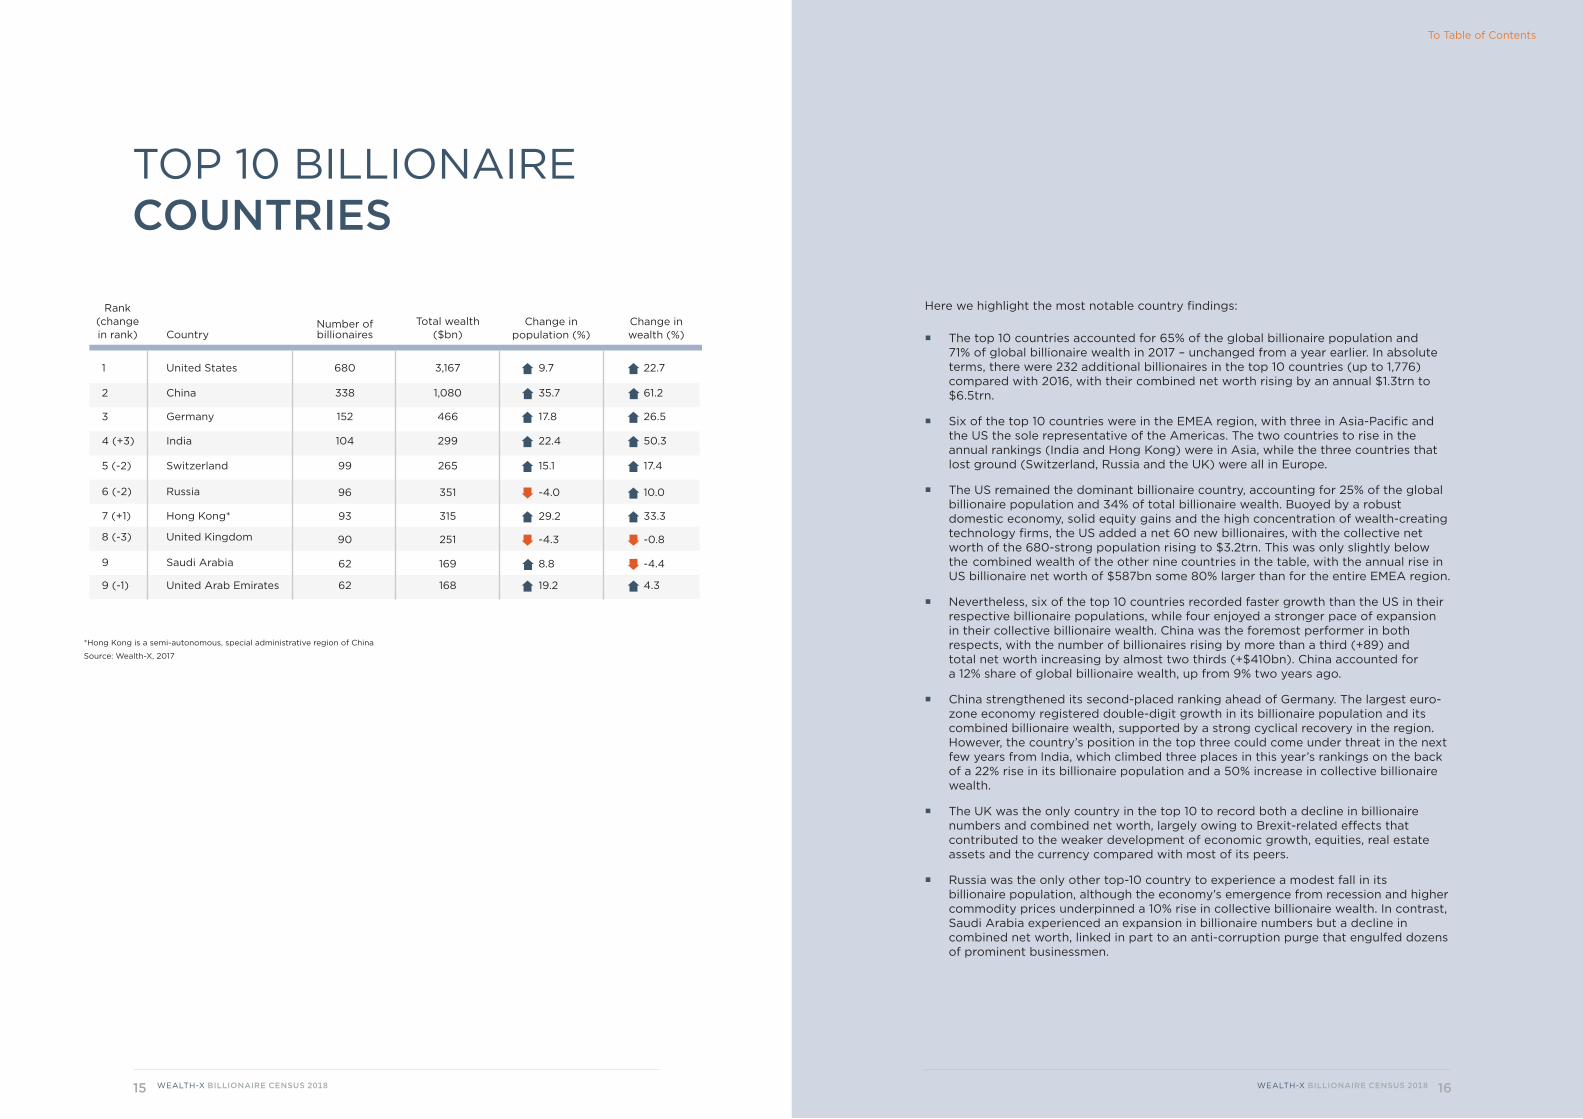
Here we highlight the most notable country findings:
¡ The top 10 countries accounted for 65% of the global billionaire population and 71% of global billionaire wealth in 2017 – unchanged from a year earlier. In absolute terms, there were 232 additional billionaires in the top 10 countries (up to 1,776) compared with 2016, with their combined net worth rising by an annual $1.3trn to $6.5trn.
¡ Six of the top 10 countries were in the EMEA region, with three in Asia-Pacific and the US the sole representative of the Americas. The two countries to rise in the annual rankings (India and Hong Kong) were in Asia, while the three countries that lost ground (Switzerland, Russia and the UK) were all in Europe.
¡ The US remained the dominant billionaire country, accounting for 25% of the global billionaire population and 34% of total billionaire wealth. Buoyed by a robust domestic economy, solid equity gains and the high concentration of wealth-creating technology firms, the US added a net 60 new billionaires, with the collective net worth of the 680-strong population rising to $3.2trn. This was only slightly below the combined wealth of the other nine countries in the table, with the annual rise in US billionaire net worth of $587bn some 80% larger than for the entire EMEA region.
¡ Nevertheless, six of the top 10 countries recorded faster growth than the US in their respective billionaire populations, while four enjoyed a stronger pace of expansion in their collective billionaire wealth. China was the foremost performer in both respects, with the number of billionaires rising by more than a third (+89) and total net worth increasing by almost two thirds (+$410bn). China accounted for a 12% share of global billionaire wealth, up from 9% two years ago.
¡ China strengthened its second-placed ranking ahead of Germany. The largest euro- zone economy registered double-digit growth in its billionaire population and its combined billionaire wealth, supported by a strong cyclical recovery in the region. However, the country’s position in the top three could come under threat in the next few years from India, which climbed three places in this year’s rankings on the back of a 22% rise in its billionaire population and a 50% increase in collective billionaire wealth.
¡ The UK was the only country in the top 10 to record both a decline in billionaire numbers and combined net worth, largely owing to Brexit-related effects that contributed to the weaker development of economic growth, equities, real estate assets and the currency compared with most of its peers.
¡ Russia was the only other top-10 country to experience a modest fall in its billionaire population, although the economy’s emergence from recession and higher commodity prices underpinned a 10% rise in collective billionaire wealth. In contrast, Saudi Arabia experienced an expansion in billionaire numbers but a decline in combined net worth, linked in part to an anti-corruption purge that engulfed dozens of prominent businessmen.
TOP 10 BILLIONAIRE COUNTRIES
16WEALTH-X BILLIONAIRE CENSUS 2018
*Hong Kong is a semi-autonomous, special administrative region of China
Source: Wealth-X, 2017
Rank (change in rank)
1 3,167
7 (+1) 315
2 1,080
8 (-3) 251
3 466
9 169
Total wealth ($bn)
4 (+3) 299
9 (-1) 168
5 (-2) 265
6 (-2) 351
United States
Saudi Arabia
Switzerland
Germany
Hong Kong*
China
United Arab Emirates
Russia
India
United Kingdom
Country
680
62
99
152
93
338
62
96
104
90
Number of billionaires
9.7
29.2
35.7
-4.3
17.8
8.8
Change in population (%)
22.4
19.2
15.1
-4.0
22.7
33.3
61.2
-0.8
26.5
-4.4
Change in wealth (%)
50.3
4.3
17.4
10.0
To Table of Contents
17 WEALTH-X BILLIONAIRE CENSUS 2018
TOP 10 BILLIONAIRE CITIES
New York 1
Dubai 8
Moscow 4
San Francisco 3
Shenzhen 9
Beijing 6
Hong Kong 2
Mumbai 9
London 5
Singapore 7
103
93
74
69
62
57
44
40
39
39 +16
+10
+3
-2
+14
+21
+1
Change in population (number of individuals) year on yearNumber of billionaires 2017
Source: Wealth-X
18WEALTH-X BILLIONAIRE CENSUS 2018
City/rank
+19
+7
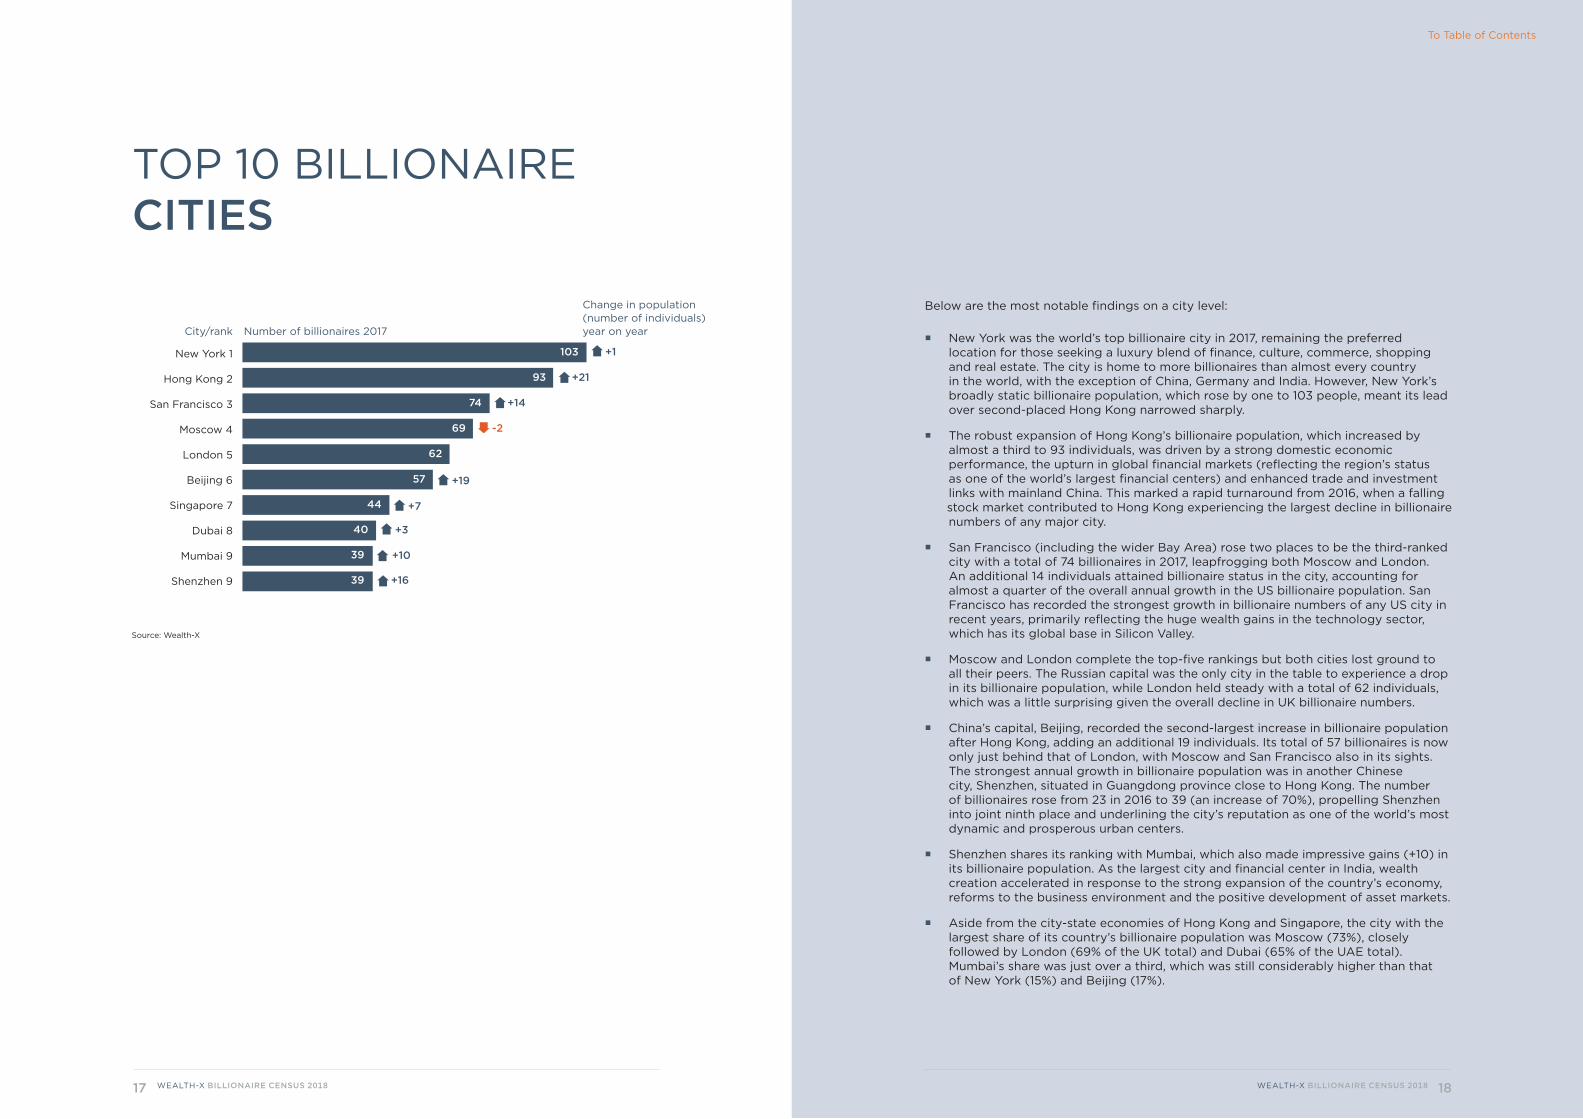
Below are the most notable findings on a city level:
¡ New York was the world’s top billionaire city in 2017, remaining the preferred location for those seeking a luxury blend of finance, culture, commerce, shopping and real estate. The city is home to more billionaires than almost every country in the world, with the exception of China, Germany and India. However, New York’s broadly static billionaire population, which rose by one to 103 people, meant its lead over second-placed Hong Kong narrowed sharply.
¡ The robust expansion of Hong Kong’s billionaire population, which increased by almost a third to 93 individuals, was driven by a strong domestic economic performance, the upturn in global financial markets (reflecting the region’s status as one of the world’s largest financial centers) and enhanced trade and investment links with mainland China. This marked a rapid turnaround from 2016, when a falling stock market contributed to Hong Kong experiencing the largest decline in billionaire numbers of any major city.
¡ San Francisco (including the wider Bay Area) rose two places to be the third-ranked city with a total of 74 billionaires in 2017, leapfrogging both Moscow and London. An additional 14 individuals attained billionaire status in the city, accounting for almost a quarter of the overall annual growth in the US billionaire population. San Francisco has recorded the strongest growth in billionaire numbers of any US city in recent years, primarily reflecting the huge wealth gains in the technology sector, which has its global base in Silicon Valley.
¡ Moscow and London complete the top-five rankings but both cities lost ground to all their peers. The Russian capital was the only city in the table to experience a drop in its billionaire population, while London held steady with a total of 62 individuals, which was a little surprising given the overall decline in UK billionaire numbers.
¡ China’s capital, Beijing, recorded the second-largest increase in billionaire population after Hong Kong, adding an additional 19 individuals. Its total of 57 billionaires is now only just behind that of London, with Moscow and San Francisco also in its sights. The strongest annual growth in billionaire population was in another Chinese city, Shenzhen, situated in Guangdong province close to Hong Kong. The number of billionaires rose from 23 in 2016 to 39 (an increase of 70%), propelling Shenzhen into joint ninth place and underlining the city’s reputation as one of the world’s most dynamic and prosperous urban centers.
¡ Shenzhen shares its ranking with Mumbai, which also made impressive gains (+10) in its billionaire population. As the largest city and financial center in India, wealth creation accelerated in response to the strong expansion of the country’s economy, reforms to the business environment and the positive development of asset markets.
¡ Aside from the city-state economies of Hong Kong and Singapore, the city with the largest share of its country’s billionaire population was Moscow (73%), closely followed by London (69% of the UK total) and Dubai (65% of the UAE total). Mumbai’s share was just over a third, which was still considerably higher than that of New York (15%) and Beijing (17%).
To Table of Contents
19WEALTH-X BILLIONAIRE CENSUS 2018
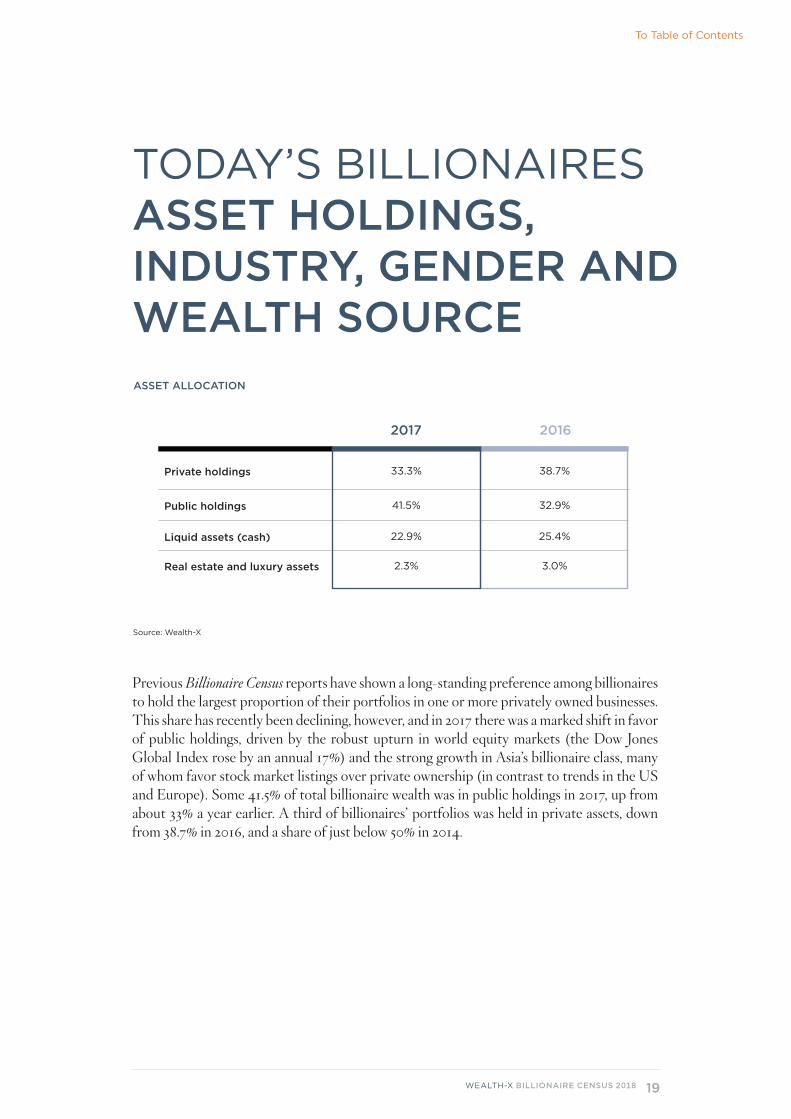
Previous Billionaire Census reports have shown a long-standing preference among billionaires to hold the largest proportion of their portfolios in one or more privately owned businesses. This share has recently been declining, however, and in 2017 there was a marked shift in favor of public holdings, driven by the robust upturn in world equity markets (the Dow Jones Global Index rose by an annual 17%) and the strong growth in Asia’s billionaire class, many of whom favor stock market listings over private ownership (in contrast to trends in the US and Europe). Some 41.5% of total billionaire wealth was in public holdings in 2017, up from about 33% a year earlier. A third of billionaires’ portfolios was held in private assets, down from 38.7% in 2016, and a share of just below 50% in 2014.
ASSET ALLOCATION
2017
Public holdings
Liquid assets (cash)
Real estate and luxury assets
Private holdings
41.5%
22.9%
2.3%
33.3%
2016
32.9%
25.4%
3.0%
38.7%
TODAY’S BILLIONAIRESASSET HOLDINGS, INDUSTRY, GENDER AND WEALTH SOURCE
Source: Wealth-X
To Table of Contents
20WEALTH-X BILLIONAIRE CENSUS 2018
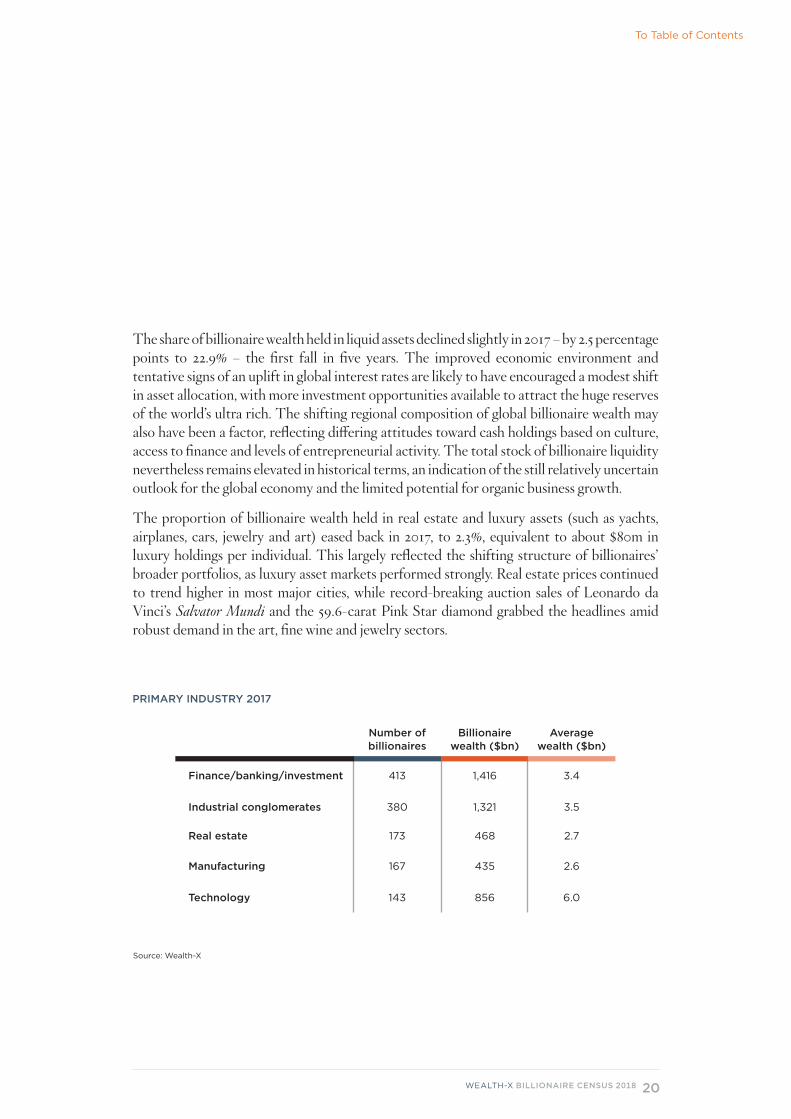
The share of billionaire wealth held in liquid assets declined slightly in 2017 – by 2.5 percentage points to 22.9% – the first fall in five years. The improved economic environment and tentative signs of an uplift in global interest rates are likely to have encouraged a modest shift in asset allocation, with more investment opportunities available to attract the huge reserves of the world’s ultra rich. The shifting regional composition of global billionaire wealth may also have been a factor, reflecting differing attitudes toward cash holdings based on culture, access to finance and levels of entrepreneurial activity. The total stock of billionaire liquidity nevertheless remains elevated in historical terms, an indication of the still relatively uncertain outlook for the global economy and the limited potential for organic business growth.
The proportion of billionaire wealth held in real estate and luxury assets (such as yachts, airplanes, cars, jewelry and art) eased back in 2017, to 2.3%, equivalent to about $80m in luxury holdings per individual. This largely reflected the shifting structure of billionaires’ broader portfolios, as luxury asset markets performed strongly. Real estate prices continued to trend higher in most major cities, while record-breaking auction sales of Leonardo da Vinci’s Salvator Mundi and the 59.6-carat Pink Star diamond grabbed the headlines amid robust demand in the art, fine wine and jewelry sectors.
PRIMARY INDUSTRY 2017
Finance/banking/investment 413
Manufacturing 167
Industrial conglomerates 380
Technology 143
Number of billionaires
Real estate 173
1,416 3.4
435 2.6
1,321 3.5
856 6.0
Billionaire wealth ($bn)
Average wealth ($bn)
468 2.7
Source: Wealth-X
To Table of Contents

21WEALTH-X BILLIONAIRE CENSUS 2018
The finance, banking and investment sector was the primary industry focus for the largest share of the global billionaire population in 2017, accounting for the largest stock of accumulated wealth: $1.4trn. Billionaire representation in industrial conglomerates was a close second. Both sectors recorded solid gains in net worth on the back of improved financial-market sentiment, broad-based consumer demand and the recovery in commodity markets.
Real estate was the third-largest industry sector, underlining the wealth creation opportunities generated by the global trend towards urbanization – not only across the emerging world but also in most major cities in North America, Europe and Australasia. While changes to taxation and residency rules (and Brexit uncertainty in the UK) have contributed to a cooling in some high-end residential markets, developments in the property sector as a whole have remained positive from a wealth perspective, owing to a combination of robust housing demand (both from locals and investors), constrained supply and favorable financing conditions.
As in recent years, the average wealth of technology-focused billionaires far exceeded that in all other industries. In 2017 there were 143 billionaires in the technology sector with an average net worth of $6bn, almost double the level of average global billionaire wealth ($3.3bn). This figure is obviously skewed by the enormous fortunes amassed by a very small number of individuals – six of the 10 richest people in the world have derived the majority of their wealth from the technology sector.1 However, it is also a reflection of the huge gains that can be made by tech entrepreneurs around the world in a sector with comparatively low barriers to entry, a high capacity for innovation and still rapidly increasing global demand.
GENDER
Source: Wealth-X
321
2,433
18.0%
14.5%
2017 Billionaire population2,754
14.9%
Female
Male
Change year on year
1 As at April 2018: Bezos, Gates, Zuckerberg, Ellison, Page, and Brin.
To Table of Contents
22WEALTH-X BILLIONAIRE CENSUS 2018
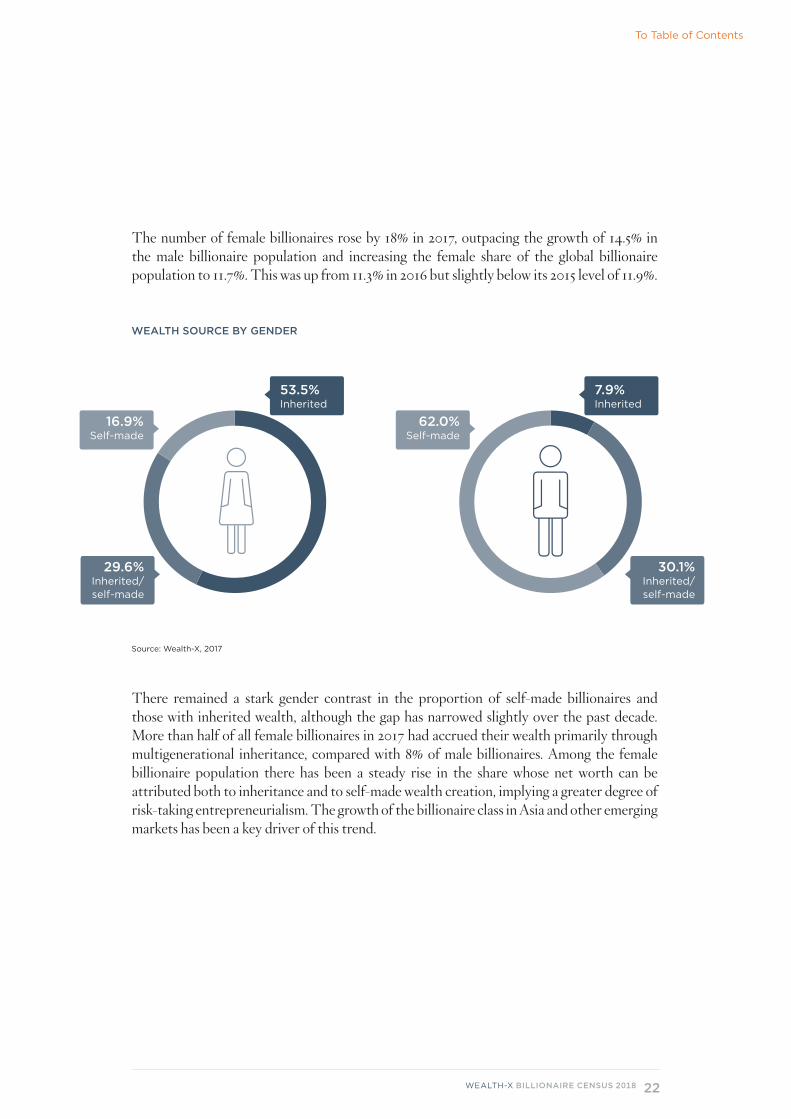
The number of female billionaires rose by 18% in 2017, outpacing the growth of 14.5% in the male billionaire population and increasing the female share of the global billionaire population to 11.7%. This was up from 11.3% in 2016 but slightly below its 2015 level of 11.9%.
53.5%Inherited
29.6%Inherited/self-made
16.9%Self-made
WEALTH SOURCE BY GENDER
7.9%Inherited
30.1%Inherited/self-made
62.0%Self-made
Source: Wealth-X, 2017
There remained a stark gender contrast in the proportion of self-made billionaires and those with inherited wealth, although the gap has narrowed slightly over the past decade. More than half of all female billionaires in 2017 had accrued their wealth primarily through multigenerational inheritance, compared with 8% of male billionaires. Among the female billionaire population there has been a steady rise in the share whose net worth can be attributed both to inheritance and to self-made wealth creation, implying a greater degree of risk-taking entrepreneurialism. The growth of the billionaire class in Asia and other emerging markets has been a key driver of this trend.
To Table of Contents
23WEALTH-X BILLIONAIRE CENSUS 2018
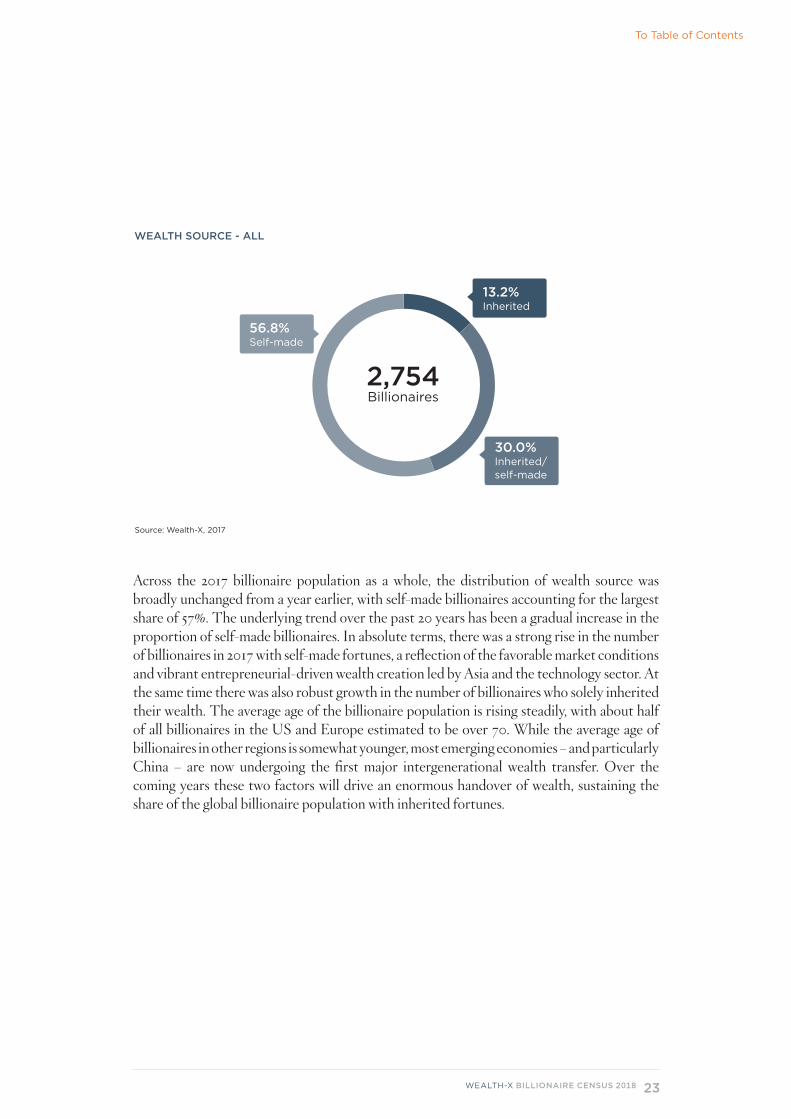
WEALTH SOURCE - ALL
2,754 Billionaires
13.2%Inherited
30.0%Inherited/self-made
56.8%Self-made
Source: Wealth-X, 2017
Across the 2017 billionaire population as a whole, the distribution of wealth source was broadly unchanged from a year earlier, with self-made billionaires accounting for the largest share of 57%. The underlying trend over the past 20 years has been a gradual increase in the proportion of self-made billionaires. In absolute terms, there was a strong rise in the number of billionaires in 2017 with self-made fortunes, a reflection of the favorable market conditions and vibrant entrepreneurial-driven wealth creation led by Asia and the technology sector. At the same time there was also robust growth in the number of billionaires who solely inherited their wealth. The average age of the billionaire population is rising steadily, with about half of all billionaires in the US and Europe estimated to be over 70. While the average age of billionaires in other regions is somewhat younger, most emerging economies – and particularly China – are now undergoing the first major intergenerational wealth transfer. Over the coming years these two factors will drive an enormous handover of wealth, sustaining the share of the global billionaire population with inherited fortunes.
To Table of Contents

24WEALTH-X BILLIONAIRE CENSUS 2018
in recent years, both in financial terms and from a global perspective.
BILLIONAIRE INVESTMENT IN SPORT HAS GROWN
Aside from philanthropy and business, the foremost passion or hobby among the global BILLIONAIRE POPULATION involves sporting activities (44%).
To Table of Contents

25WEALTH-X BILLIONAIRE CENSUS 2018
Time is at a premium for the world’s wealthiest individuals. The Wealth-X Institute previously published a study entitled UHNW Interests, Passions and Hobbies: A Study from the Wealth-X Institute,2 which examined the interests, passions and hobbies of the global ultra high net worth (UHNW) population, to gain a better sense of its characteristics and the motives behind its commercial success. The rankings were considered by region, age group, and gender and were then broken down to a more granular level of subcategories.
We have applied the same methodology to the subset of billionaires in order to understand how their interests differ from those of the broader UHNW population. While ultra high wealth status affords individual freedom to enjoy almost any pursuit, certain differences and distinct features were apparent. The most pronounced variation to emerge was in the area of philanthropy. While almost all UHNW individuals engage in some form of philanthropic activity, this was viewed in most cases as a fundamental responsibility, if not duty, at the very highest levels of wealth. We examine billionaire philanthropy in more detail later in this report.
Aside from philanthropy and, as one would expect, a common interest in business affairs, the foremost passion or hobby among the global billionaire population involves sporting activities (44%). Just over a quarter of all billionaires have an interest in aviation, a higher share than for finance and politics, although for these two categories the importance of keeping track of developments from a business perspective (such as for funding and lobbying purposes) implies a considerably higher proportion of actual participation, even if there is little personal affinity per se. In terms of more traditional hobbies and leisure pursuits, 22% of global billionaires have a passion for art, whether for personal enjoyment, investment purposes or status.
BILLIONAIRE INTERESTS, PASSIONS AND HOBBIES
2 Available at: https://www.wealthx.com/report/uhnw-interests-passions-hobbies/
Top interests, passions and hobbies %
Business 58.9%
Philanthropy 50.7%
Sports 43.7%
Aviation 27.8%
Finance 26.2%
Politics 24.9%
Art 22.0%
Education 21.5%
Outdoors 18.2%
Real estate 17.4%
Note: More than one interest, passion or hobby is possible, so the numbers do not add up to 100%. Source: Wealth-X, 2017
To Table of Contents

26WEALTH-X BILLIONAIRE CENSUS 2018
Sport has always been one of the most popular hobby categories for billionaires, offering them a temporary (and at times relaxing) distraction from daily pressures, whether as a passive observer of elite sporting contests or as an active participant in the favored pastimes of golf, skiing and tennis (the trinity of classic ‘wealthy’ sports).
GETTING ACTIVE
A clear trend to emerge over recent years is the growth of billionaire investment in sport, both in financial terms and from a global perspective. Historically, the diversification of ultra wealthy asset portfolios into this category had tended to be confined to the universally popular sport of soccer (primarily in Europe) and to US ownership of domestic baseball, basketball and American football teams, alongside fairly niche activities such as horse racing and yachting. Involvement was often just as much a statement of ego and prestige as a consideration of financial return.
The rapid expansion in the value of sports media rights, the growth of billionaire wealth in Asia and other emerging markets, and the increasing global reach of digitization are all driving the transformation of billionaire sporting investment. There is now a more favorable environment in which to combine an individual’s sporting passion with a hard-headed business perspective, while also offering the potential for additional commercial opportunities by being ‘in the same room’ as a steadily expanding group of the world’s ultra wealthy population.
In the ‘old money’ markets of Europe and the US, the boom in television rights has attracted a steady stream of new billionaire owners of UK Premier League football teams, marque clubs across Europe and a rising share
Top sporting interests %
Golf 25.7%
Soccer 21.1%
Skiing 16.8%
Tennis 14.9%
Basketball 9.0%
American football 7.4%
Swimming 7.1%
Baseball 6.4%
Cycling 6.0%
Horse racing 6.0%
Note: More than one sporting interest is possible, so the numbers do not add up to 100%. Source: Wealth-X, 2017
To Table of Contents

27WEALTH-X BILLIONAIRE CENSUS 2018
of basketball, soccer and major league baseball teams in the US. The flow of billionaire funds into European football has come increasingly from outside the region, principally from the Middle East and China. Mirroring billionaire wealth developments at a global level, sporting investments by Asian tycoons have risen particularly sharply, driven by huge domestic investments in Chinese Super League football and Indian Premier League cricket. The latter has revolutionized the sport, spurring the creation of similar short-form tournaments in almost every major cricketing nation, each attracting the world’s best players.
ARTISTIC TOUCH
Another area to attract growing billionaire interest and involvement is art, both in terms of affinity and collecting. The US and Europe continue to account for the largest shares of billionaire representation but collectors in Asia and the Middle East are becoming increasingly active, supporting the growth of private museums, art fairs and auction activity around the world. Two record-breaking art sales were concluded in 2017. The first was to a Japanese collector, who paid $111m for a Jean-Michel Basquiat painting (a new auction record for an American artist), while the second was to a Middle East buyer, who parted with $450m to purchase Leonardo da Vinci’s Salvator Mundi, surpassing the previous world-record price for a painting by the small matter of $270m.
Luxury art collections have traditionally
Top art interests by category %
Collector 46.1%
Painting/drawing 24.2%
Contemporary 17.9%
Modern 14.0%
Photography 9.6%
Donor* 8.4%
American 5.8%
Sculpture 5.6%
Impressionist and modern
5.3%
Chinese 5.3%
Note: More than one art interest is possible, so the numbers do not add up to 100%. *Donor refers to individuals who donate for art purposesSource: Wealth-X, 2017
To Table of Contents
28WEALTH-X BILLIONAIRE CENSUS 2018
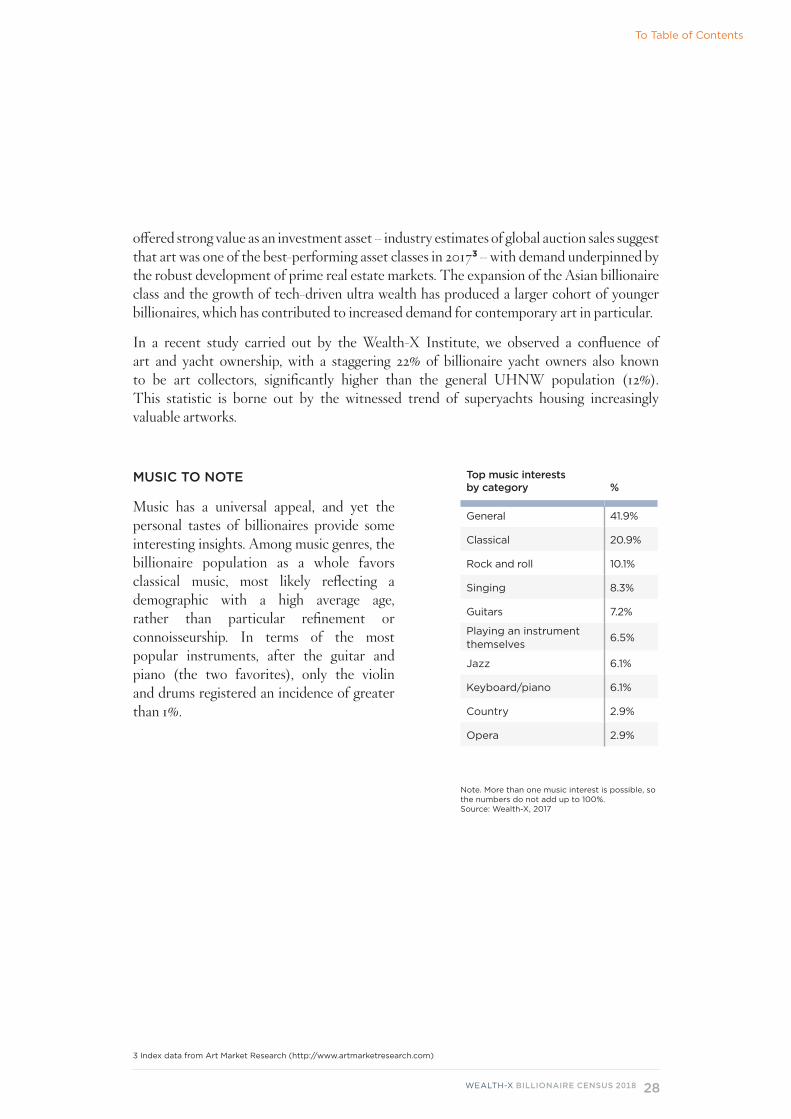
offered strong value as an investment asset – industry estimates of global auction sales suggest that art was one of the best-performing asset classes in 20173 – with demand underpinned by the robust development of prime real estate markets. The expansion of the Asian billionaire class and the growth of tech-driven ultra wealth has produced a larger cohort of younger billionaires, which has contributed to increased demand for contemporary art in particular.
In a recent study carried out by the Wealth-X Institute, we observed a confluence of art and yacht ownership, with a staggering 22% of billionaire yacht owners also known to be art collectors, significantly higher than the general UHNW population (12%). This statistic is borne out by the witnessed trend of superyachts housing increasingly valuable artworks.
MUSIC TO NOTE
Music has a universal appeal, and yet the personal tastes of billionaires provide some interesting insights. Among music genres, the billionaire population as a whole favors classical music, most likely reflecting a demographic with a high average age, rather than particular refinement or connoisseurship. In terms of the most popular instruments, after the guitar and piano (the two favorites), only the violin and drums registered an incidence of greater than 1%.
3 Index data from Art Market Research (http://www.artmarketresearch.com)
Top music interests by category %
General 41.9%
Classical 20.9%
Rock and roll 10.1%
Singing 8.3%
Guitars 7.2%
Playing an instrument themselves
6.5%
Jazz 6.1%
Keyboard/piano 6.1%
Country 2.9%
Opera 2.9%
Note. More than one music interest is possible, so the numbers do not add up to 100%. Source: Wealth-X, 2017
To Table of Contents

29WEALTH-X BILLIONAIRE CENSUS 2018
BILLIONAIRE ALMA MATERS
Unsurprisingly, billionaires tend to have attended prestigious universities. Harvard once again ranked as the world’s top university for producing billionaires, extending its considerable lead over second-placed Stanford and third-placed University of Pennsylvania. All of the leading institutions were American universities, a reflection both of the country’s dominant share of the world’s billionaire population and the established global reputation of its higher education system. The US was home to 41 of the top 100 universities in the world, according to The Times Higher Education World University Rankings 2018.4
RANK UNIVERSITY NUMBER OF BILLIONAIRES 2017
1 Harvard University 188
2 Stanford University 74
3 University of Pennsylvania 64
4 Columbia University 53
5 Massachusetts Institute of Technology 38
6 Cornell University 35
7 Yale University 31
8 University of Southern California 29
8 University of Chicago 29
10 University of Michigan 26
4 https://www.timeshighereducation.com/world-university-rankings
Source: Wealth-X
To Table of Contents
30WEALTH-X BILLIONAIRE CENSUS 2018
The prestigious Harvard institution in Cambridge, Massachusetts is the oldest university in the US and was the alma mater of 188 billionaires (who completed either an undergraduate or postgraduate degree), representing 6.8% of the global billionaire population. Previous Wealth-X studies have emphasized the power and influence garnered from having access to Harvard’s exclusive and highly privileged social network, which extends across numerous business sectors.
Inherited wealth is certainly a feature of Harvard’s billionaire class, although the institution can also boast of an above-average share of self-made billionaires among its graduates. Harvard has a slightly higher proportion of international alumni – about a quarter –than most of the other universities in the table, with the exception of the Massachusetts Institute of Technology (MIT). It is hardly surprising that the world’s premier institution for producing billionaires is a highly desirable choice for an increasingly diverse global ultra wealthy population.
The power of exclusive networks is far from confined to the Harvard elite. The high ranking of Stanford University, with a total of 74 billionaire alumni, owes much to its location at the heart of Silicon Valley and its close integration with the global tech giants and the innovative focus of the region. The average net worth of Stanford’s billionaire alumni is the highest of all the institutions in the table. While the 64 billionaires that graduated from the University of Pennsylvania can be found in an array of fields, its Wharton School is renowned as a leading institution for business and economics degrees. And MIT has a well-established reputation for producing billionaires in the global finance, investment and hedge fund sectors.
The social elitism, prestige and fast-track career progression often associated with a private Ivy League education undoubtedly provide a springboard towards wealth creation and, for some high achievers, billionaire status: five of the top seven-ranked billionaire universities are Ivy League schools – a select group of higher education establishments in the north-east of the US. However, two public institutions also feature near the top, the highest ranked being the University of Michigan, followed closely by the University of California, Berkeley (ranked 11th). Together the two establishments accounted for 51 billionaire alumni or 1.9% of the global billionaire population.
To Table of Contents

31WEALTH-X BILLIONAIRE CENSUS 2018
BILLIONAIRE PHILANTHROPY
The strong expansion of total billionaire wealth over the past decade has been accompanied by an upward trend in philanthropic activity. This has been bolstered, in part, by increased awareness of global environmental and social issues, consternation over rising inequality and shifting attitudes among a more diversified and multigenerational billionaire population.
With an average net worth of $3.3bn globally, billionaires donate around 3% of their total wealth over their lifetime. While some prefer to give discreetly, for personal, cultural or religious reasons, more than half of all billionaires are actively involved in philanthropic giving, either through charitable organizations that they have established for this purpose (according to Wealth-X data, at least 35% of billionaires have private charitable foundations) or through other means.
Education remains the top charitable cause, with almost two-thirds of the billionaire population directing at least part of their philanthropic activity towards scholarships, educational support and outreach programs, teacher training, higher education funding and more. In total, such contributions accounted for 21% of total billionaire donations. Healthcare causes represented the second highest level of billionaire engagement, receiving 14% of all philanthropic giving.
To Table of Contents

32WEALTH-X BILLIONAIRE CENSUS 2018
TOP 10 PHILANTHROPIC CAUSES
Education
Health
Public, societal benefit6
Arts, culture and humanities
Higher education
Human services7
Environment and animals
Religious organizations
Government8
% of billionaire population5
% of giving by total value
Foundations
62.3%
39.3%
36.1%
33.6%
28.8%
28.8%
15.7%
11.6%
11.2%
3.2%
20.8%
14.4%
5.8%
6.5%
9.6%
1.4%
2.1%
29.5%
0.9%
0.1%
5 Given that an individual billionaire can give to more than one cause, this does not add up to 100%.
6 Includes research and public policy institutions, community foundations, science and technology research.
7 Includes children’s/youth services, adoption, family services, single parent agencies, family services/counseling, emergency
assistance, victim’s services, hospices, employment and housing/shelter projects.
8 Includes government institutions, ministries, departments and municipalities.
Source: Wealth-X, 2017
To Table of Contents

33WEALTH-X BILLIONAIRE CENSUS 2018
In 2010 Bill and Melinda Gates and Warren Buffet started the Giving Pledge initiative to inspire the wealthy to donate at least half of their wealth to charitable causes either during their lifetime or in their wills. From an initial 40 signatories, all from the US, the number of individuals taking the pledge has risen to 175 in 22 different countries (as of April 2018). Given shifting market valuations and changing asset portfolios, it is difficult to give a precise figure for the overall amount pledged. In 2016 the total net worth of all signatories was estimated at around $735bn, implying a pledged value of at least $350bn. Based on the increase in signatories since then, the robust upturn in billionaire wealth in 2017 and near-term projections for the billionaire population, Wealth-X forecasts that the potential pledged value could be as high as $600bn by 2022.
0
100
200
300
400
500
600
2010 2013 2016 2022F
($b
n)
120
252
365
588
ESTIMATED VALUE OF THE GIVING PLEDGE (2010-2022F)
Sources: The Giving Pledge Organization (pledge values for the years 2010 – 2016); Wealth-X (estimated pledge value in 2022)
F = forecast
To Table of Contents
34WEALTH-X BILLIONAIRE CENSUS 2018
Critiques of the Giving Pledge have raised a number of issues. Firstly, being a ‘moral’ rather than a legal commitment, there is no guarantee that the pledged amounts will materialize in the future. Attention to date has tended to focus more on the signatory and potential size of their pledge, rather than on the cause to which the money may be allocated. This, along with the fact that individuals can distribute wealth to their own private foundations, has raised some concerns about whether the funds will ultimately be directed to the most pressing global challenges. In 2014, Perspectives in Politics published a study suggesting the ultra wealthy are far less passionate than many members of the public about issues such as the minimum wage, national healthcare and ensuring access to college education.
Asset values and billionaire wealth composition will of course fluctuate over time, affected by a range of factors. One is that of taxation, with varying national tax codes, major tax reforms, and tighter regulation of wealth transfer and tax planning—such as the OECD’s base erosion and profit (BEPS) initiative, all having the potential to make a significant impact on the total value of philanthropic pledges. The extensive tax reform bill approved in the US in late 2017 is a case in point, with the numerous changes to corporate, estate, gift and other taxes raising many questions about the implications for philanthropy. Analysis suggests that the giving behavior of the philanthropic base of middle-class America could take a hit. However, this could be more than offset by increased giving from the UHNW population, given that the benefits of the tax bill are skewed heavily towards the ultra wealthy. At the very least, the changes may shed some light on the extent to which billionaire philanthropic behavior is dictated by government tax incentives.
Looking beyond the debate over tax reforms and charitable commitments, initiatives such as the Giving Pledge nevertheless point to an increasing awareness and ‘social conscience’ among the super affluent of a need to give back to wider society. This social pressure has manifested in high-profile schemes but also more subtly and gradually in the evolution of philanthropy to embrace new vehicles and methods. These range from the increasing popularity of donor-advised funds, to the more recent developments of impact investment (such as the Rise Fund) and venture philanthropy supported by the philosophy of effective altruism. With the recent trends of robust wealth creation in Asia and the technology sector set to continue, and with perhaps the largest-ever generational transfer of wealth set to occur in the coming years, the prospects for philanthropic giving appear bright.
To Table of Contents

35WEALTH-X BILLIONAIRE CENSUS 2018
This report uses the unique and proprietary Wealth-X Database, the world’s most extensive collection of curated research and intelligence on high net worth (HNW) and ultra high net worth (UHNW) individuals. Our database provides insights into their financial profile, career history, known associates, affiliations, family background, education, philanthropic endeavors, passions, hobbies, interests and much more. Our proprietary valuation model (as defined by net worth) assesses all asset holdings, including privately and publicly held businesses and investable assets. Wealth-X uses the primary business address as the determinant of a billionaire’s location. References to $ or dollars refer to US dollars.
Analysis of the data and additional insights were provided by the Wealth-X Institute. The Wealth-X Institute is a non-revenue generating research arm of Wealth-X dedicated to the development of unique data and analysis related to global wealth. By leveraging the Wealth-X global database of dossiers on the ultra wealthy, as well as examining the issues that influence their investing, spending, and philanthropic preferences, the Wealth-X Institute provides original thought-leadership, expertise, and best practice across the financial services, luxury, not-for-profit and education sectors.
If you would like further information, please email [email protected].
METHODOLOGY
ABOUT WEALTH-X
Wealth-X is the leading global wealth information and insight business, partnering prestige brands across the financial services, luxury, not-for-profit and higher education industries. We have developed the largest collection of hand-curated dossiers on UHNW individuals available anywhere in the world today, as well as the world’s foremost HNW market research team.
At Wealth-X, we believe in the power of applied wealth intelligence to drive success for our clients. Our proprietary data assets and specialized research capabilities help our clients understand and engage their target audience, minimize their risk and make informed strategic decisions.
Founded in 2010, the Wealth-X team has grown to more than 200 staff across North America, Europe and Asia, working with more than 500 clients.
Our team of experts is widely quoted as the global authority on wealth intelligence by top-tier media organizations, such as The Wall Street Journal, Financial Times, Business Insider, CNN, The New York Times and the BBC.
To Table of Contents