Bike Future presentation: BIKE FUTURES: BUILDING HEALTHY COMMUNITIES THROUGH BIKE RIDING
Upload
jason-f-brownCategory
view
546download
80description


Bicycling Frank Rowland
Science Whitt
second David Gordon
edition Wilson
The MIT PressCambridge, MassachusettsLondon, England

Ninth printing, 1995
© 1982 by The Massachusetts Institute of Technology
All rights reserved. No part of this book may be repro-
duced in any form or by any means, electronic or me-
chanical, including photocopying, recording, or by
any information storage and retrieval system, withoutpermission in writing from the publisher.
Printed and bound in the United States ofAmerica
Library of Congress Cataloging in Publication Data
Whitt, Frank Rowland.
Bicycling science.
Includes bibliographies and index.
1. Bicycles—Dynamics. 2. Man-machine systems.
I. Wilson, David Gordon, 1928–.
II. Title.TL410.W48 1982 629.2'31 81-20950
ISBN 0-262-23111-5 AACR2
ISBN 0-262-73060-X (pbk.)

1
2
3
4
Contents
Foreword ixPreface xi i
Acknowledgments xvii
HUMAN POWER
History of human-powered machines andvehicles 3
References 27
Human power generation 29Muscle chemistry and mechanisms 33Breathing 34Maximum performance versus time 41Bicycling performance 45Conclusion 67
References 68
How bicyclists keep cool 71
Heat-transfer data and deductions 72Minimum air speed 76Bicycling in cold and hot conditions 77Physiology of body-temperature regulation 79Heat-transfer comparison of swimming,running, and bicycling 79
Conclusions 79
Some speculations 80References 81
SOME BICYCLE PHYSICS
Wind resistance 85Drag 87
Reducing frontal area 93Reducing drag coefficient by streamlining 97
Combined effects of recumbent posture and
streamlining 100Aerodynamic effects of passing vehicles 103

vi Contents
Drafting 103References 104
The wheel 106Rolling resistance 107Advantages and disadvantages of small-wheeledbicycles 124
Effect of wheel mass on acceleration effort 127Rough roads and springing 128Shape and resilience of spoked tensionwheels 137
References 138
Mechanical friction 140Power losses in chain transmission 140Bearings 142Friction in the rider's limb joints 149References 149
The relationship between power and speed 151
Effect of bicycle type on performance 156
Power needed for land locomotion 168Bicycling versus other human-powered
locomotion 179Effect of gradients and headwinds 181Human power versus engines and motors 184References 187
Braking 189The friction of dry solid substances 189
Bicycle brakes 190Duty of brake surfaces 194Friction between tire and road 196Longitudinal stability during braking 196Minimum braking distances for stablevehicles 199
Rear-wheel-only braking 201Wet-weather braking 202Backpedaling 212
References 214
5
6
7
8

vii Contents
9 Balancing and steering 215Steering characteristics of nonflexing
bicycles 216Range of practicable configurations for standardbicycles 222
Shimmy 224Other factors complicating steering 226Alternative designs 233Hands-off bicycling 235References 236
10 Materials and stress 239Factor of safety 240Loading 240Strength of materials 241Other material properties and criteria forchoice 248
Steel versus aluminum alloys 253Nonmetallic components 256Alternative frame materials 259Conclusions and speculations 264
References 272
MECHANICS AND MECHANISMS
11 Power transmission 277Transmission efficiency 280Nonpositive drives 281Positive drives 283Conclusions 300References 300
12 Unusual pedaled machines 302
Off-road vehicles 302Boats 303Ice and snow machines 308Railway cycles 308Aircraft 309Lawn mowers 312Energy-storage bicycles 315
Cyclecars 319

viii Contents
Human-powered vehicles in the ThirdWorld 322
References 326
13 Human-powered vehicles in the future 328Design competitions 335IHPVA races 347Future commuting vehicles 352A saner future 356References 357
Appendix 358Conversion factors 358Derivations 359Mass and weight 359Properties of dry air at normal pressures 359
Gear-speed conversion chart 360
Index 361

Foreword
In Chest Springs, a rural town in Pennsylvania,a worn and rusting replica of a high-wheeler bi-cycle stands at the end of a lane. From the han-dlebars swings an equally aged mailbox. Thepostman enjoys delivering to that address be-cause the bike reminds him of history. And heis not alone; many Americans think of the bike"historically" as a monument to an age gone by.The bicycle has indeed enjoyed a rich and di-
verse history, culminating in the dizzying num-ber of inventions that brought the safety bicycle,from which the machines we ride today are notradically different. But the bicycle was just thefirst stop on a journey that would take much ofthe world into the machine age. It was quitenatural for gifted bike mechanics and inventorssuch as the Wright brothers and Henry Ford toapply their inventiveness to other vehicles.Such is progress.One of the unfortunate by-products of progress
was the declining interest in the bicycle. Afterall, motorcycles and cars went much faster andmade much more noise. Equally depressing wasthe fact that entire generations of Americans be-lieved that the bicycle was a child's toy. Nowonder so many American soldiers wereamazed at the number of bicycles flooding theroads of Europe.It is generally agreed that the 1860s saw the
development of the bicycle as we have come toknow it today. During that decade, rubber wasused for the first time to cushion the ride andball bearings were introduced to provide easierpedaling and steering. Almost a hundred yearslater, America experienced the early signs of an-other bicycle revolution. Sports bikes with mul-tiple gearing were introduced into the adult

x Foreword
market. Cycling was promoted as an adult activ-ity, as a legitimate life sport that would fostercardiovascular health. A vital connection hadbeen made.This second bicycle revolution gives every in-
dication of being broad-based, deep, and di-
verse. Millions of people are riding bikes for ex-ercise and transportation, and the market isalive with inventiveness. Large and small man-ufacturers are introducing new bikes, compo-nents, and systems at a rapid rate. We arewitnessing high interest in aerodynamics, hu-man power, and optimum riding position.Because of the renewed interest in bicycles
among consumers, students, and engineers, thepublication of the second edition of BicyclingScience—which is really a new book with ex-cerpts from the first—is very timely indeed. Bi-cycling Science, written by two distinguishedengineers and practicing cyclists, provides a fulland rich treatment of the physics and physiol-ogy of cycling. Although cycling is a won-drously simple affair, it involves physicalphenomena such as braking, steering, rolling re-
sistance, and stress. The strength and beauty ofBicycling Science is that the cycling is never
lost for the physics. This is a very readablebook.Anyone involved in the bicycle industry
should make it a point to read this book. Theinvaluable information on bike and componentdesign will dispel many of the prevailingmyths. But the book is not only for specialists.Anyone who takes more than passing pleasurein cycling would enjoy it—particularly the sec-ond part, entitled "Some bicycle physics."Bicycling Science is richly educational, a basic
tool for teaching elementary physics and physi-ology at all levels. A curriculum could be builtaround it.Perhaps a final test of a book's worth is
whether or not it "moves men." I think Bicy-cling Science will. The chapters dealing with

xi Foreword
innovative transmissions, alternative forms ofthe bicycle, and future possibilities for human-powered vehicles offer a challenge to those whowill build the bikes of the future. Whitt andWilson have opened up the bicycle to another
age of discovery.
James C. McCullaghEditor and Publisher, Bicycling magazine

Preface
We intended the first edition of this book "to be
of interest to all mechanically inquisitive bicy-clists, as well as to teachers of elementary me-chanics or physiology, and to engineers andothers working on approaches to lessen our de-pendence on high-energy-consumption trans-portation." Since we wrote those words, in1974, several developments have seemed toconfirm that the wave of popularity of the bicy-cle that started in the early 1970s was not just a
short-term craze. The forced rise in world oilprices and the occasional disappearance of eas-ily available gasoline (more significant in theUnited States) at last convinced many peoplethat a long-term change was required in the af-fluent way of life experienced by many in the
technologically advanced countries. Bicyclingbegan to be taken more seriously P- an alterna-tive to the use of the automobile and public
transit for commuting.Another development with strong effects—
good and bad—was the New York City transitstrike of 1980. On the good side was the discov-ery by tens of thousands of people that commut-ing by bicycle was possible, and by many that itwas pleasant. On the negative side, there weremany accidents between bicyclists and pedestri-ans and between motor vehicles and bicycles,
partly because of nonexistent or ill-conceivedtraffic arrangements for bicycles.A third development, wholly beneficial, was
the creation in 1974-75 of a new class of cycleracing. The International Human-Powered Vehi-
cle Association, formed by Chester Kyle and asmall group of fellow enthusiasts in California,sponsors speed trials and other races in whichthere are no restrictions on vehicle design otherthan that there must be no energy storage. The
xiii Preface
speeds already reached by the application of so-phisticated aerodynamic fairings and supine orrecumbent riding positions alone would haveseemed incredible a decade ago, and yet itseems likely that 30 m/sec (67 mph) will be at-tained within a decade. Enthusiasm for this newsport is spreading and growing in the UnitedStates and in Europe. The attendance at the firstracing meet in Britain in 1980 was more thanfor all the previous U.S. meets combined. Thisform of racing is certain to bring about a re-sumption in the development of bicycles for
everyday use. A stream of new ideas was en-couraged by bicycle racing in the 1865-1895period, but this stream was then reduced to atrickle by the adoption of highly restrictive
rules for racing. Now we see new developmentsin bicycle technology coming almost as a flood.These developments have been largely respon-
sible for this second edition of Bicycling Sci-
ence. We have added a large amount of newinformation about human power output undervarious conditions, and have revised and ex-panded the sections on aerodynamic, wheel,
and bearing losses. These inputs and outputshave been combined in a new chapter on theprediction of speeds for typical and hypotheti-cal vehicles for various levels of power input.Thus we have tried to serve the new wave ofdesigners, planners, and builders of vehiclesboth for racing and for everyday commuting usewith data and methods that should further thedesigning of optimum vehicles.We have also added a short chapter on the
technological history of bicycles and tricycles,partly because it is a fascinating story andpartly because awareness of what has been triedbefore can help to preclude the repetition of ex-pensive mistakes. In this respect we have thesame aim as "Professor" Archibald Sharp (whowas in fact an instructor in engineering designat a London technical college), who wrote hisclassic Bicycles and Tricycles at a time (1896)
xiv Preface
when, as at present, people were experimentingwith all manner of variations of cycle design
and construction. In his preface Sharp wrotethat "there are many frames on the marketwhich evince on the part of their designers utterignorance of mechanical science," and that "ifthe present work is the means of influencing
makers, or purchasers, to such an extent as tomake the manufacture and sale of such mechan-
ical monstrosities in the future more difficultthan it has been in the past, the author will re-gard his labors as having been entirelysuccessful."
Other good books on the science of bicyclingwere published by authors such as R. P. Scottand C. Bourlet in the same period. From thattime until the present revival of interest in bicy-cling, technical authors turned their attentiontoward automobiles, airplanes, and other appar-
ently more exciting challenges. The stagnationof bicycle design, brought about largely by re-
strictive rules for racing, was aided by the lackof interest of publishers (and, perhaps, potentialreaders) and by the astonishing new transporta-tion competitors—subways, cable and electricstreetcars, motorcycles, automobiles, the rail-
roads then reaching over 100 mph (about 50m/sec), airships, and the early aircraft. Wepoint out in the first chapter that a similar,though shorter, period of stagnation occurredafter 1825, and that this was probably due to
somewhat similar excitement about the poten-tial of railroad transportation. Inventive peoplemaking improved bicycles in such periods ofstagnation found that their concepts (and theirmanuscripts) fell on stony ground.We as authors and bicyclists are fortunate to be
living at a time when bicycle design is undergo-ing considerable change. In providing a techni-cal guide, we have tried to start at all timesfrom basic principles—which are, in general,
the laws of physics. We have been concernedprincipally with dynamics rather than with stat-

xv Preface
ics. We have given raw data in those manycases where the final answer, if there ever issuch a conclusion to research, is not yet known.And occasionally we have made our ownestimates.Some readers may be interested to learn how
this book came to be written. Frank Whitt, whois a chemical engineer, had been a contributorto (and for a period the technical editor of)Cycle Touring (Cyclists' Touring Club, U.K.)and had contributed technical papers to sympo-sia and articles to magazines such as Bicycling.He put these together into the beginnings of abook. David Wilson was teaching mechanical-
engineering design at the Massachusetts Insti-tute of Technology, using bicycles as occasionalexamples and supervising some undergraduateprojects and theses. He had in Britain a smallsavings account which the Bank of England
would not allow to be transferred to the UnitedStates. With the help of the journal Engineering,and with prize money from the savings accountand a contribution from Liberty Mutual Insur-ance, he organized in 1967 an international
competition for developments in human-pow-ered transportation. Whitt was one of the 73entrants. They met some time after the compe-tition was completed in 1969. Subsequently,Whitt asked Wilson if he could find an Amer-ican publisher for his manuscript. He had notbeen successful in this endeavor in Britain,and Wilson at first did no better in the UnitedStates. Publishers felt that, whatever the qualityof a book on bicycling science, the potential
readership was so small that the considerableexenditure of publishing the book was notjustified.Then came the 1970s and the revival of inter-
est in bicycling. There was still no sign of anychange in bicycle design, but Frank Satlow ofthe MIT Press decided to take a long shot by
proposing that the book be adopted. The manu-script was accepted on the condition that Wil-

xvi Preface
son add to it the results of the 1967-69 designcompetition and any relevant research data, andedit the whole book. That first edition was pub-lished in hard cover in 1975 and in paperback
in 1977.The continuing popularity of bicycling since
then, the wealth of new developments and data,and in particular the intense interest in newtypes of vehicles made us wish almost immedi-
ately that we could rewrite the book. We were,therefore, delighted when Frank Satlow askedus if we would like to work on a second edi-tion. As intimated above, although this is calleda second edition, it is really a new book inscope and style; we hope that it will be receivedwith the same goodwill and grace as was thefirst.This preface is being written, sadly, by David
Wilson alone. Frank Whitt suffered a paralyzing
stroke in mid-1981, and as of the time of writ-ing (September 1981) he has not yet been ableto talk or to write. He is making slow progress,and it is hoped that he will be back with hisinsights, his experimental and design skills, andhis wealth of information to contribute to us all.
He is greatly missed.

Acknowledgments
Many individuals and organizations havehelped to make this book possible.Those who have given permission to repro-
duce copyrighted illustrations are acknowl-
edged in the legends and are remembered herewith appreciation.William A. Bush, Evelyn Beaumont, Vaughan
Thomas, Derek Roberts, and David E. Twitchettand other members of the Southern VeteranCycle Club (U.K.) and the Camden HistoricalSociety have lent items of equipment for testingand pieces of historical literature for study andcopying.Allen Armstrong, the superb mechanical de-
signer responsible for the Positech derailleurshifting system and the dual-leverage brake,gave useful test data and photographs.Fred DeLong, technical editor of several bicy-
cling publications and author of DeLong's Guideto Bicycles and Bicycling, dedicates his freetime to the cause of bicycling safety and hasprovided us with much helpful information.Gunter Fieblinger, professor at the University
of Kassel, who helped to organize a highly suc-cessful bicycling congress in Bremen in 1980("Velo-City"), translated the graphs from thefirst edition of Bicycling Science into S.I. unitsfor his students and gave us copies.
Richard Forrestall and Harald Maciejewski, de-signers and engineering perfectionists, formedFOMAC, Inc. to develop and produce recum-bent bicycles, and have provided us with muchvaluable input.Keith Hutcheon, technical director of T. I. Ra-
leigh, Ltd., has provided helpful data on newproducts (particularly braking systems), histori-cal information, and illustrations.

xviii A ckn owlegments
Chester Kyle, professor of mechanical engi-neering at Long Beach, California, is the oneperson most responsible for the founding of theInternational Human-Powered Vehicle Associa-tion and for the new generation of streamlinedfast human-powered vehicles. He has given us awealth of data, research papers, photographs,and encouragement.Hans-Erhard Lessing, professor at the Univer-
sity of Ulm and author of Das Fahrradbuch (TheBicycle Book), has sent us valuable historicaland scientific data about the development of thebicycle in Germany and of ergonomic research.James C. (Chuck) McCullagh, editor of Bicy-
cling, must be recognized here for his commit-ted support of all that is good in presentbicycling and of new developments.Len Phillips, senior editor of Technology Re-
view and avid bicyclist and photographer, fedus news, illustrations, and enthusiasm.Anna Piccolo deciphered our rough typing and
rougher scribbling over many months, as shedid for the first edition, and cheerfuly preservedour sanity and hers at times when other de-
mands were strident.H. John Way, editor of Cycle Touring, has al-
lowed the use of a considerable number of arti-cles contributed to that magazine over the yearsby the senior author.David Wilson's long-suffering family, Erica
Sears Wilson, John M. B. Wilson, and Anne
Sears Wilson, put up with taking second placeto "BS" with grace, and have welcomed himback.

Note on Units
We have given values in S.I. (Systeme Interna-tional) units in addition to those more familiarto English-speaking readers. Where a measurereferred to repeatedly (for instance, a one-inch-
diameter tube) we have generally given the S.I.equivalent (25.4 mm) at the first mention only.We have not always translated historical mea-sures. Other instances where we may have beeninconsistent have been wheel and tire sizes andgearing, none of which translates directly bystandard conversion factors. We have tried toexplain such cases in the text.
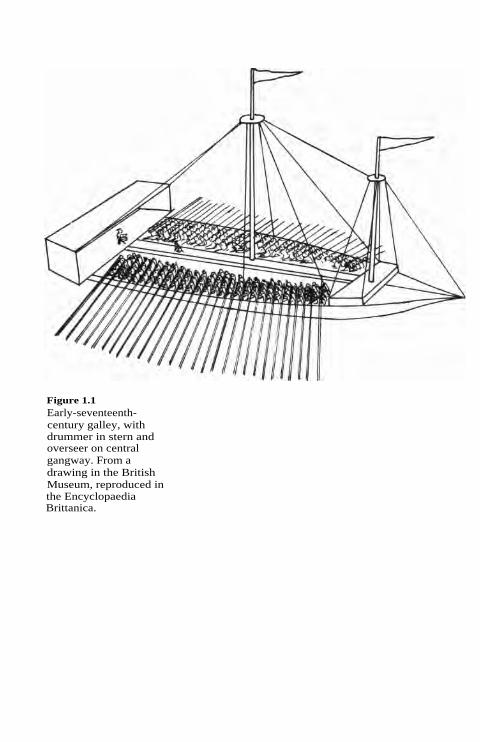
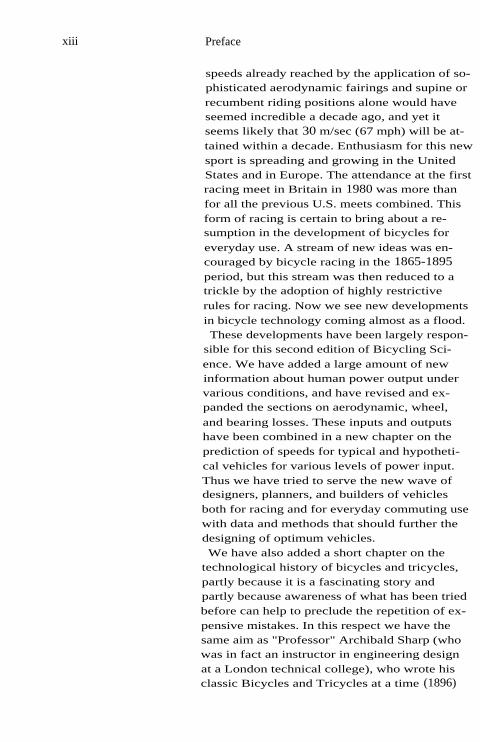
Figure 1.1Early-seventeenth-century galley, withdrummer in stern andoverseer on centralgangway. From adrawing in the BritishMuseum, reproduced inthe EncyclopaediaBrittanica.

History of human-powered machinesand vehicles
It was through the use of tools that humanbeings raised themselves above the animals. Inthe broadest sense of the term, a tool might besomething as simple as a stone hammer or ascomplex as a computer controlling a spacecraft.We are concerned with the historical and me-chanical range of tools that led to the bicycle,which—almost alone among major human-pow-ered machines—came to use human muscles ina near-optimum way. A short review of the mis-use of human muscle power throughout historyshows the bicycle to be a brilliant culminationof the efforts of many people to end suchdrudgery.Many boats, even large ones, were muscle-
powered until the seventeenth century. Romangalleys had hundreds of sweeps in up to threebanks. Figure 1.1 shows a large seventeenth-century galley having 54 sweeps, with five menon each. The men were likely to be criminals,chained to their benches. A central gangwaywas patrolled by overseers equipped to providepersuasion for anyone considered to be takinglife too easy. The muscle actions used by theseunfortunate oarsmen were typical of those con-sidered appropriate in the ancient world. The
hand, arm, and back muscles were used themost, while the largest muscles in the body—
those in the legs—were used merely to provideprops or reaction forces. The motion was gener-ally one of straining mightily against a slowlyyielding resistance. With five men on the in-board end of a sweep, the one at the extremeend would have a more rapid motion than theone nearest to the pivot, but even the end manwould probably be working at well below his
optimum speed.
1

4 Human power
Figure 1.2Engraving showing useof capstans in erection ofan obelisk at the Vaticanin 1586. (The penalty fordisrupting work wasdeath.) From N. Zabaglia,Castelli e Ponti (Rome,1743).
Most farm work and forestry fell into the samegeneral category. Hoeing, digging, sawing,
chopping, pitchforking, and shoveling all usedpredominantly the arm and back muscles, withlittle useful output from the leg muscles. Inmany cases, the muscles had to strain againststiff resistances; it is now known that musclesare most efficient and develop maximum powerwhen they are contracting quickly against asmall resistance, in a good "impedance match."One medieval example of the use of appropri-
ate muscles in a good impedance match is thecapstan (figure 1.2). Several people walked in acircle, pushing on a radial arms, to winch in arope. The capstan's diameter was chosen to givecomfortable working conditions, and each
pusher could choose the preferred radial posi-tion on the bar.
Other relatively satisfactory uses of muscle

Figure 1.3Inclined footmill.Reproduced, withpermission, from AubreyF. Burstall, A History ofMechanical Engineering(London: Faber & Faber,1963).
5 History
power were the inclined treadmill (figure 1.3),Leonardo da Vinci's drum or cage for arma-ments (rotated by people climbing on the out-side), 1 and treadmill-driven pumps (figure 1.4).
This type of work may not have been pleasant,but per unit of output it was far more congenialthan that of a galley slave.The path of development, in this as in most
other areas, was not a steady upward climb.
Even though relatively efficient mechanisms us-ing leg muscles at good impedance matches(figure 1.5) had been developed, sometimeshundreds of years earlier, some designers andmanufacturers persisted in requiring heavyhand cranking for everything from drill pressesto pneumatic diving apparatus to church-organblowers—even though in all these cases pedal-ing seems clearly advantageous.People seem to have been thinking of human-
powered vehicles from the fifteenth century on.A sketch attributed to a pupil of Leonardo

Figure 1.4Medieval pump drivenby treadmill.Reproduced, withpermission, from A. G.Keller, A Theatre ofMachines (London:Chapman and Hall,1964).
6 Human power
shows a device like a bicycle fitted with pedals,cranks, and a chain drive to the rear wheel. (Asdrawn, the machine could not have been steered
and thus could not have been pedaled withoutassistance in maintaining balance. It is thereforeeither an inaccurate copy of an extraordinarilybrilliant and prescient Leonardo drawing or afraud from a much later date.) There is evidencethat a footman-propelled carriage was used inFrance in the 1690s (ref. 2, p. 16). By the begin-ning of the nineteenth century unsteerable two-
wheelers appeared in England, and these weresuperseded by what is now commonly calledthe hobby-horse.
It seems likely that the most important discov-ery in the bicycle's development was made by
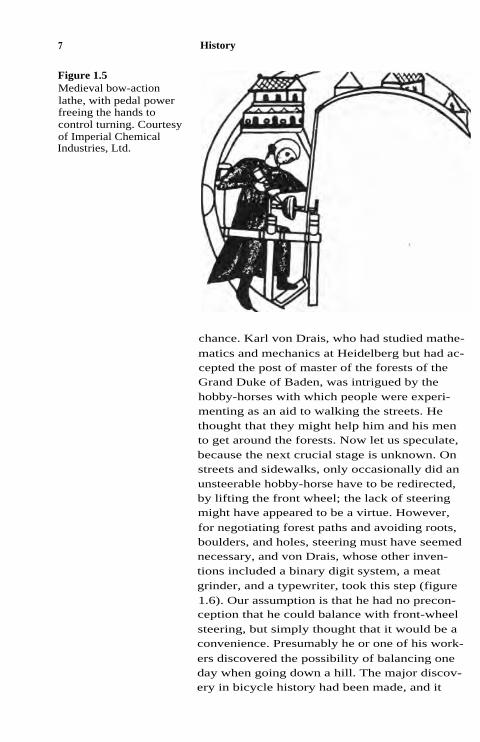
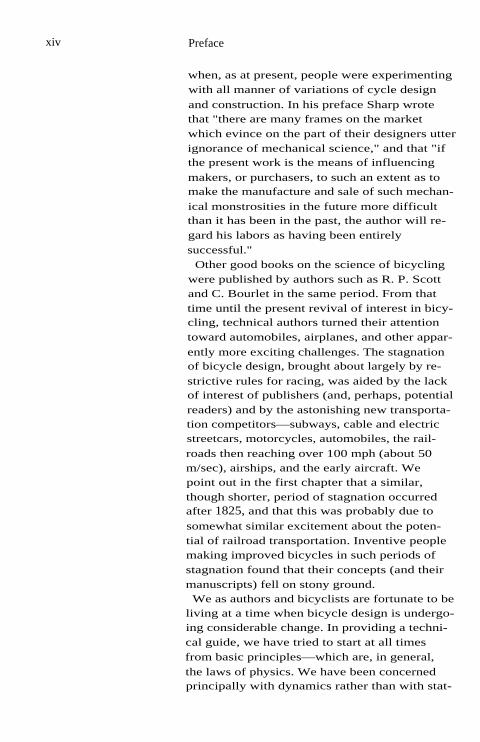
Figure 1.5Medieval bow-actionlathe, with pedal powerfreeing the hands tocontrol turning. Courtesyof Imperial ChemicalIndustries, Ltd.
7 History
chance. Karl von Drais, who had studied mathe-
matics and mechanics at Heidelberg but had ac-cepted the post of master of the forests of theGrand Duke of Baden, was intrigued by thehobby-horses with which people were experi-menting as an aid to walking the streets. Hethought that they might help him and his mento get around the forests. Now let us speculate,because the next crucial stage is unknown. Onstreets and sidewalks, only occasionally did anunsteerable hobby-horse have to be redirected,by lifting the front wheel; the lack of steeringmight have appeared to be a virtue. However,
for negotiating forest paths and avoiding roots,boulders, and holes, steering must have seemednecessary, and von Drais, whose other inven-tions included a binary digit system, a meatgrinder, and a typewriter, took this step (figure1.6). Our assumption is that he had no precon-ception that he could balance with front-wheelsteering, but simply thought that it would be aconvenience. Presumably he or one of his work-
ers discovered the possibility of balancing oneday when going down a hill. The major discov-ery in bicycle history had been made, and it

8 Human power
was not recorded. The vehicle that von Draisdeveloped was, however, noted in the German
newspapers in 1817. It was lighter and moreutilitarian than most of the heavy and somewhatornate hobby-horses. In Paris, where von Drais
obtained a five-year patent (ref. 3, p. 15), it wascalled the Draisienne. Despite some initial skep-ticism and ridicule, von Drais was soon demon-strating that he could exceed the speed ofrunners and that of the horse-pulled "posts,"even over journeys of two or three hours. Hisability to balance when going down inclinesand to steer at speed must have been importantin this. He indeed must have the principal
claim to being the originator of the true bicycle.Karl von Drais had many imitators. One was
the London coachmaker Denis Johnson, whoselighter and more elegant conveyance was sooncalled the dandy-horse. He set up a school in
which young gentlemen could learn to ride. Inthe next few years use of the vehicle spread toclergymen, mailmen, and tradespeople, andother mechanically minded people began takingit seriously. In 1821, Louis Gompertz fitted a
swinging-arc ratchet drive to the front wheel(figure 1.7) so that the rider could pull on thesteering handles to assist his feet.Around 1839 a blacksmith named Kirkpatrick
Macmillan, who lived near Dumfries, Scotland,made the first known attempt to harness legmuscles to turn the wheels directly (ref. 2, pp.
34-38). He added cranks to the rear wheels of asteerable velocipede, with connecting rods com-ing forward to swinging pedals (figure 1.8). Be-cause he made it possible for the rider to pedaland stay continuously out of contact with theground, Macmillan might be called the origina-tor of the true bicycle. But Macmillan worked inisolation. Although he bicycled 140 miles toGlasgow on his machine (creating widespreadinterest, receiving the first traffic fine for knock-ing down a child in the throng that surroundedhim, and being reported in the Glasgow papers),

Figure 1.6A Draisienne. Fromreference 5.
Pull handle
Sectorgear
Pinion onone-wayclutch
History
Padded support for chest
Figure 1.7Gompertz's hand drive.

10 Human power
Figure 1.8A copy of KirkpatrickMacmillan's velocipede,made around 1860 byThomas McCall ofKilmarnock. Reproduced,with permission, fromreference 2.
and although he made and sold several of his
machines, no further developments followedfrom his efforts. The reason seems to be that thecountries in which two-wheeled vehicles hadbeen developed and received with such enthusi-asm—principally Germany, France, andBritain—were in the grip of railway mania.There was a new, fast way to travel, and this
technology lured the creative dreams and effortsof inventors and mechanics away from the moremundane human-powered transportation. Theparallels with what was to happen sixty yearslater, when the enthusiasm for the safety bicyclewas to evaporate before the flaming passion forthe automobile, are striking.
It would be an exaggeration to claim that alldevelopment except that by Macmillan stopped.From 1815 to 1870 the term "velocipede" wasused for any foot-propelled vehicle. They wereused by some enthusiasts (including Prince Al-bert, husband of Queen Victoria), but not exten-sively. The machines' size and weight and thepoor roads deterred walkers from changing their
mode of travel. Willard Sawyer, a coachmakerin Kent, England, made increasingly sophisti-

11 History
cated four-wheeled velocipedes, such as the oneshown in figure 1.9, and exported them around
the world, from about 1840 to 1870 (ref. 2, pp.39-46). They were used by a few enthusiasts,but no movement developed. Undoubtedly therewere lone mechanics and inventors in variouscountries making what seemed to be improve-ments to the Draisienne. It seems very likelythat among these were some (for instance, P. M.Fischer in Schweinfurt, Germany, in 1850-1855°) who took what in hindsight seems the
obvious step of coupling cranks and pedals tothe front wheel. But all we know is that thismove was left to Pierre Michaux, who also im-
proved the rest of the machine (figure 1.10),commercialized it effectively, and set the flamethat roared through France, the United States,and later Britain. The first true bicycle crazewas underway.Why, and why then? There seems to have been
no major technological development to triggerit. The two-wheeled pedaled velocipede couldhave been invented in 1820, although theweaker metals of that time would have led to aless graceful machine. Perhaps it was helped byMichaux craftsmanship, which was widelypraised. Perhaps it was Michaux's managementability; he organized factories that could pro-duce five machines a day. Perhaps it was theMichaux family's flair for promoting the ma-chines with demonstrations and races. Butabove all the machine was fun to ride, andthousands did so.We might not think it so entrancing nowadays.
The wooden wheels had rigid (compression)spokes and iron rims. It was only in the late1860s that rubber was nailed onto the rims tocushion the harsh ride and ball bearings werefirst used on bicycles to give easier running.Then the French leadership was lost when, inthe Franco-Prussian war of 1870-1871, theFrench bicycle factories were required to turn toarmaments (ref. 2, p. 61).

Figure 1.10A Michaux velocipede.From reference 5.
12 Human power
Figure 1.9A Sawyer four-wheeledvelocipede. Reproduced,with permission, fromreference 2.

Figure 1.12Tangent-tension spoking.From reference 5.
13 History
Figure 1.11Starley's "lever-tension"wheel. From reference 5.
Development was fast in Britain, where pro-duction had been started more to fill the unsa-
tiated French demand than to supply anydomestic market. The technical leadership was
repeatedly taken by James Starley. The suspen-sion or tension wheel had already been experi-mented with in France; around 1870 Starleyintroduced the "lever-tension" wheel, with ra-dial spokes and a lever for tensioning andtorque transmission (figure 1.11), and in 1876he came up with the logical extension of thisidea, the tangent-tension method of spoking(figure 1.12). This has remained the standardspoking method to this day.Front wheels were being made larger and
larger to give a longer distance per pedal revo-
lution, and therefore greater speed. Starley andothers recognized the advantages of using achain as a step-up transmission, but experimen-ters found that the available chains quicklyfroze up in the grit and gravel of contemporaryroads. Soon front wheels were made as large ascomfortable pedaling would allow. One boughtone's bicycle to fit one's leg length. A large"high-wheeler" or "ordinary" would have adriving wheel about 60 inches (about 1.5 m) in

Figure 1.13The ordinary, or high-wheeler, or penny-farthing. From reference5.
14 Human power
diameter (figure 1.13). In the English-speakingworld we still translate gear ratios into equiva-lent driving-wheel diameters, and this size cor-
responds to the middle gear of a typical modernbicycle. (The French use la developpement, thewheel's circumference.) The 1870s were theyears of the dominance of the high-wheeler. Bythe end of the decade, ball bearings were usedfor both wheels and for the steering head, the
rims and forks were formed from hollow tubing,the tire rubber was greatly improved over thecrude type used in 1870, and the racers hadbeen reduced to under 30 lb (13.6 kg). A ridableJames "ordinary" weighing only 11 lb (5 kg)was produced.The "ordinary" was responsible for the third
two-wheeler passion, which was concentratedamong the young middle-class men of France,Britain, and the United States and was fosteredby military-style clubs with uniforms and evenbuglers. The ordinary conferred unimaginedfreedom on its devotees; it also engendered an-tipathy on the part of the majority who didn't or

15 History
couldn't bicycle. Part of the antipathy was envy.The new freedom and style were restricted to
young men. Strict dress codes prevented all butthe most iconoclastic of women from ridinghigh-wheelers. Family men, even if they werestill athletic, hesitated to ride because of the fre-quent severe injuries to riders who fell. Unath-letic or short men were excluded automatically.These prospective riders took to tricyles (ref. 5,pp. 165-182), which for a time were as numer-
ous as the ordinaries.There were two technological responses to the
need to serve the "extra-ordinary" market.James Starley played a prominent role in thefirst, and his nephew in the second.The first was the development of practical ma-
chines of three or four wheels, in which theneed to balance was gone and the rider could beseated in a comfortable, reasonably safe, and
perhaps more dignified position. Such vehicleshad been made at different times for at least a
century, but the old heavy construction madepropelling them a formidable task. In fact, themotive power was often provided by one ormore servants, who in effect substituted forhorses. Starley's Coventry Lever Tricycle, pat-ented in 1876, with his new lightweight tan-gent-spoked wheels, could be used withcomparative ease by women in conventionaldress and by relatively staid males. Starley pro-duced this vehicle in large numbers for severalyears. In a prophetic move, he soon abandonedlever propulsion for more conventional crankswith circular foot motion (figure 1.14). He hadfound a chain that worked, at least in the possi-bly more protected conditions of a tricycle. The
Coventry Lever and its successors had one largedriving wheel and two steering wheels, one infront and one behind. Starley saw the advantageof two large driving wheels on either side of therider(s) and a single steering wheel in front. For
this arrangement to work, power had to betransmitted to two wheels, which might (for in-

Figure 1.14Starley's Coventry rotarytricycle. From reference5.
16 Human power
stance in a turn) be going at different speeds.Starley reinvented the "balance gear" (ref. 5, pp.240-241), which is now known as the differen-tial. Starley's Royal Salvo tricycle became thepredominant form—for single riders, for two sit-ting side-by-side, and even for one behind theother (figure 1.15). This is not to say that therewere no other forms; the reverse of this arrange-ment, for instance, with the steering wheel trail-ing the large driving wheels, was used fortradesmen's carrier machines. But the front-steerer was perceived as giving better control(one did not have to steer toward a pedestrianor a pothole to take avoiding action, as is neces-sary with rear-steerers). Gradually the frontwheel was made larger and the driving wheelssmaller, as could be done with chain drives ofincreasing efficiency and reliability. By 1886 thefront wheel was connected directly to the han-
dlebars (figure 1.16). This was a simpler, morereliable, and safer arrangement than the rack-and-pinion and other indirect systems whichhad been used. The modern tricyle had evolved,with the modern riding position in which one
sits or stands almost over the cranks and splitsthe body weight among handlebars, pedals, andsaddle.This modern tricyle of 1886 was also very sim-
ilar to the emerging form of the modern bicycle.In fact, the second response to the exclusion ofso many from the high-wheeler movement was

Figure 1.15Starley's Royal Salvotricycle. From reference5.
17 History
Figure 1.16A modern-type tricycle.From reference 5.
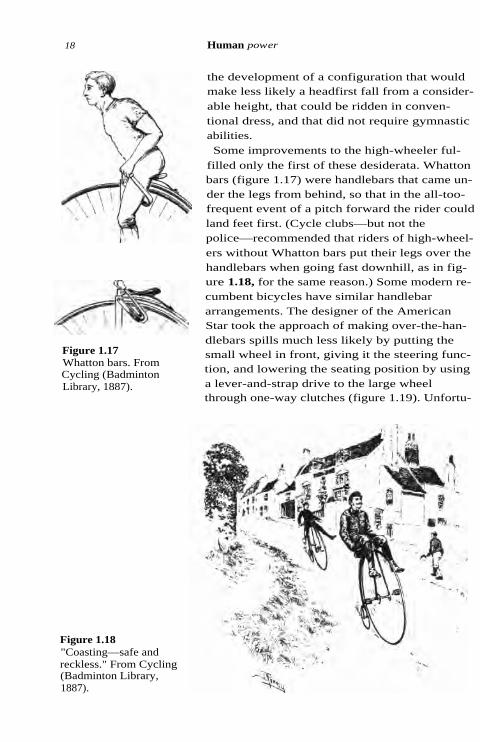
Figure 1.17Whatton bars. FromCycling (BadmintonLibrary, 1887).
18 Human power
the development of a configuration that wouldmake less likely a headfirst fall from a consider-
able height, that could be ridden in conven-tional dress, and that did not require gymnasticabilities.Some improvements to the high-wheeler ful-
filled only the first of these desiderata. Whattonbars (figure 1.17) were handlebars that came un-der the legs from behind, so that in the all-too-frequent event of a pitch forward the rider couldland feet first. (Cycle clubs—but not thepolice—recommended that riders of high-wheel-ers without Whatton bars put their legs over thehandlebars when going fast downhill, as in fig-ure 1.18, for the same reason.) Some modern re-cumbent bicycles have similar handlebararrangements. The designer of the AmericanStar took the approach of making over-the-han-dlebars spills much less likely by putting thesmall wheel in front, giving it the steering func-tion, and lowering the seating position by usinga lever-and-strap drive to the large wheelthrough one-way clutches (figure 1.19). Unfortu-
Figure 1.18"Coasting—safe andreckless." From Cycling(Badminton Library,1887).

Figure 1.19The American Star, atreadle-action bicycle of1880. From L. Baudry deSaunier, Le cyclisme,theorique et pratique(Paris: Librairie lustre,1892).
19 History
nately, this arrived too late (1885) to have muchimpact, because the true "safety" bicycle hadevolved almost to its modern form by that date.Another type of bicycle that was safer to ride
than the high ordinary was the "dwarf" front-driver (figure 1.20) with a geared-up drive to asmaller front wheel (ref. 5, pp. 152, 158). Such"geared ordinaries" were offered in the early1890s because riders accustomed to front-drive
machines did not always take kindly to the rear-drive safeties. Small-wheeled Bantam bicycleswith an epicyclic hub gear (figure 1.21) weremarketed as late as 1900. These can be classedas the earliest "portable" machines, because
they fitted well into the "boot" of a horse-drawn"trap."
It had long been recognized that it would bemost desirable from the viewpoint of safety tohave the rider sitting between two wheels ofmoderate size. Many attempts were made overthe years. Macmillan's lever-propelled velo-
cipede of 1840 had this configuration. In 1869—the year of the first Paris velocipede show, atwhich rubber tires, variable gears, freewheels,
tubular frames, sprung wheels, and band brakeswere shown—Andre Guilment made what might

20 Human power
Figure 1.20"Dwarf" front-drivebicycle. From reference5.
Figure 1.21"Bantam" geared front-drive safety bicycle.From reference 5.
Figure 1.22Starley safety bicycle.From reference 5.

21 History
be classed as the first safety bicycle. But the di-rect descendants of today's bicycles evolvedrapidly in the one or two years before 1885,when several were shown in Britain's annualStanley Bicycle Show. James Starley had died in1881, but his nephew John Kemp Starley, work-ing with William Sutton, produced a series of
"Rover" safety bicycles, which by 1886 had di-rect steering and something very close to thediamond frame used in most bicycles today (fig-ure 1.22).One major development in the mainstream
flowing to the modern bicycle remained: thepneumatic tire. This was patented in 1888 byJohn Boyd Dunlop, a Scottish veterinarian inBelfast, although another Scot, R. W. Thomson,had patented, but apparently not developed,pneumatic tires for horse-drawn vehicles in1845. 6 Dunlop's early tires (made to smooth the
ride of his son's tricycle) were crude, but byMay 1889 they were used by W. Hume in bicy-cle races in Belfast—and he won four out offour. Success in racing in those days gave aclear signal to a public confused by a multitudeof diverse developments. Bicyclists saw that, asin the case of the "safety" versus the high-wheeled bicycle, a development had arrivedthat promised not only greater speed, or thesame speed with less effort, but greater comfortand, especially, greater safety. Within fouryears, solid tires had virtually disappeared fromnew bicycles, and Dunlop was a sterlingmillionaire.With the arrival of the pneumatic-tired direct-
steering safety bicycle, only refinements in com-ponents remained to be accomplished before themodern-day bicycle could be said to have been
fully developed. Various types of epicyclic spur-gear variable-ratio transmissions for the bracketsand rear hubs of chain-driven safety bicyclescame on the market in Britain in the 1890s.Some heavier devices were available earlier fortricycles. The Sturmey-Archer three-speed hub

22 Human power
(1902) was the predominant type, as it still is inmany parts of the world, but there were manycompetitors at around the turn of the century.The derailleur or shifting-chain gear appearedin one form at about this time but was not pop-ular. It was developed by degrees in Europe,
and was eventually accepted for racing in the1920s.
Undoubtedly, much more will be discovered
about the history of the modern traditional sin-gle-rider bicycle, and unrecognized inventorswill receive the honor due them. Inquiring read-ers can find much more history than we havespace for here in the excellent books listed atthe end of the chapter.We close this chapter with a short review of
the history of one of the many types of nontra-ditional bicycles: the "recumbent." Our reasonfor discussing recumbents rather than tandems,folding bicycles, pedicabs, goods transporters,or sprung bicycles is that most modern record-breaking machines are recumbents. Also,D.G.W. is convinced that greater safety can re-sult from the use of the recumbent riding posi-tion in highway bicycles. In addition, what littlewe know of the history of this variant formmight help to illustrate the past and present fla-vor of the cycle industry.
Many early cycles (particular tricycles) usedthe semirecumbent position. The "boneshaker"was often ridden with the saddle well back on
the backbone spring and the feet at an angleconsiderably higher than that for the modernupright "safety." In contrast with the riders ofthe high-wheeler and of the "safety," who were
told to position the center of gravity verticallyover the center of the crank, the semirecumbentrider sits in something like a chair and puts hisfeet out forward on the pedals. The pedal-forcereaction is taken not by the weight of the body(or, when that is exceeded, by pulling down onthe handlebars), but by the backrest.The first known semirecumbent bicycle (by

23 History
which we mean one where the rider's center ofgravity was low enough relative to the front-
wheel road-contact point for there to be a negli-gibly low possibility of his being thrown overthe front wheel in an accident) was built inGhent by Challand sometime before 1895 (ref. 3,p. 47). Challand called it the Normal Bicyclette.The rider sat rather high, directly over the rearwheel. In 1896 a U.S. patent application wasfiled by I. F. Wales for a somewhat strange-look-ing recumbent bicycle with hand and foot drive(figure 1.23). 7 A much more modern-looking re-
cumbent bicycle was constructed by an Ameri-can named Brown and taken to Britain in 1901(figure 1.24). 8 By this time orthodoxy restedfirmly with the traditional safety bicycle, andthe derision that had successively greeted thehobby-horse, the Draisienne, the velocipede,and the safety had been forgotten. A review of
the Brown recumbent in The Cyclist (ref. 8) wasderisive to the point of sarcasm:
. . . the curiously unsuitable monstrosity in theway of a novel bicycle shown in the singleexisting example of Mr. Brown's idea of thecycle of the future here illustrated.... Theillustration(s) fully show(s) the rider's positionand the general construction of this crazyeffort.... The weight (30 lb) and cost of themachine are greatly increased.... Themounting and dismounting are easy, and this isa fine coasting machine, the great wheelbasemaking very smooth riding . . . and turns in asmall circle. The machine runs light and is agood hill-climber, and it is only fair to say thatthe general action of this queerest of allattempts at cycle improvement is easy andgood—far better than its appearanceindicates.... The surprising fact is that any
man in his sober senses could believe that therewas a market for this long and heavymonstrosity at the price of a hundred dollars(£20). . . .

24 Human power
Figure 1.23Design for hand-and-foot-powered recumbentbicycle patented by I. F.Wales in 1897.
Figure 1.24Brown's 1900 recumbentbicycle. Adapted fromreference 8.

25 History
What of the apparent lack of American contri-butions to the mainstream of bicycle develop-ment? What happened to the Yankee genius inengineering and mechanics? The U.S. patent of-fice was in fact flooded with applications to pat-ent improvements to velocipedes from 1868 on.The French and British makers found it neces-sary to follow the developments taking place ac-ross the Atlantic (ref. 3, p. 61 et seq.). In 1869Pickering's Improved Velocipedes were ex-ported from New York to Liverpool. But theAmerican craze, which the Scientific Americanstated had made the art of walking obsolete,suddenly petered out in 1871 as quickly as ithad started, leaving new businesses bankruptand inventors with nowhere to go (ref. 2, p. 66).There was then a lull until 1877, when thehigh-wheel bicycle was imported. Colonel Al-bert Pope started manufacturing them in theEast a year later. But conditions were difficultfor bicycles. In Europe, the high bicycle enabledpeople to travel much farther than was comfort-ably possible on a velocipede, and in Britain theroads were good enough for the country to betraversed from Lands End in southwest Corn-wall to John O'Groats in northeast Scotland (924miles; 1,490 km) in seven days (ref. 2, pp. 126-127). In the United States the distances betweentowns were (except perhaps in New England)enormous, and the roads were poor (ref. 2, pp.
82-83). Accordingly, the bicycle did not have,and did not convey, as much freedom, and themarket was therefore smaller and far more dis-
persed than in Europe.Recumbents were more successful in Europe.
Peugeot produced one model commercially in1914, but this effort was doubtless snuffed outby the start that year of the Great War. After thewar, the Swiss Zeppelin engineer Paul Jaraybuilt recumbents in Stuttgart in 1921.9
Racing recumbents (figure 1.25) were brought
out in France in the 1930s. They became knownas "velocars," probably because four-wheeled

Figure 1.25"Velocar" recumbentracing bicycle.
26 Human power
vehicles of that name had become popular, andthese used a similar position for the rider. Witha velocar, a relatively unknown racing cyclist,Francis Faure, defeated the world champion,Lemoire, in a 4-km pursuit race and broke trackrecords that had been established on conven-tional machines. 10 A genuine orthodoxy per-vaded the bicycle industry and the InternationalCycling Union, which controlled world bicycleracing. Instead of setting up a procedure and
special category for machines such as the velo-car, the Union banned unconventional typesfrom organized competition. This decision de-nied novel ideas the opportunity of being testedand publicized through racing, and thereby de-terred experimentation and development.Only with the open-rule human-powered-vehi-
cle competitions, started in California in 1974,has the inventiveness of human-powered-vehi-cle designers been given an incentive. With allclasses of races now being won by recumbentmachines of a large variety of types, the techno-
logical history of this type of vehicle, and of bi-cycles in general, is again being written. Theseare exciting times. We wonder if there may notalso be a parallel in this new period of develop-ment with the period that started around 1866.
The excitement over railway travel had seemedto drain away either the excess energies of in-ventors or the support for their activities, so that

27 History
bicycle development languished. Occasional in-ventions like Gompertz's or Macmillan's werenot followed up. But perhaps by the mid-1860sthe railway was accepted, and it was apparentthat it was not going to solve all transportationproblems. Similarly, in the 1890s the motorcararrived, and suddenly it was fashionable not
only to travel in them, but to be involved in de-veloping them. And two bicycle mechanics pro-
duced the first powered airplane only a littlelater. From then almost until the present daythere has been a widely acknowledged love af-fair with the automobile, and with the airplane,first in the developed countries and later in the
undeveloped countries. Only when disenchant-ment set in over the damage which these meth-ods of transportation were wreaking on ourcities did widespread enthusiasm for bicycle de-velopment surface once more.May future histories record that new develop-
ments led to a new wave of popularity for hu-man-powered travel, one that will last longerthan some of the crazes of the past.
References 1. L. Reti (ed.), The Unknown Leonardo (New York:McGraw-Hill, 1974), pp. 178-179.
2. A. Ritchie, King of the Road (Berkeley, Calif.: Ten-Speed, 1975).
3. W. Wolf, Fahrrad and Radfahrer (Leipzig: Spamer,1890/Dortmund: Hitzegrad, 1979).
4. P. von Salvisberg, Der Radfahrsport in Bild andWort (Munich, 1897/Hildesheim and New York: Olms,1980), p. 13.
5. A. Sharp, Bicycles and Tricycles (London: Long-mans, Green, 1896/Cambridge, Mass.: MIT Press,1977).
6. R. W. Thomson, Carriage Wheels, U.K. patent10,990, 1845.
7. R. Barrett, Recumbent cycles, The Boneshaker(Southern Veteran-Cycle Club, U.K.) 7 (1972): 227-243.
8. H. Dolnar, An American stroke for novelty, TheCyclist (London) (8 January 1902): 20.

28 Human power
Recommended reading
9. H.E. Lessing (University of Ulm, West Germany),personal letter to D.G.W., 14 August 1980.
10. "The Loiterer," Velocar versus normal, Cycling(London) (2 March 1934): 202.
S. S. Wilson, Bicycle technology, Scientific American(March 1973): 81-92.
G. H. Bowden, The Story of the Raleigh Cycle (Lon-don: Allen, 1975).
. A Shortened History of the Bicycle (Not-tingham: Raleigh).
I. A. Leonard, When Bikehood Was in Flower (SouthTamworth, N.H.: Bearcamp, 1969).

Human power generation
As an energy producer, the human body hassimilarities and dissimilarities with the engineof an automobile. Energy is taken in throughfuel (food and drink, in the case of humans)."Useful" energy is put out in the form of torqueon a crankshaft; and "waste" energy is dissi-pated as heat, which may be beneficial in coldweather. The peak efficiencies of the two sys-tems (the energy in the power going to thecrankshaft divided by the energy in the food orfuel) are remarkably close to one another, in theregion of 20-30 percent. But automobile en-gines seldom work at peak efficiency, and onlyat full power, whereas the rider of a multispeedbicycle can operate much closer to peak effi-ciency at all times. Another significant differ-ence is that whereas the automobile is poweredby a "heat engine," the human body is a kind offuel cell. Also, human output changes overtime, and can draw on body reserves; the gaso-line engine can work steadily until the fuel runsout, when the engine delivers nothing. Humansalso vary greatly from one to another, and fromone day to another, and from one life stage to
another.Most of the information in this chapter has
been obtained by careful experiments, mostoften with test subjects on power-output-mea-suring devices called ergometers (figures 2.1,
2.2). Most ergometers are pedaled in the sameway as bicycles; other types are "rowed" or"walked." Exercise physiologists can take care-ful and often precise measurements of humanwork output in their laboratories. However, wemust keep in mind three reservations aboutergometers:
• People vary widely in performance, and unlessvery many are tested (as has been seldom the
2

30 Human power
Figure 2.1Racing-bicycle ergometer.
case) the data cannot be generalized to thewhole of humanity.
• Pedaling or rowing an ergometer usually feelsstranger than riding a novel type of bicycle. Itmay take a month of regular riding before onebecomes accustomed to and efficient with anovel bicycle, as one's muscle actionsgradually adapt to a new motion. Subjects areseldom given the opportunity to adapt formore than a few minutes (occasionally, hours)to working an ergometer.
• Most of the energy put into bicycling, and afair proportion of that put into rowing a boat,
goes into air friction, and the heat transferredfrom a hot body to a cooler airstream is largelyproportional to air friction. Subjects pedalingergometers are seldom given equivalentcooling, and their maximum output istherefore likely to be limited by heat stress.
(There are exercisers on the U.S. market inwhich most of the power is dissipated in fans,

Subject'sown bicycle
Loadingweight
Indicatorlamps
Adjustableconstant-speeddrive
Moving contact
31 Generation
Figure 2.2Muller ergometer. Loadand speed are set; subjecttries to keep center lamplit. Run stops whenrearmost lamp lights up.
thus simulating the "cube-law" effect of windresistance, but the air flow is not directed at
the pedaler).
For these reasons, power-output measurements
on ergometers are likely to be lower than wouldbe given by the same subjects pedaling or row-ing their own familiar machines in a reasonablycool breeze.
Some of the available test data on humanpower output are, however, taken from subjectsbicycling on pavement, with various ingeniousmeans used to measure work output and/or oxy-gen consumption (figure 2.3). These data arelikely to be more reliable than ergometer data.Even here someone wearing various sensors,possibly including a breathing mask, is likely tofind that at maximum output there is some de-gree of resistance to movement and/or to breath-ing, and that this will reduce the peak output
somewhat.'

32 Human power
Figure 2.3Cyclist using breathing-rate-measuringequipment. Photographsupplied by researchworkers at NijmegenUniversity, TheNetherlands.
Most ergometers have frames, saddles, handle-bars, and cranks similar to those of ordinary bi-cycles. The crank drives some form of resistanceor brake, and the whole device is fastened to astand, which remains stationary during use.Other ergometers can measure the output fromhand-cranking in addition to that from pedal-ing. Some permit various types of foot motionand body reaction, including rowing (sliding-
seat) actions. The methods employed for powermeasurement range from the crude to the so-phisticated. One problem is that human leg-power output varies cyclically (as does that of apiston engine) rather than being smooth (as

33 Generation
with a turbine). A device indicating instanta-neous power (pedal force in the direction ofmotion multiplied by pedal velocity) wouldshow peak values of perhaps one horsepower
(746 watts), whereas the average would be only
0.2 hp (149.2 W). Therefore, some form of aver-aging is usually employed. In some cases thesubject is supposed to keep pedaling at a con-stant rate over a minute or two to obtain accu-rate results; in other systems the power can beintegrated and averaged electronically over anydesired number of crank revolutions.2.3
Muscle chemistry andmechanisms
A large muscle is composed of a large numberof individual fibers. Each fiber, like the muscleitself, can only contract; a muscle cannot"push." Neither can an individual muscle fiberexert a continuous force. It is caused to contractby the nervous system's release of adenosine tri-phosphate (ATP). After contraction, a fiber willagain relax. If a muscle is required to exert acontinuous force, for instance in holding up aweight, muscle fibers will "fire" sequentially.Even if the weight is not lifted, which meansthat in the thermodynamic sense no externalwork is being done, the muscle will require en-ergy either from its stores or from the blood-stream. We call this "isometric" exercise,because there is no change in the measurementof the muscle or of the body. If we are trying tomaximize external work and to minimize fa-tigue, as we are in bicycling, we should avoidisometric stress as far as possible.The ATP, which is the muscle fiber's immedi-
ate fuel, can be supplied in two ways. 4 For al-most immediate short-term use, the muscle candraw on its own stored phosphoryl creatine andglycogen. It can use these without the need foroxygen from the blood; hence, we call this mus-cle action anaerobic. The muscle fibers thatwork anaerobically are termed type-II fibers.
They are developed by sprinters and by animalswho rely on a sudden spurt of activity to escape

34 Human power
from their predators. These fibers are found inthe white meat of the turkey. Anaerobic-muscleuse in humans can last for up to about 5 min-utes. Because there is a restricted amount of en-ergy available (proportional to the mass of the
muscle), the duration of its use depends on thepower output demanded. For longer-term use,in so-called steady state, the ATP needed by themuscle must be supplied from glucose and fatty
acids that are supplied by the blood and oxi-dized. The muscle fibers that can work for longperiods, which use the blood and work with ox-ygen and therefore work aerobically, are termedtype-I fibers, and are dark brown, like the dark
meat of a turkey's legs. Cyclists need both type-Iand type-II fibers, and can develop one typemore than the other by training and adaptation.
Breathing When a cyclist is tested on an ergometer for a
sufficiently long period that the aerobic muscleactions predominate, it is found (see, for exam-ple, ref. 5) that for each milliliter per second ofoxygen absorbed by the lungs about 4.5 watts ofpower are put out by the legs. Laboratory exper-iments on the calorific ("heating") value of theblood sugars and other chemicals oxidized bythe absorbed oxygen show that for the sameflow the heat output would be about 18 W. Theefficiency of muscle action is, therefore, roughly25 percent.Most of the 75 percent of the energy that does
not appear as power at the pedals is dissipatedas heat. The human body employs variousmechanisms for keeping the trunk warm in coldweather when no exercise is being carried out,and other mechanisms for limiting the tempera-ture rise to about 2°C in hot weather and duringheavy physical activity. 6- 11 The evaporation ofperspiration can dissipate an enormous amountof heat: 2.42 kilowatts per gram per second ofperspiration. Thus, it is important for exercising
humans that their perspiration evaporate and

35 Generation
not just drip off. Fast-moving air evaporateswater far more quickly than slow-moving air. Asa consequence, a pedaler on a stationary ergom-eter drips sweat profusely at a work rate of 0.5hp (373 W). At 27 mph (12.1 m/sec)—a speedcorresponding to 373 W—a riding bicyclist iscooled far more effectively by sweat evaporation(refs. 2, 12).Thermodynamic engines such as steam-turbine
plants and internal-combustion engines are alsousually only about 20-30 percent efficient inconverting fuel energy to mechanical work, al-though the best engines working in optimumconditions can attain an efficiency of 45 per-cent. However, the limitations here derive fromthe second law of thermodynamics, and there-fore from the levels at which heat is added toand rejected from the engine.One of the many ways of expressing the sec-
ond law of thermodynamics is the following: Noengine can be more efficient than a thermody-namically reversible engine, and the efficiencyof such an engine can be shown to be given by
Power output W Rate of heat input Q2
= Q2 - Qi
for all enginesQ2
T2 -T, for reversible perfect engines,
T2
where T 2 is the temperature and Q2 the rate of
heat addition, and T, is the temperature and Q,the rate of heat rejection. Temperatures aregiven in degrees above absolute zero (degreesRankine, °R, on the Fahrenheit scale, degreesKelvin, °K, on the Celsius scale). Absolute zero
is –460°F (-273°C).A steam-turbine plant fed with high-tempera-
ture steam is more efficient than one usingsteam at lower temperatures. To achieve a ther-modynamic efficiency of 25 percent, even anideal engine rejecting heat at above room tem-

36 Human power
perature T, (as must the human body) would re-quire that its fuel energy be absorbed at T2,
which can be calculated as follows:
Efficiency 1 — —,TT
,, 0.25 = i;
4T, 4 X 300°KT2 = =
3 3
400°K (127°C; 720°R; 260°F)
for a heat-rejection temperature T, of 27°C
(300°K; 80°F).Obviously, 127°C cannot be tolerated in the
body. Therefore, the human "engine" is notsubject to the restrictions of the second law ofthermodynamics. It is a type of fuel cell inwhich chemical energy is converted directly tomechanical power. The energy not converted to
power must appear, as for heat engines and fuelcells, as heat.The human engine has an additional character-
istic not generally found in machines: Somefuel must be "burned" to keep it going when itis at rest. (In this sense it is somewhat similar toa traditional steam plant, in which fuel must beburned continually to keep steam pressure upeven when no power is being delivered). Theamount of oxygen absorbed by the lungs of aperson of average weight, at rest and not usingany voluntary muscles, is about 5.5 millilitersper second (one-third of a liter per minute).This quantity is additional to any other absorp-
tion from muscle exercise. In ordinary air, a li-ter of oxygen is found in about 5 liters of air.However, when air is breathed, about 24 litersmust be passed through the lungs for a liter of
oxygen to be absorbed." Thus, about 380 per-cent more air than is needed to produce energyis used in the human engine. Most other en-
gines, such as internal-combustion and steamengines, require only about 5-10 percent "ex-
cess" air to ensure complete combustion of thefuel. Gas turbines more nearly approach humanlungs, taking in about 200 percent excess air.

37 Generation
Table 2.1 Breathing rates for cycling and walking.
Cycling
SpeedTractivepower
Breathing rate(1/min) Metabolic heat
Racer' Tourist°
hp W Oxygen Air kcal/min W./` mph m/sec mph m/sec
27 12.1 22.5 10.1 0.5 373 4.8 115 24 1,68025 11.2 21 9.4 0.4 298 3.4 93 19.5 1,36522 9.8 18.5 8.3 0.3 224 3 72 15 1,05019 8.5 16 7.2 0.2 149 2.1 50 10.5 73514.5 6.5 12 5.4 0.11 82 1.2 29 6 42010.5 4.7 8.3 3.7 0.05 37 0.75 18 3.75 263
7.2 3.2 6 2.7 0.025 19 0.53 13 2.65 1863.2 1.4 1.8 0.8 0.008 6 0.38 9 1.9 1330 0 0 0 0 0.3 7 1.5 105
Walking
Speed
mph m/sec
4.46 2 0.141 105 1.83 44 9.1 6363733.33 1.5 0.076 57 1.1 26 5.5 3852.23 12 0.0415 31 0.71 18 3.5 24511.1 0.5 0.0226 17 0.52 12.5 2.5 1 1750 0 0 0 0.28 6.8 1.4 98
Sources of data "Velox," Velocipedes. Bicycles and Tricycles: How to Make andUse Them (London: Routledge, 1869); M. G. Bekker, Theory of Land Locomotion(Ann Arbor: University of Michigan Press, 1962); G. A. Dean, An analysis of theenergy expenditure in level and grade walking, Ergonomics 8 (1965), no. 1: 31-47.
a. Total mass 77 kg (170 lb), frontal area 0.34 m2 (3.6 ft2 ), tire pressure 100 lbf/m2(689 kPa).b. Total mass 85 kg (187 lb), frontal area 0.511 m2 (5.5 ft2 ), tire pressure 50 lbf/m2(345 kPa).

38 Human power
Using all the above information, we show intable 2.1 how breathing rates increase for an av-erage rider (150 lb; 68.04 kg) cycling on the
level in still air. It is assumed that, for everyliter of oxygen absorbed, 24 liters of air have tobe breathed.
For a nonathletic person the maximum oxy-gen-breathing rate is assumed to be about 50
ml/sec, or 3 1/min. Table 2.1 shows that when arider is using about half the maximum oxygen-breathing capacity the power output is about0.1 hp (74.6 W). These conditions are thought tobe such that an average fit man or woman couldwork for several hours without suffering fatigueto an extent from which reasonably rapid recov-ery is not possible. This rate of work is recom-mended for workers in mines (refs. 5, 14).Experience has also shown that 0.1 hp (74.6 W)propels a rider at about 12 mph (5.36 m/sec) ona lightweight touring bicycle. As this speed can
ordinarily be maintained by experienced but av-erage touring-type riders, the numbers given intable 2.1 seem sound. Miscellaneous data givenby Adams (ref. 14) and Harrison (ref. 15) showaverage heat loads of 290-630 W for speeds of
6-i-13 mph (2.9-5.8 m/sec); some of these andother data are collected in figure 2.4Breathing effectiveness decreases with age. An
athlete's peak is reached at about 20, and it is arule of thumb that breathing capacity is halved
by age 80. 16 This figure has been substantiated,and the shape of the capacity-reduction curvehas been established, through analysis of theU.K. 1971 50-mile amateur time trials, in whichthe ages of the best "all-rounders" and of the"veterans" were given. The average speed foreach rider is plotted against the rider's age in
figure 2.5. There is no recognizable falloff inperformance up to age 40, after which there is asteady drop to that for the oldest competitor,aged 77. These performances have been con-verted to breathing capacity, estimated by themethod of reference 6. When the curve is ex-

39 Generation
Figure 2.4Gross caloricexpenditures ofbicyclists. Data for pointsfrom L. Zuntz,Untersuchungen fiberden Gasswechsel andEngegesumsatz des/?adfahrer (Berlin:Hirschwald, 1899); D. B.Dill, J. C. Seed, and Z. N.Marzulli, Energyexpenditure in bicycleriding, J. Appl. Physiol. 7(1954): 320-324; 0. G.Edholm, J. G. Fletcher, E.
M. Widdowson, and R.A. MacCanee, Energyexpenditure and foodintake of individual men,Br. J. Nutrition 9 (1955):286-300; M. S. Malhotra,S. S. Ramaswany, and S.N. Ray, Influence of bodyweight on energyexpenditure, J. Appl.Physiol. 12 (1962): 193-235; J. D. Brooke and C.J. Davies, Comment on"The estimation ofenergy expenditure ofsporting cyclists,"
Ergonomics 16 (1973),no. 2: 237-238; andreference 14. Curves Aand B (estimations fortractive-resistancecalculations) fromreference 6. Curve Cbased on data from G. A.Dean, An analysis of theenergy expenditure inlevel and grade walking,Ergonomics 8 (1965), no.1: 31-47, and J. S.Haldane, Respiration(London: OxfordUniversity Press, 1922).
kg cal/min

Figure 2.5Average speeds andestimated breathingcapacities in 50-miletrials (1971) as a functionof age.
40 Human power
trapolated to 80 years, the estimated breathingcapacity is indeed very close to half the peakvalue. (These results are for athletes. It is easy,through disease, smoking, or lack of exercise, todiminish one's breathing capacity by a muchgreater degree than that shown.)These data are also given some confirmation
by the performances at different times of RegHarris, the former world champion sprint bi-cyclist. In his peak form from 25 to 35 years ofage he would reach about 40 mph (17.9 m/sec)for the final 200-meter sprint on the track. (Inthis final spurt his muscles would largely beworking anaerobically). At age 55 he couldachieve about 36 mph (16.1 m/sec) (ref. 7). This10-percent reduction in speed agrees closelywith figure 2.3, and is equivalent to a reductionin power requirement of about 25 percent. Such

41 Generation
a reduction in maximum power-output capacityfor the same span of years is predicted by Fallsusing Muller's data (ref. 7, p. 304).
Road-racing cyclists appear to be able to useabout 80 percent of maximum breathing capac-ity for several hours.
Up to a breathing rate of about 0.67 ml/sec(40 1/min), people tend to breathe through the
nose (ref. 7, p. 55) if they have healthy nasalpassages. Nasal passages usually open duringexercise, even during a heavy cold. Above thisrate, the resistance to flow of even a healthynose becomes penalizing, and mouth breathingis substituted. For a normally healthy individualriding on the level in still air on a lightweightbicycle, this limiting rate for nasal breathing is
reached at about 14 mph (6.3 m/sec).Tests by Pugh'' on bicyclists riding on an er-
gometer and on a flat concrete track at speedsup to 27 mph (12.1 m/sec) confirmed the data of
table 2.1. Pugh's work also confirmed 23.6 per-cent as the net muscle efficiency for oxygen use(ref. 6). This figure was used in table 2.1 to cal-
culate the metabolic heat rates expended by therider from the tractive forces at the driving
wheel. The net efficiency therefore includes thetransmission losses from the rider's foot to thecontact point of the rear tire with the road—losses at the pedal, the crank set, the chain, andthe wheel hub. If one includes in the wheel-bearing losses those due to the load reaction aswell as to chain-force reaction, the total loss isabout 5 percent of the rider's output for a bicy-cle in first-class condition.
Maximum The power output of any animal will start at aperformance versus maximum as muscles draw on anaerobic re-time serves, and will fall to the steady-state, aerobic
level. Even aerobically, we would expect a fall-ing work output with time because of fatigue(which appears to be due to a clogging of themuscle "drainage"—the lymphatic system—with the breakdown products of the ATP, prin-

42 Human power
cipally lactic acid). Some of the best ergometerdata (figure 2.6) were taken by Harrison (ref. 15)with nine fit men, not champion cyclists oroarsmen, aged 22-42. We judge these data to begood because the highest outputs—apparentlythose of Harrison himself—tend to form an en-velope around the data of others. We notedabove that there are many reasons why thepower outputs of people as measured on er-
gometers might be less than the peaks of whichthey would be capable on a bicycle or in a row-ing shell; Harrison, who designed an ingeniousergometer capable of many different foot andhand motions and used a conventional bicy-cling ergometer, must have avoided the pitfalls.Harrison's curve for normal pedaling or cy-
cling (figure 2.6, curve 1) agrees closely withNonweiler's 18 estimated curve for racing cyclists(figure 2.7, curve A). The curves for linear("rowing") foot motion (2 and 4 in figure 2.6)
are initially considerably below the cyclingcurve but approach it after 5 minutes. Rowingdata taken on an ergometer have an additional
reason for a diminished output: If the feet arefixed with respect to the ground, as they arenormally fixed to the boat, the rower must ac-celerate his body and then use his muscle en-ergy to reverse the acceleration—a wastefulprocess. This occurs to only a minor extent inactual rowing. A rowing shell is so light thatthe center of gravity of the body is little dis-
placed, and the boat is accelerated and deceler-ated quite strongly. This wastes some energy,but not nearly so much as in a stationary ergo-meter. A bicycle propelled by a rowing motionwould also have a highly variable velocity. Thevariability would be more pronounced if the
feet were fixed to the bicycle and the seat wereon a roller track (the usual arrangement in ashell) than if the seat were fixed and the feetwere on a track. Likewise, in an ergometer onewould expect the power output to be less whenthe feet were fixed to the stationary frame (as

Time, min
Duration of performance, mm
43 Generation
Figure 2.6Human power by variousmotions: cycling (curve1), free and forcedrowing with feet fixed(curves 2 and 3,respectively), and freeand forced rowing withseat fixed (curves 4 and5, respectively). Fromreference 15.
Figure 2.7Peak human poweroutput for differentdurations. Curve A:estimated cycling datafrom reference 18. PointB: ergometer data fromLoughborough University(pers. comm.). Curve C:ergometer data from T.Nonweiler, AirResistance of RacingCyclists, report 106,College of Aeronautics,Cranfield, England, 1956.Curve D: winch datafrom J. C. Trautwine, TheCivil Engineer'sReference book, 21stedition (Ithaca, N.Y.:Trautwine, 1937), pp.685-687. Curve E:ergometer hand-crankdata from reference 12.

44 Human power
Harrison found; see reference 15) than if the
seat were fixed and feet moved.Of great interest are Harrison's results for what
he called "forced" rowing. (This has nothing to
do with the slave galleys mentioned in chapter1.) Harrison set up a motion whereby the mech-anism defined the ends of the stroke and con-served the kinetic energy of the moving masses.The piston-crank mechanism of a car engine isof this type. With forced rowing and the seatfixed, about 12.5 percent more power than withnormal pedaling was obtained throughout thetime period for all subjects. This significant
finding has not yet been translated into a practi-cal mechanism for harnessing pedal power, de-
spite several attempts by D.G.W.Nonweiler, besides estimating power output
during cycling (figure 2.7, curve A), obtainedergometer data (curve C), which were considera-bly lower in output. The reasons for the decre-ment may include those listed earlier as factorsthat might reduce ergometer output. For refer-ence, figure 2.7 also gives curves for winchingand for hand cranking.The question frequently arises as to whether or
not one can add hand cranking to pedaling andobtain a total power output equal to what onewould produce using each mode independently.Kyle and co-workers showed that, for periods ofup to a minute, 11-18 percent more power than
with the legs alone could be obtained with handand foot cranking. 19 The power was greaterwhen the arms and legs were cranking out ofphase than when each arm moved together withthe leg on that side. Whether or not this gain
can be projected beyond the period of anaerobicwork is not known.
Bicycling performance Most ergometer tests are made with subjects
who are young, male, and near the champion-ship class. One reason is obvious: A perfor-mance lower than that given by champions
might be due to lesser ability, or to any of the

Minutes
45 Generation
deficiencies in the testing method detailedabove. (Harrison's data are remarkable in re-cording high performance by nonathletes.) Wereport here two studies that appear to have beencarefully made, used nonathletes, and investi-gated various parameters such as the effect ofpedaling rate to the extent that interesting com-parisons with the performance of athletes can bedrawn.
Effect of pedaling rateGrosse-Lordemann and Miiller20 conducted er-gometer tests using the subjects' own bicycles,as in figure 2.2. This method ruled out unfamil-iarity with the foot motions and riding posi-tions. The output was measured at the wheels,and therefore was affected by transmission andtire-rolling losses. Figure 2.8 shows the power-time curves for a 34-year-old man, and also thepedal rotation rates (which could be preset onthe ergometer). The subject developed maxi-mum power for all durations at 40-50 rpm, a
Figure 2.8Pedaling power of a 34-year-old man versustime. Rpm values arepedal rotation rates.Smoothed data fromreference 20.

46 Human power
Figure 2.9Data from DartmouthCollege ergometer tests:relationship of pedalingspeed to torque.
rpm
Pedaling speed

47 Generation
rotation rate considerably slower than those
found for peak-output short-duration pedalingby other investigators. The power outputs werealso well below those found by others. In thesetests, no attempt was made to test champion-ship-class riders. Garry and Wishart 21 also
found that maximum muscle efficiency wasachieved at about 50 rpm.
Students at Dartmouth College used an er-gometer to find out what power output an ordi-nary untrained bicyclist could maintain overuseful periods of time. 22 They found that forprolonged periods about 0.05 hp (37.3 W) wasmaintained with pedaling rates of 20-60 rpm(figure 2.9). It can be calculated that this powerwould give a road speed, on the level with nowind, of about 8 mph (3.6 m/sec). This speed iscommonly achieved by an average "utility" bi-cyclist and therefore provides a check on thepower measurement. This power result andother powers tolerable to the Dartmouth bicy-clists for briefer periods are shown as the nearlystraight lines in figure 2.10. The expenditure of
0.05 hp (37.3 W) can be achieved over a rangeof pedaling speeds from about 30 to 60 rpm.Therefore, as experience has shown, precisegear selection is not necessary for utility bicy-cling. Japanese experimental data 23 confirmingthis finding are plotted in figure 2.11.Other ergometer experiments similar to the
Dartmouth tests were conducted by Wilkie;these are summarized on page 8 of reference 24.
Wilkie's subjects were instructed to exert them-selves to the limit in order to record their maxi-mum power outputs for varying periods of time.
The peak power obtained was 0.54 hp (402.7 W)for one minute, and for 60-270 minutes thepowers were 0.08-0.19 hp (59.7-141.7 W).These powers are somewhat above those of the
Dartmouth students and close to those recordedfor laborers turning winches (figure 2.8). It ap-pears logical to take the Dartmouth results as

48 Human power
Figure 2.10Data from DartmouthCollege ergometer tests:power output as afunction of pedalingspeed. Horizontal straightlines show maximumpower of an averagepedaler for the durationnoted; curves (except thatfor indefinite time) arebased on data from W.Brown, Cycle gearing intheory and practice,Cycling (5 July 1944):12-13.
rpm
Pedaling speed
more indicative of the power output of an aver-
age untrained "utility" rider.Workers at Nijmegen University measured the
breathing rates of riders during actual bicycling,as in figure 2.3, and compared the results with
the data of Hermans-Telvy and Binkhorst25 on
walking and running (figure 2.12). The gearsused with a standard three-speed hub are indi-
cated for the bicycling results. It is clear, for in-stance, from the group of three first-gear pointsat about 14 mph (6.3 m/sec) that the use of alow gear at these speeds is less efficient. Thepedaling rate would be about 98 rpm, as against66 in second gear and 56 in top gear. In allcases the power output would be about 134 W(0.18 hp), in agreement with the data at thispower in figure 2.11. Thus, the common adviceto riders to "keep spinning" (to pedal at a highrate) is appropriate only for maximum-speed,maximum-output sprinting. This is confirmedby results of the once-popular 25-mile time

49 Generation
Figure 2.11Power-output plots. Datafor curves A, B, C, E, andF from reference 23; datafor curve D fromreference 21; curve Gestimated by F.R.W. fromdata in reference 23;curve H extrapolatedfrom data in reference 23.Peak efficiencies: 12.5%for curve A, 18% forcurve B, 22% for curve C,17% for curve D, 26% forcurves E—G; optimumpedaling rates for therange of power outputsfor curve H.
trials in Britain, in which riders were restrictedto 70-inch (1.78-m) gears with no free-wheel.The speeds achieved were a few percent lowerthan those achieved with unrestricted fixedgears, which were generally chosen by the rid-ers to be about 20 percent higher.In extensive experimental work with ergome-
ters at Loughborough University of Technology,one cyclist produced 1.5 hp (1,119 W) for 5 sec-onds. This is represented by the isolated point Bon figure 2.7, and suggests that the gaps be-
tween the curves in that figure are likely tolessen as more ergometer experiments are done.Two curves in the NASA Bioastronautics DataBook (figure 2.13) give validity to these andother high-power data. The NASA book statesthat "data beyond one hour are sparse, and themaximum level one can sustain for 4-8 hours is
not precisely known." 26 But these levels can becalculated from time-trial records, as in table
2.2. These long-duration data indicate that fig-ure 2.13's curve for "first-class athletes" issomewhat low, but correct in its trend.
Pedaling rate, revolutions per minute

50 Human power
Figure 2.12Energy expenditure inkcal/kg-min duringwalking, running, andcycling, calculated fromformulas and fromexperimental data ofHermans-Telvy andBinkhorst (reference 25).Data on walking from N.H. Molen and R. H.Rozendal, Energyexpenditure in normaltest subjects walking on amotor driven treadmill,Kon. Nederl. Acad. Wet.70 (1967): 192-200; H. J.
Speed
Ralston, Energy-speedrelation and optimalspeed during levelwalking, Int. Z. ang.Physiol. einschl.Arbeitsphysiol. 17 (1958):277-283; J. M. Workmanand B. W. Armstrong,Oxygen cost of treadmillwalking, J. Appl. Physiol.18 (1963): 798-803; A. C.Bobbert, Energyexpenditure in level andgrade walking, J. Appl.Physiol. 15 (1960): 1015-1021. Data on runningfrom L. G. C. E. Pugh,
Oxygen intake in trackand treadmill runningwith observations on theeffect of air resistance, J.Physiol. 207 (1970): 823-835; reference 25 (*).Data on cycling fromreference 6 and fromreference 25.

51 Generation
Figure 2.13Long-duration humanpower output. Curvesfrom reference 26.
Minutes

Maximum work, kJ
52 Human power
Table 2.2 British records for long-duration power output during bicycling.
Time trials, out -and -home, on the roadEvent Time mph m/sec hp W
25 miles (40.22 km) 49 min, 24 sec 30.4 13.6 0.5+ 373+50 miles (80.45 km) 103 min, 46 sec 28.9 12.9 0.5+ 373+
100 miles (160.9 kin) 225 min, 28 sec 26.6 11.9 0.44 3251,000 miles (1,609 km) a 3,520 min 17 7.6 0.18 135
Distance
12 hours 281.9 miles (453.5 km) 23.5 10.5 0.37 27624 hours 507 miles (815.8 km) 21.1 9.4 0.30 220
Tourist trials
100 miles (160.9 km) 8 hours 12 5.4 0.1 75
a. Records of the food consumption of J. Rossiter, who captured the 1,000-milerecord in 1929, showed that he ate about 30 lb of eggs, milk, sugar, and chocolateduring the 870 miles from Lands End to John O'Groats. No record of his drinks isavailable. The food energy content can be estimated as about 21,000 kcal duringthe approximately 2/ days of the ride. He had little rest, and his average ridingspeed was 6.7 m/sec (15 mph). Using this average speed, the distance traveled,reasonable figures for wind and friction losses, and the above metabolic efficiency,one would calculate an energy expenditure of 26,000 kcal. This is a fair agreement,considering the probability of body fat being consumed and the energy content ofRossiter's drinks. His energy output, in round figures, was thus 10,000 kcal/day,exceeding estimates of the maximum output of other athletes or of hard laborers by100-200 percent.
Figure 2.14Effects on maximumwork of saddle heightand angle of seat tubefrom perpendicular (a).100 mm below normal,21° from perpendicular;(b) 30 mm above, 8°; (c)40 mm below, 21°; (d) 30mm above, 43°; (e)normal height, 21°; (f) 30mm above, 21° and 29°.From reference 27.

53 Generation
Effect of saddle heightUsing a single subject (a 39-year-old man),Muller27 obtained the results shown in figure2.14. He found that more power was obtainedwhen the saddle was raised by 40-50 mm (1.8-2 in.) above the "normal" height (that for whichthe heel can just reach the pedal with the legstretched and the posture upright). On the otherhand, minimum calorie consumption (or maxi-mum energy efficiency) was found when thesaddle was lowered 40 mm below normal.Thomas tested 100 subjects on a Muller er-
gometer, 28-30 and also found that maximum
power output was obtained with the saddle setat a height about 10 percent greater than leglength. He defined saddle height as the distancefrom the pedal spindle at its lowest point to the
top of the saddle, so that about half of the thick-ness of the pedal would reduce the effectiveheight.
Effect of crank lengthThe safety bicycle has fixed the length of the
cranks within narrow limits. With the saddle atthe normal height above the pedals (as definedby Muller), and with the pedals at a distanceabove the ground such that in normal turns(when the bicycle will be inclined toward thecenter of the turn) the pedals will not contactthe ground, the saddle will be at a height atwhich the rider can just put the ball of one footon the ground when stopped while still sittingon the saddle. The crank length is then chosenat a value at which almost all riders will feelcomfortable. This length is normally, for adult
riders, taken as 165 mm (6.5 in.) or 170 mm (6.7in.). Thus, the height above the ground of thebottom-bracket axle is fixed. An attempt to fitlonger cranks will lead to a reduction of pedal
clearance when cornering. Few riders, then,have an opportunity to try long cranks, becausea specially designed frame is strictly necessaryfor each crank length. (In this respect, recum-

54 Human power
bent bicycles have an advantage.) Most data onthe effects of crank length have been taken onergometers. Ergometer data can be regardedwith suspicion, as we have implied, and this
has certainly been true with regard to data onlong cranks. So few people have been able toexperiment with significantly longer cranks on
actual bicycles (because special frames must bebuilt) that their impressions also must be treated
with reserve.Two people writing for a bicycling magazine
in 1897 advocated shorter cranks. 31 One, Per-rache, experimented with 160-, 190-, and 220-mm cranks on a bicycle over a 5-km course andfound that, in maximum-speed runs, he couldget about 9 percent more power output with the160-mm cranks than with the 220-mm cranks.We do not know whether the gear ratios werechanged for different crank lengths. It wouldobviously penalize longer cranks if the gear ra-tio were not increased to give approximatelysimilar ratios of pedal speed to wheel-rimspeed. It would also be a disadvantage if the
rider was accustomed to using short cranks.Muller and Grosse-Lordemann tested the effect
of crank lengths on an ergometer, employingonly one subject. 32 Their approach was to setthe power output the subject had to produceand to measure the maximum duration forwhich this output could be sustained. They alsoused three crank lengths: 140, 180, and 220mm. In this case the subject was able to producethe most total work (that is, work for the longestperiods) when using the longest cranks for allpower levels. At the highest powers, the bodyefficiency (work output divided by energy inputin food) was also highest when the longestcranks were used.Harrison (ref. 15) gave his five subjects an ini-
tial choice of crank length, and found that theypreferred the longer cranks (177 and 203 mm; 7and 8 in.). The subjects were not particularlytall. Harrison intended to take all tests at two

55 Generation
different crank lengths; however, he found frominitial tests that "crank length played a rela-tively unimportant role in determining maxi-
mum power output," and used just one(unspecified) length for most of his tests.The world champion Eddy Merckx used 175-
mm cranks for the world's one-hour record, andhas used 180-mm cranks for time trials and hillclimbs in the Tour de France (ref. 31). A strongadvocate of long cranks in the United States,James Farnsworth, uses them in achieving veryfast climbs up Mount Washington.In summary, crank length does not seem to be
of major importance for producing moderatepower outputs through pedaling. 33 The weight
of the evidence on maximum power production
is that longer-than-normal cranks (170-180 mm
for normal-height adults), coupled with higher-ratio gearing to give similar foot speeds, givesome advantages, at least in endurance. Figure2.15 shows a pedal design that permits longercranks.
Figure 2.15Pedal design allowinggreater crank length.Courtesy of ShimanoAmerican Corporation.

56 Human power
Effect of elliptical chainwheelsElliptical chainwheels can be fitted to normalcranks in such a way that the pedal motion re-mains circular. The purpose is to reduce thesupposedly useless time during which the ped-als are near the top and bottom "dead centers."This topic has some similarity to that of longcranks in that there are fierce proponents and
antagonists and few reliable data. Four of Harri-son's five subjects produced virtually identicaloutput curves (power versus time) using circu-lar and elliptical chainwheels (ref. 15). One, ap-parently Harrison himself, gave about 12.5percent more power with the elliptical chain-wheel. All preferred the elliptical chainwheelfor low-speed, high-torque pedaling. The degreeof ovality was not specified, but Harrison statedthat the foot accelerations required were high.The degree of ovality can be specified by the
ratio of the major to the minor diameter. (Anillustration in Harrison's paper shows a chain-wheel of about 1.45 ovality, which is a veryhigh degree.) In the 1890s, racing riders using •elliptic chainwheels with ovalities of about 1.3became disillusioned with their performances,and these chainwheels fell out of favor. In the1930s the Thetic chainwheel, with an ovality ra-tio of 1.1, became quite popular. Experimentswith chainwheels having ovalities up to 1.6confirm that high ovality (perhaps 1.2 or
greater) decreases performance (F.R.W., unpub-lished). With a Thetic-type chainwheel, no dete-rioration of performance compared with that ona round chainwheel was recorded, and a smallproportion of riders improved their perfor-mances by a few percent.The parallel with the results for long cranks is
striking. An elliptical chainwheel with a major-to-minor-diameter ratio of about 1.1, and cranks5-10 percent longer than the present standard(coupled with a higher-ratio gear), sometimesgive better performance, usually offer more

Chain
Limit stops
57 Generation
comfortable pedaling, and apparently never di-minish performance.
Effect of cam drive
Many people have invented and reinventedforms of linear drive in which the foot pushes
on (for instance) a swinging lever, with a strapor cable attached to the lever at a point along itthat can be varied to give different gearing ra-tios. The cable is then attached, perhapsthrough a length of chain, to a freewheel on theback wheel and to a return spring (figure 2.16).The drive of the American Star (figure 1.19) was
of this type, although the gear was not variable.The overwhelming disadvantage of this type of
drive is that the feet and legs must be acceler-ated and subsequently decelerated by the mus-cles in the same way as in shadowboxing.34Harrison (ref. 15) found rather low outputs formotions of this type (figure 2.6, curves 2 and 4).Pedalers of lever drives complain of the inabil-
ity to use ankle motions for propulsion, as ispossible with the common rotary drives. Someyears ago in Germany a "foot cycle" was madefor handicapped people. This machine, which
could be propelled by the use of ankle motionsonly, demonstrated the help that the lower partof the legs can be to the ordinary bicyclist.
Figure 2.16Swinging-lever (linear)drive.
Gear-ratio adjustment Foot pedal
One-way clutch Return spring(freewheel)

58 Human power
Two cam drives have been developed since1975 by Lawrence Brown. The first, Beta II
(which, over Brown's objections, became the
Facet BioCam, shown in figure 2.17), combinesthe variable-gearing feature of linear drives withconservation of the kinetic energy of the moving
masses and with conventional circular foot mo-tion. Brown achieved this by fitting a cam in theplace of the normal chainwheel and having the
cam operate the lever system. By choosing theproper cam shape, he improved upon the ellip-
tic chainwheel, making the foot and leg motionmore suited to the optimum muscle action.Speed-distance records have been claimed forthis drive system.
Figure 2.17Bio-Cam drive. Courtesyof Facet Cycle Inc.

59 Generation
Brown regarded Beta II as merely an interimstage, produced against the need to get a work-ing machine to the 1978 Summer Olympicscamp. He went on to design the Selectocam(figure 2.18), which brings the cranks quicklyover the top and bottom dead centers andlengthens the duration of the high-thrust partsof the stroke. On the first race trial, in the 1980
Paris-Brest-Paris road race, Selectocam-equippedbicycles came in first, second, and third amongAmerican entries and second overall. Results of
tests carried out by the American Sports Medi-cal Training Center on four subjects riding con-ventional 10-speed lightweights and cyclesequipped with the two Brown transmissions
Figure 2.18Brown Selectocam drive.Courtesy of Lawrence G.Brown, Mechano-PhysicsCorp.

60 Human power
Figure 2.19Comparison of overallefficiencies of four ridersusing conventionalbicycles (shaded bars)and Beta II cam-drivebicycles (unshaded bars)with the following workloads and durations: (a)134 watts, 0-5 minutes;(b) 134 watts, 5-10minutes; (c) 163 watts,10-15 minutes. FromAmerican Sports MedicalTraining Center.
mentioned here (there have been others) show
impressive improvements in metabolic effi-ciency. Figure 2.19 is from a test on the Beta II.
These developments are significant. Two fac-
tors make these transmissions different: the "ve-locity profiles" of the foot motions and the veryhigh gearing used. High gear in the successfulFrench race mentioned above was 152 inches(3.85 m), 26 percent higher than normal highgears. Brown has now increased this to 185inches (4.7 m), 53 percent higher than normal.We have drawn attention elsewhere in this bookto other results which indicate that gears higherthan normal would give higher efficiencies.However, enthusiastic riders of Selectocam bi-cycles have stated that the "natural" feeling ofthe foot rhythm makes them feel most comforta-

61 Generation
ble in even higher gears than would seem opti-mum from tests.
Pedaling forceTable 2.3, compiled from data given in otherparts of this book, compares the recorded pedal-ing rates of bicyclists of all types with estimatesof the power outputs. These estimates, in turn,have led to estimates of the tangential forces atthe pedals resisting the motion.It appears that a paced bicyclist tends to use
very consistent but moderate pedal thrusts,amounting to mean applied tangential forces ofonly about one-fifth of the rider's weight. Thepeak vertical thrusts are greater but still rela-tively small. No doubt this action enables therider to maintain a steady seat position and tosteer steadily.It is easy to calculate from the crank length
and the pedaling speed in revolutions per min-ute how much thrust upon the pedals is re-quired for a given horsepower output. Theperipheral pedal speed around the pedaling cir-cle (or the vertical speed on the downwardstroke) can be used in the equation
Thrust force (newtons)
Power (watts) Pedaling speed (m/sec)
Ergometer experiments, 35 conducted underconstant-speed pedaling conditions in order tocheck the agreement between the measuredthrust and the calculated thrust, have shownthat at the optimum pedaling speeds (related topower outputs as in figure 2.11) the measuredthrust agreed with the predicted thrust to a rea-sonable accuracy, particularly for power outputsabove 0.1 hp (74.6 W). At pedaling rates otherthan the optimum, the measured average verti-cal thrust upon the pedal over its path wasgreater than that expected by amounts thatcould be predicted from the lowering in pedal-ing efficiency as given on figure 2.11 by oxygen-

Table 2.3 Pedaling speeds.
Distance,(miles)
Ordinary, 4track 4
Safety, 4track 4
k4
4
Safety,track,motorcyclepaced
Train-paced 1
Road 25safety 100bicycle 480
100
Road,tourist
Time
30 sec72 sec60 min
12.4 sec12.2 sec29 sec11.5 sec
60 min60 min60 min60 min60 min57 sec
52 min4 h24 h4 h 28 min
mph
302520.1
36.33729.839
40.15661.5717662
28.8252022.4
10121618.5
Gear(in.)
535659
90686490
106139144180191104
90858081
68687575
Crank(in.)
5554
61646464
6.46464646+64
64646464
64646464
Crankspeed(rpm)
190150116
136182170145
126134143133134198
102998493
50617485
Footspeed(ft/min)
493392330
446619520473
445456488454454670
370368310316
180220266305
Est'dpower(hp)
1.351.050.5
1.61.61.31.65
0.50.50.50.50.51.2
0.60.50.250.5
0.090.110.20.3
Est'd thrust(lbf)
918850
1208583
115
373635363659
54452652
16162432
Sources: A. C. Davison, Pedaling speeds, Cycling (20 January 1933): 55-56; H. H. England, I call on America's largest cyclemaker, Cycling (25 April 1957): 326-327; `Vandy,' the unbeaten king, Cycling (11 March 1964): 8; Marcel De Leener, Theo'shour record, Cycling (7 March 1970): 28.
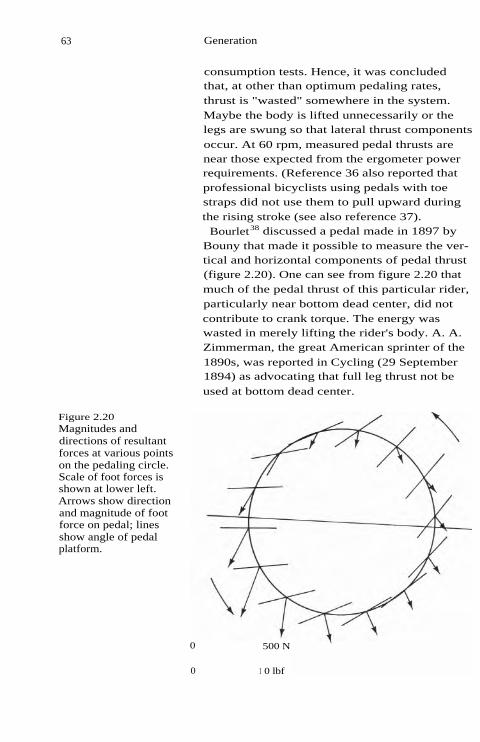
Figure 2.20Magnitudes anddirections of resultantforces at various pointson the pedaling circle.Scale of foot forces isshown at lower left.Arrows show directionand magnitude of footforce on pedal; linesshow angle of pedalplatform.
0 500 N
0 1 0 lbf
63 Generation
consumption tests. Hence, it was concludedthat, at other than optimum pedaling rates,thrust is "wasted" somewhere in the system.Maybe the body is lifted unnecessarily or thelegs are swung so that lateral thrust components
occur. At 60 rpm, measured pedal thrusts arenear those expected from the ergometer powerrequirements. (Reference 36 also reported thatprofessional bicyclists using pedals with toestraps did not use them to pull upward duringthe rising stroke (see also reference 37).
Bourlet38 discussed a pedal made in 1897 byBouny that made it possible to measure the ver-tical and horizontal components of pedal thrust(figure 2.20). One can see from figure 2.20 thatmuch of the pedal thrust of this particular rider,particularly near bottom dead center, did notcontribute to crank torque. The energy waswasted in merely lifting the rider's body. A. A.Zimmerman, the great American sprinter of the
1890s, was reported in Cycling (29 September1894) as advocating that full leg thrust not be
used at bottom dead center.

64 Human power
Bourlet was convinced of the value of dyna-mometer pedals for improving the efficiency ofpedaling. However, he was severely critical of
their use by French experimenters to comparethe power needed to propel different combina-tions of machines and riders. He stressed thevariability of the riders' frontal areas as they ad-justed their riding positions to suit various ped-aling postures. He preferred free-wheelingexperiments, in which the riders' positionscould be standardized.A modern experimental version of the pedal-
force diagram (figure 2.20) is given as figure 7-2of reference 37.
Measurements made during actual bicyclingThorough and accurate data relating oxygenconsumption, heart rate, pedal torque, pedalingrate, bicycle speed, gear ratio, and crank lengthhave been taken by the Japanese Bicycle Re-search Association by equipping several riderswith instruments and telemetrically recordingtheir behavior during actual riding (ref. 23). Theresults generally substantiate the foregoing dis-cussion. Figure 2.21 shows the relation betweenoxygen consumption and heart rate for four sub-jects ranging from a trained athlete to an every-
day utility bicyclist. The best performance ofone of the racing cyclists over various distances,using a range of gear ratios, is shown in figure
2.22. The best times and speeds were attainedwith the highest gear ratio—about 111 inches(2.82 m)—except for the shortest distance, 200m, for which a range of gear ratios gave vir-tually identical average speeds. Tests of differ-ent crank lengths were inconclusive, but tendedto show best performance with a crank length of
61 inches (approximately 170 mm) for the un-trained bicyclists and no significant effect ofcrank length on average speed over 1,000 me-ters for the trained riders.An interesting cross-correlation of efficiency
versus crank speed for various average speeds

Figure 2.21Oxygen consumptionduring bicycling. Datafrom reference 23.
Figure 2.22Effect of gear ratio onperformance of racingbicyclist. From reference23.
65 Generation

Figure 2.23Effect of gearing onenergy efficiency. Fromreference 23.
Power output
66 Human power
Figure 2.24Pedaling rate and thrustfor optimum efficiency.

67 Generation
and gear ratios is shown in figure 2.23 for thebicyclist who produced the most work per literof oxygen consumption. The peak efficiency(about 30 percent) at the higher speeds (30 and35 km/h; 8.33 and 9.72 m/sec) was obtained at60-70 crank rpm and at the highest gear ratio of
111 inches (2.82 m).
A tentative conclusion is that racing bicyclistscould use gear ratios higher than those usually
employed, since peak efficiency was notreached even at 111 inches (2.82 m). Such gearsizes are coming into use as the top gears ofmultispeed bicycles, particularly for time-trialracing. The test riders did, however, complain aleg strain, and it may be advisable for most rid-ers to continue with slightly lower gears givingpedaling rates of 90-100 rpm when pedaled tocapacity.References 6 and 14 summarize results ob-
tained by earlier workers in actual measure-ments of oxygen breathing of bicyclists inmotion. Figure 2.24, which cross-plots the dataof reference 23 for maximum energy-use effi-ciency, shows both pedaling rate and pedalthrust increasing with power output. These
data, taken during actual cycling, should bemore reliable than those of reference 20, with
which they disagree to some extent.
Conclusion Pedaling as on conventional bicycles enables
riders to approach their maximum power out-put. However, mechanisms that give noncircularfoot motions or nonconstant velocities, or both,and mechanisms that allow hands and feet to beused together, seem to be required if the abso-lute maximum power output is to be obtained.Such mechanisms should make it possible to
produce the lower outputs appropriate to utilitybicycling in greater comfort than by conven-tional pedaling.

68 Human power
References 1. Design and Use of Respirators (Oxford: Pergamon,1961).
2. W. von DObeln, A simple bicycle ergometer, Journalof Applied Physiology 7 (1954): 222-224.
3. C. Lanooy and F. H. Bonjer, A hyperbolic ergometerfor cycling and cranking, Journal of Applied Physiol-ogy 9 (1956): 499-500.
4. C. T. M. Davies and J. M. Musgrove, The aerobicand anaerobic components of work during sustainedexercise on a bicycle ergometer, Ergonomics 14(1971), no. 2: 237-263.
5. C. H. Wyndham et al., Inter- and intra-individualdifferences in energy expenditure and mechanical ef-ficiency, Ergonomics 9 (1966), no. 1: 17-29.
6. F. R. Whitt, A note on the estimation of the energyexpenditure of sporting cyclists, Ergonomics 14(1971), no. 3: 419-424.
7. H. B. Falls, Exercise Physiology (New York: Aca-demic, 1968).
8. L. Brouha, Physiology in Industry, second edition(Oxford: Pergamon, 1967).
9. G. H. G. Dyson, The Mechanics of Athletics (Uni-versity of London Press, 1962).
10. T. Vaughn, Science and Sport (London: Faber andFaber, 1970).
11. A. W. Hill, Trails and Trials in Physiology (Lon-don: Clowes, 1965).
12. E. A. Midler, Physiological methods of increasinghuman work capacity, Ergonomics 8 (1965), no. 4:409-424.
13. H. W. Knipping and A. Moncrieff, The ventilationequivalent of oxygen, Queensland Journal of Medicine25 (1932): 17-30.
14. W. C. Adams, Influence of age, sex and bodyweight on the energy expenditure of bicycle riding,Journal of Applied Physiology 22 (1967): 539-545.
15. J. Y. Harrison, Maximizing human power outputby suitable selection of motion cycle and load, HumanFactors 12 (1970), no. 3: 315-329.
16. R. C. Carpenter, et al., The relationship betweenventilating capacity and simple pneumonosis in coalworkers, The British Journal of Industrial Medicine 13(1965): 166-176.
17. L. G. C. E. Pugh, The relation of oxygen intakeand speed in competition cycling and comparative ob-

69 Generation
servations on the bicycle ergometer, Journal of Physi-ology (1974): 795-808.
18. T. Nonweiler, The work production of man: Stud-ies on racing cyclists, Proceedings of the PhysiologicalSociety (11 January 1958): 8P-9P.
19. C. R. Kyle, V. J. Caizzo, and M. Palombo, Predict-ing human powered vehicle performance using ergo-metry and aerodynamic drag measurements,Conference on Human Power for Health, Productivity,Recreation and Transportation, Technology Universityof Cologne, September 1978.
20. H. Grosse-Lordemann and E. A. Muller, Der Ein-fluss der Leistung und der Arbeitsgeschwindigkeit aufdas Arbeitsmaximum und den Wirkungsgrad beimRadfahren, Kaiser Wilhelm Institut fur Arbeitsphysiol-ogie, Dortmund-Munster, 1936.
21. R. C. Garry and G. M. Wishart, On the existence ofa most efficient speed in bicycle pedalling and theproblem of determining human muscular efficiency,Journal of Physiology 72 (1931): 425-437.
22. Report on the Energy-Storage Bicycle, ThayerSchool of Engineering, Dartmouth College, Hanover,N.H., 1962.
23. Report of the Bicycle Production and TechnicalInstitute, Japan, 1968.
24. D. R. Wilkie, Man as an aero-engine, Journal of theRoyal Aeronautical Society 64 (1960): 477-481.
25. E. J. Hermans-Telvy and R. A. Binkhorst, Lopen ofFietsen?—Kiezen op Basis van Het Energieverbruik,Hart Bulletin (Netherlands), June 1974.
26. U.S. National Aeronautics and Space Administra-tion, Bioastronautics Data Book, document SP-3006(1964).
27. E. A. Muller, Der Einfluss der Sattelstellung aufdas Arbeitsmaximum und den Wirkungsgrad beimRadfahren, Kaiser Wilhelm Institut fur Arbeitsphysiol-ogie, Dortmund-Munster, 1937.
28. V. Thomas, Saddle height, Cycling (7 January1967): 24.
29. V. Thomas, Saddle height—Conflicting views, Cy-cling (4 February 1967): 17.
30. E. J. Hamley and V. Thomas, The physiologicaland postural factors in the calibration of the bicycleergometer, Journal of Physiology (1967): 191.
31. F. DeLong, DeLong's Guide to Bicycles and Bicy-cling (Radnor, Pa.: Chilton, 1978).

70 Human power
32. E. A. Muller and H. Grosse-Lordemann, Der Ein-fluss der Tretkurbellange auf das Arbeitsmaximumand den Wirkungsgrad beim Radfahren, Kaiser Wil-helm Institut fur Arbeitsphysiologie, Dortmund-Muns-ter, 1937.
33. F. R. Whitt, Crank length and pedalling efficiency,Cycling Touring (December–January 1969): 12.
34. S. S. Wilson, Bicycling technology, ScientificAmerican (November 1973): 81-91.
35. F. R. Whitt, Pedalling rates and gear sizes, Bicy-cling (March 1973): 24-25.
36. M. J. A. Hoes et al., Measurement of forces exertedon pedal and crank during work on a bicycle ergome-ter at different loads, Internationale Zeitschrift furangewandte Physiologie einschliesslich Arbeits-physiologie 26 (1956): 33-42.
37. I. E. Faria and P. R. Cavenagh, The Physiology andBiomechanics of Cycling (New York: Wiley, 1978), p.91, figure 7-2.
38. C. Bourlet, II nouveau trait& des bicycles et bicy-clettes, le travail (Paris: Gauthier-Villars, 1896).
J. D. Brooke and G. J. Davies, Problems in the use ofrespiratory variables to assess field work demands andto replicate them in laboratory tasks, in Lung Functionand Work Capacity (Salford University, U.K., 1970).
J. D. Brooke and M. S. Firth, A machine for testingand training cyclists, British Cycling FederationCoaching News (March 1972).
, Calibration of a simple eddy current ergome-ter, British Journal of Sports Medicine 8 (1974), no.2/3: 120-125.
J. M. Hagberg et al., Comparison of three proceduresfor measuring VO 2max in competitive cyclists, Euro-pean Journal of Applied Physiology 39 (1978): 47-52.
S. B. Stromme et al., Assessment of maximal aerobicpower in specifically trained athletes, Journal of Ap-plied Physiology 42 (1977): 833-837.
C. Juden, Oval-Chainwheel Design, Part II, project the-sis, Churchill College, Cambridge University, April1977.
T. A. McMahon and P. R. Greene, Fast running tracks,Scientific American (December 1978): 112-121.
A. B. Streng, Ondersoek ann de Aandrijving van doorSpierkracht voortbewogen Twee-Wielige Voertuigen,thesis, Teclufische Hogeschool Twente.
Recommended reading

How bicyclists keep cool
Bicycling can be hard work. It is important thatthe body, like any engine, not become over-heated when producing power. We pointed outin chapter 2 that the measurement of the poweroutput of bicyclists on ergometers is open tocriticism because the conditions for heat dissi-pation are critically different from those occur-ring on bicycles. The performances of ridingbicyclists in time trials are, however, veryamenable to analysis. Such time trials are of farlonger duration than the few hours usually as-sumed (see, for example, reference 1) as themaximum period over which data on humanpower output are available. Time trials (un-paced) are regularly held for 24-hour periods;distances of 480 miles (772 km) are typical.The air blast generated by bicycling is of such
magnitude that it bears little resemblance to the
drafts produced by the small electric fans some-times advised for cooling pedalers on ergome-ters. As a consequence it can be said that undermost conditions of level cycling the bicyclistworks under cooler conditions than does an er-gometer pedaler. At high speeds, most of therider's power is expended in overcoming air re-sistance. At 20 mph (8.94 m/sec) about 0.2 hp(149 W) is dissipated in the air. The cooling is adirect function of this lost power. Even if thelittle fans often used for ergometer experimentsran at this power level, the cooling effect wouldbe much less than that for the moving bicyclist,because little of this power is dissipated as airfriction around the subject's body.The science of "convective" heat transfer be-
tween a surface and a gas in relative motion isbased largely on the analogy between fluid fric-tion and conduction heat transfer derived byOsborne Reynolds in 1874 (ref. 2, pp. 134-137).

72 Human power
Reynolds's analogy states that the heat trans-ferred between the body surface and the airflowing past is proportional to the air friction atthe surface multiplied by the difference of tem-perature between the surface and the air. There-fore, we can think of surface air friction aspartly useful, at least in warm weather. Much ofthe air friction that slows a bicyclist occurs aseddies in the wake behind the body. These donot contribute to heat transfer in any way.
The effect of adequate cooling may be inferredfrom Wilkie's finding from experiments with er-gometer pedalers that if any capability of ex-
ceeding about half an hour's pedaling isrequired, the subject must keep his power out-put down to about 0.2 hp (149 W). 3 However,peak performances in 24-hour time trials can beanalyzed using wind-resistance and rolling-re-sistance data from reference 1 to show thatabout 0.3 hp (224 W) is being expended overthat period (see table 2.2). It seems that the ex-posure of the pedaler to moving air is princi-pally responsible for the improvement. It is alsoknown that an ergometer pedaler who attemptsa power output of about 0.5 hp (373 W) can ex-pect to give up after some 10 minutes and willbe perspiring profusely. That is the same poweroutput required to propel a racing bicyclistdoing a "fast" 25-mile (40.2-km) distance trialof nearly one hour. Again the effect of movingair upon a pedaler's performance is veryapparent.Let us examine the literature for suitable cor-
relations of established heat-transfer data in or-der to find quantitative reasons for the aboveobservations.
Heat-transfer data and Because there is no published information con-deductions cerning heat-transfer experiments with ridng bi-
cyclists, it is necessary to make calculationswith suitable approximations of a cyclist'sshape. The approximate forms used are a flatplate and a 6-inch-diameter cylinder. In addi-

73 Cooling
tion, data from experiments with actual humanforms (refs. 3-5) can be looked at, although theflat and upright postures used were not those ofbicycling.
The results of many calculations using estab-
lished correlations for both convective andevaporative heat transfer are given in figure 3.1.Also shown is the heat evolution of a rider atvarious speeds and power outputs on the level.The figure indicates that the effect of shape onthe flux for a given temperature difference is notgreat in the case of convective heat transfer. Inthe case of evaporative transfer, the differencebetween results with models and with an actualhuman body is 20 percent. It appears that amidway value can be obtained from data oncrossflow over wetted 6-inch-diameter cylindersor plates. For the same driving potential, ex-pressed as water-vapor pressure or temperaturedifference, the rate of evaporative heat transferis about double that of convective transfer.Under normal free-convection conditions, data
given in references 6 and 7 lead to the conclu-sion that cooling is performed by air moving atabout 1.5 ft/sec (0.457 m/sec). This is supportedby figure 3.1, where line 6 for forced convectionover a cylinder at 1.5 ft/sec and point 9 for freeconvection both predict about 325 watts persquare meter as the heat flux for that air speed.This value would be greater for a bicyclist,whose legs would also be moving the air.In the design of heating and ventilating plants,
the maximum heat load produced by a worker
doing hard physical labor has long been ac-cepted as 2,000 Btu/h (586 W). 89 This figure,when applied to a body surface of 1.8 m 2 , alsoamounts to 325 W/m2 . It is recommended thatsuch hard work be done at a room temperatureof 55°F (12.8°C). Most of the heat is lost throughevaporation of sweat.
The above evidence leads to the conclusionthat a rider pedaling in such a manner that hisbody gives out a total of 2,000 Btu/h (586 W), in

74 Human power
Figure 3.1Convective andevaporative heat flows.Assumed conditions:surface temperature 35°C(constant), airtemperature 15°C(constant), relativehumidity of air 80percent. Data for curves 1and 2 from reference 6,p. 857; data for curve 3
from W. H. McAdams,Heat Transmission (NewYork: McGraw-Hill,1942), p. 223; data forcurves 4 and 8 fromreference 4, p. 37; datafor curve 5 fromreference 5, p. 257; datafor curves 6 and 7 andpoints 9 and 11 from C.Strock, Heating andVentilating Engineer's
Databook (New York:Industrial, 1948), pp. 5-12. Data for curve givingheat output of racingbicyclist are frommetabolic-heat dataadjusted for mechanicalpower and some smallheat-energy equivalent.Bicyclist's body surfaceis assumed to be 1.8 m2.See table 2.1.

75 Cooling
average air conditions where free convectionholds, does not suffer a noticeable rise in bodytemperature no matter how long he works. If thepedaler's efficiency is 25 percent, the work out-put W for a heat loss Q is calculated as follows:
1 •
0.25 =
W + Q 1 + Q/W '
therefore
W = Q/3 = 195 watts = 0.26 hp.
Thus, it seems that a pedaler on an ergometerworking for long periods produces only about
0.2 hp (149 W) because of unwillingness to tol-erate a noticeable rise in body temperature.In chapter 2 it was shown that many cyclists
can exert 0.5 hp (373 W) for periods of up to
an hour. According to figure 2.24, that corre-sponds to a speed of about 27 mph (12.2 m/sec).At that speed the heat flow from the moving bi-
cyclist is about 707 W/m2 (fig. 3.1). If the cyclist
exerts 0.5 hp (373 W) pedaling on an ergometer,all the heat lost by convection and evaporationin moving air—all of the heat in excess of 325
W/m2—must be absorbed by the pedaler's body.Thus, the ergometer pedaler with a body area of1.8 m2 absorbs (707 - 325) X 1.8 = 688 W if
the small heat losses through breathing areneglected.If the pedaler weighs 70 kilograms and has a
specific heat of 3.52 joules per gram per °C, andif a rise in body temperature of 2°C is acceptablebefore physical collapse, the tolerable time limitfor pedaling is
70,000 x 3.52 x 2
60x= 12 minutes.
688
For highly trained racing bicyclists attemptingto pedal ergometers at a power output of 0.5 hp(373 W), a common range of endurance is 5-15minutes (personal observations, F.R.W.). Hence,the above estimates have some validity. The factthat all the racers observed were capable of out-

76 Human power
Minimum air speed
puts of nearly 0.5 hp (373 W) in one-hour timetrials demonstrates vividly the value of flowingair in prolonging the tolerable period of hardwork.Experimental findings supporting the vital im-
portance of cooling in human-power experi-ments are given in a paper concerning the effectof heat upon the performances of ergometerpedalers.1°
From figure 3.1 it can be seen that a racing bi-cyclist producing 0.6 hp (450 W) evolves heat atabout 850 W/m 2 . According to curve 5, such aheat rate could be absorbed by air moving atabout 3 m/sec (7 mph). Verification of the valueof this prediction is found in Bill Bradley's per-formance on the Gross Glockner hill climb. Herode at about 5.4 m/sec (12 mph) at a poweroutput of 450 W (0.6 hp), demonstrating that itis not necessary to have a road speed above 12m/sec (27 mph) for level riding at 450 W, whennonevaporative heat transfer can cool if the airis at a lower temperature than the body. Brad-ley's ride was done in high-air-temperature con-ditions, but these were well compensated for bythe low humidity of about 40 percent; he couldsweat freely and achieve efficient evaporativeheat loss.
Chester Kyle and co-workers at California StateUniversity carried out extensive trials withstreamlined casings for riders of various ma-chines." An interesting outcome was that, evenin short rides, a casing that was skirted almostto ground level caused the rider to overheatgrossly—almost certainly because of a lack ofair flow through the casing. This problem seemsto have been appreciated even with the earliestbicyclist casings, developed in the early 1900s.Bryan Allen also suffered from overheating inthe pedaled airplane Gossamer Albatross be-cause of insufficient through-ventilation and in-sufficient water during the nearly three-hourflight across the English Channel.

77 Cooling
Bicycling in cold and A problem faced by advocates of bicycling as a
hot conditions means for daily commuting is that even temper-ate regions have days, and sometimes weeks, ofextreme weather conditions during which bicy-cling may be unpleasant for many and impossi-
ble for some.There is no one set of temperature boundaries
at which bicycling becomes impossible. Many"fair-weather" cyclists put their machines awayfor the winter when the morning temperaturesdrop to 10°C (50°F), and will not ride in busi-ness clothes at temperatures above 25°C (77°F).However, many hardier folk find bicycling to bestill enjoyable at —15°C (5°F). The main problemat temperatures below this seems to be the feet.The size of insulated footwear is limited to thatwhich can fit on bicycle pedals, and it is fairlycommon experience that, at —18°C (0°F), evenwhen the trunk of the body is becoming over-heated through exertion the feet can becomenumb with cold.The effects of cold air are intensified by wind.
Weather forecasters often express these effectsin terms of "wind-chill factors"—the air temper-atures that would have to exist, without wind,to give the same cooling to a human body as thecombination of actual temperature and actualrelative wind. The wind-chill factors tabulatedby the U.S. National Oceanic and AtmosphericAdministration are plotted in figure 3.2. Withthis chart, one can find the effect of bicyclinginto a relative wind. For instance, if the air tem-perature is —18°C (0°F) and one is bicycling intoa relative wind of 5 m/sec (11 mph), the coolingis the same as if one were in calm conditions ata temperature of —30°C (-22°F). The feet areperiodically traveling at a higher relative veloc-
ity (as they come over top dead center) and thenat a lower velocity relative to the wind. Becausethe cooling relationship is nonlinear, the aver-age effect seems to be more severe.At the higher temperatures, humidity becomes
very important. The bicycle is highly prized for

78 Human power
Figure 3.2Wind-chill factors.Plotted from NationalOceanic andAtmosphericAdministration data.
personal transportation and for local commercethroughout Africa and Asia. In northern Nigeria,for example, the air is so dry throughout mostof the year that one's range on a bicycle is lim-ited more by the availability of water than bythe temperature. The long-distance bicyclist IanHibell rode through the Sahara (principally atnight), limited again by his water supplies. Hecould not carry sufficient water for the longerstages between oases, and relied on gifts ofwater from passing motor travelers.During the record heat wave of July 1980,
Houston, Texas had over four weeks of tempera-tures over 100°F (38°C), coupled with very highhumidity, with 111°F (44°C) reached on severaloccasions. Yet some bicyclists continued to rideto work. What makes this especially remarkableis that on American roads, crowded with cars,trucks, and buses with air conditioners going attheir maximum, the ambient temperature whichbicyclists must experience can be far above thelocal off-highway values.There are three lessons to be learned from the
experience of the hardier riders who brace what

79 Cooling
seem to be extreme conditions. First, the promo-tion of good circulation through exertion helpsthe body cope with high temperature and highhumidity as well as with cold weather. Second,the relative airflow which bicycling produces isa major factor in making riding in hot weathertolerable and usually enjoyable. Third, the factthat so many riders choose to bicycle in extremeconditions (rather than being forced to do so byeconomic necessity) shows that many otherhealthy but more timid cyclists could push out
their limits without fear of harm.
Physiology ofbody-temperatureregulation
Heat-transfercomparison ofswimming, running,and bicycling
Conclusions
Reference 12 includes a survey of recent experi-mental work on the complex processes involvedin body temperature regulation, and a largebibliography.
Swimmers are believed to maintain 65 percent
of top velocity for one hour; runners only 55
percent. This is deducible from figure 7.1,
which also shows that bicyclists maintain even
higher degrees of efficiency than swimmers.Water is a far better heat-removal fluid than
air. Thus, with appropriate water temperatures,a swimmer can keep cool more easily than arunner. These conclusions are summarized inthe statement that the swimmer uses a smallerproportion of the cardiac output to dissipateheat, and a larger proportion to transport oxy-gen to the muscles, than a runner. This state-ment appears to be just as appropriate to abicyclist as to a swimmer, in comparison with arunner.
The heat-removal capacity of the air surround-ing a working human is a key factor in the du-ration of his effort. Static air conditions areapparently such that, at low air speeds with freeconvection, the air is capable of removing 2,000
Btu/h (586 W) from the average body surface.Hence, if more heat is given out from workingat rates higher than about 0.2 hp (149 W), the
.ai

80 Human power
Some speculations
body temperature rises. (An ambient tempera-ture of 55°F, or 12.8°C, is assumed.)The fast-moving air around a bicyclist travel-
ing on the level can be estimated to have a heat-removal capacity much greater than that of thestationary air surrounding an ergometer pedaler.
Quantitative estimates can be made using estab-lished heat-transfer correlations based on airflow over wet 6-inch-diameter cylinders (cross-flow)" or from data given in reference 5 on airflow over a standing perspiring person.The heat-removal capacity of the air around a
moving cyclist, at most speeds on the level, issuch that much more heat can be lost than theamount produced by the cyclist's effort. Hence,a rider can wear more clothing than the amountthat would be tolerable to a static worker givingout the same mechanical power.
At least two ergometers used for testing the
power capacities of racing bicyclists have incor-porated air brakes in the form of fans. However,no one to date appears to have thought of di-recting the air from such air brakes onto the
body of the pedaler and measuring the effect ofthe fast-moving air on performance. It is im-probable that an air flow from such an arrange-ment could give anything very far from, say,half the flow rates surrounding an actual ridingbicyclist giving out the same power, but the re-sults would be interesting.Pedaling on an ergometer out of doors should
result in higher power output. Even in calm
conditions, air is likely to be moving faster thanthe 11 ft/sec (0.457 m/sec) quoted above for free-convection conditions around a heated body.In view of the fact that, at 0.2 hp (149 W) out-
put, for tolerable body temperatures the bodymust get rid of its heat by an evaporative pro-cess, indoor exercise seems rather unhealthycompared with riding a bicycle in the open air.

81 Cooling
Maybe the designers of home exercisers shouldput less emphasis on instrumentation and moreon self-propelled cooling equipment.
References 1. D. R. Wilkie, Man as an aero-engine, Journal of theRoyal Aeronautical Society 64 (1960): 477-481.
2. E. R. G. Eckert, Introduction to Heat and MassTransfer (New York: McGraw-Hill, 1963).
3. T. Nonweiler, Air Resistance of Racing Cyclists, re-port 106, College of Aeronautics, Cranfield, England,1956.
4. J. Colin and Y. Houdas, Experimental determinationof coefficient of heat exchanges by convection of thehuman4pody. Journal of Applied Physiology 22 (1967),no. 1: 31-38.
5. D. Clifford, D. McKerslake, and J. L. Weddell, Theeffect of wind speed on the maximum evaporative ca-pacity in man, Journal of Physiology 147 (1959): 253-259.
6. J. R. Perry, Chemical Engineers Handbook (NewYork: McGraw-Hill, 1936), pp. 339,958-965.
7. R. N. Cox and R. P. Clarke, The natural convectionflow around the human body, Quest (City of LondonUniversity), 1969, pp. 9-13.
8. Kempe's Engineer's Year Book, vol. 11 (London:Morgan, 1962), pp. 761,780.
9. 0. Faber and J. R. Kell, Heating and Air Condition-ing of Buildings (Cheam, England: Architectural Press,1943).
10. C. G. Williams, et al., Circulatory and metabolicreactions to work in heat, Journal of Applied Physiol-ogy 17 (1962): 625-638.
11. C. R. Kyle, The aerodynamics of man-poweredland vehicles, Third National Seminar on Planning,Design, and Implementation of Bicycle and PedestrianFacilities, San Diego, Calif., 1974.
12. H. B. Falls, Exercise Physiology (New York: Aca-demic, 1968).
13. T. K. Sherwood and R. L. Pigford, Absorption andExtraction (New York: McGraw-Hill, 1952), pp. 70,87-89.
A. Hardy, Warmth, Bicycling (December 1975): 22-23.
0. G. Edholm, The Biology of Work (Weidenfeld andNicolson, 1967).
Recommended reading

82 Human power
A. B. Craig, Journal of Sports Medicine and PhysicalFitness 3 (1963): 14.
Daily Mail (England), World champion Hugh Porterdrops only 3.2 seconds over 5 kilometres wearing Tre-vira jersey, and clothes, 9 May 1973. See also 8, 11,and 12 May issues.
W. H. Rees, Clothing and comfort, Shirley Link (Shir-ley Institute, Manchester) (summer 1969): 6-9.
E. R. Nadel, Problems with Temperature RegulationDuring Exercise (New York: Academic, 1977).
4 Wind resistance
"Wind resistance" is an everyday experience,
particularly to bicyclists. It is caused by twomain types of forces: one normal to the surfaceof the resisted body (felt as the pressure of thewind) and the other tangential to the surface(which is the true "skin friction"). For an un-
streamlined body, such as a bicycle and rider,the pressure effect is much the larger, and theunrecovered pressure energy appears in theform of eddying air motion at the rear of thebody. Part a of figure 4.1 shows this eddyingeffect at the rear of a cylinder. As can be seen inpart b, the streamlined shape produces less ed-dying than the cylinder.Vehicles intended for high speeds in air are al-
most always constructed to minimize eddying.Streamlined shapes incorporate gradual taperingfrom a rounded leading edge. The exact geome-try of shapes that maximize the possibility ofthe flow remaining attached (rather than eddy-ing) and minimize the skin friction can be ap-proximated by rather complex mathematics. It isusual in aeronautics either to refer to one of afamily of published "low-drag" shapes or to testmodels in a wind tunnel."The measurement of wind resistance of motor
vehicles is described in reference 3. Althoughwind-tunnel experiments can yield good datafor motor vehicles, the interaction of the airflow around the bicyclist with the "moving"ground is relatively more important for bicy-clists. This reduces the validity of wind-tunneldata on bicyclists. More accurate informationcan be obtained with actual riders.
One aim of aerodynamic experiments on anobject is to measure its drag coefficient CD, de-fined as the nondimensional quantity

86 Physics
Figure 4.1Effects of bluff andstreamlined shapes:(a) eddying flow aroundcircular cylinder;(b) noneddying flowaround streamlinedshape;(c) pressure recoverypossible in the absence ofeddies.
Drag force CD = Dynamic pressure of air x Frontal area •
(4.1)
At low speeds (say, below 100 mph or 45m/sec), the dynamic pressure is given by
Air density x (Relative velocity)22g,
where ge is the constant (=32.174 lbm ft/lbfsect) in the equation F = ma/g c , which relatespounds mass (m), pounds force (F), and accel-eration (a, in ft/sect) through Newton's first law;and where the relative velocity is the velocity ofthe air moving past the object. In S.I. units, g, =1.0; m is in kg, F in newtons, and a in m/sec2.Thus, the drag force is
CD x Air density x (Relative velocity)2x Frontal area/2ge.
The propulsion power necessary to overcome
drag is
P = Drag force x Relative vehicle velocity.
Since the drag force is approximately propor-tional to the square of the velocity, the power toovercome drag is approximately proportional tothe cube of the velocity.Only in still air is the vehicle velocity the
same as the relative velocity used to calculatethe drag force. When there is a headwind or atailwind, the relative velocity is different fromthe vehicle velocity.

87 Wind resistance
Drag
If the drag is measured in pounds force andthe velocity is given in feet per second, thepower is in ft-lbf/sec. This may be converted tohorsepower by dividing by 550 (1 hp = 550 ft-lbf/sec); or miles per hour (1 hp = 375 mile-lbf/h) may be used:
Drag (lbf) x Velocity (ft/sec) P (hp) =
550 (ft-lbf/sec)/hp
=Drag (lbf) ) x Velocity (mph)
•375 (mile-lbf/h)/hp
In S.I. units the relationship is
P (watts) -- Drag (newtons) X Velocity (m/sec).
The drag coefficients of bodies whose drags arealmost entirely due to pressure drag are vir-tually constant, whatever the conditions. (Exam-ples of such bodies are thin plates set normal tothe direction of flow.) But bodies with substan-tial contributions from the surface-friction dragof the so-called boundary layer of "sticky" orviscous flow have drag coefficients that can varywidely in different circumstances. In general,the flow in this boundary layer can exist in oneof three forms: laminar, in which the layers offluid slide smoothly over one another; turbulent,in which the boundary layer is largely com-posed of small confined but intense eddieswhich greatly increase the surface friction; andseparated, in which the boundaries layer leavesthe surface and usually breaks up into large-scale unconfined eddies.If we wanted to produce a low-drag bicycle en-
closure, we would prefer that the boundary-layer flow be entirely laminar (airplane design-ers have tried to arrive at laminar-flow wings).Unfortunately, laminar-flow boundary layers areextremely sensitive. They have a strong ten-dency to separate from the surface, producingvery high drag. Turbulent boundary layers havehigher surface friction than laminar boundarylayers, and therefore give somewhat higher

88 Physics
drag; however, they are less likely to separate. IOften the lowest integrated drag is produced byforcing the laminar boundary layer on the for-ward part of a body to become turbulent, whichat low speeds may require either the rougheningof the surface or the mounting of a "trip" wire,at well before the location where separationmight otherwise occur. A classic experiment bythe aerodynamics genius Ludwig Prandtlshowed this effect graphically. Prandtl mounteda smooth sphere in an airstream, measured itsdrag, and observed the airflow with streams of I.smoke. The flow separated even before the max-imum diameter was reached (figure 4.2, top),
and the drag was high. Then he fastened a thinwire ring as a boundary-layer trip on the up-stream part of the sphere. The flow remained at-tached over a much larger proportion of thesphere's surface (figure 4.2, bottom), and thedrag decreased greatly, as can be seen from themuch smaller wake. Manufacturers of golf ballslearned from this and roughened the surfacewith sharp-edged dimples, producing balls thatcould be driven faster and farther. (The dimples,combined with "top spin," also produce anaerodynamic lift force, which contributes to in-creasing the range.)For any one shape of body, the variable that
controls the drag coefficient is the Reynoldsnumber, defined for a sphere moving in air as
Air density x Sphere diameterx Relative velocity
Air viscosity
For air at sea-level pressure and 65°F (19°C),this becomes
x Sphere diameter x Relative velocity x 105,(4.4)
where the diameter is in meters and the velocityis in m/sec. At Reynolds numbers over 3 x 10⁵,even smooth spheres do not need trip wires orrough surfaces (as can be seen from figure 4.3),
(4.3)

Figure 4.2
Effect of roughness ondrag of a smooth sphere(Prandtl's experiment).From S. Goldstein,Modern Developments inFluid Dynamics (London:Oxford University Press,1938).
89 Wind resistance
because a laminar boundary layer will sponta-neously become turbulent under these condi-tions. When the boundary layer becomesturbulent, the drag coefficient falls sharply from0.47 to 0.10. A golf ball about 40 nun in diame-ter driven at an initial velocity of 75 m/sec has aReynolds number of 2 x 10⁵ at the start, andwould be in the high-drag-coefficient region if itwere smooth. The dimpling shifts the "transi-tion" point to lower Reynolds numbers andgives a low CD. Thus, paradoxically, a roughsurface can lead to low drag.

90 Physics
Figure 4.3Drag coefficients ofsimple shapes. Data fromreference 2. (The airshipconsidered here is anR100A type with alength/diameter ratio of5, which is typical ofstreamlined bodies.)
Reynolds number
Compared with a golf ball, a bicyclist travelsmuch slower but has a larger equivalent diame-ter, so the Reynolds number may be similar. Abicyclist using an upright posture may be con-sidered for simplicity as a circular cylinder nor-mal to the flow, a curve for which is shown infigure 4.3. If the equivalent diameter is 600 mmand the speed is 5 m/sec, the Reynolds numberis 2 x 10⁵—below the "transition" region ofabout 4 x 10 5. There may be some advantage towearing rough clothing for speeds in this re-gion. Most bicyclists have become aware of thepenalty of converting themselves into smooth
bodies by donning a wet-weather cape or pon-cho, which usually greatly increases the windresistance without increasing the cross-sectionalarea. Perhaps some "trips" woven into the capematerial would be beneficial. Even better wouldbe some type of frame which would convert thecape into a low-drag shape. Sharp proposed thisstep in 1899, 4 and capes with inflatable rimswere for sale around that time.Low-drag shapes do not generally exhibit the
sharp transition from high drag (separated flow)to low drag (attached flow) as the Reynolds
number is increased. Rather, the point of transi-tion of the boundary layer from laminar to tur-

91 Wind resistance
bulent tends to move upstream toward theleading edge of the body as the Reynolds num-
ber is increased. Thus, the drag coefficients forstreamline shapes given in figure 4.3 show acontinuous fall as the Reynolds number is in-creased in the laminar-flow region, followed by
a moderate rise to the fully turbulent conditionsand then a continued fall.The Reynolds numbers of streamlined shells
for human-powered vehicles lie in the interest-ing transition region between 1.5 x 10⁵ and1.5 x 106.To reduce the wind-induced drag of a bicycle
and rider, two alternatives are to reduce thefrontal area of rider plus machine and to reducethe drag coefficient which the combined bodypresents to the airstream. For years, bicyclists
have adopted one or other of these possibilities,but only recently have there been concerted at-tempts at reducing frontal area and drag coeffi-cient simultaneously. The results have beenremarkable.First, let us look at conventional approaches.
Nonweiler found that mounted cyclists in rac-ing clothes had drag coefficients C D of about 0.9,where the average frontal area—of which the bi-
cycle made up an appreciable portion—wastaken to be about 3.6 ft2 (0.33 m2). 5 Loose clo-thing increased the drag area by 30 percent.There is considerable independent evidence that0.9 is a reasonable value for the circumstances.For instance information referred to by Sharp6on the wind resistance experienced by bicyclistscan be interpreted as being based on approxi-mately such a drag coefficient. Wind-tunnel ex-periments on the upright human form, creditedto A. V. Hill, give about the same value.'Rouse's account of aerodynamic work on thewind resistance of cylinders 8 can be interpretedas suggesting that an assembly of short cylin-ders representing the form a cycle and its riderwould have a drag coefficient of about 1.0. (Itappears unrealistic to quote any value for these

Table 4.1 Values of CD.
Sports car 0.2-0.3Sedan 0.4-0.5
Bus 0.6-0.8
Truck 0.8-1.0
Square plate 1.2
Sphere 0.47
Cylinder 0.7-1.3
Streamlined
body
0.1
Motorcyclist 1.8
Racing cyclist 0.9
Moped 0.78-1.1
Source: reference 9.
92 Physics
drag coefficients to greater accuracy than thefirst significant figure because of the magnitudeof the experimental errors.)Drag coefficients for other wheeled vehicles are
given in reference 9. The range is from 0.2 forsedan automobiles, to 1.0 for square-ended mo-tor trucks, to 1.8 for a motorcycle and rider.Racing cars have very low drag coefficients, 0.1
or less. Table 4.1 gives these CD values and table4.2 gives some estimates for "mopeds" based onpublished performance data. As would be ex-pected, the moped figures are close to the val-ues for bicycles and riders, but below Kempe'sfigure for a motorcyclist, which perhaps shouldbe regarded with suspicion.
Table 4.2 Air resistance of mopeds.
Engine Weight of Weight of Max.Air-resistance
Makepower(hp)
machine,(lb)
rider(lb)
speed(mph)
data (est.)
hp CD
Powell 1.05 26 0.64 1.1
Mobylette 1.35 75 200 30 0.86 0.94Magneet 1.6 115 200 33 1.00 0.78
From the above deliberations emerges a nu-merical relationship between variables suitable
for practical use with everyday units. It is as-sumed that the vehicles concerned are runningat sea level, so that "standard" air density canbe assumed. Then, from the definition of thedrag coefficient, the following relation can bederived:
Drag force (lbf) = 0.00256 X
x Frontal area (ft2)x [Speed (mph)] 2 . (4.5)
If a bicyclist has a CD of 0.9, this takes the form
0.0023 x Frontal area (ft2 ) x [Speed (mph)]2.(4.6)

Wind resistance
Reducing frontal area
In S.I. units, this is
Drag force (newtons) = 0.54 x Frontal area (m2)
x [Speed (m/sec)]2.(4.7)
Effect of riding position (conventional bicycles)In this book, whenever a typical example of acrouched racing bicyclist has been under dis-cussion it has been assumed on the basis of evi-
dence presented by Nonweiler (ref. 5) that thefrontal area presented to the wind measuresabout 0.33 m 2 . For a tourist-type bicyclist (seetable 2.2), it has been assumed that the frontalarea is about 0.5 m 2 (these figures were used tocalculate curves A and B of figure 2.2). The evi-dence for the 0.5 m2 value is from reference 6and from experiments by F.R.W. The frontalarea is obviously affected by the rider's size,clothing, and position and by the bicycle andthe accessories used.The wind resistance of skiers is relevant. Ex-
perimental work l° has shown, for instance, that
the position of the arms is of importance; in theelbows-out position appreciable extra resistanceis experienced. The nearest approach of theskiing subject to the position of a typical trackbicyclist seems to be the crouch shown in figure4.4 (bottom). The resistance experienced at 50mph (22.3 m/sec) was 20.5 lbf (91.3 N). Onecould reasonably assume that the frontal area ofthe skier with accessories was near that of acrouched bicyclist and the machine. The dragforce can be calculated as before:
0.0023 x 3.1 x 50 2 = 17.8 lbf (79.2 N).
The fairly close agreement of the estimate and
the reported results is satisfying evidence thatthe data quoted in the foregoing discussion arerealistic.

94 Physics
Figure 4.4Aerodynamic drag of thehuman body. Fourpositions demonstratedby skier Dave Jacobswere photographed in awind tunnel at the samemoment the drag wasrecorded. The air speedwas a steady 80 km/h.With erect position (run9), drag was 216 N. In ahigh but compact crouch(run 15), drag wasreduced by more thanhalf to 91 N. Fromreference 10.

95 Wind resistance
Small-wheeled tricyclesIt has often been proposed that a tricycle with
smaller-than-usual rear wheels could be fasterthan a conventional one. If 16-inch (406-mm)wheels could be used on a tricycle, the decreasein frontal area would be about 0.14 ft2(0.013 m2 )—a small decrease in comparison
with the average total area of rider and ma-chine, which is about 4.1 ft 2 (0.381 m 2). Thearea would actually be reduced to about 0.96 ofthe original. The extra 4 percent power shouldtherefore result in a speed increase of 1.3 per-
cent (1.04" 3 is about 1.013). It could well be that
some of this increase in speed due to loweredwind resistance would be lost because of thegreater rolling resistance of small wheels, al-though the stiffer wheels might counteract thisin other ways. In any case, the possible speedincrease is very small and there appear to be nogrounds for expecting a small-wheeled tricycleto be faster.
Recumbent bicyclesBecause most of the area presented normal to
the wind by a conventional bicycle-plus-rider isthat of the rider, the only method of achieving amarked area reduction is to change the rider'sposture. At different times over the last centurydesigners have produced vehicles on which therider reclines to a small or a great extent; thesehave led to the so-called reclining or recumbentbicycle.
The most famous of earlier "recumbents" wasthe Velocar (figure 1.25), introduced in the1930s, which reduced the frontal area by almost20 percent. With it a relatively unknown riderbroke most existing short-distance track recordsand beat the reigning world champion. Thegoverning body of cycle racing outlawed the re-cumbent bicycle before it could do any moredamage to existing reputations.In 1974 a series of speed trials and races with
very few design restrictions was started by
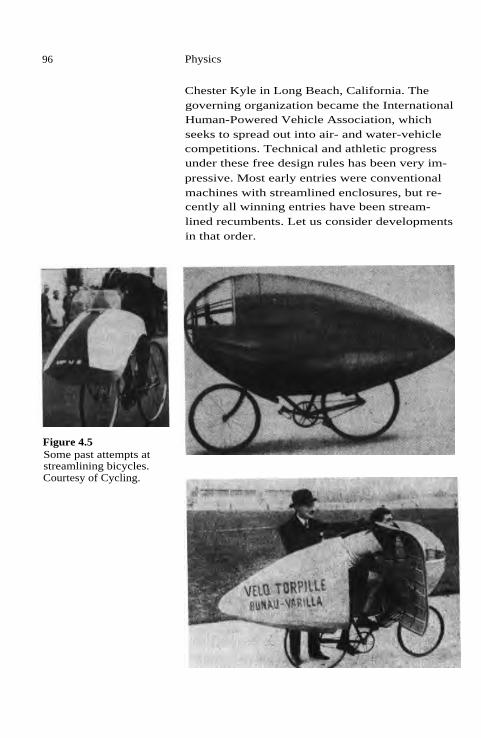
Figure 4.5Some past attempts atstreamlining bicycles.Courtesy of Cycling.
96 Physics
Chester Kyle in Long Beach, California. Thegoverning organization became the InternationalHuman-Powered Vehicle Association, whichseeks to spread out into air- and water-vehiclecompetitions. Technical and athletic progressunder these free design rules has been very im-
pressive. Most early entries were conventionalmachines with streamlined enclosures, but re-cently all winning entries have been stream-lined recumbents. Let us consider developmentsin that order.

97 Wind resistance
Reducing drag Streamlined enclosures are not allowed in bicy-coefficient by cle racing under the rules of the Internationalstreamlining Cycling Federation, the body that also outlawed
recumbent bicycles. However, for special events,complete streamlined casings have been made.Some past attempts at streamlining are shownin figure 4.5. On average, these enabled the ri-ders' top speeds to increase from about 30 toabout 36 mph. From these figures one can cal-culate that the drag coefficients of the casingswere about 0.25. The more recent intensivework by Kyle and competitors in the IHPVAtrials has led to enclosures with much lowerdrag coefficients, in the region of 0.1. Table 4.3,taken from Kyle and co-workers," shows dragcoefficients for full and partial fairings. TheKyle fairing with a measured drag coefficient of0.10 was based on NACA wing profile 0020 (ref.1). This low drag coefficient was achieved de-spite a ground clearance of 150 mm. Earliertests by Kyle and co-workers 12 had seemed toindicate that a small, almost rubbing, groundclearance was helpful in reducing drag. The im-portance of also using a length-to-thickness"fineness" ratio of 4 or more to avoid boundary-layer separation and a large drag increase wasemphasized in reference 13.It is noteworthy in table 4.3 that worthwhile
drag reductions were given by partial fairingssuch as those shown in figures 4.6 and 4.7. (Insome cases, these were simply curved sheetsmounted on the handlebars.) The principal rea-son for this kind of drag reduction appears to bethe reduction in the effective area. Without anyfairing, the air billows out around the rider'sbluff body, disturbing air over an area muchgreater than that of the body alone. An up-stream streamlined shape (such as a partial fair-ing) can reduce this disturbance. A partialfairing can also have a favorable distribution ofpressure. The effective drag coefficient for afront fairing, such as the lowest one in figure4.8, can actually be negative (ref. 2, p. 3.12).

Table 4.3 Drag and speed characteristics of streamlined human-powered vehicles.
Frontalarea (m 2 ) CD
Dragreductionat 8.9 m/sec
Wattsrequiredat 8.9m/sec
Speed withno powerincrease (m/sec)
Maximummeasuredspeed (m/sec)
Racing bicyclesBare Bicycle 0.50 0.78 0 203 8.89 -
Bicycle + Glen Brown Zipper 2 0.50 0.60 13% 177 9.31 15.20Bicycle + modified Zipper 2 0.55 0.52 22% 159 9.64 -
Van Valkenburgh Aeroshell 0.65 0.32 34% 125 10.22 15.06Aeroshell + bottom skirt 0.68 0.21 48% 97 11.06 20.79Kyle fairing 0.71 0.10 67% 68 2.78 20.77
RecumbentsPalombo supine tricycle, bare 0.35 0.77 20% 151 9.58 16.17Palombo tricycle with fairing 0.46 0.28 52% 92 11.36 19.84Van Valkenburgh prone quadracyclewith fairing
0.46 0.14 68% 64 13.03 22.08
Source: reference 11.

Figure 4.6Campbell fairing.Courtesy of JackCampbell.
0.8
0.4
0.2
99 Wind resistance
Figure 4.7Windfoiler fairing.
0.2
0.01
-0.05
Figure 4.8Partial drag coefficientsof front fairings. Fromreference 2.
100 Physics
Streamlining the tubing could reduce the windresistance of the bicycle itself by half at highspeeds. Nonweiler suggests that the bicycle's re-sistance could amount to about 1/3.6 of the totalwind resistance (ref. 5). If streamlining the tubesreduced the wind resistance by half, the effecton the total wind resistance (machine plus
rider) would be 1/(3.6 x 2), or 1/7.2. A conserv-ative view would be to take the reduction as 10percent from the original wind resistance. In thelate 1970s, some companies began producing"aerodynamic" frames, crank sets, and handle-bars. A possible danger in this is that an ovalhandlebar tube, for instance, might be muchmore susceptible to fatigue. However, in a testof a standard track bicycle against one withstreamlined components, the latter was 2 per-cent faster over a flying kilometer.14At racing speeds, the power to propel rider
and machine is almost all spent in overcoming
air resistance, and this power is proportional tothe speed cubed. If, therefore, the wind resis-tance is reduced by A, the speed will have in-creased, for the same power, by approximatelythe cube root of (1/T
1,7). This ratio of speeds is1.03, so there is a 3 percent increase in speed.Whether or not the rider thinks this worthwhileis a personal opinion, but records have beenbroken with much smaller increments.15
A French company has started producing bicy-cles with lower-drag tubes and wheels, andJapanese companies are manufacturing aero-dynamically shaped cranks. The effects will besmall, but any gain achieved at no real cost isworthwhile.
Combined effects ofrecumbent postureand streamlining
Winning speeds in the various categories of theIHPVA trials are shown in figure 4.9. In the
1980 200-m flying-start trials, a single-rider ma-chine won at over 56 mph (25.3 m/sec); themultiple-rider category was won at almost 63mph (28.1 m/sec). These performances seemedout of reach in 1978. All recent winners have

Figure 4.9Winning speeds inIHPVA races. Top twolines are for 200-meterflying start; solid line isfor multiple-ridervehicles (with number ofriders given inparentheses) and dashedline is for single ridervehicles. Dash-dot line isfor one-hour standing-start single-rider-vehiclerace. Adapted fromHuman Power, theIHPVA newsletter.
101 Wind resistance
Reynolds number
Figure 4.10Drag coefficient as afunction of Reynoldsnumber for a low-dragfairing of circular cross-section. Reynoldsnumber = (Relativevelocity x Maximumdiameter of fairing) /Air viscosity. Fromreference 18.

D (max. dam.)
Figure 4.11Definitions of fairingdimensions used in table4.4.
102 Physics
Table 4.4 Geometrical configurations for low-dragfairings (see figure 4.11) derived via the formula Y2 =a,X + a 2 X2 + 0 3 X3 + 0 4 X4 + 0 5X5 + 60(6 , where ai =+1.000000, a 2 = +0.837153, a 3 = -8.585996, 04 =+14.075954, 0 5 = -10.542535, and a 6 = +3.215422.Length/Diameter = 7.00, Nose radius/Maximumdiameter = 0.714, and Tail radius/ Maximumdiameter = 0.0143.
X/L Y/D X/L Y/D
0.00 0.0000 0.84 0.26520.02 0.1423 0.86 0.24290.04 0.2020 0.88 0.21930.06 0.2476 0.90 0.19410.08 0.2855 0.92 0.16720.10 0.3179 0.94 0.13830.12 0.3462 0.96 0.10650.14 0.3710 0.98 0.06990.16 0.3930 1.00 0.00000.18 0.41230.20 0.42600.22 0.44390.24 0.45650.26 0.46740.28 0.47650.30 0.48410.32 0.49000.34 0.49440.36 0.49760.38 0.49940.40 0.50000.42 0.49950.44 0.49780.46 0.49500.48 0.49110.50 0.48640.52 0.48060.54 0.47390.56 0.46650.58 0.45800.60 0.44860.62 0.43840.64 0.42730.66 0.41540.68 0.40260.70 0.38900.72 0.37430.74 0.35880.76 0.34220.78 0.32450.80 0.30590.82 0.2861

103 Wind resistance
Aerodynamic effectsof passing vehicles
Drafting
used fairings with drag coefficients in the re-gion of 0.1 at the maximum speeds and supineor prone riding positions. The transmissionshave been conventional crank-and-chain types.In some cases the rear riders in the multiple-rider machines have used their hands as well astheir legs for the 200-m event.
All bicyclists who have ridden on roads fre-quented by large, fast-moving motor vehicleshave experienced side-wind forces from theirpassing, but no experimental work concerningthe magnitude of the lateral forces on actual bi-
cyclists seems to have been reported. However,Beauvais has reported valuable work concerningwind effects upon "parked" and jacked-up A-scale model automobiles. 16 (There is considera-ble concern in the United States about the safety
of jacked-up vehicles at the sides of express-ways.) From Beauvais's data we can estimatethat a bicyclist may experience lateral forces ofseveral pounds when overtaken closely by alarge vehicle moving at 70 mph. The laws pro-hibiting bicycling along expressways are
reasonable.
"Taking pace" or "drafting" is when a bicyclist
travels close behind another moving body, us-ing it to "break the wind." The vortices behinda leading bluff body (see figure 4.1) may indeedhelp to propel the trailing rider. Drafting istherefore an important part of the strategy inmassed-start races. Only recently have quantita-tive data been taken on the assistance given bydrafting.' 7
The second rider ("stoker") of a tandem is
drafting behind the leading rider, and thereforeincurs little additional drag.When streamlined fairings are used, competi-
tors soon find that there is no benefit in draftingbecause there are no trailing vortices or largemasses of captured air behind an aerodynami-cally faired shape.

104 Physics
References 1. I. H. Abbott and A. E. Doenhoff, Theory of WingSections (New York: Dover, 1959).
2. S. F. Hoerner, Fluid Dynamic Drag (Bricktown, N.J.:Hoerner, 1959).
3. R. A. C. Fosberry, Research on the aerodynamics ofroad vehicles, New Scientist 6 (20 August 1959): 223-227.
4. A. Sharp, CTC Gazette (January 1899): 11.
5. T. Nonweiler, Air Resistance of Racing Cyclists, re-port 106, College of Aeronautics, Cranfield, England,1956.
6. A. Sharp, Bicycles and Tricycles (London: Long-mans, Green, 1896; Cambridge, Mass.: MIT Press,1977).
7. G. A. Dean, An analysis of the energy expenditurein level and gradient walking, Ergonomics 8 (1965),no. 1: 31-47.
8. H. Rouse, Elementary Mechanics of Fluids (London:Chapman and Hall, 1946), p. 247.
9. Kempe's Engineer's Year Book, vol. 11 (London:Morgan, 1962), p. 315.
10. A. E. Raine, Aerodynamics of skiing, Science Jour-nal 6 (1970), no. 3: 26-30.
11. C. R. Kyle, V. J. Caizzo, and P. Palombo, Predict-ing human-powered-vehicle performance using ergo-metry and aerodynamic-drag measurements,Proceedings of IMFA Conference, Technical Univer-sity of Cologne, 1978.
12. C. R. Kyle, The aerodynamics of man-poweredland vehicles, Third National Seminar on Planning,Design, and Implementation of Bicycle and PedestrianFacilities, San Diego, Calif., 1974.
13. C. R. Kyle and W. E. Edelman, Man-powered vehi-cle design criteria, Third International Conference onVehicle-System Dynamics, Blacksburg, Va., 1974.
14. K. Evans, Aerodynamics the keynote, Cycling (11October 1980): 14-15.
15. F. R. Whitt, Is streamlining worthwhile?, Bicycling(July 1972): 50-51.
16. F. N. Beauvais, Transient aerodynamical effects ona parked vehicle caused by a passing bus, Proceedingsof First Symposium on Road Vehicles, City Universityof London, 1969.

105 Wind resistance
Recommended reading
17. C. R. Kyle, Reduction of wind resistance andpower output of racing cyclists and runners travellingin groups, Ergonomics 22 (1979), no. 4: 387-397.
18. M. Gertler, Resistance Experiments on a System-atic Series of Bodies of Revolution, for Application tothe Design of High-Speed Submarines, report C-297,David Taylor Model Basin, U.S. Navy (1950).
A. L. Minter, Optimising of petrol-engine design, En-gineering (London) 213 (1973), no. 12: 896-900.
C. R. Kyle, How Accessories Affect Bicycle Speed, en-gineering report 75-I, California State University, LongBeach, 1975.
M. A. Van Baak, The Physiological Load DuringWalking, Cycling, Running, and Swimming and theCooper Exercise Program (Keppel: Krips Repro, 1979).
C. R. Kyle, The Aerodynamics of Bicycles, report, Cal-ifornia State University, Long Beach, 1979.

Figure 5.1Replica of Egyptianchariot wheel of 1400B.C. Note rawhidewrapping to make tireresilient. Courtesy ofScience Museum,London; reproduced withpermission.
5 The wheel
Traveling by foot requires a severalfold range of
power for both hard and soft ground, and walk-
ing can be said to be a reasonably adaptablemeans of locomotion. The resistance to motionof a wheel, however, can vary several hundred-fold from pavement to soft soil. Hence, therewas a real incentive to develop paved roadswhen wheels were adopted for horse-drawn ve-hicles (figure 5.1). The Roman empire was thefirst civilization to make use of this idea. It isrecorded that the times taken to travel acrossvarious European routes to Rome were shorterin that era than a thousand years later in theMiddle Ages, when the Roman road system hadvanished through lack of maintenance.After the Middle Ages, as the stultifying effects
of spiritual opposition to technological changewere overcome, inventions to improve everydaylife appeared rapidly. Among these were iron-covered wooden railways, followed by iron
wheels and cast-iron rails (1767). This gave riseto the railway age of Victorian times, and wasparalleled by the reappearance of a fair numberof paved roads. Thomson (1845) and Dunlop(1888) introduced pneumatic tires, which de-creased the rolling resistance of carriage wheelsto something closer to that experienced by therailway wheel and also introduced a degree ofcomfort on common roads. Ever since that timethere has been competition between the low-friction guided rolling of vehicles on tracks andthe greater freedom of steerable road vehicleswith pneumatic tires. It has been established be-yond doubt that steel wheels on steel tracks re-quire the least power of all systems used todrive practical vehicles at a given constantspeed. The power consumed in rolling the mostflexible pneumatic-tired wheel is several times

107 The wheel
greater, and the average automobile wheel onthe best surfaces generally available has ten ormore times the resistance to motion of a trainwheel on its track.
Rolling resistance The power needed to propel wheeled vehicles
depends not only on the ease of rolling of thewheels but also on the physical properties ofthe surface. A great deal of information is avail-able concerning the former in general and the
latter for harder surfaces. (Wheel motion on softground is significant mostly to agricultural en-gineers and designers of military vehicles.)The term "rolling resistance" as used in this
book means the resistance to the steady motionof the wheel caused by power absorption in thecontacting surfaces of the wheel and the road,rail, or soil on which it rolls. It does not nor-mally include the bearing friction or the powerneeded to accelerate or slow the wheel becauseof its inertia. The energy lost in acceleration is,for bicycle wheels, of small consequence com-
pared with the power absorbed by tire and road;unfortunately, it is often referred to in the senseof "ease of rolling of wheels" and can betwisted into the statement that "little wheelsroll more easily than large wheels." This latteris only partly true, even if "rolling" is taken tomean "accelerating and decelerating."Bicycle wheels are now of such a pattern that
design changes can have only small effects onacceleration properties, but a wheel of a givendiameter has a rolling resistance (in the sense ofsurface power absorption) of approximately halfthat of a wheel of half the diameter. This defini-tion of rolling resistance, as accepted in the en-gineering literature, implies that the weights ofrider and machine, both greatly exceeding thatof the wheels, influence the motion of the bicy-cle via the tires; multiplying the coefficient ofrolling friction (rolling resistance divided byvertical load applied to wheel) by the weight
gives the rolling resistance.

108 Physics
Train wheelsThe rolling of railroad wheels has been investi-
gated thoroughly.' It is more amenable to mea-surement than other wheel-rolling actions, suchas that of pneumatic-tired wheels on roads. Thehardness of the railway wheel and the track canbe specified closely and are less variable thanother types of contacting surfaces.The wheel's rolling resistance is caused by the
deformation of wheel and track, which produces
a temporary "dent" or "sinkage" (figure 5.2).This deformation causes the point of instanta-neous rolling of the wheel to be always ahead ofthe point geometrically directly below thewheel's center of rotation about its bearing,which is attached to the vehicle. The deforma-tion of the wheel, or of the wheel and the track,results in the reaction forces shown in figure5.2. These forces are higher in the "compres-sion" stage than during the subsequent expan-
sion because of hysteresis (the internal frictionof materials). Thus, a pair of forces exerting aretarding torque (known as a "couple") is setup. The numerical value of the torque is thedownward force between wheel and surface,which in steady state is the weight of the wheel,plus its share of the weight of the vehicle, mul-tiplied by the distance b/8, where b is thelength of the wheel-to-ground contact.Reference 1 shows why the displacement of
the instantaneous center of rotation can be cal-culated as the length b divided by 8. Experi-ments with railway wheels of typical diametersresting on rails have shown that the distanceb/8 can be taken as 0.01-0.02 inches (0.25-0.50
mm). It is thus possible to calculate the rollingresistance according to the method of reference1. If the wheel's radius is 20 inches (508 mm),the calculated coefficient of rolling frictionranges from 0.0005 to 0.001, in addition to bear-ing resistance.
One can check the calculation in the preceding
paragraph using information given on page

109 The wheel
Deformation of"sinkage"
Relative reaction force
Figure 5.2Resistance diagram ofrolling wheel.
Downward force on wheel
- Propulsive force
— Instantaneous center of rotation
F532 of the Engineering Encyclopedia (New
York: Industrial Press, 1954). This source is un-usual in that it gives a quantitative relationshipfor the coefficient of rolling friction, CR, of cyl-
inders on plane surfaces, including the effect ofcylinder diameter:
CR = Diameter in meters
The experimentally determined values of fquoted include a range of 0.0002-0.0060 for
steel-on-steel contact. For a wheel or a pair ofwheels 686 mm in diameter, loaded with 80 kg,the resistance to rolling is
80 x 9.81 x 0.0012
0.686
which yields 1.4 N (0.3 lbf).
Wheels on soft groundThe general effect of wheel form on rolling re-
sistance was investigated over a century ago byGrandvoinet, 2 who found that if the diameter ofthe wheel was increased 35 percent the rollingresistance on soft ground decreased 20 percent.A similar increase in width decreased the roll-

110 Physics
ing resistance by only 10 percent. For a verylarge wheel, it has been found that the treadwidth has a negligible effect on rolling resis-tance. 3 Other studies investigated the once-com-mon steel-rimmed wooden agricultural wheel.The characteristics of modern pneumatic-tired 'military and agricultural vehicles are still beinginvestigated. Not all concerned subscribe to thetheory that these large-tired wheel vehicles can"float" on soil, as might be thought.In passing, it is worth noting that driving a
wheel on soft ground may require more effortthan walking or running, which, whether asso-ciated with man or quadruped, are mechanismsof a different character. Races between bicyclistsand runners over rough country show that thespeeds of the two are much closer than in raceson hard ground.A great deal of experimental work has been
carried out in more recent times on the powerneeded to move agricultural vehicles. Barger etal. (ref. 3) verified the general effects of wheelcross-sectional shape and diameter as postulatedby the very early workers, and also carried outinvestigations on pneumatic tires. The mainfindings have been that wheel diameter,whether for a steel-rimmed wheel or for a pneu-matic-tired one, is an important factor. Thelarger the wheel the more easily it runs whensupporting a given weight, whether the surfaceis soft or hard. For hard ground the ease of run-ning can be related to the diameter by a simpleinverse-proportion formula; for soft ground theeffect of diameter is even greater.When a loaded pneumatic or steel tire presses
on a road surface, the shape of the area of defor-mation of the surfaces is much influenced by,among other things, the diameter of the wheel.Taking account of the relative dimensions of thecontact areas, and reasoning along the lines em-ployed for the railway-train wheel (see figure5.2), one can deduce that the forces opposingrolling are inversely proportional to the wheel

111 The wheel
diameter. (Readers interested in rolling-frictiontheory are advised to consult references 4through 7 for further details about a subject notfrequently referred to in textbooks on basicphysics.)
Pneumatic tires and their propertiesThe pneumatic-tired wheel rolling on the roadexhibits exaggerated characteristics in compari-son with the steel wheel on rails. For instance,
the flattening of the tire over an "equivalent"distance b (see figure 5.2) is obviously much
greater for pneumatic tires, and therefore thetheory predicts a much greater rolling resis-tance, as found in practice. What is very diffi-
cult to predict is the effect of flexing of the tirewalls, which is so dependent upon inflationpressure and the design of the carcass, as com-pared with the constancy of steel's elasticity. Aninteresting peculiarity of pneumatic tires is thatthey affect steering properties, because any side
force applied to the axle is resisted by the roadat a point on the tire that is not directly beneaththe axis" but slightly behind. This results in ameasurable "twisting effect" not experienced byhard wheels on hard surfaces. This is calledself-aligning torque, and is a measure of the ten-dency of the steered wheel to follow the direc-tion of motion. Tire-inflation pressure andcarcass flexibility obviously also influence thistwisting effect, as they do rolling resistance.Early bicycles had solid rubber tires. The rec-
ord times for the mile track for both the solid-rubber-tired "old ordinary" and the solid-rub-ber-tired "safety" are almost the same, close to21 minutes. It is known that the high bicycle of-fers greater wind resistance and requires moreriding skill than the smaller-wheeled bicycle.Hence, the above findings support the explana-tion that the bigger wheel runs more easily thanthe smaller wheel (see ref. 5)—the lower rollingresistance compensates for the higher windresistance.

112 Physics
Although it might at first sight appear that
there are too many factors influencing pneu-
matic-tire rolling for any simple correlation tobe devised, in practice this is not so. The pre-dominant variables have been found to be tire-inflation pressure, wheel diameter, and roadsurface. Actual road speed has an effect, but notuntil speeds well above those common for bicy-cles are involved is it appreciable. 1 ° For modernbicycles running on hard roads, the range ofeach of the three predominant variables is only
about twofold, giving a total possible effect ofsome eightfold on the rolling resistance.The shapes and dimensions of the marks made
by bicycle tires upon the road were investigatedby the senior author using carbon paper andthin white paper. Tire loads were kept constantat 90 lbf (400 N), and pressings were made withvarious inflation pressures (15-75 lbf/in. 2 ; 103-517 kPa, where 1 pascal 1 newton per squaremeter) and various tire sizes (12 x 2, 16 x 11
and 27 x 1+ in.; 305 x 51, 406 x 44, and 686 x32 mm). (The sizes given here are direct conver-sions of the nominal "inch" sizes, and do notnecessarily give the actual outside diameter.)The maximum lengths of the impression werecompared with experimentally determined roll-ing-resistance coefficients in two ways: in one
case the length was used along with the outsidediameter of the inflated tire; in the other it wasused to estimate the "sinkage" of the inflatedtire under load. The results are shown in figures5.3 and 5.4. On the same figures we have plot-ted data from references 11-13 concerningpneumatic 28 x 6 and 43 x 71 inch (711 x 152
and 1,092 x 190 mm) tractor tires with inflationpressures of 10-40 lbf/in. 2 (69-276 kPa). Figure
5.5 shows imprints and contact prints of varioustires and wheels.
From the mean lines drawn through the ex-perimental points in figures 5.2 and 5.4 we
can derive the following simple approximaterelationships for pneumatic tires running on

113 The wheel
Maximum length of tire marking/Outside diam. of tire
Figure 5.3Relationship betweencoefficient of rollingresistance and length oftire marking on roadcombined with tireoutside diameter (understatic conditions), forsmall tire deformation orsinkage, where (Lengthof tire marking) 2 = 4 xTire diameter x Sinkage.(o) Bicycle tires, (x)tractor tires.
hard concrete surfaces, where C R. is the coeffi-cient of rolling resistance:
CR = const x Sinkage
Max. length of road impression(5.1)
when the constants are 0.33 (standard load 90lbf [400 N]) for bicycle tires and 0.25 (standardload 1,000 lbf [4.45 kN]) for tractor tires, and
Max. length of impression C R = const x (5.2)
Diameter of inflated tire
when the constants are 0.070 for bicycle tiresand 0.064 for tractor tires.
Sabey and Lupton measured the markings ofstatic and moving motorcar tires. 14 There issome decrease in length of tire marks due tomovement, but it can be deduced that at the lowspeeds common in bicycling the statically mea-sured lengths are only a few percent greaterthan the moving lengths.

Figure 5.4Relationship betweencoefficient of rollingresistance and length oftire marking on roadcombined with sinkagecaused by load on tireunder static conditions.(,L) Bicycle tires; (x)tractor tires.
114 Physics
Sinkage
Max. length of imprint
As stated above, the rolling resistance of pneu-matic tires is a combination of several resis-
tances, not all of which can be predictedtheoretically. Thus, experiments are needed(nowadays, most of these involve towedwheels' s). The data yielded by these experi-ments are discussed further below.Formulas for calculating the rolling resistance
of automobile tires about 5 inches in cross-sec-tion are given in references 2 and 16, and some

Table 5.1 Recommended tire pressures, in lbf/in. 2 (kPa), for 26- or 27-inch wheels.
Tire cross-section Tire type
Maximum weight of rider
84 lb (38 kg) 140 lb (63.6 kg) 196 lb (89 kg)
Front Rear Front Rear Front Rear
It in. Regular clincher 30 (206) 45 (310) 40 (276) 55 (379) 50 (345) 65 (448)(31.75 mm) High-pressure clincher 45 (310) 60 (414) 55 (379) 70 (483) 65 (448) 80 (552)
High-pressure tubular 60 (414) 70 (483) 75 (517) 85 (586) 85 (586) 100 (689)
1i in. Regular clincher 25 (172) 35 (241) 35 (241) 50 (345) 45 (310) 60 (414)(34.9 mm) High-pressure clincher 40 (276) 50 (345) 50 (345) 65 (448) 60 (414) 75 (517)
1/ in. Regular clincher 25 (172) 30 (206) 30 (206) 45 (310) 40 (276) 55 (379)(38.1 mm)
14 in. Regular clincher 20 (138) 25 (172) 40 (276) 35 (241) 50 (345)(44.45 mm)
2 in. Regular clincher 20 (138) 25 (172) 20 (138) 30 (206) 45 (310)(50.80 mm)
Note: These pressures are recommended in order to avoid too much flexing of the sidewalls of the tires and, especially,bumping of the wheel rim on the road. They do not necessarily give minimum rolling resistance.

117 The wheel
Table 5.2 Rolling resistances of early tires.
Coefficient of rolling friction, CR
Suface Solid tire Pneumatic tire Speed (m/sec)
Racing track 0.004road' 0.005-0.010Smooth macadam road b 0.022-0.027 0.013-0.016Flag pavement' 0.027 0.015 2.23F1int' 0.027 0.014-0.017 1.79-4.47Flag pavement" 0.017Macadam road" 0.016Broken granite" 0.023
a. Cycle tires; data from reference 18, p. 251.b. Car tires; data from A. W. Judge, The Mechanism of the Car, vol. III (London:Chapman and Hall, 1925), p. 150.c. Heavy cycle tires; data from reference 18, p. 256. The high figures quoted hereare probably due to the inclusion of air resistance in addition to rolling resistance.d. Thomson's early pneumatic tires (figure 1.22) on a horse-drawn carriage; dataquoted in Mechanics Magazine, vol. 50 (1848).
Table 5.3 Experimentally determined tire rolling resistances.
Cross-section Load Speed Inflation
Rollingresistance
CR(in.) (mm) (lbf) (N) (mph) (m/sec) (lbf/in.2 ) (lcPa) (hp) (W)
2 50.8 120 534 20 8.94 10 68.9 0.1 74.6 0.0162 50.8 120 534 20 8.94 18 124.1 0.07 52.2 0.0112 50.8 120 534 20 8.94 30 206.8 0.05 37.3 0.0082 50.8 150 667 20 8.94 18 124.1 0.1 74.6 0.0132 50.8 180 801 20 8.94 18 124.1 0.12 89.5 0.0131/ 44.4 120 534 15 6.7 18 124.1 0.05 37.3 0.01011 31.7 120 534 15 6.7 45 310.3 0.02 14.9 0.004
Source: reference 17, pp. 428-429.

118 Physics
Figure 5.6Effect of tire inflationpressure on rollingresistance. Curve A: bias-ply auto tire on smoothhard surface (data fromreference 16). Curve B:bias-ply auto tire onsmooth hard surface(data from reference 4).Limits C: 28 x 14-inchbicycle (average) bicycletire on road and track.
Curve D: 27 x 14-inchbicycle tire on smoothhard surface (fromF.R.W.'s low-speedexperimental data). CurveE: 16 x 1k-inch bicycletire on medium-roughhard surface (fromF.R.W.'s low-speedexperimental data). CurveF: 27 x 14-inch bicycletire on medium-roughhard surface (from
F.R.W.'s low-speedexperimental data).Points •: assumed to befor 26 x 14-inch bicycletire on steel rollers (datafrom reference 17; seetable 5.3). Point 0: 6 X
1-inch roller-skate wheelson smooth hard surface(from F.R.W.'sexperimental data).
Tire inflation pressure
bility of data from curve A of figure 5.6 andother predictions from the formula—even to
present-day automobile design—although thebasic experimental work was carried out almostforty years ago, when tires were constructed dif-ferently than at present. It is probable that thewheel diameter used was close to that of mod-ern bicycles, 26-27 inches.With the help of several other cyclists riding
several different bicycles and tricycles on typi-cal roads frequented by bicyclists, F.R.W. hascarried out experimental work on the rolling re-sistance of tires. 19 All tires used were 14 or 14

119 The wheel
inch in cross-section and of light construction.The total weight of rider and machine was al-ways near 180 lb. The experiments showed that,on concrete or rolled-gravel surfaces, the rollingresistances were very close to those predictedby curve A of figure 5.6. This means that lightbicycle tires on rough surfaces have lower resis-tance coefficients than the larger-cross-sectionautomobile tires—in other words, bicycle tiresdo not require as good a road surface for a given
performance. The results quoted in reference 17
also show that bicycle tires roll more easily thancar tires. Information, in general, suggests thatthe performance predicted by curve D can be at-tained on first-class hard roads with ti-inchlight bicycle tires.Experiments with small-wheeled bicycles
showed that, as Barger et al. (ref. 3) predictedfrom their work with pneumatic-tired tractors,rolling resistance increases in near proportionas wheel diameter is decreased for a given con-stant inflation pressure. The small-diameter,"low-pressure," large-cross-section tire is theslowest both because of the small diameter andbecause of the low design pressure (35 lbf/in.2).
Other data 2° show that the coefficient of rollingresistance of automobile tires decreases mark-edly (for example, by 33 percent) during thefirst 40 miles of a run. It is not known whetherthe same distance-traveled effect applies to bi-cycle tires.
For comparison, figures 5.7 and 5.8 are in-cluded to show how little speed affects the roll-ing resistance of car tires, although tire-pressureeffects are appreciable from 30 to 50 mph.Kyle and his associates found a somewhat
larger component of speed in some of their testsof the rolling resistance of various tires. 21 Theygave the coefficient of rolling friction as a basevalue C R0 and a speed-dependent increment CRY
so that
CR = CR0 + C RY X V.
II

Tire inflation pressure
120 Physics
Figure 5.7Effect of inflationpressure on rollingresistance of automobiletires. The two uppercurves are for bias-plytires; the lowest curves isfor radials. Fromreference 10.
(b) Variation of rollingresistance with roadsurface; pressure 30lbf/in. 2 (207 kPa). Fromreference 15.
Figure 5.8 measurements; standardEffect of speed on rolling deviations are indicated.resistance of 5.50 x 16 (a) Variation of rollingautomobile tire under resistance with tire720-lbf load. Each point pressure and speed onis the mean of six Tarmac surface.

121 The wheel
Their results are shown in table 5.4.Table 5.5 is included to show how great is the
rolling resistance of steel-tired wheels on roadscompared with that of pneumatic tires inflatedto high pressure. No doubt this fact was imme-diately apparent to riders of the early "bone-shakers." Those machines, in their latter days,were often manufactured with rubber tiring at-tached to their wheels in a manner adoptedmany years afterward by makers of horse-drawncarriages. Hollow, square-section rubber tiringwas also used, as well as solid tiring, even asearly as 1870.Curve D of figure 5.5 and information on wind
resistance given in chapter 4 have been used tocompile tables 5.6 and 5.7, which show howtire pressures affect the speed of a bicyclist un-der various conditions. In particular, note theprediction that a tricycle's extra wheel and axle
will make it 5-10 percent slower, for a givenpower, than a comparable bicycle. This is sub-
stantiated by record times for the two types ofmachine. The effect of good solid-rubber tires isalso revealed in table 5.7, which indicates thattheir coefficient of rolling resistance-0.015—isabout the same as that of a pneumatic tire in-flated to about 12 lbf/in. 2 (see table 5.1). Thisshould be interesting to riders of old bicyclesand tricycles, who are certainly aware of theslowing effect of solid-rubber tires.The power needed to overcome rolling resis-
tance is given by
hp = Coefficient of rolling frictionx Vertical load (lbf ) x mph/375,
or, in S.I. units,
W = Coefficient of rolling frictionx Vertical load (newtons) x m/sec.
The vertical load of a mass or weight, in new-tons, is the product of the mass (kg) and the
gravitational acceleration g (m/sec 2). At sealevel, g = 9.806 misec2.

122 Physics
Table 5.4 Rolling resistances of various tires.
Pressure
Vehicle CRO CRV [(m/sec) '1]lbf/in.2 kPa
Vittoriaimperforable
105 724 Bicycle 0.0029 0.165 x 1083
Seta 27-in.tubular
Criterium 250 105 724 Bicycle 0.0039 0.172 x 10'327-in. tubular
Clement 105 724 Tricycle 0.0019 Very smallCriteriumSeta Extra 27-in. tubular
Hutcheson 27x 1*-in.clincher
60 414 Bicycle 0.0047 0.291 x 10"3
Hercules 40 276 Bicycle 0.0066 ?26 x 1*-in.clincher
United 40 276 Tricycle 0.0061 ?21 x 21-in.clincher
Derived from reference 21.
Note: The surfaces used for these tests were very smooth—similar to those used forcycle tracks, and much smoother than those common road surfaces listed in table5.5.
Table 5.5 Rolling-resistance coefficients of four-wheeled wagon (steel tires) and 14-ton stagecoach.
Surface CR' Speed Vehicle
Cubical blocks 0.014-0.022 Slow WagonMacadam 0.028-0.033 Slow WagonPlanks 0.013-0.022 Slow WagonGravel 0.062 Slow Wagon"A fine road" 0.034-0.041 4-10 mph StagecoachCommon earth road 0.089-0.134 Slow Wagon
Source: reference 4, p. 683.
Note: The Engineering Encyclopedia (New York: Industrial, 1054) gives values in asimilar range for steel-rimmed wheels 24-60 inches in diameter.
a. Coefficient of rolling friction.

123 The wheel
Table 5.6 Total rolling resistance of pneumatic-tired bicycle wheels calculated for170-lbf load (figure 5.5, curve D).
Percentage speedRolling Total Wheel reduction for
Speed Pressures resistance hp diam. given power due( mph) (lbf/in. 2 ) (hp) CR° lost' (in.) to small wheel
30 75 0.070 0.005 0.69 2730 17 0.140 0.010 0.767 27
29.3 75 0.113 0.008 0.69 16 2.312.5 75 0.029 0.005 0.074 2712.5 17 0.058 0.010 0.103 27
11.4 75 0.044 0.008 0.074 16 8.8
5 75 0.0116 0.005 0.0140 275 17 0.0233 0.010 0.0265 27
3.6 75 0.0138 0.008 0.014 16 28
9.8 35 0.0337 0.008 0.053 16
a. For 11-inch tire.b. Coefficient of rolling resistance.c. Including air resistance.
Table 5.7 Effect of tire pressure on propulsive power needed.
VehicleLoad(lbf)
Speed( mph)
Pressured
(lbf/in. 2 )
Rollingresistance(hp) CRb
Totalhplost'
Percent increaseto total powers
Bicycle 170 25 75 0.059 0.0051 0.407Bicycle 170 25 17 0.118 0.0103 0.466 14
Bicycle 170 12.5 75 0.0295 0.0051 0.074Bicycle 170 12.5 17 0.059 0.0013 0.103 39
Tricycle 180 23.5 75 0.082 0.0077 0.407Tricycle 180 23.5 17 0.164 0.0155 0.489 20eTricycle 180 13.4 75 0.476 0.0077 0.11Tricycle 180 13.4 17 0.0952 0.0155 0.157 43
Bicycle 170 25 N.A. 0.154 0.0134 0.508 25fBicycle 170 12.5 N.A. 0.078 0.0134 0.122 65f
a. For 11-inch tire.b. Coefficient of rolling resistance.c. Including air resistance.d. For "standard" 27-inch wheel and pressure of 75 lbf/in.2.e. Tricycle is 6% slower than bicycle.f. For solid tires inch in cross-section.

124 Physics
Unlike the power needed to overcome wind re-sistance, which is proportional to the speed
cubed, the power lost in rolling is directly pro-portional to the speed (at least at low speeds).
It can be estimated from tire formulas that a
bicyclist who had only rolling friction to over-come should attain speeds of over 100 mph
(44.7 m/sec) on a good surface. World recordsfor bicyclists riding behind motor vehicles indi-cate that 150 mph (67 m/sec) can be attainedover short distances, thus verifying the estima-tion. (It is arguable that air friction is not merelybrought to zero, but may actually help to propela rider pedaling behind a moving shield.) It isprobable that similar shielding from the windwould improve a runner's maximum speed ofabout 20 mph (8.94 m/sec) only slightly, be-cause air-friction effects for a runner are rela-tively low compared with the other resistances
at this speed.Other interesting conclusions can be drawn.
For instance, at maximum bicycle speeds, if the
bicycle had no friction or mass and only its airdrag resisted motion the top speed would in-crease by only a few percent. At low speeds, thesituation is rather different: at about 10 mph(4.5 m/sec) such a machine would require abouthalf the power needed from the rider under nor-mal conditions. If the same power were to beexerted on a weightless, frictionless machine,the speed would be increased by about 30 per-cent, to 13 mph (5.8 m/sec).
Advantages and In recent times there have appeared on the mar-disadvantages of ket bicycles with wheels 14-20 inches (355-508small-wheeled mm) in diameter—considerably smaller than thebicycles common diameter of 26 or 27 inches. Small
wheels appear to be accepted as essential if abicycle is to be easily stowed in the trunk of a
car and if one machine is to be safely ridden bypeople of different heights. In addition, luggagecan be carried more easily over a smaller wheel,simply because there is more space available.

Tire-inflation pressure
125 The wheel
And some designers have incorporated spring-ing into small-wheeled bicycles. It appears thatthese requirements are considered important for
those of the general public who may not care touse a conventional machine.A question often raised concerns the effect of
the smaller wheels on the propulsive power
needed. Of course the extent to which thispower requirement, for a given speed underspecified conditions, exceeds that of a conven-tional machine depends on other details of theparticular design as well as on wheel size. Ofgreat importance is the tire inflation pressure atwhich the machine can be ridden with comfort."Soft" tires add resistance for all wheel sizes,whether the low pressure is intended by the de-signer or is due to the rider's lack of strength ormemory. (A desirable pressure for 26-27-inch-
diameter 1i-inch tires is about 55-60 lbf/in.2).The effect of inflation pressure on rolling power
for two wheel sizes is illustrated in figure 5.9.
Figure 5.9Effect of tire pressure andwheel diameter onpropulsive powerrequired for bicycles.Note diminished rate ofdecrease of powerrequired at pressureabove 75 lbf/in. 2 (515kPa), the manufacturer'srecommended pressure.Top pair of curves are for16-inch (upper curve)and 27-inch (lowercurve) wheels at 25 mph(11.2 m/sec); bottom pairare for 16-inch (upper)and 27-inch (lower)wheels at 12.5 mph (5.6m/sec).

126 Physics
Figure 5.10Slowing effect of 16-inch(406-mm) wheelscompared with 27-inch(686-mm) wheels at samepower level. The 27-inchwheels are assumed to berunning on a smoothroad surface with arolling-resistancecoefficient of 0.005, witha crouching 150-1bm(68.1-kg) rider presentinga frontal surface area of3.65 ft. 2 (0.34 m 2). Thedrag coefficient is 0.9.The percentage drop inspeed for a "slower"machine with a rolling-resistance coefficient of0.008 and a frontal areaof 5.5 ft 2 (0.34 m2) is notvery great. Point • is asingle estimation forsuch conditions. In bothcases the tire pressure is75 lbf/in. 2 (517 kPa).
We have estimated the rolling and air resis-
tances of the popular 16-inch (406.4-mm)wheels and compared the power requirementsat different speeds with those of the 27-inchwheels (tables 5.6, 5.7; figure 5.10). These calcu-lations show the effect of different pressuresand wheel diameters on the power needed forriding on very good roads. It is obvious that thesmaller wheels are "slower" over the wholerange of speeds, and to an appreciable extent atthe lower speeds. (If rougher roads had been as-sumed, the "slowness" would have been moreapparent—unless the wheels had been assumedto be incorporated in a sprung, damped suspen-sion, in which case they can be superior.) At25-30 mph and higher, the effect of smallerwheels is relatively small, according to the cal-culations, because wind effects are predomi-nant. This accounts for the fact that racing times
of 27-inch-wheeled machines are closely ap-proached by those of smaller-wheeled machines.Whether the increased resistance of the smaller
127 The wheel
wheels at utility and touring speeds of 10-12mph is acceptable depends on the temperamentof the rider.The rolling resistance R may be calculated by
the methods of references 21 and 16:
R = CRW,
where W is the weight of machine plus rider
and CR, the coefficient of friction, is given by
0.005 + 1— [0.15 + 0.35 (mph/100)2],
in which p is the inflation pressure in lbf/in.2for 27-inch wheels.Smooth treads on automobile tires reduce roll-
ing resistance by as much as 20 percent, accord-ing to Ogorkiewicz (ref. 10); he and Bekker (ref.2, p. 208) give as an alternative formula for CR
0.0809 + 0.00012W0.0051 +
p0.105 + 0.0000154W
(mph/100)2,p
where W is the weight on the wheel in lbf and
p is in lbf/in.2.
The wheels of a vehicle move forward with themachine and rider and at the same time rotatearound the axles. The resistance of the wheels toa change in speed is therefore greater, per unitmass, than that offered by the rest of the vehi-cle. Hence, greater effort is required to acceler-ate "a pound of weight (mass) in the wheel of abicycle than a pound in the frame." This facthas been quoted endlessly in cycling literature,both in and out of context.
Bicycle wheels are now of a form such that themajor portion of the mass is concentrated in therim-tire-tube combination. The dimensions ofthe latter are small compared with the diameterof the wheel, and its center of mass is close tothe outside of the wheel, which is traveling at
Effect of wheel masson acceleration effort

128 Physics
road speed. On this account, it is possible to saywith some truth that "the effect of a given mass
in the wheels is almost twice that of the samemass in the frame" as far as acceleration power
requirements are concerned, because the wheelhas to be given both the translational kinetic en-ergy of the whole machine and its own rota-tional kinetic energy relative to the bicycle.With modern bicycle construction the wheels
form only about 5 percent of the total mass ofmachine and rider. Also, the effect of any prac-tical variation in reducing this 5 percent issmall, whether by reducing the wheels by sizeor by material content. At best, it is estimatedthat the wheel mass can be reduced to 3.5 per-cent of the total. The reduction effect is, there-fore, 1.5 percent. Even if this can be multiplied
by 2 (because the mass revolves), the resultant 3percent effect on acceleration is very small and
would not be easy to detect.More accurate estimations based upon calcula-
tions or measurements of the actual moments ofinertia of 16- and 27-inch wheels show that thedifference in acceleration power is rather lessthan 1.7 percent.
Although lighter wheels accelerate slightlymore quickly for a given power, and have alower air drag, they also have a larger rolling
resistance on smooth roads because of the largerlosses at the point of contact (figure 5.2). Thedecision on whether or not to use small wheelsmust depend on the duty anticipated for the bi-
cycle, as well as on cost and fashion.
Rough roads andspringing
Rough roads affect bicyclists in several ways.
The vibration may be uncomfortable and mayrequire the bicycle to be heavier than if it weredesigned for smooth roads, and there will be anenergy loss.The energy loss depends on the "scale" of the
roughness, the speed, and the design of the bi-cycle. If the scale is very large, so that the bi-cyclist has to ascend and descend large hills,

Path of wheel at variousrelative speeds
AmplComponent of kinetic energyperpendicular to surface atcontact will be lost
WavelengthWavelength
129 The wheel
Figure 5.11Dynamics of wheel losseson rough surfaces.
overall energy losses are small (and due princi-pally to the increased air-resistance losses at thehigh downhill speeds). There are in this casevirtually no momentum losses.Now imagine a very small scale of roughness,
with a supposedly rigid machine traveling overthe surface. Each little roughness could give themachine an upward component of velocity suf-ficient for the wheel(s) to leave the surface (fig-ure 5.11). The kinetic energy of this upwardmotion has to be taken from the forward mo-
tion, just as if the rider were going up a hill.But when the wheel and machine descend, un-der the influence of gravity as before, the wheelcontacts the surface at an angle whose magni-tude depends upon the speed and the scale of
the roughness. All the kinetic energy perpendic-ular to the surface at the point of contact can beconsidered lost. Herein lies part of the reason
for rough-road losses.Pneumatic tires greatly lower the losses for
small-scale roughness, because only the kinetic
energy of part of the tread is affected, and thespring force of the internal pressure ensures thatin general the tire does not come out of contactwith the surface. The principal losses are due to
the flexing (hysteresis) of the tires and tubes.At a larger scale of roughness, perhaps with a
typical wavelength of 6-60 inches (0.152-1.52m) and a height amplitude of 1-6 inches (25-152 mm), bicycle tires are too small to insulate

130 Physics
the machine and rider from the vertical veloci-ties induced, and the situation more nearly ap-proaches the analogy of the rigid-machine casediscussed above. For this scale of roughness,typical of potholes and ruts, some form ofsprung wheel or sprung frame can greatly re-
duce the kinetic-energy or momentum losses byreducing the unsprung mass and ensuring thatthe wheel more nearly maintains contact withthe surface.
Another way of expressing this conclusion isthat, if energy losses are to be small, the "natu-ral" frequency of the unsprung mass should behigh compared with the forced vibrational fre-quency imposed by the surface. The natural fre-quency fN of a mass m connected to a springhaving a spring constant A (A gives the units offorce applied per unit deflection) is
vibrations per unit time.
The forced frequency from the road surface, ff,
is equal to v/S, where v is the velocity of thebicycle and S is the wavelength of the rough-ness. Therefore, the ratio
should be kept high by reducing the unsprungmass m for the worst combination of S and v
thought likely to be encountered. (The designerhas little choice for the spring constant A, be-cause he must assume a mass of rider and ma-chine of up to perhaps 275 lb (124.7 kg) (havinga weight at sea level of 1,223 N), with a maxi-mum deflection (if a light rider is to be able toreach the ground with his foot) of perhaps 3inches (76 mm).Throughout this book the motion of the bicycle
under consideration has been assumed to betaking place upon relatively smooth surfaces. Insuch circumstances it seems reasonable to as-

131 The wheel
sume that energy losses due to vibration aresmall. Roads are certainly becoming smoother.As a consequence, the task for bicycle designershas been made easier than it was in the earlierdays when even in the industrialized societies
most of the roads were too rutted for easy rid-ing. In the United Kingdom, where much sportcycling is in the form of time trials, the modernroad-racing bicycle is approaching the track bi-cycle in detail design, as with, for example,small-cross-section lightweight tires. Present-day utility machines are little different in speci-fications from road racers of the 1920s.
In contrast, the pre-1890s bicycle designer wasforced to take serious account of the road sur-face. An early writer was of the opinion that ifthe front wheel of a rear-drive safety (fitted withsolid rubber tires) was forced to surmount a fl-inch-high obstacle, a loss of half of the forwardmomentum was experienced. 22 This is an ex-treme case, but is indicative of the large energylosses likely when riding on very rough roads.It was also known that solid rubber tires wereless easy-running as the speed increased, evenon relatively smooth roads; the vibration loss isalmost directly proportional to speed, even atlow speeds. According to Sharp, the French en-gineer Bourlet thought that one-sixth of therider's effort was lost to vibratory effects on asolid-rubber-tired bicycle (ref. 18, p. 252).
As can be expected with the above state of af-fairs, inventors busied themselves with so-calledantivibratory devices of all imaginable types.The application of anti-vibration mechanisms
to bicycle frames was difficult. Several design-ers seemed to have a clear grasp of the essentialproblems to be solved: The rider must not haveto cope with differing distances between saddleand pedals, and forward momentum must bepreserved. The general outcome was, however,far from the optimum, and according to Scott(ref. 22)

132 Physics
. . . the difficulty experienced by inventors on I
the line of anti-vibrators appears to be, thatwhile acquiring the desired elasticity in theproper direction, an elasticity in otherdirections has followed, making the machine
feel unsteady and capricious, especially in thesteering. This undoubtedly valid difficulty inthe way is worthy of careful considerationbefore accepting an anti-vibrator: in fact thevery desired end can be easily missed in animperfect device, as it might, while holdingmomentum in one direction lose it in another.
In spite of difficulties, inventors persevered
and there was some market for machines fittedwith a large antivibrator (as distinct fromsprung forks or saddles) in the form of a sprungframe. Examples are shown in figures 5.12 and5.13. The type of frame most praised was the"Whippet." All these machines suffered fromwear at the joints, to varying degrees, and what
might have been an acceptable machine whennew was not so when the joints became loose.The steering of the "Whippet" pattern is seri-ously affected by wear, as can be surmised byeven a casual inspection of the design. To ride asprung frame that is loose in its essential jointsis enlightening and awe-inspiring.The major deliverance was the invention of the
pneumatic tire in 1888. This placed the antivi-bratory device just where inventors had alwayswanted it—at the road surface—thus doingaway with a chain of actuating connections tothe root of energy absorption. At first the pneu-matic tire was almost impractical because of itssusceptibility to road litter, but development
was rapid, and by 1892 most new bicycles weresold with pneumatic tires (although they costmuch more than solid or hollow rubber). Anearly text on bicycles warned that pneumaticswere prone to roll on cornering and thus couldcause fear to less intrepid riders. 23 Maybe this
fact and the tires' fragility delayed their univer-

Figure 5.12Whippet spring-framebicycle. From reference18.
Figure 5.13Humber spring-framebicycle. From reference18.
133 The wheel
sal acceptance among nonracing riders by a yearor two. For road use, it appears that the earlypneumatic tires were run at inflation pressures
of 20-30 lbf/in. z (138-207 kPa), which is far toolow for confident cornering. Probably these lowpressures were thought to avoid straining and
splitting the covers, although they must have madepunctures more likely.The designer of the "Whippet" frame is
thought to have been convinced that there wasno future in large-scale adaptation of springs tobicycles after the introduction of the pneumatictire. These sentiments were not shared by otherinnovators, however; even the large Humberconcern thought that there was a demand for asprung-frame bicycle, though with pneumatic

134 Physics
tires (figure 5.12). Over the following decades,this example was followed by others who incor-porated pneumatic and other unusual springing.Some of these designs may have been inspiredby the light motorcycles that appeared in thetwentieth century. One developer was AirSprings Ltd., who marketed a telescoping pneu-matic saddle pillar designed by the renowned"Professor" Archibald Sharp. 24 No doubt suchsprung machines could have been useful onvery rough roads, but improvements in the aver-
age road conditions for bicycling were decreas-ing the need for major springing devices.In the less-developed parts of the world, where
bicycles are ridden in great numbers, the roadsare still rough. The most common bicycle is one
fitted with large-diameter tires, about 28 X 1iinches. This gives tolerable comfort without thuse of a sprung frame.The appearance of a successful modern sprung
bicycle (figure 5.14) would seem to contradict
the above arguments. However, the logic of thedesigner, Alex Moulton, was as follows (see ref.25): For a bicycle to be truly useful to the "util-ity" cyclist, there has to be better provision forthe carrying of luggage than can be fitted tostandard machines. If the wheels were mademuch smaller, room would be created over
them. Small wheels would lead to unacceptablevibration and energy losses, especially with"dead" loads such as luggage over them, sospringing would be required. Small wheels also
make the bicycle a little shorter, so that it canbe fitted into the trunk of a standard Europeanautomobile. The rear-wheel spring of the Moul-ton bicycle uses rubber in compression andshear; the front wheel has a rubber-damped coilspring. The resulting bicycle is very effectiveover both smooth roads and roads too rough forregular bicycles to tackle at any but very lowspeeds.A very successful though noncommercial de-
sign for a sprung bicycle is Dan Henry's modifi-

135 The wheel
Figure 5.14
Moulton bicycle, withsprung front and rearwheels. Courtesy ofRaleigh Industries, Inc.
cation of a lightweight sport machine (figure5.15). Each wheel is mounted in a swinging forkon stiff bearings, which gives lateral rigiditywith long up-and-down travel. The springs are
quickly adjustable to the rider's weight. Thewheelbase is longer than that of the standardmachine because of the placement of the rearwheel, but the steering geometry is unaltered
(with the front wheel in its mean position) be-
cause the original front forks are set back tocompensate for the forward set of swingingforks. Henry has ridden over 100,000 miles onthis machine, which weighs 28 lb (12.7 kg). Incontrast with reports on other sprung bicycles,he finds that he climbs hills more quickly thanwith an unsprung machine and he reports thatthe tires last longer. Lightweight sew-up tirescan be used on roads that would requireclincher (wired-on) tires on an unsprungbicycle.

Figure 5.15Dan Henry's spring-framebicycle. (top) Detail ofthe front suspension;(bottom) normal position.Courtesy of Dan Henry.
136 Physics

137 The wheel
Shape and resilience Arguments about how a spoked tension wheelof spoked tension supports the load on the axle, about the shapewheels the wheel takes under load, and about the effect
of different patterns of spoking on the wheel re-silience were reopened when Forester measuredrim deflection under load and found it to be
negligible compared with the tire deflection.26(Forester found Sharp's treatment in ref. 24 ex-
cellent as far as it went.) Computer stress calcu-lations and sophisticated measurements onactual wheels were made by various people (seethe ensuing correspondence in the columns ofAmerican Wheelmen). At the time of writing,this discussion has not been fully published anda consensus has not been reached. The follow-ing, therefore, represents only the views ofD.G.W.
Under load, a spoked wheel takes up not an
oval shape, as is often stated, but an approxi-
mately circular shape with a flattened portion inthe vicinity of road contact. It is thus analogousto a pneumatic tire. Let us picture an inflatedtire, mounted on a rim, and consider the ten-sions in the tire cords as analogs to the tensionsin the spokes. The wheel is not held off theroad, as is popularly supposed, by air pressure,which is uniform around the wheel rim andtherefore contributes zero net force. Rather, theair pressure puts the tire cords into tension, andthese cords pull on the wheel rim to providesupport. The tire cords may have a bias (an an-gle to the radial direction), jut as tangent spokeshave a bias, but for present purposes let usthink of the cords and the spokes as being ra-dial. Both can withstand considerable tension,but not compression.When the tire is pushed in at the point of con-
tact with the ground, the air pressure is in-
creased, and this increases the tire-cord tensionall around the rest of the wheel. However, in
the region of the flat spot the tire-wall curvatureis greater, and we know from formulas for pres-sure vessels (such as those in reference 27) that

138 Physics
the tension will decrease. Also, the cord acts atan increased angle to the rim because of thebulge that is formed, further reducing the effec-tive radial force in this region.
In the spoked wheel, the increased compres-sive stress in the rim (analogous to the in-creased air pressure in the tire) increases thetension of all the spokes except those in the(slightly) flattened region, where the spoke ten-sion naturally decreases. The load on the axle istaken, then, by the combined effect of the in-creased spoke tension at the top of the wheel
and the decreased tension in the region of con-tact. All other spokes have approximately equaltension (if we assume a symmetrical rim) andbalance each other.
References 1. J. L. Koffman, Tractive resistance of rolling stock,Railway Gazette (London) (6 November 1964): 889-902.
2. M. G. Bekker, Theory of Land Locomotion (Ann Ar-bor: University of Michigan Press, 1962), pp. 209,214.
3. E. Barger et al., Tractors and their Power Units(New York: Wiley, 1952).
4. J. C. Trautwine, The Civil Engineer's ReferenceBook, 21st edition (Ithaca, N.Y.: Trautwine, 1937).
5. J. Hannah and M. J. Hillier, Applied Mechanics(London: Pitman, 1962), p. 36.
6. 0. Reynolds, Rolling friction, Philosophical Trans-actions 166 (1876): 155-156.
7. I. Evans, The rolling resistance of a wheel with asolid rubber tire, British Journal of Applied Physics 5(1954): 187-188.
8. V. Steeds, Mechanics of Road Vehicles (London: Il-liffe, 1960).
9. P. Irving, Motorcycle Engineering (London: Temple,1964), p. 10.
10. R. M. Ogorkiewicz, Rolling resistance, AutomobileEngineer 49 (1959): 177-179.
11. E. G. McKibben and J. B. Davidson, Transportwheels for agricultural machines, part II, AgriculturalEngineering 20 (1939), no. 12: 469-475.
12. E. G. McKibben and J. B. Davidson, Transportwheels for agricultural machines, part III, AgriculturalEngineering 21 (1940), no. 1: 25-26.

139 The wheel
13. E. G.McKibben and J. B. Davidson, Transportwheels for agricultural machines, part IV, AgriculturalEngineering 21 (1940), no. 2: 57-58.
14. R. E. Sabey and G. N. Lupton, Photographs of realcontact area of tires during motion, report LR 65,Road Research Laboratory, Ministry of Transport(U.K.), 1967.
15. G. M. Carr and M. J. Ross, The MIRA Single-Wheel Rolling-Resistance Trailers, Motor IndustriesResearch Association, Nuneaton, England, 1966.
16. Kempe's Engineer's Year Book, vol. 11 (London:Morgan, 1962).
17. P. D. Patterson, Pressure problems with cycle tires,Cycling (28 April 1955): 428-429.
18. A. Sharp, Bicycles and Tricycles (London: Long-mans, Green, 1896/Cambridge, Mass.: MIT Press,1977).
19. F. R. Whitt, Power for electric cars, Engineering(London) 204 (2 October 1967): 613.
20. G. L. Fowler, Fighting rolling resistance in tires,Machine Design (11 January 1973): 30-34.
21. C. R. Kyle and W. E. Edelman, Man-powered-vehi-cle design criteria, Third International Conference onVehicle-System Dynamics, Blacksburg, Va., 1974.
22. R. P. Scott, Cycling Art, Energy and Locomotion(Philadelphia: Lippincott, 1889).
23. Viscount Bury and G. Lacy Hillier, Cycling, thirdrevised edition, Badminton Library of Sports and Pas-times (London: Longmans, Green, 1981).
24. G. L. Fowler, Air springs, Cycling (23 November1910): 504.
25. A. Moulton, The Moulton Bicycle, Friday EveningDiscourse, Royal Institution, London, 23 February1973.
26. J. Forester, Held up by downward pull, AmericanWheelmen (August 1980): 13,14.
27. R. J. Roark and W. C. Young, Formulas for Stressand Strain, fifth edition (New York: McGraw-Hill,1976).
G. R. Shearer, The rolling wheel—the development ofthe pneumatic tyre, Institute of Mechanical EngineersProceedings (U.K.) 191 (November 1977).
Recommended reading

6Power losses in chaintransmission
Mechanical friction
The retarding effects of wind, road, and gra-dient have been discussed above. Another resis-
tance to the progress of a bicycle (a far lessimportant one) is that due to friction power ab-
sorption by the chain transmission and the bear-
ings. No estimates of these pedal-powerrequirements have been included in calculations
made up to this point.The loss of power in an automobile transmis-
sion can be as high as 15 percent (ref. 1, p. 316),Most of this loss occurs in the transmission it-self and the differential, both of which are oil-immersed sets of gears operating at relativelyhigh speeds. The efficiency of a good cleanchain can be as high as 98.5 percent (ref. 1, p.128; ref. 2). The loss of only 1.5 percent is very
small in comparison with the power consump-tion of the wind and road resistances opposinga bicycle's motion. For example (see table 5.7),
at 12.5 mph (5.59 m/sec), when 0.074 hp (55 W)is needed to overcome both wind and road re-sistances, only 0.001 hp (0.75 W) is absorbed bythe transmission. The tire rolling resistance,0.0295 hp (22 W), cannot be estimated to thisdegree of accuracy (0.001/0.0295 hp, or 3 per-cent), let alone the power absorbed by the wind.It appears reasonable, therefore, to refrain fromincluding machinery losses in graphs of powerusage for bicycle riding.The predominance of front-wheel drive in the
early days of bicycles is understandable in viewof the simple, lightweight, and 100-percent-effi-cient transmission of power from the pedals.However, the disadvantages of this drive systemare serious at speeds higher than a few milesper hour. The wheel must be made as large aspossible to give "high gears," and this—alongwith the limited steering arc of the wheel and

the need for applying torque to the handlebars
to resist the pedaling torque—made the machinedifficult for the less acrobatic to master. The ad-dition of gear trains or the use of levers compli-cated the inherently simple type of drive andmade it less attractive on this account.
Some details of the evolution of modern chaindesign are given in references 1 -7. Chain-drivenbicycles were first used on very rough roads.This environment, along with the Victorian pas-
sion for cast iron, appears to have influencedchain and chainwheel design. "Open link"
chains with thick and wide teeth on the cogs(partly because of the low strength of cast iron)
were common. It was said that road gritdropped more easily through the big spaces be-tween the links. The small number of teeth ledto rough running because of the variation in thespeed of the chain (as much as 6 percent) as itpassed over a constant-speed cog.Later, gear cases (oil-bath chain and cog enclo-
sures) became common, even for racing ma-chines, until the roads improved. Smaller-pitchchains then came into use, with improved run-ning characteristics; there was typically about 1percent variation in output speed with constant-speed drive. The precise shape of teeth has beenthe subject of much experiment; a modern opin-
ion on the optimum design, credited to Renold,is given in references 2 and 3. This design usesan angle of 60° between the flat faces of twoteeth, with circular arcs to the root and to the
tips. The exact nature of these curves is evennow the subject of much discussion from theviewpoint of world standardization, and techni-cal committees have not agreed on the preciseform.5,6
Illustrations of gearwheel and chainwheel
teeth on advertising posters (even those in-tended for engineering exhibitions) often showevidence of artistic license in the ugly, inopera-ble tooth shapes. Not all such errors escape crit-icism; the celebrated poster artist Toulouse-

Lautrec once lost a commission because his ren-dition of a chain set was outrageously incorrect
in the manufacturer's eyes.
Bearings Power losses due to bearing frictionFor a long time (at least since 1898), the retard-ing effect of the friction of the standard ballbearings in bicycles has been considered verysmall. Sharp quoted Rankine as stating that thefriction forces amount to one thousandth of theweight of the rider (ref. 4, p. 251). For a 150-lbf(68-kg) rider on a 30-lbf (13.6-kg) bicycle, thismeans a resistance of 0.15 lbf (0.667 N)—equiv-alent to an incremental rolling-resistance coeffi-cient of 0.001. The tire rolling-resistancecoefficient alone is not known to better than0.001, and the wind resistance is much less cer-tain; hence, it appears reasonable to disregardthe bearing resistance. However, it is interestingto compare this incremental rolling-resistancecoefficient of 0.001 with later relevant informa-tion, such as that for railway rolling stock given
in references 1 and 8. The wheel-plus-bearingrolling resistance is given there as a few lbf perton, which might be interpreted as a coefficientof 0.002. Of this, the bearing friction alone isprobably under 0.001. The power loss in thecomplete transmission of an ergometer wasgiven in reference 9 as being as low as 5 per-cent. According to reference 1, chain powerlosses probably average 2.5 percent. The bearinglosses can thus be taken as 5 – 2.5 = 2.5 per-
cent. At power inputs to a bicycle of 0.12 hp (89W) and 0.37 hp (276 W), which representspeeds on the level of 12 and 20 mph (5.36 and
8.94 m/sec) for a touring-type machine with anupright rider, the total opposing forces can becalculated as 3.75 and 7 lbf (16.68 and 31.14 N),respectively. The frictional opposing force of0.15 lbf (0.67 N) given by Rankine is thus ex-pressible as 0.15/3.75 x 100 (about 4 percent) at12 mph and 0.15/7 x 100 (about 2 percent) at

Table 6.1 Coefficients of friction of various bearings.
Annular ball bearing
Small needle-type roller bearing
Plain gunmetal bearing, welllubricated
Plain metal machine-tool bearingslow-running 0.1'fast-running 0.02'
Nylon 66dry, on nylon 0.2gdry, on metal 0.07glubricated 0.14g
PTFE 0.1-0.14h
Bicycle-type ball bearing 0.01"
a. 1-inch balls; data from R. P. Scott, Cycling Art,Energy and Locomotion (Philadelphia: Lippincott,1889), p. 175.b. 1-inch balls; data from ref. 10 (supplement II).c. Source: ref. 1 (vol. 1, p. 1242).d. Source: ref. 2 (p. 48).e. Source: ref. 2 (p. 49).f. Source: Mechanical World Year Book (Manchester,England: Emmott, 1938), p. 442.g. Source: British Plastics (February 1966): 80.h. Source: leaflet from Glacier Metal Co., Ltd.,Alperton, Wembley, England.i. Source: A. Sharp, CTC Gazette (October 1898): 493,efficiency data of Mr. Carpenter.j. F.R.W.'s experimental work with 1/4–1/8-inch balls inangular contacts of 30° and 60°, with a i-inch-diameterrunning circle, gives an average of 0.01 for radial orthrust loads.
Note: The bicycle-type bearings are assumed to be invery good condition and carefully adjusted.Otherwise, the friction can be several times greater.Poor manufacture can also give such variations.
Coefficientof friction
0,00175a0.0005-0.001°0.001-0.0015c
0.0015'
0.005'
0.002-0.015'

Figure 6.1Test results for bicycleball bearings. Line A:rolling-friction coefficient0.0015. Line B: rolling-friction coefficient 0.001.(Both these lines are for a1-inch-diameter face with45° angular thrust.) LineC: Range given byBourlet (reference 7, p.15) for 6-mm-diameterballs.
20 mph; the average of the two cases is about 3percent.Information given in table 6.1 shows that the
coefficient of rolling friction attributable to f-inch-diameter (25.4 mm) balls in a bearing isabout 0.0015, and reference 10 shows that therolling friction varies inversely as the ball diam-eter. We can assume that the typical averagecontact angle of the bearing is 45°, which in-creases the effective load on the races by or1.41. Hence, the average bicycle ball bearing,
with 1/8–1/4-inch (3.175-6.35-mm) balls, shouldhave a coefficient of 0.0015 x ti 2 x A= 0.011.
Experimental data are given in figure 6.1.The effective resistance at the road of the load-
bearing wheels is very small because of thelarge ratio of wheel diameter to bearing diame-ter. When the losses of the pedals and the
Coefficient of rolling friction(based on inner-race diameter)

brackets are added to those of the wheels, theoverall loss of the pedaler's energy due to fric-tion in the bearings is found to be less than 1percent. Chain losses would add 1.5-5 percent.
Advantages of ball bearingsThe first ball bearings were a far cry from thehighly reliable product of today, but they weresoon adopted by bicycle makers. Only a fewyears elapsed before the plain bearings of the _"boneshaker" period were abandoned in favorof the more complicated ball bearings. More ofthe ball-bearing patents during this early periodof bearing history were directed toward bicycles
than toward any other purpose.The common cup-and-cone bearing—which is
inexpensive and can tolerate some misalign-ment (a very desirable characteristic for inaccur-ately made and somewhat flexible bicycles)—appeared as early as the 1880s (see figures 6.2
and 6.3).Ball bearings require a low starting torque,
whereas plain bearings generally require a highstarting torque (see reference 11 and figure 6.4).This phenomenon is well appreciated in railwaypractice. It is now accepted that the use of rollerbearings in trains reduces the starting powerneeded severalfold in comparison with well-lu-
bricated plain bearings, although the runningpower needed is similar (ref. 1). Plain bearingsare sensitive to load and rotation rate because ofthe changing characteristics of the lubricant filmseparating the shaft and the bearing. Figure 6.5
shows that under optimum conditions verygood performance can be obtained from plainbearings, but the range of coefficients of frictionis large for variable conditions of bearing loadand speed. (This bearing would have some de-gree of "hydrostatic" lubrication, which re-quires considerable power from an external oilpump and therefore would not be applicable toa bicycle.)

a)
Figure 6.2Types of ball bearings.(a) Annular or radial.(b) 1893 "Magneto" (theRaleigh version had athreaded inner race).(c) Cup-and-cone (fromthe diagram it can beseen that the bearing isself-aligning and canaccommodate a bentspindle).
Figure 6.3High-quality hub withsealed ball bearings.Courtesy of Phil Wood.

Figure 6.4Bearing torque for shaftturning from rest. Datafrom reference 11.
147 Mechanical friction
Figure 6.5Friction coefficient of aplain bearing, from G. F.Charnock, TheMechanical Transmissionof Power (London:Crosby Lockwood, 1932),p. 30. This very efficientbearing, which had asteel shaft in a rigid ring-oiling 3-inch-diameterpillow block withgunmetal steps and waslubricated with"Gargoyle Vaculine C,"was probably about fourtimes as easy-running asan average plain bearing.
If a plain bearing is not kept well lubricated,
the friction can increase manyfold. A ball bear-ing, on the other hand, may deteriorate more
quickly without lubrication (particularly ifwater and grit are allowed to enter), but the fric-tion will not increase greatly. Therefore, it isdesirable to continue the use of ball bearings inbicycles.
Some think that plain bearings made fromnonmetallic materials could now be used. It hasbeen found that such bearings function in wetconditions and without oil—desirable featuresfor bicycle bearings. Nylon is one nonmetallicbearing material; another is polytetrafluoroethy-
lene (PTFE), a highly corrosion-resistant syn-thetic polymer. Special PTFE bearingsincorporating metal mixtures in order to resistthe seizure experienced with pure PTFE havebeen tested (ref. 1). It appears that the coeffi-cients of friction are 0.10-0.16 for suitable load-ing and design. Table 6.1 gives informationabout other bearing materials. The minimumvalue is still high: 0.04, or several times that as-sociated with ball bearings.It is probable that with nonmetallic bearings
the power needed to propel a bicycle and riderat 10 mph (4.47 m/sec) would be about 1i times

that needed with ball bearings, on the level andin still air. This estimation assumes that the
bearing-friction effect would be ten times thatassociated with ball bearings, which gives an ef-fective rolling-resistance coefficient of 0.01. Itappears, therefore, that nonmetallic bearingswould be suitable only for, say, machines in-tended for children or certain invalids whosespeed it might be desirable to restrict for safetypurposes.
Life of bearingsAlthough the life of a plain bearing in a turbine
(for instance) is virtually infinite, because high-
pressure lubrication and high-velocity relativemotion combine to prevent metal-to-metal con-tact, such conditions could not be approachedin a bicycle bearing. Short life and high frictionmust be expected. On the other hand, ball bear-ings always have a limited life, but the life canbe adequate. The time between overhauls ofmany aircraft turbine engines is well over20,000 hours, and the bearings are not usually
changed. Cup-and-cone ball bearings on bicy-cles are made of inexpensive steels, inaccuratelyconstructed, and little protected from grit, andcan be expected to need replacement after 1,000hours. However, some specialty manufacturersare supplying wheel hubs incorporating stan-dard automobile-type ball-bearing assemblies to
achieve lower friction, longer life, and lessmaintenance.The Sturmey-Archer type of hub gear is an ex-
ception to the suggestions that cup-and-cone
bearings and plain bearings have short lives inbicycle use. Effective labyrinth dirt seals areused; the balls are enclosed in cages that elimi-nate ball-to-ball rubbing; and bearings are accu-rately aligned. Early Sturmey-Archer gears (in1909) incorporated ball bearings in the mount-ing of the pinion gears. This was claimed toeliminate 60 percent of the friction. However,
the bearing loads on these pinion mountings are

149 Mechanical friction
extremely low, and plain bearings (hardened-steel pins) were substituted without commentlater in 1909 and appear to give an acceptablelife. The actual (rather than the claimed) effecton the gear efficiency of this substitution is notknown.
Friction in the rider's Human limb joints are "plain bearings," lubri-limb joints cated by a natural fluid that exudes from the
bearing surface. Recent investigations assign aaverage coefficient of friction to this very spe-cial type of bearing. 12 Bourlet quotes M. Per-rache as stating that the joint friction work doneby a pedaler during one revolution of the crankset as the equivalent of 3.9 joules. 13 A cyclist
thrusting hard on the pedals will do about 200joules ' work per crank revolution. Hence, thepedaler loses about 2 percent of the pedaling ef-fort in overcoming joint friction.
References 1. Kempe's Engineer's Year Book, vol. 11 (London:Morgan, 1962).
2. G. F. Charnock, The Mechanical Transmission ofPower (London: Crosby Lockwood, 1953).
3. R. F. Kay, The Theory of Machines (London: Ar-nold, 1952), p. 278.
4. A. Sharp, Bicycles and Tricycles (London: Long-mans, Green, 1896 / Cambridge, Mass.: MIT Press,1977).
5. British Standards Institution Association publica-tion B.S228, 1954.
6. American Standards Institution Association publi-cation 1329.
7. C. Bourlet, La bicyclette, sa construction et saforme (Paris: Gauthier-Villars, 1889), pp. 85-97.
8. J. L. Koffman, Tractive resistance of rolling stock,Railway Gazette (London) (1964): 899-902.
9. W. von Dobeln , A simple bicycle ergometer, Journalof Applied Physiology 7 (1954): 222-229.
10. L. Levinson, in Fundamentals of Engineering Me-chanics, ed. J. Klein (Moscow: Foreign LanguagesPublishing House, 1968).

11. A Dictionary of Applied Physics, ed. R. Glaze-brook (London: Macmillan, 1922).
12. S. A. V. Swanson and M. A. E. Freeman, Mecha-nism of human joints, Science (February 1969): 73-78.
13. C. Bourlet, Le nouveau traite des bicycles et bicy-clettes le travail, in Encyclopedie scientifique des aide
memoire , ed. M. Leaute, second edition (Paris: Gau-thier-Villa s, 1898), p. 146.
Recommended reading F. P. Bowden and D. Tabor, Friction and Lubrication(London: Methuen, 1956).
C. F. Caunter, Cycles—A Historical Review (London:Science Museum, 1972). (This contains a good reviewof various types of gearing.)
D. Swann, The Life and Times of Charley Barden(Leicester: Wunlap, 1965), p. 58.

7 The relationship between power andspeed
Having reviewed the power-output capabilities
of humans and the various power losses associ-ated with bicycles and similar vehicles, we can
now combine these characteristics to arrive atthe power requirements for traveling at variousspeeds on different types of bicycles. We canalso place bicycling along the entire range ofmuscle-powered movement, and compare itwith other modes of wheeled transportation(such as roller skating) and with walking. Andwe can give a scientific answer to a questionthat repeatedly raises itself to the touring cyclistin hilly country: When is it better to dismountand walk up a hill than to continue straining onthe pedals?It is easy to show that the bicycle is very effi-
cient. However, to claim that it is even more ef-ficient than the dolphin—a frequently heardextravagance—is to make an unscientific state-ment. The resistance to motion, and thereforethe overall energy-efficiency, is a strong func-tion of speed for all modes. The way in whichthe resistances vary with speed is peculiar toeach vehicle, animal, or mode. Therefore, com-parisons are valid only if they are made at the
same speed. The bicycle still comes out well.Figure 7.1 shows the world-record speeds for
different durations for the principal forms ofhuman-powered propulsion. Presumably thecontestants were putting out about the samepower in each mode for the same durations. Thestandard lightweight track bicycle is 4-8 mph
faster than the best speed skater. The astonish-ing jump in record speeds from standard racingbicycles to machines using streamlined fairingsin the IHPVA races adds another potential ad-vantage to bicycling.

Duration of performance, min
Figure 7.1World-record speeds byhuman power in variousmodes. Point at top anddashed curve forunlimited-class vehiclesin IHPVA trials.

153 Power and speed
Table 7.1 Principal bicycling speed and time-trial records.
World's track records
Professional unpaced standing start:1 km, Milan, 1952, R. H. Harris, 1 min 8.6 sec1 h, Mexico, 1972, E. Merckx, 49.408 km
Amateur unpaced standing start:1 km, Mexico, 1967, G. Sartori, 1 min 4.6 sec1 h, Mexico, 1969, T. Radames, 46.95 km
Unofficial and unrestricted:1 h, motor paced, standing start, Montlhery, 1928, L. Vanderstuyft,76 miles, 503 yards1 km, motor-paced, flying start, Freiburg, 1962, J. Meiffret,127.25 mph (204.77 km/h)1 mile, motor-paced flying start, U.S.A., 1973, A. V. Abbott, 138.67 mph
British amateur unpaced road records
Time trials h min sec
MenBicycle:25 miles100 miles12 h24 h
Tricycle:25 miles100 miles12 h24 h
WomenBicycle:10 miles100 miles12 h24 h
Tricycle:10 miles100 miles12 h24 h
Tandem bicycle30 miles
A. R. Engers, 1978 0 49 24P. W. Griffin, 1978 3 45 28E. J. Watson, 1969 281.87 milesR. Cromack, 1969 507.00 miles
D. Worsfold, 1978 0 57 38A. J. Pell, 1975 4 25 45H. Bayley, 1966 249.65 milesE. Tremaine, 1972 457.89 miles
B. Burton, 1973 0 21 25B. Burton, 1968 3 55 5B. Burton, 1967 277.25 milesC. Moody, 1969 427.86 miles
L. J. Hanlon, 1977 0 20 49J. Noad, 1975 5 11 08J. Blow, 1960 212.82 milesJ. Blow, 1969 374.15 miles
J. Pitchford and C. M. Goodfellow, 1973 1 4 32

154 Physics
Table 7.1 continued
Long distance days h min
1,000 miles
Bicycle R. F. Randall, 1960 2 10 40
Tricycle A. Crimes, 1958 2 21 37
Tandem bicycle P. M. Swinden & 2 18 9W. J. Withers, 1964
Tandem tricycle A. Crimes & 2 13 59J. F. Arnold, 1954
Land's End to John o' Groats (872 miles)
High ordinary G. P. Mills (P), 1886 5 1 45
Bicycle R. F. Poole, 1965 1 23 46
Tandem bicycle P. M. Swinden & 2 2 14W. J. Withers, 1966
Tricycle D. P. Duffield, 1960 2 10 58
Tandem tricycle A. Crimes & 2 4 26J. F. Arnold, 1954
Source: Cyclists' Touring Club
Note: Record speeds for vehicles racing under the rules of the InternationalHuman-Powered Vehicle Association (IHPVA) are shown in figure 4.9.
World records achieved on standard bicyclesare listed in table 7.1. These speeds may be de-rived reasonably accurately from the maximum
power outputs of athletes for various durations(figure 2.10), the air-drag and rolling-friction-drag figure (chapters 4 and 5), and an estimateof the other frictional resistances in the trans-mission and the wheel bearings (chapter 6). Theair-drag and rolling-power requirements of un-streamlined bicycles and tricycles are plotted infigure 7.2.
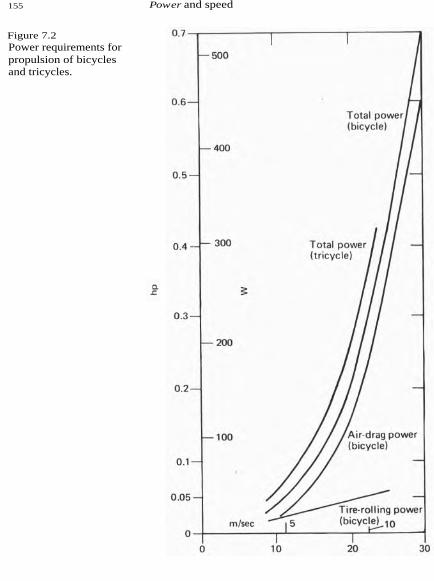
155 Power and speed
Figure 7.2Power requirements forpropulsion of bicyclesand tricycles.

Effect of bicycle typeon performance
We have performed calculations for three pres-ent types of bicycles and two hypothetical fu-ture vehicles. The "slowest" of the presentcycles was a three-speed "roadster," on whichthe rider sits almost upright, presenting almostthe maximum area in a rather high-drag shape,flat-on to the wind. Although this type wasknown a decade or so ago as the "English light-weight," it is light only in comparison with the
old heavy-duty single-speed American-stylebikes, which have almost disappeared from thecatalogs. The second bike we considered wasthe 10-speed "sports" type, which has droppedhandlebars so that the rider (when using thelower handgrips) not only presents a smallerfrontal area but also assumes a lower-drag
shape. The sports bike is lighter than the road-ster and has lighter, smaller-section wheels withhigher-pressure tires. We assumed that the riderplus clothing would generally weigh less thanwould the typical rider plus clothing on aroadster. For the frontal area and drag coeffi-
cient shown, we assumed that the rider wouldtypically adopt a crouched position. The thirdbicycle we took was a true racing model, con-siderably lighter still than the sports, with verylight tubular tires. The rider would adopt aneven more "tucked-down" position than for thesports bike and would wear tight clothing. Thehypothetical future vehicles considered arecalled CHPVs (commuting human-powered ve-hicles) and UHPVs (ultimate human-poweredvehicles). The CHPV is hypothesized to be a re-
cumbent bicycle with a streamlined fairing orenclosure, sufficiently high off the ground togive stability and visibility in highway use. TheUHPV is a machine to win a future IHPVA200-m flying-start speed trial. It will be very lowto the ground, have a minimum-drag (and there-fore long) fairing, and may have two, three, orfour wheels.The power required at the pedals of these
cycles at any speed on a level, smooth, hard

mech is the overall mechanical efficiencywhereof the transmission (including wheel-bearinglosses), Em is the total mass of the rider plusclothing plus machine in kg, CR is the coeffi-cient of rolling resistance, g is the gravitationalacceleration (9.806 m/sec2 at sea level), C,, is the
speed of the bicycle in m/sec, s in the upslopein percent, a/g is the vehicle's acceleration as a
proportion of gravitational acceleration, mw isthe effective rotational mass of the wheels andtires at the outside diameter in kg, Cw is theheadwind in m/sec, C D is the aerodynamic dragcoefficient, A is the frontal area of rider plusmachine in m2 , and p is the air density in
kg/m3.The air density at sea level, at 15°C, is about
1.226 kg/m3 . Using a typical overall mechanicalefficiency of 0.95, the power equation can be ex-pressed as
with the values of the constants K, and K2 forthese typical conditions listed in table 7.2,which summarizes the assumptions comingfrom these considerations. The correction factorfor the rotational acceleration of the wheels hasbeen given the typical value of 1.01. The power
required for constant-velocity movement on alevel road in still air simplifies to
W = K1Cv + K2Cv2.
surface (corresponding to that for which therolling-resistance coefficient is quoted), in still
air, is

Table 7.2 Specification of vehicle types.
Vehicle types
Present Future
RR SS RG CHPV UHPV
Frontal area, A 0.5 m2 0.4 m2 0.33 m2 0.5 m2 0.4 m2
Drag coefficient, CD 1.2 1.0 0.9 0.2 0.12Bicycle mass, mb 15 kg 10 kg 6 kg 20 kg 15 kg
Rider + clothing mass, mc 80 kg 75 kg 75 kg 80 kg 75 kg
Total mass, Em 95 kg 85 kg 81 kg 100 kg 90 kgRolling-resistancecoefficient, CR
0.008 0.004 0.003 0.003 0.002
Constants"K 1 7.845 3.509 2.508 3.097 1.858
K2 0.3872 0.2581 0.1916 0.0645 0.03097
a. Vehicle types are designated here and in figures 7.3 and 7.4 by the followingabbreviations. RR: roadster bicycle (heavy; upright handlebars). SS: sports bicycle(medium-weight; dropped handlebars). RG: racing bicycle (lightweight; droppedhandlebars). CHPV: commuting human-powered vehicle (streamlined fairing;semirecumbent riding position). UHPV: ultimate human-powered vehicle (low,streamlined fairing; recumbent or supine riding position).b. The constants are used to estimate the propulsion power, in watts, required on asmooth level road having an upslope of s percent, with a headwind of Cw m/sec, togive the vehicle a velocity of Cv m/sec and an acceleration of a m/sec 2:W = Cy [K1 + K2 (Cy + Cw)
2 + 10.32 Em (5/100 + 1.01a/g)] .
Power curves
The power requirements for moving the threetypes of bicycles and their riders at variousspeeds are shown in figures 7.3 and 7.4. Theair-drag power is for sea level and 15°C; therolling-resistance power is for cycling on asmooth, level road. The power to ride up a gen-tle hill of 2.5-percent slope is also shown in fig-
ure 7.3.It can be seen that for the commuting or shop-
ping bicyclist who travels at around 10 mph(4.5 m/sec), the rolling and air-drag powers aresimilar (with no wind). Hills and headwinds arevery important to these riders. For the higher-speed rider, air drag becomes dominant. One-hour races are usually won at over 25 mph (11.2m/sec), at which speed the power going to con-quer air resistance may be five or more times
that being lost in rolling resistance. At these

159 Power and speed
Vehicle velocity in still air
Vehicle velocity (m/sec)Figure 7.3Power requirements forbicycling. RR: roadster.SS: sports bicycle. RG:racing bicycle. CHPV:commuter human-powered vehicle. UHPV:ultimate human-poweredvehicle. The 0.1-hpoutput of a typicalnonathlete cyclist isindicated.

Figure 7.4Power requirements forbicycling. Dashed linerepresents output oftypical nonathletebicyclist.
speeds it may even be easier riding up a hillwith the wind behind one than down the hillwith the wind in one's face.The rolling and air-drag powers have been
added in figure 7.4 for only the lower end of thespeed range. These curves can be accurate onlyfor still-air conditions. Plotted this way, thesecurves show the penalty of riding a roadsterrather than a sports or racing bike. At 10 mph,about twice as much power is required for theroadster as for a sports bicycle. Another way oflooking at the difference is to take 0.1 hp (about75 W) as the output most fit adults feel theycould keep up for hours. At this power level,

the roadster would be going at about 10 mphand the racer about 15.
For the CHPV, an input of 0.1 hp gives a
smooth-road still-air speed of just over 20 mph(9 m/sec), which, at this very moderate expendi-ture of energy, would make commuting muchmore attractive for many people.Let us also use these figures to estimate what
the UHPV's record speed might be in theIHPVA speed trials with a rider of the capabilityof Eddy Merckx, whose one-hour ergometerpower output is shown by figure 2.10 to be con-siderably above the NASA curve for "first-classathletes" and above the likely outputs of Britishamateur time-trial winners. Let us also hypoth-esize that new mechanisms with optimum handand foot motions will allow all people, includ-ing those of Eddy Merckx's caliber, to producemore power. If the total period of effort requiredfor the time trial is 60 seconds (53 seconds ofacceleration and 7 seconds in the 200-mcourse), we can project a power output duringthis period of 830 W. Then, using the values ofthe constants in table 7.2 for the UHPV, we canconfidently predict that a single-rider vehiclewill eventually reach 65.4 mph (29.25 m/sec).
Indeed, because none of the figures assumed isparticularly optimistic, this speed may even beexceeded. During such a record attempt, muchof the rider's output will go to providing the ki-netic energy of the vehicle plus rider. At 29.25m/sec the translational kinetic energy of the hy-pothesized UHPV (total mass 90 kg) is
1/2mC2 = 1/2 x 90 X 29.252 = 38,500 joules.
The rotating parts have additional kinetic en-
ergy of rotation equal to Iw2, where w is the ro-tational velocity in radians per second andwhere I is the moment of inertia given by I =mk t , where k is the "radius of gyration" (the ra-dius at which the rotational mass can be consid-ered to be concentrated). Let us suppose that themass of each wheel rim and tire and tube is 0.5

kg, concentrated at a radius of 0.325 m, so thatthe moment of inertia of each wheel is
I = 0.5 x 0.325 2 0.05 kgm2.
The outside diameter of the wheels will beabout 0.686 m, so the rotational speed will be
w = 29.25 / 0.343 ~ 85 rad/sec.
Therefore the rotational kinetic energy will be
for each wheel.If there are three wheels, the total rotational ki-
netic energy will be about 540 J, adding about1.5 percent to the translation kinetic energy.Though small, this is not negligible, and it pro-vides some justification for using a two-wheeledconfiguration, rather than three or four wheels,for the "ultimate" vehicle.The rotational kinetic energy of the parts of the
transmission, such as the chainwheel, cranksand chain, are relatively very small for all hu-man-powered vehicles.
Energy consumption as a function of distanceWe can use the specifications of table 7.2 to findthe energy consumed in bicycling various dis-tances on level ground.
In the physical sciences energy is measured injoules (1 J/sec = 1 W), but in nutrition kilocalo-ries are used to measure the energy content offood. A kilocalorie is the heat or work energyrequired to raise the temperature of a kilogramof water one degree Celsius, and is equal to4,186.8 joules. (Unfortunately, in nutrition it isusually abbreviated to "calorie," which confusesphysicists.)A human being is like a fuel cell, taking in
chemical energy in food or fat and putting outwork energy. The efficiency is defined as the
amount of work energy divided by the chemicalor food energy. Now, a human being obviouslyneeds some food energy just to live and keep

warm, even if no work or other activity isundertaken. We then define the "net" metabolicefficiency as the ratio of the work output to theincremental food-energy intake over that neces-sary to support life. Values between 20 and 30
percent have been measured for trained athletes(figure 2.18). We have used a reasonable meannumber for fit people of 0.2388, or 23.88 per-cent, because when multiplied by 4,186.8 J/kcalit gives 1,000 in the calculation of figure 7.5.For this value of net efficiency, a consumptionof one kilocalorie of food energy produces onekilojoule of work.In figure 7.5 the true relative air velocity is en-
tered, accounting for head and tail winds, andthe results will be the sum of the expendituresof rolling resistance and air drag. The effects ofhill climbing can also be added: 0.932 kcal permeter climbed for the roadster, and 0.834 and0.795 for the sports and racing machines. Ifrider and bicycle together weigh more or lessthan the amounts taken as typical in table 7.2,
the rolling losses and the hill-climbing expendi-tures should be multiplied by the ratio of thecombined mass to that in the table (1 kg2.2 lb). To estimate the effects of different fron-tal areas, drag coefficients, and rolling-resis-tance coefficients refer to chapters 4 and 5.Underinflated tires or sandy, slushy, or cobbledroads will give rolling losses much higher thanthe values calculated here for smooth surfacesand well-inflated tires.All this information has important implica-
tions for the energy crisis. We can see from fig-ure 7.5 that a racing bicyclist at 20 mph could
travel more than 1,350 miles per U.S. gallon ifthere were a liquid food with the energy contentof gasoline. (Milk is mostly water, but hasenough energy to take a racing bicyclist about95 miles per gallon, so bicyclists could help tosolve America's energy shortage and milk sur-pluses simultaneously.)

m/sec
Relative air velocity
Figure 7.5
Energy consumption inbicycling over distances,with equal "incremental"(net) metabolicefficiencies assumed.

Confirmation of calculation methodsby recent dataAlthough some of the typical data and specifi-
cations used above (for example, in table 7.2)had their origin in work in France in the 1890s(principally by Bourlet; see reference 1), therehas been ample recent confirmation of theirvalue. Nonweiler's data, 2 from the 1950s, areshown in figure 2.5. Moulton 3 and Buckett4used sophisticated torque-measuring chain-wheels incorporating strain gauges; Kyle et al.5used the simple coast-down technique. Theirdata can be compared with predictions madeusing the methods of earlier chapters as follows.
Figure 2 of Kyle's report (ref. 5) shows that thepower needed to move a crouched rider weigh-ing 73 kg on a Rapido machine weighing 10.7kg was 97 W at 6.7 m/sec. The power predictedfrom figure 7.4 and table 7.2 for a rider and ma-chine weighing 81-85 kg is 71-99 W for racingand sports bicycles, respectively. Kyle's powerlevel is predicted exactly by the data on thesports bicycle with the reduced combinedweight.Buckett's thesis (reference 4, figure 6) shows a
calculated curve using data as described inchapter 2 and reference 6. At 6.7 m/sec the ex-perimental power required was 127 W, com-pared with 97 W predicted. Buckett estimatedthe frontal area, and his machine does not ap-pear to be of a particularly "fast" type. In addi-tion, some additional transmission losses musthave occurred. All that can be said is that Buck-
ett produced no evidence to undermine confi-dence in the data given in figure 2.5 and table2.2.Moulton's paper (reference 3, figure 9) gives
data on power at the crank for machines withwheels 16, 17, and 27 inches in diameter usingan experimental strain-gauge-equipped chain-wheel. The rider did not have to read his owninstruments (as did Buckett) for speed andtorque. This was done via a "fishing line" con-

nection wire. The power at 6.7 m/sec for the av-erage of two machines with 16-inch-diameterwheels is about 194 W, versus 187 W predicted.Moulton gives an estimated frontal area of 0.56m2 , which gives more usefulness to the compar-ison. There is deviation at lower speeds of about10 fewer watts needed for the machines with16-inch diameter wheels. However, in view ofthe unknown transmission losses, it appearsthat the Moulton figures substantiate the predic-tion methods given here. Moulton also givesdata for a Hetchins (racing) machine with 27-inch wheels. At 6.7 m/sec, 142 W are required.In view of the unknown transmission losses,these results again substantiate the predictionmethods. Other data given by Moulton are for atubular-tired 27-inch-wheel Hetchins and a 17-inch-diameter-wheel machine with nylon-threadtires. The latter showed surprisingly low powerrequirements compared with all other machinesused.
Considering the predictable higher power re-
quirements that were obtained for the 16-inch-wheel machines compared with the single 27-
inch-wheel machine as confirming the effect ofwheel diameter, a major factor for the good per-formance of the 17-inch-wheel machine mustreside in the nylon-thread tires. DeLong gives a
plot of the relative rolling resistances of 27-inch-diameter bicycle tires (figure 8.3 of refer-ence 7) showing that quite surprisingly lowrolling resistances, less than half those of stan-dard tires, are obtained from nylon tires.In contrast with the techniques employed by
previous experimenters, Pugh measured the per-formances of bicyclists pedaling on an ergome-ter and actually riding on a flat concrete road.8
The rolling and air friction could be estimatedfrom the oxygen consumptions. Speeds in theroad-racing range-27 mph (12.1 m/sec)—werereached. The rolling-resistance and drag coeffi-cients obtained agreed reasonably well with val-ues quoted in the literature by Nonweiler (ref. 2)

0 2 4 6 8 10 1 2
m/sec
167 Power and speed
Figure 7.6Relation between oxygenintake and speed of sixcompetition cyclists.From reference 8. Largepoints A calculated fromdata on racing cyclist inreference 6.
Figure 7.7Relation between netenergy expenditure andcycling speed for sixcompetition cyclists.Inset: plot of energyexpenditure (W) versussquare of speed (Cv2).Large points A calculatedfrom data on racingcyclist in reference 6.
and by Whitt (ref. 6), particularly for concretesurfaces. The oxygen consumptions obtained byPugh per unit weight of rider for given speedsagreed very closely with those calculable fromthe table given in reference 6 for racing cyclists.In figures 7.6 and 7.7, predicted points are su-
perimposed on data from reference 8. Predic-tions made by the same methods also give goodagreement with the work of Hermans-Telvy andBinkhorst 9 and Davies.10
Power needed forland locomotion
In order to survive, living species like animals
and humans had to develop controllable move-ment, independent of gravitational and fluidforces which are the usual basis for movementof inanimate objects. The animal world devel-oped "lever systems," which pushed against theground in various ways from crawling, as dosnakes, through bounding, like rabbits, to walk-ing, as practiced by man, which in some waysis like the rolling of a spoked but rimless wheel.With the adoption of the wheel, yet anotherlever mechanism for movement, came thechance of using a separate inanimate source ofpower other than that of the muscles of themoving creature. Steam, internal-combustion-engine, and electric vehicles rapidly appearedwhen lightweight engines of adequate powerhad been produced.The bicycle is only one of the many man-
developed lever systems for land transport, butit is the sole remaining type that has a limitedpropulsive power. All other wheeled vehicleshave, in general, been fitted with driving unitsof progressively increased power. In ancienttimes teams of horses or cattle succeeded singledraught animals. The urge for more power andspeed seems ever present in human activities.
Animals or wheelsThe relative power needed to move a vehicle oranimal against ground resistance by variousmeans is shown in figure 7.8. At speeds of a few

Figure 7.8Power requirements ofhuman walking andpropulsion of variousanimals and vehicles.Some data from reference11.

miles per hour these sliding, crawling, leaping,or rolling motions absorb almost all the powerexerted by the subject, so that wind resistancecan be neglected for purposes of approximatecomparison. At higher speeds, the resistance tomotion due to air friction assumes a dominantrole and obscures the more fundamental differ-ence between wheel motion and other systemsof movement based on leverage.Lever systems are intrinsically efficient, and
figure 7.8 (which includes data from reference11) shows that Nature, in developing walkingfor man's progression, has given him a systemmore economical in energy use than that em-ployed by many other animals. Nature has alsoarranged for her lever systems to be adjustedautomatically according to the resistance en-countered. The stride of the walker changes, forinstance, according to the gradient. In this re-spect the rider of a bicycle is at a disadvantage,because bicycle gearing that automatically ad-justs to give an optimal pedaling rate is not yetperfected. Such a device would have advantagewhen a high power output over varying condi-tions was wanted. Modem multigeared bicyclescan approximate, if skillfully used, an automaticinfinitely variable gear. For low power output,such as is needed for low speeds, the combina-tion of foot pressure and crank revolution rate inot critical.
Bicycles versus other vehicles
The bicycle and rider, in common with mostother wheeled vehicles, can move over hardsmooth surfaces at speeds at which air resis-tance is significant—that is, at speeds greaterthan the 5-mph (2.2-m/sec) upper limit of figure7.8. The sum total of wind resistance, ground-movement resistance, and machinery frictiondecides the rate of progress for a given powerinput to a vehicle. These resistances have beenstudied carefully over a long period for thecommonly used machines, such as those using

Figure 7.9Power requirements forpropulsion of 2,240-lbm(1,016-kg) automobilewith frontal area of 20 ft2(1.86 m 2). Vertical axisrepresents propulsionpower at wheels.
171 Power and speed
pneumatic tires on pavement and steel wheelson steel rails.Graphs showing how the individual resis-
tances contribute to the total for bicycles, rail-way trains, and automobiles are given in figures7.2, 7.9, and 7.10. In each case typical examplesof vehicles without special streamlining havebeen chosen in order to bring out reasonablecomparisons. The tricycle has been included be-
cause it shows the incremental effort needed forpropulsion (up to 10 percent above that for the
bicycle, as can be deduced from the timesachieved in races). Published information con-
cerning the power and performance of mopedsis given in table 7.3.

Physics
mph
Figure 7.10Power requirements forpropulsion of freighttrain. Data from reference12, p. 1058.

Table 7.3 Power required to propel mopeds.
Moped Level-road max. Wheel
Engine data mass Rider mass speed diameter
Make hp kW rpm lb kg lb kg mph m/sec in. m
Powella1.05 0.78 3,500 — — — — 26 11.6
Mobylette 1.35 1.0 3,400 75 34 200 91 30 13.4 = 26 0.66
Magneet b 1.6 1.2 4,700 115 52 200 91 33 14.8
Raleigh 1.4 1.0 4,500 77 35 182 82.5 26 11.6 16 0.406
Sources:a. Cycling (9 July 1958): 24.b. Cycling (27 June 1957): 537.

Our present purpose in comparing these var-ious means of locomotion is to relate the bicycleto other common road vehicles. Some relativepower requirements are shown in figures 7.8and 7.11. Table 7.4 shows that, of all the vehi-cles, bicycles are impeded the most by wind. Afeature of modern automobiles is the relativelyhigh power absorbed by the tires (figure 7.3). Incontrast, railway trains are hardly affected bywind resistance below 40 mph (17.9 m/sec) (fig-ure 7.10). With regard to the propulsion powerrequired per unit weight, the bicyclist can beseen to need far less than the walker at lowspeeds.
mph
Figure 7.11Power requirements ofhuman walking andpropulsion of racingcyclist, automobile, andfreight train over a rangeof speeds. Data fromtable 1.2.

Table 7.4 Estimated forces opposing the motion of various vehicles on smooth surfaces in still air (typical cases).
Vehicleandweight
Originofforce
Resisting force, lbf (N)
5 mph(2.24 m/sec)
10 mph(4.47 m/sec)
20 mph(8.94 m/sec)
40 mph(17.9 m/sec)
Man Wind 0.2 (0.89)walking,150 lb
RollingTotal
13.0 (57.9)13.2 (58.7)
(68 kg)
Cyclist, Wind 0.2 (0.89) 0.8 (3.6) 3.2 (14) 12.8 (57)170 lb Rolling 0.9 (4.0) 0.9 (4.0) 0.9 (4.0) 0.9 (4.0)(77 kg)(racingtype)
Total 1.1 (4.9) 1.7 (7.6) 4.1 (18) 13.7 (61)
Auto, Wind 0.9 (4.0) 3.5 (15.6) 14.0 (62) 56.0 (249)2240 lb Rolling 37.0 (167) 37.0 (165) 37.0 (165) 37.0 (165)(1016 kg) Total 37.9 (169) 40.5 (180) 51.0 (227) 93.0 (414)
Freight Wind 35 (156) 140 (620) 560 (2490) 2,250 (10,010)train, Rolling 7,500 (33,370) 7,500 (33,370) 7,500 (33,370) 7,500 (33,370)1,500 tons Total 7,535 (33,530) 7,640 (33,990) 8,060 (35,860) 9,750 (43,380)

Human versus animal muscle powerThe power available for propelling a bicycle islimited to that of the rider. Let us study howhuman muscle power compares with that ofother living things with similar muscleequipment.
For thousands of years—and even today in theless-developed parts of the world—horses, cat-tle, dogs, and humans have been harnessed tomachines to turn mills, lift water buckets, anddo other tasks. When the steam engine was in-vented, it was necessary to have handy a com-parison between its power and that of a familiar
source. Experiments showed that a big horsecould maintain for long periods a rate of lifting
power equal to that of raising 33,000 lb (14,698kg) one foot (0.3048 m) in one minute. Thisvalue came to be universally accepted as the"horsepower." Average horses could in factwork at a greater rate, but only for briefer peri-ods which were not useful. Reference 12 ex-pands on the relationships between total outputper day and rate of output.Other information relating peak power output
to duration of effort is given in table 7.5 and
figure 2.5. It seems that a man tends to adjusthis power output to rather less than 0.1 hp (74.6W) if he intends to work for other than veryshort periods and is not engaged in competi-tion. This power level can be shown by experi-ments and by calculation (figure 7.4) to move abicyclist and machine on the level at 9-15 mph(4.0-6.7 m/sec), depending on wind resistance,type and weight of bicycle, and condition ofroad surface. This range of speeds has been as-sociated with average cycling since the stan-dardization of good rear-driven pneumatic-tiredbicycles.
Recently the breathing rates of pedaling bicy-clists have been measured. Reference 13 de-scribes such experiments with riders moving at10 mph (4.47 m/sec) and using 0.1 hp (74.6 W).Reference 14 shows that at about this power

Table 7.5 Power outputs of horse and man.
Period hp kW
2 min 2 1.5
10 h 0.67 0.5
10 h 0.11 0.08
10 h 0.058 0.043
10 h 0.081 0.06
8 h 0.12 0.09
2 min 0.51 0.38
Horse
galloping at 27 mph (12 m/sec)a
towing barge at 2.5 mph(1.1 m/sec)°
Man
towing barge at 1.5-3 mph(0.67-1.34 m/sec)b
turning winch°
working treadmill b
climbing staircasec
turning winchc
Sources:a. A. F. Burstall, A History of Mechanical Engineering(London: Faber and Faber, 1963).b. R. D'Acres, The Art of Water-Drawing (London:Henry Brome, 1659 / Cambridge: Hafer, 1930).c. reference 1.
output rather less than half the breathing capac-ity of an average man is involved, and informedopinion now suggests that this exertion is themaximum which could be expected without ad-verse effects on health for average men workingfor long periods.Information on the energy cost of locomotion
of animals other than man can be found in ref-erences 15-18.In a review of the energy used per ton-mile (or
tonne-km) and passenger mile (km) for suchvaried means of transportation as the S.S.Queen Mary, the supersonic transport, a rapid-transit system, and oil pipelines (ref. 8), Ricepoints out that a bicycle and rider are by far themost efficient. He calculates that a modest effortby a bicyclist which results in 72 miles (116km) being covered in 6 hours could require anexpenditure of about 1,800 kcal (7.54 MJ),which is in agreement with figure 7.5 for some-thing between a roadster and a sports bicycle.Assuming a weight of 200 lb (90.6 kg) for rider

Figure 7.12Energy cost of humanmovement andpropulsion of variousvehicles.
and machine, Rice states that this figure isequivalent to 100 ton-miles (146 tonne-km) (orover 1,000 passenger-miles) per gallon (3.785 li-ters) of equivalent fuel. The Queen Mary man-aged, by contrast, 3-4 passenger-miles pergallon (1.27-1.70 passenger-km per liter).The energy consumption of other modes in
comparison with that of a bicyclist is shown infigure 7.12.
kcal/km per person

179 Power and speed
Bicycling versus other Roller skating
human-powered From figure 7.1 it can be seen that for one hour
locomotion of maximum power output the record speedcredited to a roller skater (22.4 mph, or 10m/sec) is less than that of a track bicyclist (30.7mph, or 13.4 m/sec). If it is assumed that suchrecord makers exert equal powers at their re-spective relative speeds, an estimate can bemade of the rolling resistance of skates as fol-lows. Assume that the skater has a frontal areaof 3 ft2 (2.079 m2 ), which is less than the 3.65 ft2
(0.339 m2 ) of a very crouched bicyclist and hismachine. At 22.4 mph (10 m/sec) a bicyclist ex-erts 0.25 hp to overcome air resistance (see fig-ure 7.3). Therefore, the power needed by theskater to overcome air resistance is
(3/3.65) x 0.25 hp = 0.205 hp (149 W).
At 30.7 mph (13.7 m/sec), the bicyclist exerts0.73 hp (544 W) (see figure 7.1), and we assumethat the skater at 22.4 mph (10 m/sec) is exert-ing the same power. Hence, the power absorbedby the skates is
0.73 hp – 0.1205 hp = 0.525 hp (392 W).
If the skater weighs 154 lb (69.85 kg), the coeffi-
cient of rolling resistance of the skates is
392 W = 0.057.
69.85 kg x 9.81 m/sec2 x 10 m/sec
The above rolling resistance is very high com-pared with that of bicycle wheels, assumed forthe purposes of figure 7.3 as 0.003-0.008. Thevery large increase can be partly credited to theuse of very small wheels in the skates (about Athe diameter of bicycle wheels) and to the less-easy running at high speed of the hard rollerscompared with the pneumatic tires of the bicy-cle. Measurements of the pull required to keep askater running steadily made by the senior au-thor showed a rolling-resistance coefficient ofabout 0.060 at low speeds, and other informa-tion suggests that this would be greater at 21mph (9.39 m/sec).
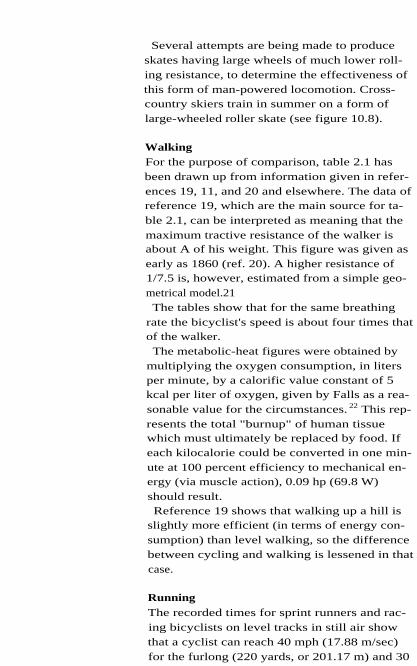
Several attempts are being made to produceskates having large wheels of much lower roll-ing resistance, to determine the effectiveness ofthis form of man-powered locomotion. Cross-country skiers train in summer on a form oflarge-wheeled roller skate (see figure 10.8).
WalkingFor the purpose of comparison, table 2.1 hasbeen drawn up from information given in refer-ences 19, 11, and 20 and elsewhere. The data ofreference 19, which are the main source for ta-ble 2.1, can be interpreted as meaning that themaximum tractive resistance of the walker isabout A of his weight. This figure was given asearly as 1860 (ref. 20). A higher resistance of1/7.5 is, however, estimated from a simple geo-metrical model.21The tables show that for the same breathing
rate the bicyclist's speed is about four times thatof the walker.The metabolic-heat figures were obtained by
multiplying the oxygen consumption, in litersper minute, by a calorific value constant of 5kcal per liter of oxygen, given by Falls as a rea-sonable value for the circumstances. 22 This rep-resents the total "burnup" of human tissuewhich must ultimately be replaced by food. Ifeach kilocalorie could be converted in one min-ute at 100 percent efficiency to mechanical en-ergy (via muscle action), 0.09 hp (69.8 W)should result.Reference 19 shows that walking up a hill is
slightly more efficient (in terms of energy con-sumption) than level walking, so the differencebetween cycling and walking is lessened in thatcase.
RunningThe recorded times for sprint runners and rac-ing bicyclists on level tracks in still air showthat a cyclist can reach 40 mph (17.88 m/sec)for the furlong (220 yards, or 201.17 m) and 30

181 Power and speed
mph (13.41 m/sec) for the mile (1,609.3 m),whereas a runner reaches only half thesespeeds. Assuming that the wind resistance of abicycle and rider and that of a runner are simi-lar at similar speeds, we can estimate that thepower needed for cycling is only about a fifth ofthat needed for running at the same speed, in
the range of 15-20 mph (6.7-8.9 m/sec).
Effect of gradients and Gradients and headwinds impede both the bi-
headwinds cyclist and the walker, but to different degreescompared with level progression in still air. Itcan be calculated that a gradient of 4 percent(1/25) or a headwind of 10 mph (4.47 m/sec)slows a bicyclist exerting a constant 0.05 hp(37.3 W) to about 2.5 mph (1.12 m/sec). Awalker developing the same power would beslowed from about 2 mph to 1.25 mph. Therider is slowed to 25 percent speed and thewalker to about 55 percent. As a consequence,the rider notices difficult conditions more thanthe walker. On the other hand, with a tailwindor when going downhill the bicyclist is aided tca far greater extent than the walker, and it isprobably this virtue of the bicycle that will en-sure its use even in country with hills so steepthat the bicycle must be pushed up them.
When a bicyclist or a walker climbs a hill hisweight has to be lifted through a vertical dis-tance, and as a consequence extra power is re-quired above that needed for progress along thelevel. The additional power required for a bicy-cle and rider with a total weight of 170 lbf (756N) to climb a hill of 5 percent (1/20) at 25 mph(11.18 m/sec) is
756 N x 11.18 m/sec = 423 W.
20
Hence, it is seen from figure 7.3 that a racingbicyclist climbing a 5-percent hill must exert apower of 0.57 + 0.407 or 0.97 hp (723.3 W). Hewould be sorely stressed and could do this foronly about 2 minutes, according to figure 2.5.

Bradley gives interesting information about his
climbing a 1/12 (8.5-percent) pass on the GrossGlockner, of 12.5 miles (20.1 km) length, in
about 57 minutes. 23 The gear used was 47inches (3.76 m), and it can be deduced that heexerted at least 0.6 hp (447.6 W), pedaling at arate of about 90 rpm. This performance is re-markably close to the fast 250 mile (40.2-km)time-trial performances listed in table 7.1, and
provides convincing proof that there is soundevidence for all the power-requirement esti-mates based on wind-resistance calculations (asdistinct from the more easily accepted simpleweight-raising calculations associated with hill-climbing bicyclists).
Should one walk or pedal up hills?Noncompetitive bicyclists have the option ofwalking up steep hills. Some prefer to do so,alleging that a change of muscle action is agree-able to them. Some bicyclists, however, preferto fit low gears to their bicycles and to ride as
much as possible. Whether it is easier to ride orto walk up steep gradients is often debatedamong bicyclists. We will use data developedpreviously to show that it should be more effi-cient to ride up to an approximately limitinggradient.If we confine attention to the everyday bicy-
clist, we can assume that he is unlikely to wishto use more than about 0.1 hp (74.6 W). A com-monly encountered steep hill is one with a gra-dient of 1/6.7, or 15 percent. It is assumed thatthe road speed which is thereby fixed as 1.5
mph (0.67 m/sec) gives no difficulties inbalancing.There have been many experiments on the ox-
ygen consumption of pedalers. 24.25 The datagiven in figure 2.9 appear typical in that, for apower output of 0.1 hp (74.6 W) at the wheel, ametabolic gross efficiency of 21 percent is rea-sonable. The cyclist will be "lifting" a machineweighing, say, 30 lbf (130 N) in addition to his

body (150 lbf, or 667 N), so a factor is necessaryfor the efficiency when compared with bodyweight alone. This can be calculated as
21 x 150 lbf/(150 + 30) lbf = 17.5 percent,
if one assumes that there is negligible rolling orwind resistance at 1.5 mph and if one neglectspower losses in the low gear.Reference 26 gives a summary of experimental
work concerning the oxygen consumption ofwalkers going up various gradients at variousspeeds. For a walking rate of 1.5 mph up agrade of 15 percent, it appears that a metabolicgross efficiency of 15 percent is accepted as typ-ical. This efficiency assumes as a basis the bodyweight being lifted against gravity. The bicyclistpushing his machine will be in a semicrouchedposition, so an adjustment to the efficiency mustbe made. Data from references 19 and 26 con-cerning the effects of walking in stooped posi-tions and when carrying small weights showthat pushing the 30-lbf bicycle absorbs 30 per-cent extra effort, so that the walker's muscle ef-ficiency based on his body weight alone isdecreased to 17.5 x (100 — 30)/100 = 12.3 per-cent. From the estimations above, it appears thatit is easier to ride up a 15-percent gradient thanto walk at the same speed of 1.5 mph (0.67m/sec), pushing the bicycle, by about 12.3/17.5,or about 30 percent.However, in practice, the lowest gear available
may be 20 inches (1.6 m), which gives a pedal-ing rate of 26 rpm—not optimal, according tofigures 2.3 and 2.9. A lowering of the previouslyassumed overall pedaling efficiency of 21 per-cent is bound to occur. Let us estimate this atabout 18 percent. As a consequence, the 30-per-cent difference quoted above should be taken asabout 18 percent. This difference gives only asmall margin for the extra transmission frictioninvolved in the use of a very low gear. Calcula-tions along the lines of the above show that the15-percent gradient may be a critical one, and

that at gradients of 20 percent there is no reallyappreciable advantage in riding the bicycle,even in a low gear.A matter not given prominence in this type of
discussion is the lack of wind cooling for thecyclist's relatively high heat output. At a poweroutput of 0.11 hp or 82 W (that is, 0.1 hp plusan allowance for low-gear friction), a rider onthe level would be traveling at some 14 mph(6.2 m/sec) and would receive considerablecooling. When climbing a hill at 1.5 mph for,say, 15 minutes, it is certain that an averagelyclothed bicyclist would feel himself getting hot.Unpublished data suggest a body-temperaturerise of appreciable magnitude: 1°F (0.55°C). It isprobable that such considerations influence bi-cyclists to get off and walk at very low speeds(say, less than 1 mph) when the lower heat lossfrom the lowered power output is more tolera-ble. Proponents of very low gears for hill climb-ing can claim not only a higher metabolicefficiency but also a much-needed heat-removaleffect from the more rapid movement of the legsat low forward speeds.
Human power versusengines and motors
Only two types of small power units have beendeveloped for propelling light bicycles. Thesmall internal-combustion engines used onmopeds and as auxiliary units on bicycles arewell known. The other type is an electric motorthat runs on lead-acid storage batteries; ascooter for use in factories uses this system. AHumber racing tandem of the 1890s (figure 7.13)was fitted with an electric motor and a framefulof batteries.Specifications for modern mopeds show that a
gasoline engine and accessories of power andendurance equivalent to that of a human ped-aler would weigh about 20 lbm (9.07 kg). Per-formance details for electric propulsion showthat this method would add about the weight ofa man in the form of batteries and a motor withan output of about 0.1 hp.
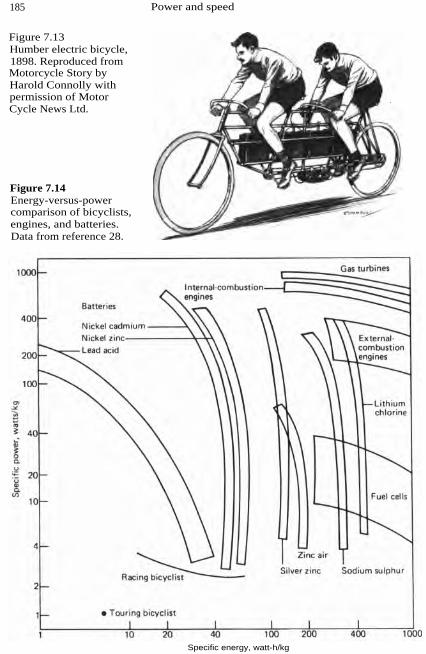
185 Power and speed
Figure 7.13Humber electric bicycle,1898. Reproduced fromMotorcycle Story byHarold Connolly withpermission of MotorCycle News Ltd.
Figure 7.14Energy-versus-powercomparison of bicyclists,engines, and batteries.Data from reference 28.
Specific energy, watt-h/kg

Reference 27 gives a chart (figure 7.14) of gen-eral data concerning the specific powers andenergies of various power sources. We haveadded data for a racing cyclist riding at 20 mphfor 24 hours, at 22 mph for 12 hours, and at 25mph for 4 hours. The dot represents a touringcyclist covering about 100 miles in 8 hours.There is a degree of similarity between humanenergy capacity and that lead-acid batteries,even though pedalers' performances are notstrictly comparable to those of batteries becausethe batteries are not recharged as the long-dis-tance cyclist is through periodic snacks.
Other data on various heat engines and humanperformances are given in table 7.6.
Table 7.6 Energy cost of movement by various means.
SpeedEnergy consumption' perperson
mph m/sec kcal/km mpg" km/l
Bicycle (roadster) plus 4 1.79 8.4 2440 1037rider 10 4.47 15.6 1310 557
15 6.70 24.4 840 357
Walker 4 1.79 55.3 370 157
Runner 10 4.47 68.3 300 127
Swimmer 1½ 0.67 269.6 76.0 32.3
Horse + rider 10 4.47 245.4 83.5 35.5
Moped + rider 20 8.94 88.3 232 98.6
Auto + 5 riders 30 13.4 120.5 170 72.360 26.8 183.0 112 47.6
Auto + 1 rider 30 13.4 539 38 16.260 26.8 820 25 10.6
Diesel commuter train +riders
30 13.4 112 183 77.8
a. For the metabolic energies, these figures give the incremental consumptionabove the resting level.b. Equivalent miles per U.S. gallon of 33,000-kcal/gal fuel (gasoline per person,calculated as follows: mpg = 33,000 x 0.621/kcal-km.

187 Power and speed
References 1. A. Sharp, Bicycles and Tricycles (London: Long-mans, Green, 1896 / Cambridge, Mass.: MIT Press,1977).
2. T. Nonweiler, Air Resistance of Racing Cyclists, re-port 106, College of Aeronautics, Cranfield, England,1956.
3. A. Moulton, The Moulton Bicycle, Friday eveningdiscourse, Royal Institution, London, 23 February1973.
4. G. Buckett, A Bicycle Dynamometer, undergraduateproject, Keble College, Oxford, 1974.
5. C. R. Kyle et al., Factors Affecting the Speed of aBicycle, California State University, Long Beach, 2November 1973; see also Bicycling (July 1974): 22-24.
6. F. R. Whitt, A note on the estimation of the energyexpenditure of sporting cyclists, Ergonomics 14(1971), no. 3: 419-424.
7. F. DeLong, Guide to Bicycles and Bicycling (Rad-nor, Pa.: Chilton, 1974).
8. L. G. C. E. Pugh, The relation of oxygen intake andspeed in competition cycling and comparative obser-vations of the bicycle ergometer, Journal of Physiology141 (1974): 795-808.
9. E. J. Hermans-Telvy and R. A. Binkhorst, Lopen offietson?-Kiesen op bass van het energieverbruick,Hart Bulletin (6 June 1974): 59-63.
10. J. D. Brooke and C. J. Davies, Comment on the es-timations of energy expenditure of sporting cyclists,Ergonomics 16 (1973), no. 2: 237-238.
11. M. G. Bekker, Theory of Land Locomotion (AnnArbor: University of Michigan Press, 1952).
12. J. C. Trautwine, The Civil Engineer's ReferenceBook, 21st edition (Ithaca, N.Y.: Trautwine, 1937), pp.685-687.
13. W. C. Adams, Influence of age, sex and bodyweight on the energy expenditure of bicycle riding,Journal of Applied Physiology 22 (1967): 539-545.
14. C. H. Wyndham et al., Inter- and intra-individualdifferences in energy expenditure and mechanical ef-ficiency, Ergonomics 9 (1966), no. 1: 17-29.
15. C. L. M. Kerkhoven, Kenelly's law, Work Studyand Industrial Engineering 16 (February 1963): 48-66.
16. K. Schmidt-Nielson, Locomotion: Energy cost ofswimming, flying and running, Science 17 (21 July1972): 222-228.

17. S. S. Wilson, Bicycle technology, Scientific Ameri-can 228 (March 1973): 81-91.
18. R. A. Rice, System energy and future transporta-tion, Technology Review 74 (January 1972): 31-48.
19. G. A. Dean, An analysis of the energy expenditurein level and grade walking, Ergonomics 8 (1965), no.1: 31-47.
20. "Velox" (pseudonym), Velocipedes, Bicycles andTricycles: How to Make and Use Them (London: Rou-tledge, 1869).
21. "An Experienced Velocipedist," The Velocipede(London: J. Bruton Crane Court, 1869), pp. 5-6.
22. H. B. Falls, Exercise Physiology (New York: Aca-demic, 1968).
23. B. Bradley, My Gross Glockner ride, Cycling (25July 1957): 90.
24. Report of the Bicycle Production and TechnicalInstitute, Japan, 1968.
25. S. Dickenson, The efficiency of bicycle pedaling asaffected by speed and load, Journal of Physiology 67(1929): 242-245.
26. I. McDonald, Statistical studies of recorded energyexpenditures of man. II. Expenditures on walking re-lated to age, weight, sex, height, speed and gradient,Nutrition Abstracts and Reviews 31 (July 1961): 739-762.
27. S. W. Gouse, Steam cars, Science Journal 6 (1970),no. 1: 50-56.
Recommended reading M. Denny, Locomotion: The cost of gastropod crawl-ing, Science 208 (13 June 1980): 1288-1290.
R. M. Alexander, Animal Mechanics (Seattle: Univer-sity of Washington Press, 1968).

8 Braking
The friction of drysolid substances
Experiments have shown that when two sur-
faces are pressed together with a force F, thereis a limiting value R of the frictional resistanceto motion. This limiting value is a definite frac-tion of F, and the ratio R/F is called the coeffi-cient of friction, µ . Therefore, R = µF . For dry,
rigid, surfaces, p. is affected little by the area ofthe surfaces in contact or the magnitude of F.When surfaces start to move in relation to one
another, the coefficient of friction falls in valueand is dependent on the speed of the relativemovement. For steel wheels on steel rails thecoefficient of friction can be 0.25 when station-ary and 0.145 at a relative velocity of 40 mph(17.9 m/sec). Polishing the surfaces lowers thecoefficient of friction (one cause of brake fade),as does wetting. The coefficients of metal-to-metal dry friction are about 0.2-0.4 (down to0.08 when lubricated); for leather to metal theyare 0.3-0.5. All these are for stationary condi-tions and decrease with movement. Brake-liningmaterials against cast iron or steel have a fric-tion coefficient of about 0.7, and this value de-creases less with movement than for other
materials. Elastomers (rubbery materials) deformunder load, which causes their friction to behighly variable. In contrast with the case of dryrigid surfaces, the friction of elastomers is af-fected by contact area, increasing with greaterarea. Thus, such measures as "dimpling" brakerims can be counterproductive. The friction ofelastomers is at a maximum when the materialis made to "creep" along a surface. As true slid-ing begins, the coefficient of friction falls, de-creasing with increasing relative velocity.The variability of friction with contact area
and relative motion, coupled with the flexibilityof brake mechanisms which can change the

190 Physics
Bicycle brakes
Figure 8.1Plunger brake on ThomasHumber's safety bicycle.Reproduced withpermission fromNottingham Castlemuseum.
contact area as the load increases, often leads toa "stick-slip" sequence, which, occurring re-peatedly and rapidly, gives rise to brake squeal.
Two places where solid-surface friction occursmust be considered in normal bicycle braking:the brake surfaces and the road-to-wheel con-tact. (This excludes track bicycles, which arebraked by resisting the motion of the pedals, therear cog being fixed to the wheel hub without afreewheel.)
Five types of brakes have been fitted to regularbicycles for ordinary road use.The plunger brake is used on some present-day
children's bicycles and tricycles, and was usedon early bicycles such as the ordinary or penny-farthing and on pneumatic-tired safeties up toabout 1900 (figure 8.1). Pulling a lever on thehandlebars presses a metal shoe (sometimesrubber-faced) against the outer surface of thetire. These were and are used on solid andpneumatic tires; the performance is affected bythe amount of grit taken up by the tire, whichfortunately increases braking effectiveness andwears the metal shoe rather than the tire. Suchbrakes are very poor in wet weather because thetire is being continuously wetted.

The internal-expanding hub brake is similar tothe hub brakes of motorcycles and cars, but it isless resistant to water and therefore its perfor-mance varies in wet weather. Hub brakes usedto be popular on medium-weight "roadsters" inthe 1930s, but they lost favor. They have re-cently been reintroduced in an improved formby T. I. Sturmey Archer Ltd. (figures 8.2, 8.3).
The backpedaling or "coaster" hub brakebrings multiple disks or cones together whenthe crank rotation is reversed (figure 8.4). Thesebrakes operate in oil and are entirely unaffectedby weather conditions. They are very effectiveon the rear wheel; they cannot be fitted to thefront wheel because the actuating force requiredis too great to be applied by hand. They cannotbe used with derailleur gears, and if the chainbreaks or comes off the sprockets there is nobraking at all.The disk brake has recently been introduced
for bicycles. It is cable-operated from normalhand levers (figure 8.5). The effective brakingdiameter is at less than half the wheel diameter,which requires a high braking force but keepsthe surfaces away from the wheel spray in wetweather. These brakes are reputed to be effec-tive in wet and dry weather.
The rim brake is the most popular type. A pad,usually of rubber-composition material, isforced against the inner or the side surfaces ofthe wheel rims, front and rear. Because thebraking torque does not have to be transmittedthrough the hub and spokes, as with the preced-ing three types, and because the braking force isapplied at a large radius, these brakes are in-trinsically the lightest types and result in thelightest bicycle design. Rim brakes are, how-ever, very sensitive to water (the coefficient offriction with regular combinations of brakeblocks and wheel materials has been found tofall when wet to a tenth of the dry value') andto wear by the rim. Some blocks wear rapidly,requiring continual adjustment (provided auto-

Figure 8.2
Sturmey-Arc her internal-expanding hub brake.Courtesy of T. I.Sturmey-Archer, Ltd.

Figure 8.3Exploded view ofSturmey-Archer internal-expanding hub brake.Courtesy of T. I.Sturmey-Archer, Ltd.
Figure 8.4Exploded view of Bendixbackpedaling hub brake.Courtesy of Bendix Corp.Power and EngineComponents Group,Elmira, N.Y.

Figure 8.5Disk brake on rear wheel.Courtesy of Phil Wood.
matically in some designs) and block replace-ment about every 2,000 miles (3,218 km).Automobile brake shoes, with heavier duty,
last around 50,000 miles (80,500 km).
Duty of brake surfaces Drum brakes for modern motor vehicles can bedesigned by allowing a certain horsepower(from 6 to 10) to be absorbed per square inch(about 7-12 MW/m 2) of braking surface. 2 Thepower to be absorbed depends upon the speedand mass of the vehicle and on the desired de-celeration rate.
For a typical bicycle of 30 lb (13.6 kg) andrider of 170 lb (77.1 kg), let us determine thepower loading at the brake blocks (assumed tohave a total area of 4 in. 2 or 2,581 mm2) if aretardation of —0.5g (half gravitational accelera-tion) from 20 mph (8.94 m/sec) is required.Gravitational acceleration, g, is 32.17 ft/sec2(9.81 m/sec2), and expressing braking decelera-
tions as proportions of g is useful because itgives directly the proportion of the vehicle's

and/or rider's weight which must be applied asbraking force. The time t for a retardation a isgiven by
v 2 = v, + at,
where v 2 = 0 and v, is the initial velocity.Therefore, v, = —at, and so
The stopping distance is
The initial kinetic energy is
= 3,625 joule (2,672 ft-lbf).
The power dissipation falls from a peak at ini-tial application of the brakes to zero when the
bicycle comes to rest. Determining brake duty—largely a function of surface heating—requiresthe mean power dissipation, KE/t, which isgiven by
3,625 J = 1,988 W (2.67 hp).
1.823 sec
Thus, the power absorbed per unit of brake-
block area is
This is less than one-tenth of the average load-ing allowed in automobile-brake practice.Therefore, the surface area is more than ade-quate for braking. However, many riders inmountainous country have learned, to their dis-may, that the thermal mass of and the heattransfer from a wheel rim are small. Rim brakescan cause the rim's temperature to rise quicklyto the point at which the rubber cement holdingtire patches, or even the tire itself, softens, and
the tires will deflate or (in the case of "stick on"tubular tires) come off the rim. When these fail-
ures occur at speed on the front wheel, seriousaccidents are possible.The adequacy of a vehicle's braking surface is,
of course, only one factor in determining thedistance in which the vehicle can be stopped. Itis necessary in addition to be able to apply an
adequate force to the brake system. Bicyclebrakes are often deficient in this respect, espe-cially in wet weather (when the coefficient of
friction is greatly reduced) and especially forthe front wheel (where most of the braking ca-pacity is available).
Friction between tireand road
Longitudinal stabilityduring braking
If we assume that an appropriate force can beapplied to the brakes and that the blocks or lin-ings have been proportioned so that they willnot fade on account of heating, the stopping ca-
pacity of the brakes depends directly upon thegrip (or coefficient of friction) of the tires on theroad. For pneumatic-tired vehicles, this gripvaries from 0.8 to 0.1 times the force betweentire and road, according to whether the surfaceis dry concrete or wet ice.
The weight of the bicycle and rider does not di-vide itself equally between the two wheels, par-ticularly during strong braking. To determinewhether or not the braking reaction is impor-tant, let us estimate the changes in wheel reac-tions for the typical bicycle and rider above forbraking at half the acceleration of gravity.
If the wheelbase is 42 inches (1.067 m) and thecenter of gravity of rider and machine is 17
inches (0.43 m) in front of the rear-wheel centerand 45 inches (1.143 m) above the ground (fig-ure 8.6), we can calculate the front-wheel reac-tion Rf when stationary or when riding atconstant speed by equating moments aboutpoint 1 in figure 8.6:

Figure 8.6Assumed configurationfor braking calculations.
Rf x 1.067 mm = 90.7 kg X 9.81 m/sec2X 432 mm,
so
Rf = 360 N (81 lbf);
therefore,
Rr = 890 – 360 = 530 N (119 lbf).
During the 0.5g braking, a total braking force of
0.5 X 890 = 445 N (100 lbf) acts along the road
surface. The front-wheel reaction Rf aroundpoint 2 in the figure is now
Rf X 1,067 mm = 890 N x 432 mm+ 445N x 1,143 mm,
so
Rf = 837 N (188.1 lbf);
by subtraction,
Rr = 53 N (11.9 lbf).

Figure 8.7MIT test setup for brake-block materials. Thespring allows the testblock to follow aninevitably uneven rimwithout large variationsin force. Strain gauges inthe support allowmeasurement of normaland tangential forces.Courtesy of AllenArmstrong, Positech, Inc.
Thus, the rear wheel is in only light contactwith the ground. Only a slight pressure on therear brake will cause the rear wheel to lock andskid. The front brake has to provide over 90percent of the total retarding force at a decelera-tion of 0.5g, even if the tire-to-road coefficient offriction is at the high level of 0.8. Therefore,brakes that operate on the rear wheel only, how-ever reliable and effective in themselves, arewholly insufficient to take care of emergencies.Another conclusion from this calculation is
that a deceleration of 0.5g (4.91 m/sec 2 , or 11mph/sec) is almost the maximum that can berisked by a crouched rider on level ground be-fore he goes over the handlebars. We can calcu-late the maximum possible deceleration as aproportion P of g by setting Rr = 0 in the above
case. Then, taking moments of force (torques)around point 3, we have
890 N X (1,067 — 432) mm = P X 890 Nx 1,143 mm,

whence P = 0.56g, or 5.45 m/sec2 (12.19mph/sec). Tandem riders and car drivers do nothave this limitation; if their brakes are adequatethey can theoretically brake to the limit of tire-to-road adhesion. If the tire-to-road coefficient offriction is 0.8 they are theoretically capable of adeceleration of 0.8g, which is 60 percent greaterthan that of a bicyclist with the best possiblebrakes. For this reason—and many others—bi-cyclists should never "tailgate" motor vehicles.
Minimum braking If it is assumed that the slowing effect of air re-
distances for stable sistance is negligible, a relatively simple for-vehicles
mula can be used to estimate the minimumstopping distance of a vehicle fitted with ade-
quate braking capacity and having the center ofgravity sufficiently low or rearward in relationto the wheelbase for there to be no danger of therear wheels lifting (see ref. 2):
[Initial speed (m/sec)]2Distance (m) –
20(CA + CR)
Or
Distance (ft) =30(CA + CR)
where CA is the coefficient of adhesion and CR
that of rolling resistance. (C A is the value of thecoefficient of friction, µ, of a rolling wheel justbefore skidding occurs.)Table 8.1 gives typical values for the coeffi-
cients, and table 8.2 gives calculations for var-ious speeds of pneumatic-tired vehicles andactual stopping distances for railway trains. Inpractice, greater distances are needed for brak-ing than those based on the formula and on ahigh adhesion coefficient. The railway figuresindicate that if an adhesion coefficient of 0.1 isassumed, the formula gives braking distances ofabout half those normally found in practice (ref.2).
[Initial speed (mph)]2

Table 8.1 Coefficients of adhesion and rollingresistance (motor car).
SurfaceCoefficientof adhesion
Coefficientof rolling
Concrete or asphalt (dry) 0.8-0.9 0.014Concrete or asphalt (wet) 0.4-0.7 0.014Gravel, rolled 0.6-0.7 0.02Sand, loose 0.3-0.4 0.14-0.3Ice 0.1-0.2 0.014
Sources: Reference 2, p. 321; G. M. Carr and M. J.Ross, The MIRA single-wheel rolling resistancetrailers, Motor Industries Research Association,Nuneaton, England, 1966.
Table 8.2 Stopping distances for bicycles, cars, and trains.
Speed(mph)
Stopping distance, pneumatic tires (ft)
Railway train,practical (ft)Calculated
Safety code,cycle
Safety code,car
8 2.5 3 4010 4 6012 5.7 8 8016 10 16 12020 16 24 20 16030 36 45 26040 64 80 51050 100 125 85060 145 185 1,300
Note: The adhesion coefficient used for calculated stopping distances is 0.85. Theother distances for pneumatic tires are quoted from Road Safety Codes. (The safetycode is a set of guidelines published in Britain as minimum recommendedstandards.) All values are for stopping on dry concrete. Practical values for railwaytrains are included for comparative purposes.

Table 8.2 includes distances quoted in Britishroad-safety codes 3 for best performance of pneu-matic-tired vehicles. These are also about twice
those calculated from the formula (with an as-sumed adhesion coefficient of a magnitudeachievable under very good circumstances). Theroad-safety-code performance figures have beenwell checked by the Road Research Laboratory(U.K.), the 1963 report of which gives details ofmeasurements carried out on "pedal cycles" ofvarious types as well as many types of motorvehicles. 4 The braking distances listed for bicy-cles confirm the calculations made above, whereit was found that a little better than 26 ft (8.14m) was possible for stopping from 20 mph (8.94m/sec) without overturning. If the rider sat wellback over the rear wheel he would be able toshorten the distance a little further. However,evidence obtained from spot checking indicatesthat the average motor vehicle on the roadneeds about twice the quoted code distances forbraking under specified conditions (ref. 4), andit may be assumed that the same "servicefactor" applies to bicycles.
Rear-wheel-onlybraking
Let us see what braking distance we may expect
if the same rider and bicycle studied earlier,starting from 20 mph (8.94 m/sec), brake withthe rear brake only to the limit of tire adhesion.We assume that the rear brake is strong enoughto lock the wheel if desired, and that the coeffi-cient of friction µ, between the tire and the roadsurface is 0.8. Then the maximum retardingforce is 0.8 X R r , where Rr is the perpendicularreaction force at the rear wheel. This rear-wheelreaction force Rr is somewhat less than thevalue during steady level riding or when sta-tionary, because the deceleration results in morereaction being taken by the front wheel. Let ustake the moments of forces about point 3 in fig-ure 8.6. Under the assumed static conditions themachine is in equilibrium:

R r x 1,067 mm + µRr x 1,143 mm= 890 N x (1,067 – 432) mm
with µ, = 0.8; thus,
R r = 285.2 N (64.1 lbf).
Then the deceleration, a, as a ratio of gravita-
tional acceleration, g, is given by Newton's law:
So the retardation is less than half the value at
which, using the front brake to the maximumsafe limit, the rider would be about to go overthe handlebars (0.56g).The time taken for this deceleration is given as
before by
v1 = –at,
–8.94 m/sec t = = 3.56 sec
–0.256 x 9.81 m/sec2
and the stopping distance is given by
S = v 1 + v2
t – 8.94 m/sec x 3.56 sec
2 2
= 15.91 m (52.2 ft).
Therefore, the stopping distance is about twicethat for reasonably safe front-wheel braking. Inpractice a longer stopping distance is likely, be-cause a deceleration level sufficiently below thelimit where skidding starts would be chosen.
Wet-weather braking Wet conditions affect both road adhesion andthe grip of rim brakes on the rim. Braking dis-tances for bicycles equipped with conventionalrim brakes are approximately quadrupled in wet

Figure 8.8Friction coefficients forwet and dry braking. Rimmaterials: (0) nickel-chromium-plated steel,( D) aluminum alloy. Datafrom reference 1 andfrom A. Armstrong,Dynamometer Tests ofBrake-Pad Materials(report), Positech, Inc.,ca. 1977.
weather (ref. 4). Cars, which are generally fittedwith weatherproof disk or drum brakes, are notnearly as affected by wet weather.Experiments using laboratory equipment to
simulate wet-weather braking of a bicycle wheel(refs. 1 and 4) have yielded the following signif-icant findings.For brake blocks of normal size and composi-
tion running on a regular 26-inch (equivalent to650 mm) plated steel wheel, tests at the Massa-chusetts Institute of Technology (see reference 1and figures 8.7 and 8.8) showed that the wetcoefficient of friction was less than a tenth ofthe dry value. Moreover, the wet wheel would
Nominal coefficient of sliding friction, dry

turn an average of 30 times with full brake pres-sure applied before the coefficient of friction be-gan to rise, and a further 20 turns werenecessary before the full dry coefficient of fric-tion was attained (table 8.3). This recovery didnot occur if water was being added to the brakeblocks or rims after brake application, as might
occur during actual riding in very wetconditions.The measurement of coefficients of friction is
frowned at by some investigators who believethat the notorious variability in measured valuesmakes bicycle stopping distance from a stan-dard speed of 15 mph (6.7 m/sec) on an actualor simulated bicycle the only valid measure.However, such stopping-distance tests havetended to confirm the validity of the MITresults.
Several different materials were investigated at
MIT, and the results are shown in figure 8.8 andtable 8.4. Although many of the materials arebrake materials designated only by numbers, itcan be seen that regular bicycle brake blocks("B-rubber") have the highest dry coefficientand the lowest wet coefficient of friction of allmaterials tested. Attempts to improve the wetfriction by cutting various grooves in the blocksor by using "dimpled" steel rims were unsuc-cessful. Similar findings have been reported byothers.The Road Research Laboratory found (ref. 4)
that wet-weather performance can be improvedby the use of brake blocks longer than the usual2 inches (51 mm). Softer blocks than are com-mon these days are also desirable, along withmore rigidity in the brake mechanism and inthe attachment to the frame of the brake itself.
Extra friction in the longer rear cable can de-crease the force applied to the rear blocks by20-60 percent compared with that at the front.Brake-cable "casings" with linings of low-fric-tion plastic, such as PTFE, have been devel-oped, and it is highly desirable that such

Table 8.3 Test data on operation of rim brakes; rimsinitially wetted.
Point
Brakingforce
Coefficientof friction,
µlbf N
1 (wet start) 22 97.9 0.172 (prerecovery) 22 97.9 0.173 (recovering) 26 115.7 0.204 (recovering) 31 137.9 0.245 (recovering) 35 155.7 0.276 (recovering) 39 173.5 0.307 (recovered) 44 195.7 0.34
Turns of wheel before onset of recovery 30Turns of wheel during recovery 20
Total turns to recovery 50
Source: reference 1, page 32, run C-2.
Table 8.4 MIT data on brake-block materials for equivalent speed of 10 mph(4.5 m/sec).
Friction Nature Average Average µwet Turns tomaterial of run µdry µwet µdry recovery Remarks
R-451 dry 0.33 - - - p. = 0.39 at 120°F(48.9°C)
R-451 wet-dry 0.34 0.17 0.50 50B rubber wet-dry 0.95 0.05 0.05 55 Erratic recoveryR-4528-4 wet-dry 0.55 0.10 0.18 54Maple wet-dry 0.44 0.09 0.20 42 µmax = 0.56
Lockheed wet-dry 0.45 0.12 0.27 25 during rec'yR-451 wet-dry 0.34 0.17 0.50 53Cork A° dry 0.63 -
0.42 -Cork A wet - 0.26Cork A dry 0.79 - 0.24 -Cork A wet - 0.19Cork B b dry 0.67 -
0.28Cork B wet - 0.19Cork A wee - 0.16 - -Cork B wetc - 0.25 - -R-451 dry 0.43 - -R-451 wet-dry 0.37 0.17 0.46 70
Source: reference 1, p. 34.a. Orientation A: Layers parallel to friction face.b. Orientation B: Layers perpendicular to friction face.c. After a 48-h soak.

casings become standard. However, it has beenpointed out that the rear brake requires less ac-tuating force than does the front if locking(skidding) is to be avoided. Although there havebeen commercializations of bicycle brakes withself-adjusting mechanisms, these were not suc-cessful. Virtually no present brakes allow ad-justment without wrenches through the wholerange of brake-block wear, a lack that leads toextremely dangerous conditions in bicycles rid-den by less mechanically able persons.The MIT tests were made with steel rims be-
cause of the severe dropoff in braking efficiencywhen rims of this material were used with anyof the brake blocks then (1971) available. Sincethat time there have been several developmentsin wet-weather braking. These have beenspurred partly by the aim of the InternationalStandards Organization (Technical CommitteeTC/149) and of the U.S. Consumer ProductSafety Commission to formulate generally ac-ceptable safety standards for the performance ofbicycle brakes in wet weather.One development has been the introduction of
a number of disk brakes (figure 8.4), which re-tain most of their stopping power when wet.Hub brakes have also been reintroduced in animproved form (figure 8.2). These can also befitted to front wheels, which is desirable. How-ever, the weight penalty incurred by the huband by the heavier wheel it requires will pre-vent hub brakes being adapted to lightweightbicycles.Aluminum-alloy rims have been standardized
by some manufacturers. Compared with steel,aluminum usually gives a lower coefficient offriction with a given brake-block material in thedry and a higher coefficient in the wet. As thisresults in a smaller change in performancewhen going from dry to wet than occurs with
steel rims, the use of aluminum rims is clearlyan improvement. In some cases, there have beenattendant disadvantages. The softer aluminum
tends to be machined out of the rim if a piece ofgrit gets under a brake block. Pieces of alumi-num become embedded in the brake block andoxidize to aluminum oxide (a hard, abrasivematerial), and then the rim is machined morerapidly and the dry coefficient of friction canfall to a dangerously low level. The junior au-thor has had the braking surfaces of two alumi-num wheels separate suddenly, blown out bytire pressure after the rim had been machined tobelow a critical thickness by brake action. Suchan occurrence could lock the front wheel, withdisastrous consequences. A possible solution tothese problems of aluminum rims lies in one ormore of a number of improved brake blocks re-cently marketed. Some are specifically for alu-minum rims; others give much-improved wet-weather performance on steel rims.
It has recently been recognized that leather,which was first used for bicycle brakes beforethe turn of the century because of its good wearresistance, coefficient of friction, and ability toconform to the profile of the rim, also possessesoutstanding wet-braking properties when usedagainst a chrome-plated surface. This is true forchrome-tanned leather, but not, apparently, forleather tanned by the older "vegetable" process.It gives a ratio of wet-to-dry friction of between0.5 and 1.0, for reasons not fully understood butconnected with the porosity between the fibersand their affinity for water. No other material,synthetic or natural, has been found that can re-produce these qualities and at the same timestand up to the abrasion and temperatures in-herent in the duty of a brake lining. Fibrax Ltd.has brought out a brake block in a leather re-puted to be from buffalo hide. It is reported togive outstanding performance, with wet stop-ping distance no more than 30 percent greaterthan the dry. In 1980, Fibrax introduced aleather block for use with aluminum rims.A rubber block of conventional shape but with
a thin insert of special leather on the rubbing

Figure 8.9Sturmey-Archer leather-composite brake block.Courtesy of T. I.Sturmey-Archer, Ltd.
face (figure 8.9) was introduced in 1981. Theleather is treated to ensure a good bond to therubber, which is molded onto it, and to preventdegradation during the molding process. Themanufacturer claims that, as well as solving thewet-braking problem in a practical and econom-ical way, the composite block has a life severaltimes that of a conventional rubber one, andthat if the leather wears through the perfor-mance simply reverts to that of a normal rubberblock. This block is the subject of a patent ap-plication. The leather fibers are surprisinglyhard. If used with an aluminum alloy rim theywill abrade the surface, causing the leather toclog and the rim to wear, so this type of blockshould only be used with steel rims. Raleighrecommends that alloy rims should continue tobe used with high-quality rubber blocks, whichgive a reasonable wet-braking performance; theratio of the wet to the dry coefficient of frictionis in the range 0.3-0.5.Despite these seemingly excellent features,
leather brake blocks vary in performance andcannot yet be said to be the complete answer tothe wet-braking problem.A commercial elastomer has been produced as
blocks and as bonded brake shoes by theScott/Mathauser Corporation. We do not havedata on the coefficient of friction, but stopping-distance tests have shown these blocks to givethe shortest distances of all brakes tested whendry and to be second only to leather in the wet.The material has very good wear resistance. Theexcellent dry performance implies that usersmust take care to avoid overbraking on the frontwheel.
A consequence of the MIT work with steelrims was the development of a brake that coulduse aircraft brake-pad materials found by Han-son to suffer very little drop in friction coeffi-cient in going from dry to wet conditions. Thefriction coefficient was too low to be used in aregular caliper brake, because too large a

squeeze force would be required. It was not pos-sible to strengthen a regular caliper brake andthen to increase the leverage, because a conse-quence of increased leverage is decreased brake-pad motion. (Because bicycle wheels of presentconstruction cannot be relied upon to run true,a considerable brake-pad gap must be allowed.)Therefore, a brake with two leverages was de-veloped. When the brake lever is initiallysqueezed, the pads are moved under very lowleverage (low force, large movement). As soonas the pads contact the rim, a slider in the brakemechanism locks up, and further movement hasto take place through a high-leverage, high-force
action. 5 The brake therefore has the additionaladvantage that it automatically takes up padwear without further adjustment.
The dual-leverage brake was redesigned byPositech, Inc. (figure 8.10) and tested. Used onthe front wheel only, with a regular caliperbrake on the rear, it regularly achieved stoppingdistances of less than 25 percent of those givenby regular brakes in wet conditions (3.5 m from6.7 m/sec, instead of the usual 15-20 m). How-ever, it has not been taken up commercially.Occasionally, brakes are developed in which
the braking forces themselves supply part of the
Figure 8.10Positech dual-leveragebrakes. The cylindricalbody contains a sliderthat locks when the padscontact the rim.Subsequent movement ofthe actuating cablecauses pad movementthrough the largeleverage about the caliperpivot instead of throughthe small leveragethrough the chain link.

Figure 8.11Servo-action brakeblocks. Arrow indicatesdirection of rim motion.
actuating force ("servo-action" brakes). A re-cently marketed French system (figure 8.11) in-corporates angled ramps within the brake shoes,so that the brakes, in being pulled forward bythe wheel rim during braking, are also forced 4inward to give a stronger squeeze (but only ifthere is significant friction in the cable, so thatthe hand lever is not merely pushed out). A dis-advantage of such "positive-feedback" arrange-ments is that they magnify the differencesbetween dry and wet friction coefficients. Thebrake may give strong braking action with alight actuating force when dry but provide in-sufficient braking even with a maximumsqueeze action when wet. What is needed,rather, is an added "negative feedback" stage tolimit braking in dry conditions to below theamount that would result in the rider beingprojected over the handlebars. A braking systemincorporating such a combination of positiveand negative feedback (figure 8.12) has been de-veloped by Calderazzo (R. C. Hopgood, personalcommunication to D.G.W., 19 January 1979).Only the rear-wheel brake is actuated by therider. The brake is mounted on a lever pivotednear the wheel axis so that it is carried forwardduring braking. In doing so, it actuates (througha cable) the front brake, with any reasonable de-

Figure 8.12Calderazzo feedbackbrake system. Whenhandbrake is operated,rear brake is carriedforward on slider againstspring, actuating frontbrake simultaneously. Ifbicycle starts to pitchforward, rear wheel is nolonger rotated by roadsurface, and front brakeis released.
To handbrake lever
sired degree of force multiplication. Accord-
ingly, little effort need be required for strongbraking to be obtained. As soon as the degree ofbraking that causes the rear wheel to start skid-ding is reached, the braking at the front wheelis automatically limited. In hundreds of testswith this system, in which testers made "panicstops" from high speeds on different surfaces,never did a rider even begin to go over the han-dlebars. (The front forks of the test bicycle even-tually failed through fatigue—testimony tobraking effectiveness and fork-design inade-quacy.) As of 1980, this promising system istied up in patent litigation.
It has been found that, even when surfaces rollupon one another, a certain amount of slippingtakes place, and that this leads to frictionallosses. This phenomenon is rooted in the factthat the surfaces, however "hard," create cavi-ties at the places of contact, and that these leadto alternate compression and expansion of thematerials at these points and, as a consequence,
to expenditure of energy. 6 With soft surfaces,the effects are pronounced but are well worthputting up with where vehicle tires are con-cerned because of the comfortable ride.Although efficient tread patterns are essential
for the good grip of automobile tires on the roadat high speeds under wet conditions, it appearsthat at bicycle speeds the requirements for bicy-cle tires are not so stringent. Data from sometests suggest that no appreciable variation in thegrip of a tire on the road under wet conditionscould be expected from any design alteration(ref. 4). Below 20 mph (8.94 m/sec), nearlysmooth patterns should suffice. This prediction
is verified by the only slightly corrugated sur-faces used for years on racing-bicycle tires.
Backpedaling As stated above, track bicycles are braked bybackpedaling. The idea that the rider shouldperform work to "destroy" energy has intriguedmany people since the early days of bicycling.Horse-drawn vehicles have been braked in this
way for thousands of years, and people runningdown stairs and steep slopes experience a simi-lar muscle action.Much discussion was devoted in the past to
comparing the muscle actions used in forwardand backward pedaling. Sharp concluded thatmuscle physiology played an equal part withmechanical motion.' He devised the interestingchart shown in figure 8.13 in the course of hiswritings on this subject. Time has provedSharp's surmise correct, in that research hasshown that for a given oxygen consumption apedaler can resist power supplied by an animateor an inanimate prime mover more efficientlythan he can perform ordinary forwardpedaling." A classic experiment in which aforward ergometer pedaler is resisted by a back-ward pedaler demonstrated vividly this differ-ence in energy cost. The basic physiologicalreasons, involving muscle-action theory, are stillbeing debated in the literature under the head-ing of "negative" or "eccentric" work.

213 Braking
R= Ws± (0.01W + 0.013V2)
Figure 8.13Power expended inbackpedaling. Dashedlines are resistancecurves representingrolling plus aerodynamicdrag. Solid lines arepower curves. s is thegradient expressed aspercentage/100 (forexample, 0.12 is 1 in8.5). Intercepts of power
curves with horizontalaxis show terminaldownhill speed for eachgradient. Between thesevelocities and zerovelicity the "negative"power that has to beexerted in backpedalinggoes through amaximum. Fromreference 7.

References
Recommended reading
1. B. D. Hanson, Wet-Weather-Effective Bicycle RimBrake: An Exercise in Product Development, M.S. the-sis, Massachusetts Institute of Technology, 1971.
2. Kempe's Engineer's Year Book, vol. 11 (London:Morgan, 1962), pp. 320, 353.
3. Safe Cycling (London: HMSO, 1957).
4. Research on Road Safety (London: HMSO, 1963).
5. F. DeLong, The Positech brake, Bicycling (Emmaus,Pa.) (November 1976): 38-39.
6. A Dictionary of Applied Physics, ed. R. Glazebrook(London: Macmillan, 1922).
7. A. Sharp, Back-pedalling and muscular action, CTCGazette (1899): 500-501.
8. B. C. Abbott, B. Bigland, and J. M. Ritchie, Thephysiological cost of negative work, Journal of Physi-ology 117 (1952): 380-390.
9. H. B. Falls, Exercise Physiology (New York: Aca-demic, 1968), pp. 292-294.
D. Bianca, Sliding Friction and Abrasion of Elasto-mers, report, Canadian Institute of Mining Metallurgy1967; reviewed in Engineering (London) (4 August1967): 182.

9 Balancing and steering
The balancing and steering of bicycles is an ex-
tremely complex subject on which there is agreat deal of experience and rather little sci-ence. We will report what we believe to be thebest of each. Both approaches—experience andscience—have attempted to answer two relatedbut different questions:
• What are the geometrical relationships that cangive the single-track vehicle, considered as arigid body, "good" steering characteristics?This question concerns riding at any speed,but particularly at low speed, when steeringangles (the angle through which the handlebaris moved by the rider) can be large. Above 2-3
m/sec (9-13 mph) the handlebar cannot beturned by more than a few degrees to eitherside of the straight-ahead (neutral) positionwithout the rider being thrown out of balanceand, usually, off the bicycle.
• What other factors, when combined withgeometrical relationships, can avoid thesteering instabilities known as shimmy (arapid oscillation of the front wheel about theneutral position, usually occurring rathersuddenly at fairly high speed)?
A vibration or an oscillation is usually similarto the bouncing of a weight hung on an elasticthread. The occurrence of steering oscillationsimplies, therefore, that the elasticity of thestructure and possibly of the rider is involved.Let us defer discussion of this complex questionuntil after we have considered the still-compli-cated question of the steering characteristics ofa bicycle considered as a rigid body.

Steering The rigid-body geometry is complicated because
characteristics of of the many angles involved and because of the
nonflexing bicycles
offset of the front fork (figures 9.1 and 9.2).Three important angles are
the steering-head angle (the most important of
the angles defining the frame), which is usuallybetween 68° and 75°,
the steering angle, or the angle of the handle-bars from the straight-ahead, neutral position,and
the angle of lean of the bicycle frame to thehorizontal.
If the fork had no offset, the front wheel would
sweep out a sphere as it was turned. With theoffset, the wheel sweeps out a "doughnut." It isthe combination of bicycle lean with the front-wheel position as a slice of the doughnut thatmakes bicycle geometry so complex. An addi-tional problem when we account for the gravita-tional and centripetal forces occurs if we wish
Figure 9.1Front-fork geometry. H:head angle. y: fork offset.d: wheel diameter. t:trail.
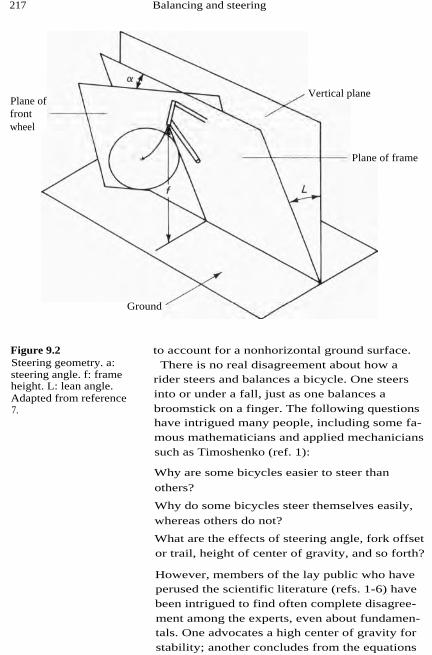
Plane offrontwheel
Vertical plane
Plane of frame
Ground
217 Balancing and steering
Figure 9.2Steering geometry. a:steering angle. f: frameheight. L: lean angle.Adapted from reference7.
to account for a nonhorizontal ground surface.There is no real disagreement about how a
rider steers and balances a bicycle. One steersinto or under a fall, just as one balances abroomstick on a finger. The following questionshave intrigued many people, including some fa-mous mathematicians and applied mechanicianssuch as Timoshenko (ref. 1):
Why are some bicycles easier to steer than
others?
Why do some bicycles steer themselves easily,
whereas others do not?
What are the effects of steering angle, fork offsetor trail, height of center of gravity, and so forth?
However, members of the lay public who haveperused the scientific literature (refs. 1-6) havebeen intrigued to find often complete disagree-ment among the experts, even about fundamen-tals. One advocates a high center of gravity forstability; another concludes from the equations

that a low mass center is desirable. One findsthat gyroscopic action is important; another theexact opposite. We have found that the mostuseful and relevant information about bicyclesteering and stability is that given by DavidJones, a chemist who looked into bicycle stabil-ity as a diversionary project.'Jones set out to build an unridable bicycle
(URB). In his URB I, he canceled out the gyro-scopic action of the front wheel by mountingnear it another similar wheel which he couldrotate backwards. He found that this made littledifference to normal handling, and concludedthat gyroscopic action has little influence on bi-cycle stability. He did find, however, that URB Iwould not travel riderless. Gyroscopic actionwas important for the lightweight bicycle alone,but not for the bicycle plus rider, when therider was controlling the bicycle with the han-dlebars. When Jones attempted to ride URB I"no hands," he could only just maintain hisseat. The bicycle seemed to lack balance and re-sponsiveness. This confirmed Den Hartog'sanalysis (ref. 2).We will not relate in equal detail Jones's sev-
eral other URBs, with large, small, and reversedfork offset and with a tiny front wheel. Suffice itto say that he was able to ride all of them, al-though URB IV, with a very large fork offset,was unstable and very difficult to ride. URB IIIhad reversed fork offset and therefore a verylarge trail, and was extremely stable. Whenpushed, riderless, it would steer itself for an as-tonishingly long time, negotiating depressionsand bumps in the road and continuing until itwas almost stationary before falling over. It was,however, sluggish and heavy to steer on anypath other than that dictated in some way by itsinteraction with the roadway. (D.G.W. had anold car with some of these characteristics; everybump or hollow in the road would change thedirection without any movement of the steeringwheel, and to maintain a straight course re-

quired continuous anticipatory steering. A highdegree of stability is not always desirable in avehicle.)Jones quantified a stability function after mak-
ing the following observations: When the bicy-cle is wheeled by, for instance, holding thesaddle, it is caster action that makes the frontwheel go straight ahead when the bicycle ismoved with the frame vertical on a horizontalroadway. The front wheel "trails" the frame.The rear wheel trails along, too. One can imme-diately see the importance of trail by pulling thebicycle backward. If the steering-head bearingsare free, the front wheel (now in the rear) willimmediately flop around to some large steeringangle. This movement of the front wheel is notat first assisted by gravity. The wheel sweepsout a doughnut, and regardless of the head an-gle (so long as it is less than 90°) or the forkoffset (so long as it is finite) the front wheel isat a point of unstable equilibrium. That is, it re-quires a small disturbance to make it flop over.When the frame of the bicycle is tilted, thewheel is no longer in equilibrium in thestraight-ahead position. There is a force or turn-ing moment that increases the frame tilt andacts to turn the handlebars. The equilibrium an-gle taken up by the handlebars is, however, aninverse function of frame tilt. In other words,with a small tilt the handlebars turn a long way,and with a large tilt the handlebars go only afew degrees from the neutral position. The rea-son the handlebars turn is that this allows theframe to fall; the frame and the weight carriedon it seek the minimum-potential-energyposition.The computer program Jones wrote to solve
the steering geometry of a single-track vehiclewith a rigid body and thin wheels (no allow-ance was made for tire cross-section shape) pro-duced graphs like figure 9.3, which is for onesteering-head angle and one fork offset (as aproportion of wheel diameter). He decided to

220 Physics
Steering angle ¤
Figure 9.3Typical results ofstability calculations.Degree values on curvesrepresent lean angle L;axis at middle representsrelative frame height f /d;
slopes indicated nearmiddle are [d (f/d)/d¤]¤=0
Head angle H is 700 forkoffset y/d is 0.094.
concentrate on the steering characteristics whenthe steering angle was near to zero, as in normalriding. Small changes in steering angle wouldproduce a rise or fall in the frame height(df/d a). Jones reasoned that, for stable steering,the steering should "want" to turn into thecurve as the frame leans around a bend. Thereason for the steering wanting to turn had to be
the fall of the frame in these circumstances.This criterion is expressed mathematically asthe requirement that
be negative. From his computer program Jonesproduced figure 9.4, which covers all likely
combinations of head angle and what he calls

221 Balancing and steering
Relative front projection (x/d)
Figure 9.4Jones's stability criterion.Diagonal lines representconstant stability, u[d2(f/d)/d¤dL]¤=0 ( 0)1887 Rudge; (•) high-wheelers; (0) moderntrack bike; (µ) modernroad bike; (A) moderntourist bike; ( A) Raleigh"chopper"; ( 0) Rosschild's bike; (•) 1879Lawson safety; (C. ) URBIII; ( n ) URB IV. Note:Because high-wheelersdiffer from safeties inthat the rider pedals andstraddles the front wheel,the points for high-wheelers are included forinterest only.
"front projection," identified on figure 9.1. Hefound that the graph agreed with experience.URB IV was indeed in the unstable region,while URB III was far into the stable region. Wehave added some other bicycles to those Jones
considered.The information in figure 9.4 can be expressed
in more familiar terms as
(y/d) = 0.00917((90° – H)(sinH) + 4u], (9.1)
where y is the fork offset, d is the wheel diame-ter, H is the head angle (in degrees), and u isthe stability criterion
Experience indicates that bicycles have good
steering characteristics when u is between –1and –3.

Range of practicableconfigurations forstandard bicycles
The standard diamond-frame safety bicycle has
resulted in the universal selection of steeringangles from a very small range. This range hasemerged from the following considerations. Thecrank length has generally been chosen at 170mm to suit the majority of adult riders. Theheight of the bottom bracket above the groundhas then been fixed so that the pedals clear theground in at least low-speed cornering. The rearwheel is brought as close to the bottom bracketas can reasonably be arranged, with the seat-tube angle positioning the saddle so that therider's center of gravity is reasonably forward ofthe rear-wheel center even when an upright rid-ing position is used. (Otherwise the front wheelwould lift off the ground every time one at-tempted rapid acceleration.) Then, in touring orcommuting bicycles, the front wheel plus a pos-sible fender or mudguard is brought as close tothe bottom bracket as possible without therebeing a possibility of the feet or toeclips catch-ing on the fender or fender stays during a turn.If a large steering-head angle is used with thisproviso, the top tube or crossbar becomes long,requiring a long reach to the handlebars. Ac-cordingly, a relatively small head angle is usedfor touring and commuting bicycles. Racing andtrack bicycles do not use fenders, and the de-signers allow the possibility of interference be-tween the toe clips and the tire because the skillof the rider can be relied upon to avoid it.Therefore, a relatively large steering-head anglecan be used on a racing bicycle, giving asmaller and more rigid frame. The consequenceis that touring bicycles generally have head an-gles of 72°-73°, road-racing bicycles have anglesof 73°-74°, and track bicycles have angles of74°-75°. We have calculated the stability indexu for some of the bicycles listed in reference 8(see table 9.1). It is surprising, and gratifying, tosee the small range of u values used by design-ers. This seems to confirm the value of Jones'swork. As might be expected, there is a tendency

Table 9.1 Steering geometries and stability indices ofhigh-quality bicycles.
StabilityFork-offset index
Bicycle type Head angle ratio' u°
Touring 72° 0.0736 –2.2772° 0.0740 –2.2672° 0.0692 –2.3973° 0.0845 –1.76
Road-racing 73° 0.0837 –1.7874° 0.0729 –1.8674° 0.0976 –1.1874.5° 0.0804 –1.54
Track 75° 0.0759 –1.5575° 0.0953 –1.02
for the high-speed road-racing and track ma-chines to have u values in the more stable range(from –2.0 to –2.65) and for the touring ma-chines to use u values from –1.85 to –2.3,
which give somewhat lighter, more responsivesteering but still give plenty of stability accord-ing to Jones's criterion. The overlap between thetouring and the racing machines is notable. Itwould seem that one could specify u = –2.0 forany type of bicycle and simply specify the headangle at 72°-73° for touring or 73°-75° for rac-ing. Any variations of u from –2.0 would be forpersonal taste rather than because of any safetyconsiderations. However, we have given a widerrange of u (from –1.0 to –3.0) in table 9.2, to-gether with a range of head angle from 70° to76°, so that the fork offset may be specified byinterpolation if desired.Equation 9.1 may also be used. For example, if
we wish to specify the fork offset y for a trackbicycle with wheels 680 mm in diameter and ahead angle of 74°, and if we choose u = –2.25,
the equation gives

y = 680 X 0.00917[(90 – 74) sin74 – 4 x 2.25]= 39.78 mm (1.565 in.).
The trail, t, is also given in table 9.1. It mayalso be calculated from the formula
However, trail is a dependent variable, and notof primary importance. The frame builder worksto a fork offset, y, and this should be specifiedfrom the head angle H and the desired stabilityvalue u, using table 9.2 or the formula uponwhich it was based.
Table 9.2 Ratio of fork offset to wheel diameter forvarious stability indices.
Stability index u
Head angle –1.0 –2.0 –3.0
70° 0.135 0.099 0.06272° 0.120 0.083 0.04774° 0.104 0.067 0.03176° 0.088 0.051 0.015
Shimmy This phenomenon is well but trivially illus-trated by many small carts, such as those oftenused in food markets, whose castered wheelsoscillate through a large angle when the cart ispushed above a certain critical speed. Shimmyis dangerous when it occurs in vehicles carryingpeople. When airplanes switched from having asingle trailing tail wheel to a single leadingnose wheel (which, of course, was mountedwith a degree of trail), many lives and planeswere lost when a nose-wheel would suddenlyshimmy to the point where control was lost orsome part of the structure failed.9A shimmy-type oscillation occurs in a system
with mass, structural springiness, and dampingif a mechanism arises to reinforce a random ini-tial oscillation and if the damping is small. By"damping" we mean some form of frictionaldissipation. A ball bouncing on the end of aspring will have some damping in the spring

material and more damping in the air resis-tance; if the ball is lowered into a pool of water,the additional damping stops the oscillationvery quickly.
Bicycle front-wheel shimmy probably happensas follows: Something, a bump in the road per-haps, causes a sudden change in steering anglewhen the bicycle is going straight ahead. Themachine is going too fast to respond by turningin the direction of steer. Rather, the inertia ofthe bicycle and rider carries them forward, andthe caster action of the front wheel produces avery large restoring moment. Because of themass and gyroscopic inertia of the front wheel,it does not respond exactly in phase with therestoring moment. Rather, some energy is storedin flexing of the forks, of the handlebar stem,and perhaps of the wheel itself. Most of this en-ergy is converted to kinetic energy when thewheel passes through its neutral position, caus-ing it to overshoot and to repeat the process.There is not much damping in this system solong as the oscillations are small. When theybuild up to the point where the handlebarsmove appreciably, much of the additional en-ergy will be lost in the friction between thehands and the grips. There will also be in-creased losses in the tire "scrubbing" on theroad. But the oscillations may still be largeenough to cause loss of control.
Shimmy may be influenced by loads carriedover the front wheel, or by looseness in variousjoints and bearings. There is no universal curefor shimmy. It should be helpful to increase thestiffness of all components, especially the frontfork, the handlebars and stem, and perhaps es-pecially the wheel. Spokes should be pulled upto produce a high stress. Paradoxically, thisusually results in longer spoke life than if the
stress is low enough to allow considerablespoke flexing. Increased stiffness will increasethe natural frequency, which will increase thespeed at which shimmy could occur and will

reduce the amount of energy stored in the vibra-tions. The inherent damping (friction) in thetire-road contact and in the fork-frame-handle-bar structure may then be sufficient to suppressshimmy altogether.
Other factorscomplicating steering
The analyses by Jones and others involved fairly
drastic simplifying assumptions, while showingby experiment that in normal circumstancesthese simplifications were justifiable. Here wewill list some of the real-life factors usually ig-nored, and then mention anecdotally some ofthe steering problems that have been difficult toanalyze or even to experiment with.
Tire slipWhen there is a side force on the wheels (such
as when there is a sidewind, or when the bicy-cle is being ridden along a sloping surface or acurved path), the tires "slip" in the direction ofthe side force. The angle of the slip depends onthe ratio between the side force and the normalforce, on the angle between the plane of thewheel and the ground, on the tire pressure, andon the tire's construction. Typical graphical re-lations for the slip angle are shown in figure9.5.
Rider's steering responseThe rider responds to perceived changes in bal-ance (for instance) by moving the handlebars.Each rider has a different response and a differ-ent delay before initiating the response (ref. 7).
WheelbaseShort-wheelbase bicycles are said to be "respon-sive," whereas long-wheelbase cycles (such astandems) are "sluggish."
Mass of bicycleThe mass of a bicycle and the location of thecenter of mass affect steering behavior.

Figure 9.5Typical slip angles forbicycle tires at variousinclinations. Fromreference 6.
227 Balancing and steering
Mass of riderThe mass of the rider (more particularly, the re-lation of the rider's mass to the machine's) andthe relative position of the rider's center of massinfluence steering behavior.
Wheel moment of inertiaThe higher the moment of inertia of the wheel,the higher is the gyroscopic torque producedwhen the plane of the wheel is turned.
Road-surface inclination angleThe angle the road surface makes with the hori-zontal significantly affects the steering forcesand the tire-slip angle (figure 9.5).
Angle of riderMany riders try to hold themselves in the sameplane as the bicycle under all conditions. Other:hold their bodies at an angle to the plane of thecycle, particularly when going around a curve.In doing so they produce a different bicycle in-clination angle than if the rider's center of mass

had remained in the plane of the bicycle, andthe steering response is changed.
Rider-bicycle connectionA bicycle may be ridden with the feet in toeclips, the crotch firmly on an unsprung saddle,and the hands gripping the metal of the handle-bars. Conversely, the rider may have a muchlooser or more flexible connection with the bi-cycle through a deeply sprung saddle, sponge-filled handlebar grips, and rubber-tread pedals,or he may ride with hands off the handlebars,crotch off the saddle, or feet off the pedals. Inall of these circumstances the response of themachine will vary.
This list by no means exhausts the components
of bicycle-riding characteristics—for instance,the springiness of the frame and the slack andfriction in the steering bearings are of some im-portance. However, the above are probably themost important factors. Many of these factorsare nonlinear. Mathematical analysis is under-standably difficult in such a system; computersimulation is more appropriate. A simulation byRoland'° has been the most comprehensive sofar and has shown considerable success. An ex-ample of the simulation and of angles measuredfrom an instrumented rider and bicycle isshown in figure 9.6. (Side-force loading wassupplied by a small rocket motor—a hazard notoften encountered on the road.) The computerwas programmed not only to provide graphicalresponses, but also to illustrate the rider in anelementary manner as shown in figure 9.7.Most of the conclusions of Roland's study
would be acceptable by experienced bicyclists,and in fact would be regarded as commonsense. This likely reaction gives one confidencein the method, and one wishes that it couldhave been carried farther into areas where wedo not have good answers. Here, for instances,are two experiences of the junior author, one in

Figure 9.6Comparison of simulatedand experimental bicycleresponses afterdisturbance of steeringtorque. From reference10.
229 Balancing and steering
volving a potentially serious safety hazard andthe other more a comment on a tradeoff.
Of a fairly wide range of small-wheeled bicy-cles the author had ridden, one had a signifi-cantly safety hazard. It was a Moulton Speedsixwith a 16 x 11 inch (406 x 28.6 mm) front tireon an aluminum-alloy rim. On two occasionswhen the front tire had sudden blowouts, thesteering became unmanageable. On the secondoccasion the front wheel slipped sideways, tak-ing the bicycle into the middle of the road infront of a bus, which fortunately was able tostop. Was this strange behavior attributable tothe steering geometry, or to some characteristicof the tire and wheel when the tire was de-flated? As this tire and wheel size is no longeravailable, the question may be academic; nosimilar characteristics have been found withvarious bicycles with 16 x 1i inch (406 x 34.9mm) tires, despite experiments aimed at induc-ing instability.

Figure 9.7Computer-graphicsrendition of bicycle andrider. From reference 10.

Figure 9.8Avatar 1000 recumbentbicycle.
231 Balancing and steering
Figure 9.9Avatar 2000 recumbentbicycle. Courtesy ofFOMAC, Inc.

The second experience is related to the effectof the height of the center of mass of a bicycleand rider. D.G.W. has bicycled over severalhundred thousand miles on regular diamond-frame sports-tourist bicycles and on Moultons,but for most of the past decade has used recum-bent bicycles of short and long wheelbase (fig-ures 9.8, 9.9). He finds little advantage ordisadvantage of one configuration over anotheras regards steering characteristics in normal cir-cumstances. Each novel configuration required aperiod of familiarization and then a longer pe-riod during which the rider's automatic re-sponses were tuned to the particularcharacteristics of the type. However, there aresome perhaps abnormal circumstances in whichthere is a sharp difference between the handlingof machines with low and high centers of mass.These circumstances are those of an icy orsnowy roadway, particularly when other vehi-cles have worn tracks in the ice or snow. Inthese conditions, a sideways skid of the front orrear wheel of a bicycle may be limited in extent.The wheel in effect may jump from one rut toanother. For a given distance of side-slip, theresulting angle of lean is much greater for thelow-mass-center than for the high-mass-centerbicycle. The consequence is that many skidsthat would be quite tolerable on the higher ma-chine cannot be escaped from on the low-mass-center bicycle. The tradeoff is that, although itmight appear from the above that a regular(higher) bicycle is preferable to the recumbent,the danger of serious injury increases sharplywith the height of the fall. One could take theillustration a step farther: a high-wheeler (pref-erably fitted with pneumatic tires) would proba-bly be the best configuration for ice and snow,but the danger of serious injury in a fall from ahigh-wheeler was, and is, very great.

233 Balancing and steering
Alternative designs Rear-wheel steeringMany people have seen theoretical advantagesin the facts that front-drive, rear-steering recum-bent bicycles would have simpler transmissionsthan rear-drive recumbents and could have thecenter of mass nearer the front wheel than therear. The U.S. Department of Transportationcommissioned the construction of a safe motor-cycle with this configuration. It turned out to besafe in an unexpected way: No one could rideit. The same is true of a rear-wheel-steering bi-cycle of the normal "safety" configuration con-structed at the Bendix Company in Elmira, N.Y.,which was reported to have stumped all corners.L. H. Laiterman, in an undergraduate project atthe Massachusetts Institute of Technology,
11
made a rear-steering recumbent in which allsignificant aspects of the configuration could beadjusted, and after considerable practice didlearn to ride the machine, albeit in an unsteadymanner.Even if it were possible to further improve the
rear-steering configuration (whether of the re-cumbent design or not) and to learn how tocontrol such a machine fairly predictably, therewould be obvious disadvantages in, for in-stance, avoiding a suddenly opened car door byfirst steering into the direction of the car withthe rear wheel. The essence of the unsteadinessis related to this aspect of obstacle avoidance: asone begins to fall to one side, one can steer into(or under) the fall with the rear wheel, but thenthe inertia (the so-called "centrifugal force")will act to increase the rate of fall.
"Backward" configurationThe theoretical advantages cited above for rear-wheel-steering bicycles can be fully realized
with a configuration in which the rider sitsbackwards in relation to the direction of travel.This arrangement permits the use of full-sizewheels and a short wheelbase (desirable for eas3

Figure 9.10Stability test of reverse-direction bicycling.Courtesy of Milton W.Raymond.
balancing), yet does not require the rider tostraddle the steered leading wheel.A low-speed-stability test machine was built
by M. W. Raymond (personal communication toD.G.W.) to investigate the possibilities for aroadworthy enclosed streamlined recumbent"backward" bicycle (figure 9.10). The rider usesa plane mirror for forward view. Although thevery low center of mass imposed the most se-vere balancing conditions, Raymond could bal-ance at 0.5 mph (0.25 m/sec), and could performlow-speed circles and figure-eights. Despite thispromise, he found that driving with a mirror"far too repellent for normal use." When heused a stabilized mirror to remove the dizzyingview caused by side-to-side weave, the rear-fac-ing-rider concept still failed. At workable eye-to-mirror distances, the widest mirror practicalfor a streamlined housing gave too narrow afield of view for true roadworthiness.Another approach would be to have a forward-
facing rider steer both wheels, but the short-wheelbase solo bicycle would be complicatedbecause the rider would straddle the front

235 Balancing and steering
Hands-off bicycling
wheel. The front wheel would have to be lim-ited to making balancing corrections, while therear wheel would do the gross steering, mainlyin low-speed maneuvers. At the time of thiswriting (1981) Raymond was experimentingwith a less complex method to steer bothwheels of a long-wheelbase bicycle. For a firsttest of the wheelbase-immune balancing con-cept, Raymond and his co-workers have underconstruction a two-rider bicycle with a seatheight of about 12 inches (300 mm) and awheelbase of 12 feet (3 m). The relatively longstreamlined hull required may bring crosswindeffects that limit use of the concept to multi-rider bicycles.
Although riding "hands-off" is frowned uponby safety authorities, for obvious reasons, manu-facturers of regular "safety" bicycles believethat their riding characteristics should be suchthat they can be ridden without the hands onthe handlebars. One reason for not consideringrecumbent bicycles was the supposition thatthey cannot be ridden hands-off. 12 (In fact theycan: Tom Winter, professor of classics at theUniversity of Nebraska at Lincoln, who has con-structed at least two recumbents, enjoys ridingwith arms folded when the situation is suitable).
Bourlet believed that there should be only asmall sideways movement of the head part ofthe frame when the front wheel is turned tosteer. 13 F.R.W. has speculated that the hands-offrider accomplishes the steering action by twist-
ing the frame through this sideways degree offreedom, and that it is desirable that only asmall amount of movement be permitted. Bour-let recommended a sideways movement assmall as 20 mm, and gave a somewhat compli-cated formula relating the fork offset to the
steering-head angle (the angle of the fork-rota-tion axis with the horizontal) for satisfactorysteering. For a 27-inch wheel the calculated off-set is 1.7 inches (45 mm) for a steering angle of

75°, giving a y/d value of 0.063. If such a calcu-lation is made using Davison's simplerformula 14 for the same steering angle, the offsetis again about 1.7 in. (45 mm). It will be seenfrom tables 9.1 and 9.2 that this confirms theapproach of using the stability index of Jones(ref. 7), with the Bourlet and Davison formulasgiving slightly lower stability indices than isusual nowadays. Davison felt it important that
there be no rise or fall of the frame head forsmall steering movements, but because thewheel sweeps out (in general) a doughnut shapeas the handlebars are turned, with the frontwheel at the lowest point of the inclined dough-nut at the neutral (straight-ahead) position,there will be no vertical head movement forsmall steering changes for any practical steeringgeometry in the range covered by tables 9.1 and9.2.
References 1. S. Timoshenko and D. H. Young, Advanced Dy-namics (New York: McGraw-Hill, 1948), p. 239.
2. J. P. Den Hartog, Mechanics (New York: Dover,1961), p. 328.
3. G. S. Bower, Steering and stability of single-trackvehicles, The Automobile Engineer V (1915): 280-282.
4. R. H. Pearsall, The stability of the bicycle, Proceed-ing of the Institute of Automobile Engineering XVII(1922): 395.
5. R. A. Wilson-Jones, Steering and stability of single-track vehicles, Proceeding of the Institute of Mechani-cal Engineers 17 (1922), no. 395: 191-213.
6. R. S. Rice and R. D. Roland, Jr., An Evaluation ofthe Performance and Handling Qualities of Bicycles,report VJ-2888-K, Cornell Aeronautical Laboratory,1970.
7. D. E. H. Jones, The stability of the bicycle, PhysicsToday (April 1970): 34-40.
8. D. Banten and C. Miller, The geometry of handling,Bicycling (Emmaus, Pa.) (July 1980): 97-106.
9. J. P. Den Hartog, Mechanical Vibrations (New York:McGraw-Hill, 1956), pp. 329-334.

237 Balancing and steering
Recommended reading
10. R. D. Roland, Jr., Computer Simulation of BicycleDynamics, paper, American Society of Mechanical En-gineers, 1973.
11. L. H. Laiterman, Theory and Applications of Rear-Wheel Steering in the Design of Man-Powered LandVehicles, B.S. thesis, Massachusetts Institute of Tech-nology, 1977.
12. K. Hutcheon (Technical Director at T.I. RaleighLtd.), personal communication to D.G.W.
13. C. Bourlet, Le nouveau traits des bicycles et bicy-clettes equilibre et direction, in Encyclopedie scienti-fique des aide memoire, ed. M. Lêaute (Paris:Gauthier-Villars, 1898), pp. 84-104.
14. A. C. Davison, Upright frames and steering, Cy-cling (3 July 1935): 16-20.
E. Bernadet, L'Etude de la direction, Le Cycliste (Sep-tember–October 1962): 228.
C. Bourlet, La bicyclette, sa construction et sa forme(Paris: Gauthier-Villars, 1899), p. 60.
R. N. Collins, A Mathematical Analysis of the Stabilityof Two-Wheeled Vehicles, Ph.D. thesis, University ofWisconsin, 1963.
CTC Gazette (February 1899), p. 73.
"Cyclotechnie," L'etude de la direction, Le cycliste(November 1972–January 1973).
F. DeLong, Bicycle stability, Bicycling (May 1972):12-13, 45.
E. Dohring, Stability of single-track vehicles, For-schung Ing. Wes. 21 (1955), no. 2: 50-62 (tr. CornellAeronautical Laboratory, 1957).
, Steering wobble in single-track vehicles, Auto-mobil technische Zeitschrift 58 (1962), no. 10: 282-286 (MIRA translation 62167).
H. H. Griffin, Cycles and Cycling (London: Bell, 1890).
H. Fu, Fundamental characteristics of single-track ve-hicles in steady turning, Bulletin of Japanese Societyof Mechanical Engineers 9 (1965), no. 34: 284-293.
M. Kondo, Dynamics of Single-Track Vehicles, report,Foundation of Bicycle Technology, 1962.
G. T. McGraw, Engineer (London) 30 (2 December1898).

J. R. Manning, The Dynamical Stability of Bicycles,report RN/1605/JRM, Department of Scientific and In-dustrial Research, Road Research Laboratory, Crow-thorne, England, 1951.
R. S. Sharp, The stability and control of motorcycles,Journal of Mechanical Engineering Science 13 (1971),no. 4.
D. V. Singh, Advanced Concepts of the Stability ofTwo-Wheeled Vehicles: Application of MathematicalAnalysis to Actual Vehicles, Ph.D. thesis, Universityof Wisconsin, 1964.
A. Van Lunteran and H. G. Stassen, Investigations ofthe Characteristics of a Human Operator Stabilizing aBicycle Model, International Symposium on Ergonomics in Machine Design, Prague, 1967, p. 27.
, On the Variance of the Bicycle Rider's Behav-ior, Sixth Annual Conference on Manual Control,Wright-Patterson (Ohio) Air Force Base, 1970.
D. M. Weir, Motorcycle Handling Dynamics and RideControl and the Effect of Design Configuration on Re-sponse and Performance, University of California, LosAngeles, 1972.
F. J. W. Whipple, The stability of the motion of a bi-cycle, Quarterly Journal of Pure and Applied Mathe-matics 30 (1899): 312-348.

10 Materials and stress
The makers of early bicycles used "traditional"materials: woods reinforced with metals, asused in the earliest vehicles. The shortcomingsof this type of construction for human-poweredvehicles soon became apparent, and tubular-steel construction with rolling (instead of rub-bing) bearings appeared in the 1870s. In generalthere has been no basic change in these basicprinciples of bicycle construction, althoughsmoother roads, better steels, aluminum alloys,and improved design have resulted in a reduc-tion in bicycle weights to about one-third ofthat common for early machines.
For most of the past century, then, the princi-pal materials used for the frames of bicycleshave been steels: low-carbon for inexpensivemachines, medium-carbon for the middle-rangemodels, and heat-treated chrome-molybdenum-manganese-carbon alloys for the best competi-tion cycles. Inexpensive frames are made ofstraight-gauge tubes formed from steel strip,rolled and electrically welded along the seams,and later welded to the other frame compo-nents. The best frames are made from seamlesstubes, drawn to be thinner in the middle than atthe ends, and silver-brazed into close-fitting ta-pered end sockets called lugs.As a result of commercial development in gen-
eral, and of aerospace activities in particular,many new materials and combinations of mate-rials are available. Some of these materials arebeing tried out for bicycle frames and compo-nents. Some show advantages over traditionalsteels, yet the lack of a clear understanding ofthe requirements of these materials may lead todisappointment and even danger. This chapterwill draw attention to the most important prop-

erties to be looked for in new materials and givesome guidance in their use for bicycle framesand for other components.
Factor of safety
Loading
All structures are designed to be stronger thanis strictly necessary in normal service. The ratiobetween the load that would cause a structureto fail and the normal load is called the factorof safety. Bicycles are built with large factors ofsafety. They are often used to carry grosslyoversized loads. Fairly standard bicycles areused in circus acts to carry five or ten people oreven more. A well-known advertisementshowed fifteen men carried by a commerciallyavailable bicycle. Yet bicycles fail. Spoke break-age is perhaps the most common failure. Alumi-num-alloy handlebars and stems all toofrequently break off. In some makes and modelsof bicycles there have been a series of failures ofthe front forks, with often unfortunateconsequences.
How can these failures be reconciled with thelarge factors of safety? There is ignorance abouttwo vital matters: how a bicycle will be loadedthroughout its life and how the pattern of load-ing may contribute to eventual failure.The bicycle designer cannot assume that all
users will treat their machines with care and at-tention at all times. Some will ride them up anddown curbs, possibly with friends sitting on thehandlebars, the crossbars, or the carrier. Someusers will be unable to avoid deep potholes inthe road. Some will bolt heavy toolboxes to theframe or to the carrier. The degree to whichthese practices constitute use or abuse has be-come generally recognized as being different fordifferent types of bicycle. At one extreme is theAmerican "cruiser," with its heavy construc-tion, large balloon tires, and single low gear,which is designed to be ridden at speed overcurbs and other hazards. At the other extreme isthe lightweight racing or track bicycle, which

241 Materials and stress
Strength of materials
will crumple under extraordinary stress andwhich runs on tubular tires (perhaps with silkreinforcement) intended to last just as long asthe race.
Under all these different conditions, the load-ing which most of the components of a bicycleexperience can be very complex. The tubes in aframe are usually loaded under a combinationof bending, shear, torsion, and tension orcompression. Appropriate sizes for these com-ponents have been arrived at by experience, notby analysis and prediction. Even with advancedcomputers it would be difficult and expensiveto analyze all the combined stresses in a bicycleframe and thereby to improve its design morethan marginally. Given this situation, the bestapproach to the use of new materials and newdifferent configurations is to compare them wiltthe strength and other characteristics of presentsuccessful designs.
The word "strength" must be interpreted verycarefully. One reason why a large factor ofsafety implies ignorance is that the wrong crite-rion of failure is often used. For instance, thefactor of safety is often based on the maximumstrength of the material—the "ultimate tensilestress" (UTS). Yet most failures occur not be-cause the material has been exposed to a stressgreater than the UTS (usually it can be demon-strated that the stress at failure is only a fractiorof the UTS), but because of "fatigue."
FatigueMetals, and other materials, "tire." We all knoin,that we can break a soft metal wire by bendingit so that it takes a "set" and then bending itback several times. A failure brought about bythis type of loading is called low-cycle fatigue.Materials also fail by being stressed many moretimes through much lower stresses, in so-calledhigh-cycle fatigue. By subjecting tens orhundreds of specimens of different materials to

Low-cyclefatigue
High-cyclefatigue
300,000
200,000
100,000
Figure 10.1Endurance limits ofvarious materials. (a–c)Composites: (a) Ke ylar 49and epoxy, boron andepoxy; (b) "S" glass andepoxy; (c) Graphite andepoxy. (d) 4130 Cr-Moalloy steel. (e) Titaniumalloy IM1318. (f)Aluminum alloy 7075T6.(g) Medium carbon steel.(h) Aluminum alloy2024T6. (i) Magnesium.Curves d and g areendurance limits forsteels.
cyclic stresses on special fatigue-testing ma-chines, starting at a high stress and graduallylowering it, curves similar to those in figure10.1 are obtained.A "touring" wheel can be expected to last
20,000 miles, about 15 million rotations. Thespokes should be in tension continuously, butthe tension will vary between a maximum and aminimum once per revolution. Many spokes willfail through fatigue well before experiencing 15million stress cycles, but spoke failures are inthe range of high-cycle fatigue. Most failures ofother bicycle components (such as brake cables,frames, and handlebars) are midway betweenlow-cycle and high-cycle fatigue, with stressesapplied tens of thousands rather than tens ofmillions of times.
1 0 2 o4 1 06 1 08
No. of cycles to failure

There is evidence in figure 10.1 of two crucialdifferences in the fatigue behaviors of differentmaterials.The fatigue curves for steels show falling per-
missible stresses as the number of loadingcycles increases, but eventually the curves ap-pear to flatten out. When they do, the stressreached is called the "fatigue limit" or the "en-durance limit." This means that if the designeruses a factor of safety to ensure that the stressesin a component never rise above that limit, itslife will be theoretically infinite no matter howmany stress reversals it is subjected to. Nonfer-rous metals like aluminum, titanium, and mag-nesium alloys and composite materials do notshow an endurance limit. The more stress rever-sals are imposed, the lower is the permissiblestress. (Some experts state that this is also thecase for steels, but that the fatigue-stress curveshave a very small slope.) Tables of materialproperties, for instance table 10.1, rather mis-leadingly show a fatigue-limit stress for nonfer-rous materials. In fact, this is usually the stressthat will allow 500 million stress reversals to bewithstood.The second important difference is that the fa-
tigue-limit stress is about half the ultimate ten-sile stress for steels, but may be as low as 16percent of the UTS for some composites (table
10.1). The UTS is, therefore, a poor guide tomaterial suitability. If the application will in-volve far fewer loadings than the fatigue-limitstress no matter how long the component isused, then the use of this stress (with a factor ofsafety) is acceptable. But there are many appli-cations where 500 million reversals, large
though this number seems, can be easily andquickly exceeded—for instance, when a compo-nent is vibrating at a fairly high frequency.Something vibrating at 3 kHz (3,000 cyclic re-versals per second) will experience 500 millionreversals in 50 hours.

Table 10.1 Properties of bicycle materials, compiled from various sources.
Modulus ofelasticity,E (GPa)
Ultimatetensilestrength(MPa)
0.2% proofstress atyield(MPa)
Elongationat failure( %)
Fatiguelimit/UTS(5 x 108
cycles)
Density
(Mg/m3)(specificgravity)
SteelsMedium-carbon 200 520 310 26 0.5 7.85CrMo (AISI 4130) 200 1,425 1,240 12 0.5 7.85
Aluminum alloys2024-T4 73.1 470 325 20 0.29 2.806061-T6 68.9 310 276 12 0.31 2.807075-T6 71.7 570 503 11 0.265 2.80
Magnesium 44 248 200 5-8 0.37 1.79
Titanium alloysIMI 125 (pure) 105-120 390-540 340 20-29 0.5 4.51IMI 318 105-120 -1,000 900 8 0.55 4.42
Composites'"S" glass-epoxy 90 3,750? 3,450 3.5? 0.16 2.63HT graphite-epoxy 221 3,600? 2,000 1.25 0.25? 1.75Boron-epoxy 250?b 1,200 ? ? 0.80? 1.90Boron-aluminum 165 1,025 ? 0.65 0.70 2.40Kevlar-49-resin 75 1,380 2.75 0.70 1.45Glass-nylon 2.3 59.9 59.9 14 ? 1.18(DuPont ZytelFE 8018 NC-10)
Woods (ash, beech, oak) 12 100 60 ? ? 0.67
a. Composite properties are lower (sometimes much lower) in compression and in tension in directions across the fiberalignment. Properties vary greatly depending on the materials used and on the mode of failure.b. Question mark indicates uncertain or scattered data.

245 Materials and stress
Figure 10.2Fatigue testing of bicycleframe. Rollersincorporate bumps;masses simulate riderloading. Rotating masseson cranks add cyclictwisting moment onframe, approximatingpedaling torques.Courtesy of RaleighIndustries, Inc.
The fact that handlebars, for instance, break
fairly often (D.G.W. has had three fail on con-ventional sports bicycles), and that they do so atfar fewer than 500 million reversals, shows thatthey have been poorly designed and that thebuilder probably had in mind the UTS ratherthan the fatigue stress. We conclude that, be-cause no important component of modern bicy-cles vibrates at high frequency, the use of thepublished fatigue limits is acceptable for non-ferrous as well as for ferrous materials, and fornonmetallic materials. We also emphasize thatthe fatigue-limit stress rather than the ultimatetensile stress should be used as a criterion ofacceptable strength.Samples of mass-produced bicycle frames, and
frames using new materials or constructionmethods, are subjected to fatigue tests such asthat illustrated in figure 10.2. The heavy-dutywheels (which are not being evaluated) run on
rollers incorporating bumps, which can, if de-

sired, be made to simulate cobbled streets.Masses on the seat post, on the crank ends, and
on the handlebar stem simulate rider loads. Afixed gear is used so that the spinning cranksimpose a fluctuating twisting load on the frame.The test shown in figure 10.2 is being per-formed on an experimental frame in which thethree main tubes are graphite composites withcompression-clamped lugs. Builders of specialhigh-quality frames cannot undertake the ex-pensive testing illustrated here, and it is impor-tant, therefore, that they adhere closely to well-established practice.
Increases in stress
Another reason why some "alloy" handlebarsbreak is that the manufacturers have not takeninto account the serious effect of suddenchanges of section on the local peak stress. Atthe point where the handlebar is clamped intothe stem, the bending moment from the forcesexerted by the rider's arms at the bar ends willbe at a maximum. If the clamp on the handlebarstem fits well, it will act as if the handlebar had
a sharp change in cross-section. This can multi-ply the already high stresses manyfold, by whatis known as a stress-concentration factor. Figure10.3 shows the stress-concentration factor forbending of a simple rod which has a sharpchange in diameter (taken from reference 1).The maximum stresses are affected more by theradius of curvature at the junction than by thediameter ratio of the section change.Changes of section should, therefore, be grad-
ual. High-quality frame lugs are tapered andfiled with decorative patterns to transfer thestress gradually from tube to lug and then to aconnecting tube. Likewise, high-quality frametubes are gradually tapered in wall thickness toprovide thicker walls at the ends, where thebending stresses are highest. Application of thesame principles to handlebars would greatly de-crease the danger of breakage. Two alternative
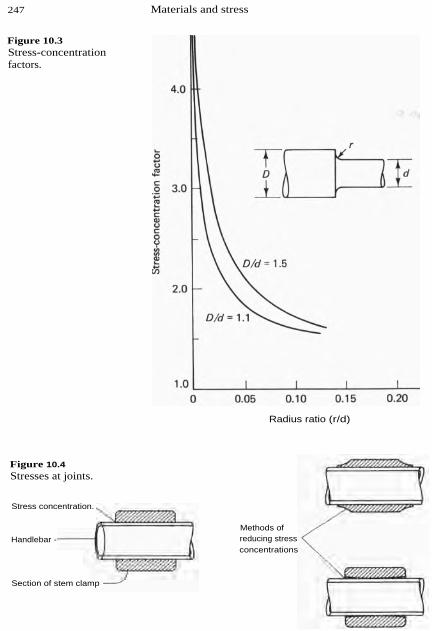
Figure 10.4
Stresses at joints.
Stress concentration.
Handlebar -
Section of stem clamp
Methods ofreducing stressconcentrations
247 Materials and stress
Figure 10.3Stress-concentrationfactors.
Radius ratio (r/d)

methods of greatly reducing a serious stressconcentration at the handlebar stem clamp areshown in figure 10.4.
Other materialproperties and criteriafor choice
Being strong enough is a necessary but not asufficient condition of suitability of a materialfor bicycle construction. Some other require-ments are these:
• The density of the material must be such thatthe resulting structure is light.
• The resulting structure should not be undulyflexible. (The property defining flexibility intable 10.1 is the elastic or Young's modulus,E.)
• The failure should be gradual rather thansudden. (One property that gives someindication of the failure mode is the elongationat failure, in table 10.1.)
• The cost must be reasonable.
• Joining one piece to another should bepossible without loss of strength in the parentmaterial(s) or in the joint.
• The material should intrinsically resist, orshould be easily protected from, corrosion.
The limiting fatigue strength, the elastic mod-ulus, and the density are probably the most im-portant physical properties for bicycle materials.Only a little less significant is the elongation atfailure. This is the permanent "set" a speciallymachined circular rod will take when it ispulled in a tensile-testing machine until the rodbreaks. A brittle material like glass has no elon-gation at failure; a soft material like lead willstretch considerably before failing.
YieldingLow- and medium-carbon steels (up to about0.2% carbon) exhibit the special characteristic ofyielding—stretching and then going on to takesomewhat higher stress before ultimate failure

Figure 10.5Yielding of steels.
249 Materials and stress
Strain, %
(figure 10.5). Yielding allows steel structures toaccommodate local high stresses, thus loweringthe stress locally and allowing other parts of thestructure to take up more of the load. This "for-giving" nature of steel has permitted thousandsof structures to be classified as successfulwhereas, if they had been made in a materialnot exhibiting yield, failures would have propa-gated from regions of high stress to the remain-ing components, which would have started atlow stress levels but then would have exceededtheir UTS.The yielding of a component is often visible,
especially in bending such as that of an over-stressed front fork. Obvious deformation or thecracking or flaking of enamel warn of highstresses and of possible incipient failure.
High-strength alloy steels, such as the newReynolds 753, do not have defined yield points.Therefore, rear forks made of these alloys can-not be given a "set" (a permanent deformation)to accommodate additional cogs, for instance.

The presence or absence of yielding in a mate-rial does not necessarily affect the nature of fa-tigue failures, which almost always occurwithout warning. (In components with very lowmean stresses, like mudguards or fenders, fa-tigue cracks may grow slowly through the mate-rial, giving ample warning. Unfortunately, thisbenign process cannot occur in componentswhere the mere initiation of a fatigue crack willincrease local and mean stresses to a level atwhich the crack will almost instantly spreadright across the section.) A series of disastrousfailures in the front forks above the fork crownof a certain make and type of bicycle weretraced to incorrect heat treatment coupled witha sharper-than-specified radius of curvature,which raised local stresses.Most fiber-composite materials fail suddenly,
whether at their ultimate stress or through fa-tigue failure. As stated in reference 2, "The sur-vived specimens do not show any strengthdegradation. This . . . indicates that the fatiguefailure is like a sudden death; that is, the fatiguefailure occurs without any visible evidence ofdamage."
Notch sensitivityHard or strong materials are often notch-sensi-tive in the way that glass is sensitive to ascratch. Glass is cut to size by making a smallscratch and applying a very small fraction of thenormal breaking load. Soft materials can also benotch-sensitive. It is common experience thatsome plastic films and some synthetic-rubberinner tubes will tear easily once a small cut hasbeen made, while other films of approximatelyequal strength and thickness will "heal" a cutand greatly resist tearing. Notch-sensitive mate-rials are not suitable for use in bicycle compo-nents, which are likely to be scratched innormal use.
Notch sensitivity can be measured in testingmachines in which a notched specimen is

struck by a swinging weight, the energy loss ofwhich is recorded. In metals, notch sensitivityis a function not only of the material but also ofthe heat treatment. A material that is not notch-sensitive is called "tough." Steels, aluminum al-loys, and fiber composities are normally verytough. Should the use of a new material be con-templated for use in a bicycle frame or compo-nents, its fracture toughness or notch sensitivityshould be compared with that of steel before de-velopment work is undertaken.
Joining propertiesThe ends of a frame member, where the bendingmoments are normally highest, are also thepoints at which the member must be joined toother members. The means for joining onemember to another must, therefore, be sufficientto take the loads involved and must not degradethe material properties. High-quality lightweightsteel frames use lightweight tubular angledsockets, called "lugs," into which the frametubes are brazed. Low-alloy-steel frames can bebrazed with regular brass or bronze brazing al-loy, but some high-strength materials requirethe use of silver-alloy brazing solders so that theheat-treatment temperature limit is not reached.Welding, used on the cheapest steel frames
and on most aluminum-alloy frames, melts asmall quantity of the material into the joint, ei-ther from a separate weld-metal rod or from theparent metal. All heat treatment in the weld re-gion is lost, and in addition the alloy constitu-ents will be somewhat uncertain. The shrinkageof the solidifying and cooling metal will intro-duce thermal stresses. Aluminum frames musttherefore be heat treated, first to relieve thesestresses and then to restore most of the originalproperties to the metal. Thick-walled tubes areused in welded steel frames so that stresses arelow and heat treatment is not necessary. Theability of steel to yield gives an additionalsafety factor.
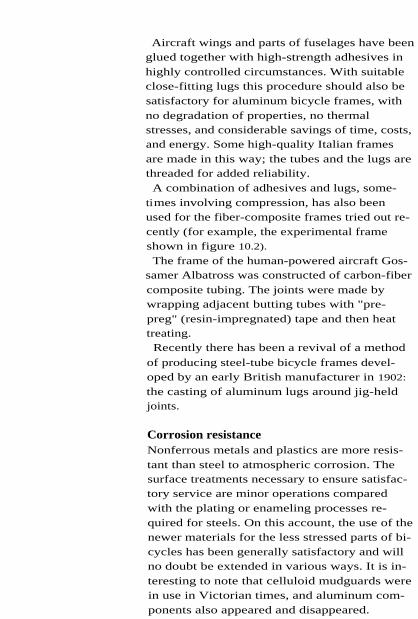
Aircraft wings and parts of fuselages have beenglued together with high-strength adhesives inhighly controlled circumstances. With suitableclose-fitting lugs this procedure should also besatisfactory for aluminum bicycle frames, withno degradation of properties, no thermalstresses, and considerable savings of time, costs,and energy. Some high-quality Italian framesare made in this way; the tubes and the lugs arethreaded for added reliability.A combination of adhesives and lugs, some-
times involving compression, has also beenused for the fiber-composite frames tried out re-cently (for example, the experimental frameshown in figure 10.2).
The frame of the human-powered aircraft Gos-samer Albatross was constructed of carbon-fibercomposite tubing. The joints were made bywrapping adjacent butting tubes with "pre-preg" (resin-impregnated) tape and then heattreating.Recently there has been a revival of a method
of producing steel-tube bicycle frames devel-oped by an early British manufacturer in 1902:
the casting of aluminum lugs around jig-heldjoints.
Corrosion resistanceNonferrous metals and plastics are more resis-tant than steel to atmospheric corrosion. Thesurface treatments necessary to ensure satisfac-tory service are minor operations comparedwith the plating or enameling processes re-quired for steels. On this account, the use of thenewer materials for the less stressed parts of bi-cycles has been generally satisfactory and willno doubt be extended in various ways. It is in-teresting to note that celluloid mudguards werein use in Victorian times, and aluminum com-ponents also appeared and disappeared.

253 Materials and stress
Steel versusaluminum alloys
CostCost was ignored in the above but it usually af-fects the choice of materials. At present, steel isthe least expensive material for making a bicy-cle. When the cost of manufacture is consid-ered, it is possible that high-strength plasticsmay win a place because of the automated pro-duction these materials allow.
From the foregoing discussion of material prop-erties it can be appreciated that the design ofthe major components of a bicycle, starting fromthe known (desired) configuration of the ma-chine and a fair knowledge of the applied loads,would be complex. However, we are fortunateto have examples of successful componentssuch as steel-tube diamond-pattern frames be-fore us, and we can simply compare with themthe size and mass of the same components pro-duced in alternative materials to give the sameperformance.Let us suppose that we wish to compare the
weight of an aluminum-alloy frame designed tohave the same strength and stiffness as a steelframe. Although we know that the loading of abicycle frame can be complex, we choose sim-ple bending as the loading method because itwill serve well when we are just comparing onematerial with another. Both frames will be con-structed from circular tubes. We will ignore forthe moment the question of joining the tubes.
Any standard engineering reference book, suchas reference 3 or 4, will give the stiffness (forceper unit deflection) of a cantilevered beam as
where E is the modulus of elasticity, I is thesection moment of inertia, and L is the length ofthe beam. For a circular tube,

where D is the outside diameter of the tubingand d is the inside diameter.For steel and aluminum tubes of the same
length to have the same stiffness, the productED' must be the same for both materials if thediameter ratio d/D is, at least for the moment,specified as identical for the two materials. Ta-
ble 10.1 shows that the modulus of elasticity ofaluminum alloy is about one-third that of steel.Thus, the tube diameter of the aluminum-alloyframe must be 3 1'4 = 1.316 times that of thesteel frame.Now we must ask this question: If the frame is
as stiff as the steel frame, will it be safe fromfatigue failure? The maximum stress in a circu-lar tube for a specified load and tube length isgiven by the relation
Therefore, the maximum stress in an aluminumframe of equal stiffness to a steel frame is1.316- 3 = 0.439 of the peak stress in a steelframe (again, for the same ratio of inside to out-side diameter).
The fatigue-limit stress in the strongest of thethree aluminum alloys listed in table 10.1 is
0.265 x 570 = 151 MPa.
The fatigue-limit stress in the steel-alloy frameis 0.5 x 1,425 = 712.5 MPa. Therefore, the relicof the fatigue-limit stresses is 0.212, which ismuch less than the ratio of peak stresses (0.439)and the aluminum-alloy frame will be muchmore highly stressed (perhaps dangerously so).
The weight of the two frames would be pro-portional to pD 2 , where p is the density:
Weight of alum.-alloy frame
Weight of steel-alloy frame

255 Materials and stress
Figure 10.6Klein road-racing bicyclewith aluminum-alloyframe. Courtesy of GaryKlein.
An alternative criterion is to design the alumi-num-alloy frame to have peak stresses that arethe same proportion of the fatigue-limit stressesas for the steel-alloy frame. Then,
The ratio of the weights of frames made fromthe two materials would be
Weight of alum.-alloy frame
Weight of steel-alloy frame
= —2.80
(1.677)L = 1.003.7.85
Therefore, fortuitously, the weights have turnedout to be virtually identical in the two frameswhen designed for the same proportional fa-tigue-limit stresses. The aluminum-alloy framewould, however, be much stiffer. (An alumi-num-alloy-frame road-racing bicycle is shown infigure 10.6). The designer therefore has somefreedom to trade off among stiffness, stress, and

weight by changing not only the tube diameter
but the ratio of inside to outside diameter. Atrack bicycle, to be exposed to few bumps andpotholes, could well be designed to an equal-stiffness criterion in aluminum rather than steel.It would seem unsafe to do so for touring bicy-
cles, which often are loaded with heavy bagsand travel on rough streets—ideal conditions forbuilding up fatigue damage.This illustration was meant to be just an exam-
ple of how to use material-property data in de-sign. The important principles are to usefatigue-stress limits rather than ultimate tensilestress, to consider stiffness as well as strength,and to take successful components as models ofstiffness and strength because of the great un-certainty in the actual magnitude, type, and fre-quency of loads.
Nonmetallic Fabricators in plastics, particularly, have latelycomponents made great advances toward producing machine
parts competitive with metal parts where quietrunning, low price, and light weight are impor-tant factors. If corrosion resistance mattersgreatly, as in chemical plants, nonmetallic partsmay have considerable advantages over metalones.
For most conditions of bicycle use, some plas-tic components show serious drawbacks whencompared with corresponding metal parts. Plas-tic bearings must be made with larger clear-ances than plain metal bearings; that is, the fitis "sloppier." Nylon 66, a hard plastic, is one ofthe most slippery materials from which to makea bearing, but its minimum coefficient of fric-tion of 0.04 shows a fourfold greater resistanceto movement compared with a reasonably goodball bearing's performance of 0.01. Several firmsnow make reinforced-plastic chains and rein-forced-rubber toothed belts. All need to belarger, and some heavier, than a modern steelchain. The chainwheels would be very wide(15-mm or *-inch teeth at least) and hence cum-

Figure 10.7Bicycle wheels of glass-reinforced nylon("Zytel"). Courtesy of E.I. du Pont de Nemoursand Co.
257 Materials and stress
bersome. Nylon derivatives are successfullyused for motorcycle rear-wheel sprockets, andcould perhaps be used for bicycle sprockets.However, it appears, because of the low strengthof the material compared with steel, that a ny-lon hub gear would be much bulkier than thestandard steel hub gear.Glass-reinforced nylon is being used commer-
cially for youth off-road bikes with apparentsuccess (figure 10.7). The higher weight andlower stiffness would not make such wheels at-tractive for racing. An experimental wheel wasmade at MIT by Kindler, who used a filament-winding technique to make the hub, spokes,and rim entirely from resin-soaked "Kevlar"(figure 10.8). 5 This high-modulus DuPont fiber(polyphenylene terephthalamide) has a strengthgreater than that of steel, and has to be regardedas promising for future bicycle construction.In 1955 the well-known cycle designer Cohen
expressed great enthusiasm for PTFE bearings.6

Figure 10.8Kindler's Kevlar wheel.From reference 5.
However, it has been found that the compressi-bility of that plastic causes a great deal of trou-ble. Plastics of various types have since beenused for bearings in children's cycles, and somecomplete parts (such as small pedal frames) ofplastic have been marketed. Children do notseem very concerned with easy running in theirbicycles and tricycles, and parents are not un-happy if their children are slowed down. How-ever, manufacturers appear to have realized the)adult cyclists will not accept plain bearings ofplastic (or the plain metal bearings recentlytried in pedals). There seems to be a consensusthat ball bearings are essential in an adult's ma-chine to ensure easy running and reasonablylong life without constant adjustment. (There isone exception: The lightly loaded "jockey pul-leys" in most derailleur gears have been pro-duced with plastic bearings by mostmanufacturers). No doubt the cyclists of the1870s through the 1890s were glad to see plainbearings go, and present-day veteran-cycle en-thusiasts will endorse that opinion.

259 Materials and stress
Alternative framematerials
Figure 10.9Bamboo-frame bicycle.From reference 7.
WoodsBicycles with wooden frames have been madeand ridden with satisfaction at regular intervalssince the earliest "hobby-horse" days around1800. The Macmillan rear-drive bicycle intro-duced in 1839 was followed by a large numberof "boneshaker" front-drivers from about 1860.In the 1870s metal construction became domi-nant, but there were regular resurgences ofwood frames (including some of bamboo) untilthe end of the century (see figure 10.9). TheStanley shows of this period included bicycleswith completely wooden wheels fitted withpneumatic tires; an early Columbia with suchwheels is on display at the Science Museum inLondon. Various wooden-framed bicycles datingback to the 1890s are still ridden by proud own-ers in veteran-cycle rallies.Although wood was used regularly up until
the 1930s for rims (for both sew-up and clinchertires), and wooden mudguards and seat pillarswere not unknown, the wooden frame did notappear again until the 1940s, when metal wasneeded for the war. However, wood becamescarcer than steel. An American wooden-framed

bicycle from the period is on show in the Wash-ington Museum.' A cane-framed bicycle ap-peared in Trieste in 1945; Wilde 8 thought it to
be a sound proposition and stated that it wasrigid enough to ride up hills.
Molded plasticsSince the recent advent of relatively large mold-ings in plastics (sometimes reinforced), therehave been several attempts (at least one of themfraudulent) to market molded bicycle frames. Asfigures 10.10-10.12 show, these frames can berather bulky-looking (more so than the bambooand other wooden-framed bicycles marketedover the years). The lack of popularity of thesemolded frames is due partly to this. Most werealso very flexible in comparison with steel-framed bicycles. As new polymers and polymer-fiber combinations are developed, plastic frameswill become less bulky, lighter, and stiffer.There are certainly advantages for generaleveryday use in a frame made of an inexpensivematerial that is completely resistant tocorrosion.
Plastic tubesThe bulky shape of the molded plastic framecan be avoided if the frame is constructed alongconventional lines, using tubes fitted into joints.Only recently have nonmetallic materials beenmade that, in tube form, could approach metalsif weight and bulk were taken into account.Such materials are plastics reinforced with car-bon or Kevlar fibers, which are now sold at rea-sonable prices and have higher tensile strengthsthan strong steels and high Young's (elasticity)modulus values. The fibers do not, however, ex-hibit one of the desirable properties of metals:They do not stretch appreciably before breaking.Also, the composite fiber structures have differ-ent properties "across the grain" than "with thegrain," and the fibers have to be embedded in aresin that is very weak by comparison, giving a
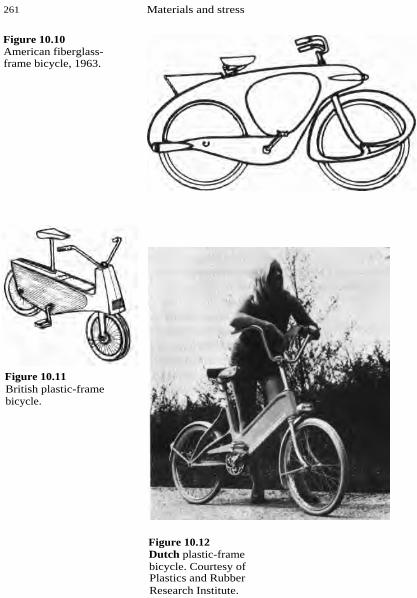
Figure 10.10American fiberglass-frame bicycle, 1963.
Figure 10.11British plastic-framebicycle.
261 Materials and stress
Figure 10.12Dutch plastic-framebicycle. Courtesy ofPlastics and RubberResearch Institute.

composite of varying properties, most much lessattractive than those of the fiber. Although theproperties of carbon and Kevlar fibers are wellknown, the properties of usable forms such astubes are not. In particular, the fatigue strengthof composite-fiber tubes has not been well docu.mented. In general, fiber-composite materialshave very poor compressive strengths (oftenone-tenth of the UTS) and poor shear strengths.However, according to one major manufacturer,a Grafil composite tube weighs less than a light-alloy tube of similar strength. The most unat-tractive feature of these tubes is that the jointshave to be in the form of clamps (see figure10.2). Adhesive joints are considered too weak,and any drilling and riveting is liable to causefailure without warning.
AluminumThe first innovations in nonferrous metals forframes occurred in the 1890s. Humber used alu-minum tubing with lugs, and a French manu-facturer introduced a "Lu-mi-num" bicycle ofcast alloy. The Beeston Humber frame was re-ported as very satisfactory, and it was said thatthe whole machine—with gear case, lamp, andtools—weighed only 27 lb (12.3 kg). 9 There areno easily available records about the Lu-mi-nunmachine, but a table of tests published in thejournal Engineering gave a strength comparisonwith a current steel frame. 1° This table showsthat the balance for ultimate strength was in fa-vor of the steel frame. The fatigue strength ofthe aluminum frame would presumably havebeen even more unfavorable.
Many other types of aluminum frames haveappeared on the market from Continental facto-ries. Because aluminum brazing was not prac-ticable, various designs of lugs were used togrip the tubes via corrugations or internal plugs(A design using threaded and glued lugs wasmentioned above.) The most recent clampingtype of lug can be seen on the Caminargent of

the 1930s, which used octagonal tubing. In ad-dition, various welded-joint frames have beenmarketed, in spite of the effects mentionedabove. The better examples have, of course,been heat-treated after welding, such as thehigh-quality Klein frame of figure 10.6.
NickelNickel tubing followed the use of aluminum inthe 1890s, no doubt in an attempt to produce arustless frame. The firm manufacturing theframes, however, existed for only a short whileduring the bicycle-boom period when cost wasof less importance. Nickel was and is more ex-pensive than steel, but it is strong and rigid andcan be welded satisfactorily. It is seldom usedin its pure form but is a major component, withchromium, of stainless and high-strength steels.
TitaniumThe history of aluminum bicycle frames is beinE
repeated in the case of the recent use of tita-nium. Less than a decade since the first com-mercial production of a once very costly metal,it is being thought of seriously for bicycleframes. Titanium in various alloy compositionsis now used for corrosion-resistant heavy engi-neering equipment, for the spars and skin ofhigh-speed aircraft, and for the disks and bladesof jet-engine compressors. Satisfactory weldingmethods using inert-gas shielding to avoid welddeterioration have been developed. For bicycleuse, titanium is corrosionproof.
Because titanium has a specific gravity abouthalf that of steel, it was possible for the firm ofPhillips to make of it a fairly conventionallyshaped bicycle frame weighing 2i lb (1.25 kg),displayed at the London Cycle Show in 1956.No models were offered for sale, but the pricewould have been high. In 1973 the SpeedwellGear Case Co. of Birmingham, England, pro-duced 10,000 frames with titanium tubing andsold them for about £130 or the equivalent. The

mass of the frame and fork was advertised as 31lb (1.7 kg).
MagnesiumThe only other metals likely to be consideredfor bicycle frames are magnesium and its alloys.They have an attractively low specific gravity ofabout 1.7, which to some extent compensatesfor the relatively low tensile strength, and forthe very low modulus of elasticity, which isone-fifth of that of steel. An alloy termed Eleck-tron was used fairly satisfactorily for making bi-cycle rims in the 1930s, but there have been nofurther applications in cycle manufacture.
Conclusions andspeculations
Although much experience has been accumu-lated in the manufacture of bicycle frames andaccessories in steel and aluminum alloy, and inthe production of low-stress parts such as mud-guards (fenders) in relatively well-known non-metallic materials, there are incentives to try outnew substances. The desired properties arelightness, corrosion resistance, low price, andthe possibility of making the frame in a singlepiece. There might be advantages in using unit-construction methods for metals which avoidmachining, such as lost-wax precision casting.We can expect improvements in frame design
and manufacture to give greater torsional stiff-ness. Such improvements would make accepta-ble a one-piece standard-type frame of plasticreinforced with carbon fiber. This could avoidthe use of bulky and weak joints and take fulladvantage of the strength of fibers.Efficient designs for a lightweight bicycle
wheel and frame were evolved by the 1870s.
The tension-wire-spoked suspension wheel andthe hollow-metal-membered brazed-joint framehad by then ousted all other designs. These de-signs were pioneered by the cycle industry andnot copied from some other branch of engineer-ing. This pioneering led to the establishment ofspecialized industries, such as steel-tube manu-

Figure 10.13Relative stiffnesses ofequal-weight tubeshapes. From R. A.Garrett, The ModernSafety Bicycle (London:Whittaker, 1899).
265 Materials and stress
facture, and in addition accelerated progress inthe ball-bearing industry; so, in a significantway, it helped to launch the aviation age.Engineering science and practical considera-
tions established the closed-section frame mem-ber, mostly of round or near-round section,assembled with rigid joints generally incorpo-rating lugs. (The stiffness of tubular sectionsrelative to round sections of the same mass perunit length is shown in figure 10.13.) There wasrapid rejection of the practice—common inother areas of structural engineering—of usingchannel-section members bolted at the joints.The optimum frame shape for a safety bicyclealso came early in the progress of the bicycleindustry in the form of the Humber pattern,now called the diamond frame. Before this stan-dardization came about in the 1890s there hadbeen a multitude of frame patterns, most con-structed of much more robust and heavier tub-ing than that desired in the 1890s when onlyreasonably light machines were acceptable.Some of these early frame designs appear nowa-days in children's machines or special machinesfor adult use, such as small-wheelers. Ovaltubes (figure 10.14) are being reintroduced foraerodynamic reasons.Evidence that the diamond frame is of near-op-
timum shape and thickness is given by the factthat track-racing and other bicycles can be builtthat weigh from to about 10 pounds (3-4.5kg) (see figures 10.15 and 10.16 and table 10.2).The steel-tubed frames of these machines arevery light indeed, showing that there is a goodapproach to a minimum of metal and hence agood placement of the members. It is interestingto compare the above weights with the weightof 81 pounds (3.85 kg) of a pair of pneumatic-tired roller skates of the type shown in figure10.17. These skates represent a high degree of"weight paring" for a wheeled human-propelledmachine, and yet complete bicycles have beenmade lighter.

Figure 10.14Bottom bracket ofRaleigh lightweightbicycle with oval tubing.Courtesy of T. I. Raleigh,Ltd.
Figure 10.15Raleigh Professionaltrack cycle, 1974.Courtesy of RaleighIndustries of America,Inc.
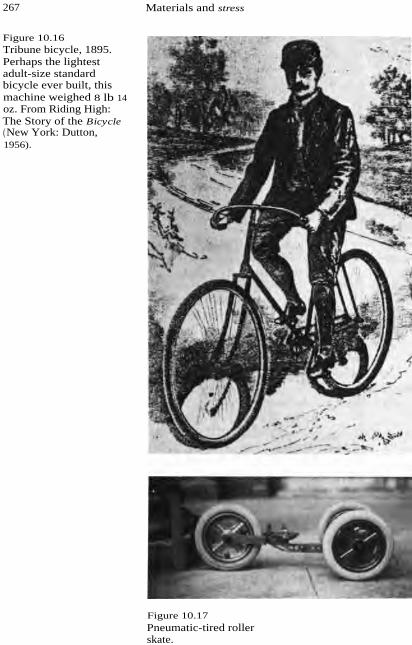
267 Materials and stress
Figure 10.16Tribune bicycle, 1895.Perhaps the lightestadult-size standardbicycle ever built, thismachine weighed 8 lb 14oz. From Riding High:The Story of the Bicycle(New York: Dutton,1956).
Figure 10.17Pneumatic-tired rollerskate.

268 Physics
Table 10.2 Lightweight bicycles with steel frames.
DateWeight,lbm Type Make
Materialof construction
1888 a 15½ Cross-frame safety,solid rubber tires
Demon Steel
1888 a 19 Diamond-frame safety,solid rubber tires
Referee Steel
1888' 11 High ordinary James Steel
1895 b 8i Diamond-frame safety,Pneumatic tires
Tribune Steel
1948' 81 Modern track bicycle Legnano Steel & Alloy
1949d 6 Modern track bicycle Rochet Steel & Alloy
Sources:a. Bicycling News, 8 February 1888.b. Riding high: The Story of the bicycle (New York: E. P. Dutton & Company,1956), p. 125.c. Cycling, 7 January 1948, p. 10.d. Cycling, 3 November 1949, p. 514.
Figure 10.18The Dursley-Pedersenluxury bicycle, circa1907.

Sharp gave many examples of the calculationof stresses in cycle frames for the more simplestatic loadings." It appears that the use of stan-dard modern lightweight strong steel tubing ofnear 22 gauge provides a safety factor above theyielding point of about 3 for distortion of thebracket through full-weight pedaling. The safetymargin for simple vertical loading on the saddlepillar is very large.Even after the diamond-framed safety bicycle
had become accepted as standard, other typeswere introduced for special purposes. A radicalexample is the Dursley-Pedersen luxury bicycle(figure 10.18), whose frame design, patented inthe U.K. in 1893, was triangulated so that tubu-lar members were supposed to be subjected tocompression stress only and other members (ca-bles) withstood tension only. (Some tubeswould, of course, have the twisting moment re-sulting from the rider's downward force on thepedals, the forces on the handlebars, and theroad reaction through the wheels, and sometubes would be in tension.) Light versionsweighed 14 lb (6.4 kg). 12 The hammock-styleseat was an admired feature of this advanced bi-cycle. 13 Dursley-Pedersen frames are currently(1981) being made in Denmark.An ingenious folding bicycle, also using tubes
in compression and stainless-steel cables in ten-sion, is the Hub and Axel "Pocket Bicycle"shown in figure 10.19. This is probably the mostrigid available folding machine.A very successful (but flexible) collapsible bi-
cycle is the Bickerton shown in figure 10.20,which is predominantly constructed of alumi-num alloys and has an open frame for ease infolding.The modern trend in open frame construction
was perhaps started by the Moulton. An attrac-tive selling feature is that this type of bicyclecan be used by either sex in any dress. Openframes must be made with a large main framemember if undue flexibility is to be avoided.

Figure 10.20Bickerton collapsiblebicycle.
Figure 10.19Foldable "pocket"bicycle. Courtesy of Huband Axel Bicycle Works.

When this is done, the resulting frame is heav-ier than a diamond frame of equal stiffness. Fre-quently this is not done, and a flexible frameprone to fatigue failure is the result.Wheels made from Du Pont Zytel and Kevlar
were mentioned briefly earlier and shown infigures 10.7 and 10.8. Most departures from thesteel-spoked wheel are made to reduce produc-tion cost rather than to improve function. It ap-pears that, as with the diamond frame,experience has evolved a very efficient designhaving a large margin of safety in ultimatestrength (though not in the fatigue strength ofthe spokes). Articles and arguments abound inbicycling publications concerning spoke-lacingmethods and such refinements as rounding thespoke holes in the wheel hub to avoid spokefailures from fatigue in bending (see, for in-stance, references 14 and 15). Very little scien-tific work has been published on spoked
wheels (although the stresses can becomplex 16 ' 17). This lack of scientific work maybe evidence of the few problems associated withthis mature design. Such a view is supported bya report in the magazine Design by L. BruceArcher, which occasioned the following com-mentary in Cycling:
Probably the strongest man-made structurerelative to its weight is the bicycle wheel. Mosthigh-performance racing wheels are hand-builtfrom factory-made components by craftsmenspecializing in this trade. The acceptedproportions closely conform to the theoreticaloptimum, but none of the builders and only afew of the component manufacturers haveinvestigated the matter very deeply. One of thefinest British sprinting wheels, weighing only 27
oz., was specially built by Montgomery Youngof Condor Cycles, and tested for Design by Dr.B. J. Zaczek, who reported that an axle load ofmore than 1,200 lbf was sustained before slightinelastic distortion occurred. This is more than

700 times the weight of the wheel. The tyre,inflated to 120 lbf per sq. inch, was compressedflat at the area of contact at an axle load of 400lbf, but ignoring this the wheel could safelysustain a working load of 700 lbf under smoothriding conditions. This gives the astonishingload/weight ratio for safe working of 400:1,which represents exceptionally high structuralefficiency.18
References 1. R. E. Peterson, Stress-Concentration Factors (NewYork: Wiley, 1974).
2. J. Awerbuch and H. T. Hahn, Fatigue and proof-testing of unidirectional graphite/epoxy composite, inFatigue of Filamentary Composite Materials (Philadel-phia: ASTM, 1977).
3. Mark's Standard Handbook for Mechanical Engi-neers, ed. T. Baumeister, eighth edition (New York:McGraw-Hill, 1978).
4. J. E. Shigley, Mechanical-Engineering Design, sec-ond edition (New York: McGraw-Hill, 1974).
5. D. J. Kindler, The Design of a Lightweight TensionWheel with Kevlar Fiber, B.S. thesis, MassachusettsInstitute of Technology, 1978.
6. I. Cohen, Polytetrafluoroethylene, Cycling (24March 1955): 301.
7. H. 0. Smith, Catalog of the Cycle Collection of theDivision of Engineering, bulletin 204, U.S. NationalMuseum (Washington, D.C.: Government Printing Of-fice, 1953).
8. J. Wilde, A cane bicycle from Trieste, Cycling (22December 1945): 420.
9. G. S. Wainwright, Aluminum cycles, CTC Gazette(July 1896): 311.
10. A. C. Davison, The Lu-mi-num frame, Cycling (19February 1941): 157.
11. A. Sharp, Bicycles and Tricycles (London: Long-mans, Green, 1896 / Cambridge, Mass: MIT Press,1977).
12. A Shortened History of the Bicycle (Nottingham:Raleigh Cycle Co., 1975).
13. D. E. Evans, The Ingenious Mr. Pedersen (Dursley,U.K.: Alan Sutton, 1979).

273 Materials and stress
Recommended reading
14. R. Blum, Avoid spoke and rim problems, LAWBulletin (January 1976): 3-5.
15. R. Jow, Wheels revisited, Bicycling (Emmaus, Pa.)(May 1978): 22,72.
16. A. J. S. Pippard and W. E. Francis. On the theoret-ical investigation of stresses in a radially spoked wirewheel under loads applied at the rim, PhilosophicalMagazine and Journal of Science (February 1931):234-285.
17. A. J. S. Pippard and J. White, The stresses in awire wheel with non-radial loads applied to the rim,Philosophical Magazine and Journal of Science (Au-gust 1932): 201-232.
18. L. B. Archer, A commentary on wheel design, Cy-cling xx (1956): 362.
F. DeLong, DeLong's Guide to Bicycles and Bicycling(Radnor, Pa.: Chilton, 1974).
F. R. Whitt, Alternatives to metal, Cycle Touring(June–July 1971): 138.
, Bicycles of the future, Cycle Touring (August–September 1967): 155-156.
11 Power transmission
A transmission is the connection between a ve-hicle's power source and the driving wheel(s).Its purpose is to transmit power with as littleloss as possible, and (in the case of bicycles) totransmit it in a way that enables the limbs tomove in as near-optimum a manner as possible.In this chapter we review the principles of alter-native means of power transmission in bicycles,we examine some examples, and we discusssome possible future developments.One starting point for this examination is our
knowledge of human power generation, whichis limited to the circular or linear foot and handmotions used in existing bicycles and ergome-ters. With the exception of the speed variationsgiven by elliptical chainwheels, the foot veloc-ity in rotary pedaling is a constant proportion ofthe wheel velocity. Therefore, although we mayhave hunches that there are other foot, hand, orbody motions (or combinations of these) thatwill enable humans to produce higher levels ofmaximum power (higher than the upper curvesof figures 2.4 and 2.10), or equal levels of powerat greater comfort, our scientific knowledge con-fines us to rotary or linear motions as inputs topower transmissions. For this reason we shallbe discussing, principally, rotary pedals andcranks and linear sliders.To start with, then, we shall limit ourselves to
discussing transmissions connecting rotarypedal motions to rotary wheel motions, typifiedby the familiar pedals and cranks. Let us firstmake a brief review of the historical develop-ment of transmissions to indicate how advancescame from perceived needs.The first "transmission" was linear; to ride a
Draisienne one pushed one's foot backward onthe ground to propel the vehicle forward. The

278 Mechanics and mechanisms
motion was similar to walking and running.However, in walking the legs act as spokes ofpartial wheels, with the body rolling over thefeet, being given both support and propulsion.The essence of von Drais's machine was that thelegs were relieved of the need to provide sup-port of the body weight, and could just givethrust. Some downward push was still neces-sary to provide enough friction, and possibly tomaintain balance.The next two developments were true trans-
missions that were approximately linear. LouisGompertz in 1821 added a sector-gear handdrive to the front wheel of a Draisienne. 1 Thiswas, no doubt, meant to supplement the footthrusts, as he provided no footrests. The rela-tively small amount of power deliverable by thearms, coupled with the need to steer, the evi-dent weight of the vehicle, the solid-rimmedwheels, and the poor road surfaces, must havedoomed this design to failure. We have no re-ports of its use.Kirkpatrick Macmillan's velocipede, developed
between 1839 and 1842, also used an approxi-mately linear drive, with the feet pushing for-ward on swinging levers (ref. 1). This was thefirst true transmission, and it enabled the riderto travel long distances with the feet off theground. Although Macmillan made the rear(driving) wheel larger than the front, it was onlyabout a meter in diameter, and it turned oncewith every back-and-forth movement of the feet,giving a low gear. However, this probablysuited the road conditions of the day. No threadof development followed from Macmillan's pi-oneering efforts.Michaux, the first successful developer of ro-
tary crank drive, attached the cranks directly tothe front wheel. This was a somewhat simplerarrangement than Macmillan's, and gave thefront wheel more freedom to steer, but thewheel diameter was close to that of Macmillan's

SPR AG-TYPEOVERUNNING CLUTCH
RATCHET ANDPAWL CLUTCH
ROLLERCLUTCH
Figure 11.1One-way clutches.
279 Power transmission
driving wheel and so a similar low gear was theresult.
Michaux was followed by imitators and devel-
opers, as Macmillan was not, and the drivingwheel was gradually increased in diameter toprovide a better coupling, or impedance match,between the human body and the machine. Thehigh-wheeler gave the first combination of acomfortable riding position and an easy rate ofpedaling on a two-wheeled vehicle.2This impedance match, or gear ratio, was pre-
served when chain drive was developed to theextent that a step-up drive between the (sepa-rate) cranks and the (rear) driving wheel couldbe used. The resulting "safety" bicycle was sosuccessful that it is still in essentials the stan-dard bicycle of today.Thus, by 1885 the principal requirements of a
bicycle transmission had been met: to provide afoot motion and a pedaling frequency wellsuited in average conditions to the capability ofthe human body to produce power, and totransmit this power from the body (in this casefrom the feet) to the driving wheel with as littleenergy loss as possible. The chain drive accom-plished both aspects superbly.Developments to cover nonaverage conditions
came fast. A simple approach to low-torque re-quirements—downhill travel or level runningwith a strong tailwind—was to fit a one-wayclutch or freewheel (figure 11.1) to the chaindrive, thus permitting coasting with the feet onthe pedals. This removed one possibility of
braking but also enabled the rider to "bail out"feet first if necessary.3In high-torque conditions, such as starting, hill
climbing, headwinds, or soft ground, riders hadto strain at the pedals, often standing on themand pulling up on the handlebars, while pedal-ing at a very low rate. Scientific testing (see fig-ure 2.18) has confirmed what was intuitivelyfelt: Such pedaling was inefficient. In thetwenty years following the introduction of the

The speed ratio is A perfect trans
mission, with an efficiency of 100 percent, hastherefore a torque ratio that is
280 Mechanics and mechanisms
chain-driven safety bicycle, many different gear-change mechanisms were developed to extendthe range of conditions in which a cyclist couldpedal efficiently. The two most successful types,the multispeed hub gear and the derailleur gear,have been developed to cover a wide range ofconditions and are the predominant types today.In the light of their success, it is perhaps sur-prising that at the present time there seems tobe more invention and development of variable-ratio transmissions using other approaches than
of any other aspects of the bicycle.So much development is going on that to ex-
amine more than a few prominent examples ofdifferent types would be beyond the bounds ofour discussion. Rather, we shall look at somefundamental principles and review alternative
possibilities, drawing conclusions wherewarranted.
Transmission Transmission efficiency, nt , is defined as the en-
efficiency
ergy output at the coupling to the driving wheeldivided by the energy input from the humanbody, usually via the feet. Either energy quan-tity is measured by the product of force and dis-tance. At a wheel or crank, this can also be
expressed as the product of a torque Tq (theforce times the radius from the center of rota-tion at which it acts) and the angle throughwhich it acts, 0 (measured in radians). Thus,
the inverse of the gear ratio. In practice, mean-ing with an efficiency of less than 100%, thetorque ratio is less than this value:

281 Power transmission
Nonpositive drives
Energy loss in a transmission can occur in twoways. One is friction in bearings and other com-ponents. This is the only form of loss in "posi-tive-drive" (chain and gear) transmissions. Theother is slip loss, which occurs in transmissionsin which the drive is not positive (such as thosethat use a smooth belt, or some other form offriction or "traction" drive, or an electrical orhydraulic coupling). From this categorization ofthe forms of energy loss, we can divide trans-missions into two broad types: those with andthose without positive drive.
It would be easy to dismiss the nonpositive-drive forms from further consideration, becausethe additional slip losses are a considerablepenalty for bicycle application. The chain driveof the first safety bicycles had to compete withthe direct wheel-mounted cranks of the high-wheelers, which had an efficiency of almost 100percent, and any great loss in the chain drivewould not have been tolerated. The best roller-chain drives appear to have an efficiency ofabout 98.5 percent, and the losses would, exceptin very close races, be imperceptible. But theslip loss of a V-belt, or a hydraulic coupling, orsome form of electrical coupling characterizedby a generator driving a motor, would multiplythese losses by between 5 and 10 unless verylarge, oversized transmissions were used. Theweight and volume of such transmissions woulcmake them unattractive.There is one possible exception to this almost
total elimination of all except positive-drivetransmissions: traction drives, or continuously-variable-ratio transmissions. 4 Some well-knowntypes are shown in figure 11.2. The reason thesemight deserve examination after they have beentried repeatedly and rejected over many yearsby the major automobile manufacturers is therecent discovery of lubricants that, under high-pressure contact between two hard surfaces,undergo a reversible change in viscosity such

Figure 11.2Traction drives.
Ring and cone
Toroidal
Ball and cone
282 Mechanics and mechanisms
that they can transmit a high shear force. 5 Itseems probable that these lubricants will extendthe range of usefulness of traction drives out-side the very specialized areas to which they arepresently confined. However, it is unlikely that
any will penetrate the human-powered-vehiclefield, because the bicycle requires a transmis-sion that can withstand relatively high torque atlow speed in providing a "step-up" speed ratio.Almost all industrial and commercial transmis-sions have the opposite characteristics in allthree respects: low (relative) torque, at highspeed, giving a step-down ratio. In fact, thetorque capability of a standard bicycle chaindrive would enable it to transmit 10-15 kW in

283 Power transmission
Positive drives
Figure 11.3Exploded view ofSturmey-Archer five-speed hub gear. Courtesyof T. I. Sturmey-Archer,Ltd.
an industrial drive (although not with an ac-ceptably long life). Traction drives are alreadymuch heavier than their industrial competitors.Therefore, even the use of the new lubricantsseems unlikely to overcome their inherent dis-advantages for application to bicycles.
Chains and toothed beltsThe steel roller chain (in which a freely rotatinglubricated roller surrounds each pin) can, to-gether with a front chainwheel and a rear-wheel
"cog" or sprocket, constitute a complete trans-mission. Or the rear sprocket may be attached toa one-way clutch or "freewheel," or to multi-ratio gears (usually enclosed in the rear-wheelhub and incorporating a one-way clutch, asshown in figure 11.3). Or an overlong chain canbe used with guiding-plus-tensioner sprockets
or "pulleys" that can force the chain to run onone of many in a nest or cluster of sprockets onthe wheel and on the chainwheel (figure 11.4).When new, clean, and well-lubricated, a chain
transmission is highly efficient (about 98.5 per-cent) and very strong (capable of taking thehigh tension force from a strong, heavy rider ex-

284 Mechanics and mechanisms
Figure 11.4Multiexposurephotograph of rearderailleur duringchanging sequence.Courtesy of ShimanoAmerican Corp.
Figure 11.5Roadster bicycle withgear case. Courtesy of T.I. Raleigh, Ltd.

Chain pitch greater Load carried bythan sprocket pitch /one or two teeth
Figure 11.6Tooth wear fromstretched chain.
285 Power transmission
erting maximum force on the pedals). Most bi-cycles in most parts of the world outside NorthAmerica and Britain have enclosed chains (so-called gear cases), and their transmissions stayin good condition, often for many years of harduse. (A "roadster" bicycle with enclosed chaindrive is shown in figure 11.5.) There is a cleartradeoff of increased weight for higher effi-
ciency, lower maintenance, and longer life. Un-fortunately in the opinion of many, chainenclosures have been given an effeminate image
in the United States and are no longer availableon standard bicycles. The result is that chains,which tend to be in the path of water thrown upby the front tire and of that carried over by therear tire, often operate in a mixture of oldgrease, sand and grit, and salt water. Wear israpid. It is seen as "stretch"; the chain becomeslonger, the pitch is slightly larger than that ofthe chainwheel and the rear cog(s), and thechain therefore tries to ride up the teeth at alarger-than-normal radius (figure 11.6). Insteadof the chain load being taken by several teeth,with a stretched chain almost all the load is car-ried by one tooth at a time, and this further in-
creases wear. A remarkable feature of chaindrives is that, even in these very poor condi-tions, they continue to operate, usually reliably,although the efficiency falls. (We do not knowby how much.)Even more rapid wear is experienced when the
chain is used in a multispeed derailleur trans-mission, for reasons given below. In this case,operation may become unreliable as the wornchain catches on the tips of the worn rear-wheelsprocket teeth and an extra link is periodicallycarried over, giving a slipping effect.
Let us look at ways in which chain drivescould be improved.A lightweight enclosure of stiff but resilient
plastic, such as high-density polyethylene, orpolypropylene, or Kevlar-reinforced polyester,should be produced to protect the chain and

286 Mechanics and mechanisms
any derailleur mechanism from dirt, water,snow, and sand.A smaller pitch (the pin-to-pin spacing) seems
desirable to reduce wear and to give a widerchoice of ratios. The reasoning is as follows:When a chain wears, it does not, strictly,stretch. No metal is taken even close to its yieldpoint. Rather, the pins wear in the direction ofthe applied force, and each chain bearing be-comes loose. It is this looseness that increasesthe chain's length.Mechanical wear is proportional to the product
of force and relative movement between twocomponents in contact. 6 Two links in a chainhave to undergo relative movement only whenthey "articulate" onto and off a sprocket. Theangle of articulation is equal to 360°/N, where Nis the number of teeth on the sprocket.' To ob-tain the gear ratios which the data of chapter 2confirm as being desirable, we do not havemuch freedom of choice for the chainwheel andsprocket diameters. If, however, we halved thechain pitch, from 12.5 mm to 6.25 mm, the an-gle of articulation of each link would be halved,and the wear would also be halved.The angle of articulation could be small
enough for sliding bearings to be dispensedwith in favor of flexing gimbal bearings or flex-ing links (figure 11.7). A smaller-pitch chainshould also be lighter, a factor worthy of con-sideration because the weight of a chain is rela-tively quite considerable on a lightweightbicycle. In 1909 the Coventry Cycle Chain Com-pany brought out the "Chainette," a small-pitch(8 mm) chain weighing 1.9 oz/ft (177 g/m),which when tested by Cycling was found to run"more like a silken cord" than a chain oversprockets. The British racing cyclist F. H. Grubbbroke road records on a bicycle fitted with thischain.Whether or not chains of smaller pitch were
used, friction and wear would be reduced inderailleur gears if "jockey pulleys" of larger di-
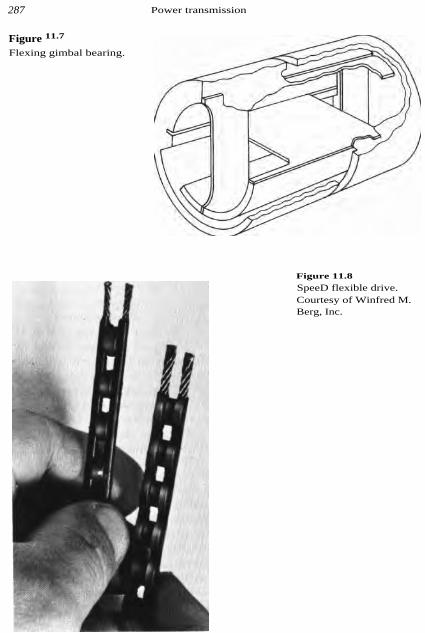
Figure 11.7
Flexing gimbal bearing.
287 Power transmission
Figure 11.8
SpeeD flexible drive.Courtesy of Winfred M.Berg, Inc.

288 Mechanics and mechanisms
ameter were used. Not only would the angle ofarticulation be decreased, but the rotation rateof the pulleys, which nowadays usually incor-porate plain plastic-to-steel (rather than ball)bearings, would be reduced in the inverse ratioof the increase in diameter.An attempt to produce a lightweight chain
with flexing articulation was made by the BergCompany. Stranded steel cables were used totake the chain tension, and nylon "buttons"took the place of the rollers in a steel chain (fig-ure 11.8). 8 This drive achieved brilliant suc-cesses and considerable weight savings in theGossamer Condor, Gossamer Albatross, andChrysalis human-powered airplanes. In this ap-plication the driving and driven sprockets wereseveral meters between centers, had rather smallstep-up ratios, and were at right angles to eachother. As yet there has been no successful appli-cation to bicycle transmissions because thesmall diameters of the rear-wheel sprocket andderailleur pulleys have led to fatigue failures ofthe metal cables (W. Berg, pers. comm.).
The fiber-reinforced toothed belts being usedto such a large extent as automobile camshaftdrives would seem to be good candidates, atleast for bicycles with hub gears. A first attemptto use one by D.G.W. was partially successful.The width required to handle the torque waslarge: 25 mm. The weight of the toothed beltwas much less than that of the chain it re-placed, and this more than compensated for theslightly increased weight of the fiberglass-rein-forced front sprocket, which was cast onto anexisting aluminum chainwheel (figure 11.9).
There was some slipping around the rearsprocket at high torque, but this could havebeen eliminated by a tensioner roller increasingthe angle of "wrap" around the rear sprocket.The drive was clean, needed no lubrication, andwas unaffected by water or salt. Toothed-beltdrives are now being used on Harley-Davidsonmotorcycles.

289 Power transmission
Figure 11.9Toothed-belt drive.
Rather than using several chainwheels and rear
sprockets of different diameters and requiringthe chain to transfer from one to another, thusintroducing misalignment of the chain with theplane of the sprockets, many designers haveproduced arrangements in which the effectivediameters of the chainwheel and/or the sprocketcan be changed. Two principal approaches areto use sprockets that are, or become, oval orpolygonal. F.R.W. has developed an expandingfront chainwheel that, at its smallest (lowestgear), is circular. As a higher gear ratio is calledfor, two halves of the chainwheel separate andproduce greater ovality for the higher gears (fig-ure 11.10). Others use clutched sprockets thatmove to larger radii along several radial arms

290 Mechanics and mechanisms
Figure 11.10Whitt's expanding ovalchainwheel.

291 Power transmission
Figure 11.11Cutaway view ofTokheim transmission,showing interaction of"Speedisc" and chain.Courtesy of TokheimCorporation.

292 Mechanics and mechanisms
Figure 11.12Hagen all-speed variable-diameter chainwheel.Courtesy of HagenInternational, Inc.

Figure 11.13Octo split-sprocket drive.Courtesy of Octo Co.
293 Power transmission
(figures 11.11-11.13). Although we know thatthe effects on human power output of some de-gree of ovality of the chainwheel are either neg-ligible or beneficial, we do not know the effectsof using polygonal chainwheels or sprockets.We expect these effects to be small. The Octodrive (figure 11.13) uses split sprockets thatslide into line with neighboring sprocket seg-ments. This and other similar transmissions al-low gear changes under full load. Thetransmission efficiency of such gears should beslightly higher than that of derailleurs, becausethey eliminate the small effects of chain misa-lignment. They promise somewhat easier gearchanging than with derailleurs (althought thereare now available several systems that greatly

294 Mechanics and mechanisms
facilitate derailleur chain shifting). The range ofdiameters is less, in general, than can be ob-tained with the wider-range derailleur gears. Anautomatically self-changing expanding-chain-wheel gear rather similar to that of figure 11.12has been made by Michael Deal of BristolUniversity.
Spur-gear systems
Although the word "gear" is used in severaldifferent ways in connection with bicycling, inmechanical engineering it refers to toothed spurgears that mesh directly with one another ratherthan via a chain or toothed belt.When a set of gears is designed to give a speed
(or torque) ratio between input and outputshafts, two alternative approaches are possible.In one, all the axes around which the individualgears rotate are fixed relative to the casing (fig-ure 11.14); in the other some of the gear axesthemselves rotate around a center (figure 11.15).The latter are called epicyclic gears. Virtuallyall bicycle spur-gear systems used at present areepicyclic, principally because of the compact ar-
Figure 11.14Fixed-axes gears. If thegear on shaft A has TAteeth and that on shaft Bhas TB teeth, then oneturn clockwise (+1) ofshaft A will turn shaft Bcounterclockwise—(TA/TB).

295 Power transmission
Figure 11.15Moving-axes (epicyclic)gears. Inputs and/oroutputs can be connectedto A, C, and D. In abicycle hub gear, A is ona stationary shaft. In thelow gear, the chain-sprocket input isconnected to C and theoutput (D) is connectedto the wheel hub. In topgear, these connectionsare reversed. The gear setis bypassed in middlegear, with the sprocketconnected via thefreewheel to the wheelhub.
rangement that is possible. Though at differenttimes gear-change systems have been developedto fit the bottom-bracket or crank position, thesehave tended to be large because they must with-stand the full cranking torque. In the rear-wheelhub, connected to the chainwheel by a conven-tional chain, the torque is reduced by the chain-wheel-to-sprocket ratio (usually about 3:1), sothat a hub gear can be designed to one-third thepeak torque of a bottom-bracket gear.The calculation of speed ratios is illustrated by
table 11.1. The design of any spur-gear trans-mission is highly specialized. Standard mechan-ical-design texts provide excellent guidance, butthey are usually written for industrial applica-tions, for which machines may sometimes beexpected to operate for 100,000 hours. A bicycle(or an automobile) has a relatively short operat-ing life (1,000-2,000 hours), and their transmis-sions were developed to their present compactsizes and configurations through early intenseefforts to reduce weight, volume, and cost.The Sturmey-Archer five-speed hub gear
shown in figure 11.3 incorporates two epicyclicgear sets. The five speeds are given by directdrive; by input to the "cages" of the "planets"of either gear set, with output from the appro-priate ring gears (in the step-up gears); and byinputs to the ring gears in turn with outputsfrom the plantetary cages. Ingenious systems of

Figure 11.16Efficiency of epicyclichub gears. Curves fromdata in reference 9;points determinedexperimentally by F.R.W.
296 Mechanics and mechanisms
Table 11.1 Calculation of ratios in an epicyclic gear set. Refer to figure 11.15.
Step A (shaft and pinion) B (gear) C (ring) D (cage)
Stop rotation of D;turn shaft A —1
—1 + (TA/TB ) + (T A /Tc) 0
Fix all gears relativeto each other androtate whole gear set
+1 +1 +1 +1
+1
Resulting ratio (add) 0 1 +TA/TB 1 +T A /Tc +1
If TA = TB, then the top-gear ratio is 1.333 and the low gear is 0.75 (becauseTc = T A + 2T 5 = 3TA).

297 Power transmission
Figure 11.17Pierce shaft-drive bicyclewith sprung rear wheel,1900. Courtesy ofSmithsonian Institution.
sliding "dog" clutches and one-way clutchesare used to give these changes with two cable-operated levers or chains, one from each end ofthe hollow main spindle. The original three-speed versions of these gears had reached vir-tually their present form by 1909 (when ball-bearing mounting of the planetary gears wasabandoned). The individual gears and many ofthe other components are now made by powdermetallurgy, which gives high accuracy withoutmachining.
The efficiency of epicyclic hub gears as mea-sured as a function of applied torque 9 is illus-trated in figure 11.16.
Shaft drivesSome early safety bicycles used shaft drive inplace of a chain, with a right-angle bevel-gearset at the crank and at the rear wheel (figure11.17). These drives had a neat, compact ap-pearance, but were heavier, less efficient, andmuch more expensive than chain drive.In the period around 1897, most American
manufacturers produced at least one shaft-drivemodel. Tests showed that the losses could be as

Figure 11.18Sprag clutch.
298 Mechanics and mechanisms
high as 8 percent, probably because the machin-ing of bevel gears was not very precise. TheWaltham Orient pattern using roller pins in-stead of machined teeth performed well, how-ever, and Major Taylor broke many recordsusing this transmission.
Linear and oscillating transmissionsAn early form of linear transmission is illus-trated in figure 2.16. When the pedal is pushedthere is no resistance until the pedal velocityhas caught up with the wheel velocity at thesetting of the gear-ratio adjustment on the ra-dius arm. For torque to be transmitted smoothlyat this point, it is essential that a one-wayclutch without backlash or overshoot be used.Such a device is the sprag clutch, which isshown in figure 11.18.
The linear or oscillating drive has attracted
many because it can give a continuously-varia-ble-ratio transmission, which is apparently wellmatched to a natural ladder-climbing action ofthe legs. However, above very low "pedaling"speeds the energy required to speed the legsand feet up to the speed of the wheel is a con-siderable loss. Muscle energy must also be usedwastefully to slow down the legs and feet at theend of the stroke. The Ball tricycle Dragon fly IIwith a single prone rider (Rick Byrne) and withhand-and-foot linear drive (figure 11.19)achieved 54.7 mph (24.4 m/sec) for secondplace in the 200-m flying-start IHPVA speedtrials in California in May 1980, showing thatthe losses could not have been large.Several methods of combining the advantages
of the oscillating drive and its wide choice ofgear ratios with an energy-conserving pedalingsystem have been developed. The most recent isthe Bio-Cam, shown in figure 2.17. In this casethe designer has considered that rotary pedalingmotion, which of course conserves kinetic en-ergy, is more ergonomically efficient than a lin-

299 Power transmission
Figure 11.19Steve Ball's linear hand-and-foot drive. Courtesyof Steve Ball.

300 Mechanics and mechanisms
ear motion. The cam on the crankshaft operatesa form of oscillating drive.
Conclusions
Hydrostatic driveHeavy earth-moving equipment, for example,often uses a type of transmission in which theinput runs a positive-displacement hydraulicpump and the high-pressure oil is piped to ahydraulic motor that drives the output shaft. Amajor advantage is that a type of variable-angle-swashplate axial-piston pump permits the out-put to be varied over a wide range from positiveto negative flow, giving a continuous variationof speed ratio. There have been many attemptsto apply this transmission to passenger automo-biles and to bicycles. An apparently insur-mountable problem is that the peak efficiency ofa hydraulic pump and a hydraulic motor isabout 90 percent, so the overall transmission ef-ficiency cannot be much over 80 percent. Thisis unacceptably low for a human-powerapplication.
The efficiencies of present transmissions usingchains and derailleurs or hub gears are in thehigh nineties, and any future improvementsmust be small. There is scope for weight reduc-tion, for protection against deterioration, and forsome input motions of the feet alone or of thefeet plus the hands that would allow a highermaximum power to be delivered than with ex-isting circular constant-velocity pedaling. It ispresumed that such an alternative input motioncould give similar power levels with greatercomfort.
1. A. Ritchie, King of the Road (Berkeley, Calif.: Ten-Speed, 1975).
2. A. Sharp, Bicycles and Tricycles (London: Long-mans, Green, 1896 / Cambridge, Mass.: MIT Press,1977).
3. V. Bury and G. L. Hillier (eds.), Cycling (London:Longmans, Green, 1887).
References
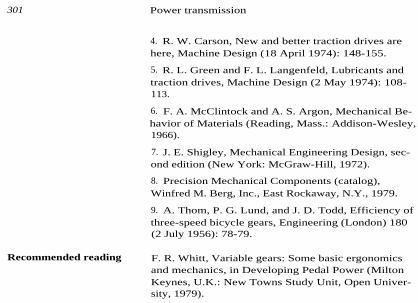
301 Power transmission
4. R. W. Carson, New and better traction drives arehere, Machine Design (18 April 1974): 148-155.
5. R. L. Green and F. L. Langenfeld, Lubricants andtraction drives, Machine Design (2 May 1974): 108-113.
6. F. A. McClintock and A. S. Argon, Mechanical Be-havior of Materials (Reading, Mass.: Addison-Wesley,1966).
7. J. E. Shigley, Mechanical Engineering Design, sec-ond edition (New York: McGraw-Hill, 1972).
8. Precision Mechanical Components (catalog),Winfred M. Berg, Inc., East Rockaway, N.Y., 1979.
9. A. Thom, P. G. Lund, and J. D. Todd, Efficiency ofthree-speed bicycle gears, Engineering (London) 180(2 July 1956): 78-79.
Recommended reading F. R. Whitt, Variable gears: Some basic ergonomicsand mechanics, in Developing Pedal Power (MiltonKeynes, U.K.: New Towns Study Unit, Open Univer-sity, 1979).

12 Unusual pedaled machines
Off-road vehicles As stated before, it is probable that widespreaddevelopment of better roads made the use of bi-cycles much more practical. The propulsivepower needed was then brought below that forwalking or running at comparable rates, and theencumbrance of a machine became justifiable.Although walking on soft ground requires twiceas much effort as walking on concrete, awheeled machine on soft ground experiencesabout a fiftyfold increase in resistance. Thus, onsoil the advantages of a wheeled machine over awalker are diminished.Most of the world's roads are made of bonded
earth, with relatively poor surfaces, and as aconsequence bicycling in general is under less-than-optimum conditions. The bicycles used onthese roads are somewhat different from thosenow used on good American and Europeanroads. Throughout the rest of the world—andparticularly where roads are poor—the 28-inch(about 700 mm) wheel with a tire about 1½inches (39 mm) in cross section is commonlyused. Big wheels with large tires have also pro-vided a partial solution for agricultural and mil-itary vehicles, which have to travel on poorsurfaces.In addition to attempting to solve the problems
associated with the use of vehicles on poorroads, inventors have tried to devise human-powered vehicles for other situations. Riding onwater, on railways, and in the air have beengoals of inventors ever since the practical bicy-cle appeared and demonstrated its speed ongood roads in the late nineteenth century. 1-
4 It
is probable that the bicycle's high efficiency un-der good conditions was taken mistakenly bymany inventors to imply that similar perfor-

303 Unusual machines
Boats
mances could be expected from human-poweredvehicles under very different conditions.
By building harder, smoother roads, mankindbecame able to use wheeled machines to greatadvantage in traveling with a minimum of ef-fort. However, it is not possible to duplicate thisachievement by producing smoother water. Theresistance to movement offered by a relativelydense and viscous medium such as water isgreat compared with that offered by air. As aconsequence, both submerged and floating ob-jects (such as swimmers and rowboats) cantravel at only a quarter of the speeds reachedwith similar efforts by their land counterparts(runners and bicyclists).Rather surprisingly, there has been no pattern
of progressive innovation in human-poweredwater vehicles since the development of themodern racing shell. The body is capable of giv-ing out most of its energy through the leg mus-cles, yet throughout history most human musclepower has been applied through the arms andback. Moreover, these muscles have usuallybeen worked at totally unsuitable rates of appli-cation. That is the case in the slow pushing orpulling of oars in a fixed-seat rowboat; arms arebetter suited to rapid cranking. The sliding-seatracing shell was, therefore, a majordevelopment.There are two principal differences between a
conventional rowboat and a racing shell. One isthe length-to-beam ratio, which in shells ismade as high as 50:1 to give minimum com-bined wave and skin-friction drag. The other isthat the rower's seat slides forward and aft, per-mitting the rower's energy to be delivered prin-cipally by the leg muscles instead of by thearms and back as in a rowboat.Rowing is not the most efficient propulsion
method. Reciprocating oars, sculls, and paddleswaste energy. The relative kinetic energy of theboat, the oars, and the rower or paddler are re-

304 Mechanics and mechanisms
versed every half-cycle by muscle energy. Dur-ing the return stroke, oars cause high winddrag. During much of their movement throughthe water oars dissipate energy into side thrust,which must be resisted by opposing oars or byrudders and fins, introducing more drag; theskilled canoeist's J-stroke produces similar ad-vantages and disadvantages. Rowing is alsosomewhat hazardous; if because of misjudgmentor an unexpected wave an oar comes out of thewater when the rower is pulling hard, orcatches the water unexpectedly during its re-turn, there is a risk of upset. And oars and pad-dles are inconvenient; one's hands are fullyoccupied while underway, so one cannot easilyhold a rudder or tiller, a fishing rod, or lunch.Most human-powered boats of all types have
been powered by oars and paddles, a few bypaddlewheels, even fewer by poling, and an al-most negligible number by screws. Reference 5,
among other publications, states that oars, pad-dlewheels, and screw propellers all have effi-ciencies of about 70 percent. However, thisstatement by itself is somewhat misleading forat least two reasons. One is that the efficiency itrefers to is that under design-point conditions.Under other conditions the efficiencies of pad-dlewheels and oars fall off more rapidly thanthat of propellers. In 1845, the British Admiraltystaged a tug of war between two ships of similardisplacement and installed power, one withtwin paddlewheels and the other (H.M.S. Rat-tler, designed and built by Isambard KingdomBrunel) with a screw. 6 The Rattler towed thepaddlewheel steamer astern at 2.5 knots. Therewas, therefore, no doubt about the superior effi-ciency of screws in low-speed high-power con-ditions. The second reason why the threealternative methods of propulsion are not equalin efficiency is that there have been substantialdevelopments in the fluid mechanics of propel-lers, both for air and for water. A design methodrecently refined by Larrabee 7 was used for the

305 Unusual machines
Figure 12.1Triplet water cycle.Courtesy of Currys, Ltd.
first human-powered English Channel flight, inthe MacCready team's Gossamer Albatross. Thepilot, Bryan Allen, reported that when the teamswitched to the Larrabee-designed propeller, hisendurance increased from a maximum of 10minutes to one limited mainly by the need toland to take on water and food. The propeller'sefficiency was estimated to be about 87 percent.Even without the modem improvements in
propeller efficiency, evidence of the superiorityof screws over oars is provided by reference l'saccount of the performances of water cycles intheir heyday of the 1890s. A triplet water cycle(figure 12.1) ridden by the former racing bicy-clist F. Cooper and two others covered 101miles (162.5 km) on the Thames from Oxford toPutney in 19 hours, 27 minutes, and 50 sec-onds. A triple-sculls boat rowed by good uni-versity oarsmen covered the same course in 22hours and 28 seconds. The water cycle was thefaster vehicle by about 18 percent.
Other facts about water cycles propelled bypedal-driven screws in this period are interest-ing. The English Channel was crossed (fromDover to Calais) by a tandem water cycle in 7+hours. A sextuple water cycle ridden by womenon the Seine is credited with reaching a speedof 15 mph (6.7 m/sec). "Hydrocycles" manufac-tured by L. U. Moulton of Michigan were saidto be capable of 10 mph (4.47 m/sec). All theseperformances compare favorably with those ofboats rowed by the best oarsmen.

306 Mechanics and mechanisms
Two applications of screw propulsion could beespecially appropriate and fruitful: utility useand sport. A utility boat is one used for ferryingto a boat out at mooring, or for a day's fishingon a harbor or a lake, or for fetching groceriesfor an island home from the mainland shore. Allof these duties used to be served by conven-tional rowboats, but nowadays many people useoutboard-engined boats, which consume gaso-line and oil and are often noisy, polluting, andunreliable. Only modest development is neededto produce an efficient outboard screw drivethat could be swiveled to provide high maneu-verability8 (figure 12.2). Figure 12.3 shows a de-sign for a high-speed sport or recreation boat. Inthe 1890s there were twin-hulled racers withtwo pedalers mounted centrally in conventionaltandem bicycling position. Brewster studied thisand two alternative configurations: 9 one with asingle submerged low-drag hull for most of thebuoyancy and outrigger pontoons for stability,and one with hydrofoils. On paper the hydrofoilboat is the faster design, able to attain 10 mph(4.5 m/sec) with a power input of about 200watts (figure 12.4). Atheletes such as racingcyclists capable of producing 375 watts for anhour or more could, if the analysis is correct,propel the design to over 17 mph (7.5 m/sec)."Amphibious" machines have been con-
structed and ridden. These had floats arrangedso that when the machine was ridden on landthey did not obstruct its movement (refs. 2, 3).Data on the drag of hulls, submerged bodies,
and foils are given in reference 10. An approxi-mate relation among power, area of wetted sur-face, and speed of streamlined hulls is
hp = 2.4 x 10- 5 x Wetted surface (ft2)x knots'',
Or
watts = 1.287 X Wetted surface (m2)x (m/sec) 2 86.

Figure 12.2Robert Emerson'spedaled outboard boatdrive.
307 Unusual machines
Figure 12.3Design for high-speedhuman-powered boat.

Figure 12.4Power requirements forpropulsion of high-speedboats. Adapted fromreference 9.
308 Mechanics and mechanisms
m/sec
Further development of human-powered boats
is likely to come from the incentives of amateurcompetition. The IHPVA started a water-craftdivision in 1981. Improvements as dramatic asthose with road and track vehicles can be ex-pected. The Texas Water Safari, a race of over400 miles in a range of different water condi-tions, has an "unlimited" class and will alsospawn useful developments in human-poweredboats.
Ice and snow There have been attempts to develop and popu.machines larize bicycle-type machines for running on ice
or snow (ref. 3). Some types consist of a bicychwith a ski replacing the front wheel; others dis-pense with wheels and retain only the bicycleframe, with a ski attached on either side. Incontrast with the case of water cycles, therehave been no published comparisons of thespeeds of these machines with those of skaters
or skiers.
The coefficient of rolling resistance of a steel
wheel running on a steel rail is in the range ofone-tenth of that of the best of pneumatic-tiredwheels running under optimum conditions of
Railway cycles

Figure 12.5Early railway cycle.Courtesy of Currys, Ltd.
309 Unusual machines
road use. As a consequence, cycles developedfor running on rails have been proved practicalin the sense that they were not difficult to pro-pel. In fact, high speeds are credited to this typeof machine. An illustration of one type is givenin figure 12.5 (see also references 2-4). A sim-pler approach was used by Bob Delgatty of Vic-toria, B.C., who joined two standardindependently ridden bicycles together with atubular structure. In this case the regular pneu-matic tires run on the railheads, and sidewheels maintain lateral direction. Steering is,therefore, not required, and Delgatty reports de-light in being able to photograph and to enjoy
the view freely while pedaling. Other designsare shown in reference 11.A drawback to railway cycles was the general
unavailability of unused lines. The Victorianstook quite seriously the idea of laying specialcycle tracks alongside the regular rail tracks insome areas. With the abandonment of manybranch lines, there have been calls to preserve
them for this kind of recreational use.
Aircraft There have been attempts, both serious andmaniacal, at unaided human-powered flightsince at least 1400 B.C. Da Vinci pursued thisdream in many sketches, but it proved elusive.Only two celebrated aircraft designed and built

310 Mechanics and mechanisms
by a group led by Paul MacCready of Aero-Vironment, Inc., in Pasadena, California, haveachieved great success, winning prizes totaling£150,000. The purse was proffered in two chal-lenging contests by Henry Kremer, a British in-dustrialist. In 1959 he offered £5,000 (about$20,000 at the time) to the first group to fly ahuman-powered aircraft at least 10 feet from theground through a figure-eight course aroundtwo pylons placed a half-mile apart; he laterraised the prize to £50,000. Team after teamproduced planes that could fly in straight linesand make small banking curves, but failed tonegotiate the course. In 1977 MacCready's Gos-samer Condor succeeded for three reasons: be-cause it incorporated sophisticatedaerodynamics (as did many of the others); be-cause it was designed to cruise at only 9 mph(3.6 m/sec) and thus required less power thanmany of its competitors, most of which were de-signed for 13-20 mph (6-9 m/sec); and because
the airframe had been designed to be rebuilt ina matter of hours or even minutes after a crash.By rigorously testing each version of the design,analyzing errors, and rebuilding quickly, Mac-Cready's group was able to accomplish in oneyear what others had failed to do for 18 years."Henry Kremer then put up £100,000 ($180,000)
for a human-powered flight over the EnglishChannel. This time the prize went unwon forbarely one year. In June 1979 MacCready's Gos-samer Albatross (figure 12.6), weighing under
60 lb, went the distance on its first attempt,with Bryan Allen again serving as pilot andpower plant. Allen produced about j hp (250 W)for about 3 hours, whereas Bleriot's monoplanemade the first flight over the Channel in 36
minutes using a 25-hp (19-kW) engine.The maximum wind speed in which such an
airplane can be flown is only around 2-4 mph(1-2 m/sec)—practically a dead calm—becauseground-level air turbulence has vertical compo-nents approaching wind speed. A modest gust

311 Unusual machines
Figure 12.6The Gossamer Albatross.Courtesy of E. I. du Pontde Nemours Co.
of 9-11 mph may severely damage a flimsy,low-speed aircraft even if it is held down andnot allowed to become a kite, which it wouldwant to do. Such periods of calm typically oc-cur only for an hour or two near dawn on very
still days. As a result these aircraft cannot safelygo far from their large and expensive hangars,in which they must spend most of their time.There will be small improvements in human-
powered heavier-than-air flight, but because ofphysical constraints such flight must be limitedto the areas of sport and recreation. Improve-ments will be slow in coming because physicallimits are being approached. For example, atunder 60 lb (27 kg) the Gossamer Albatross isalready a fraction of the weight of the pilot, andfurther weight reductions will not bring propor-
tional benefits.For the present, human-powered flight must be
regarded as an expensive prospect with great
limitations. But improvements and innovationscould change that. Foldable planes might elimi-nate hangar costs. Some lift from helium, hot

Lawn mowers
Figure 12.7Diagrams of theShakespear pedaledmower. From reference14.
312 Mechanics and mechanisms
air, or possibly hydrogen would reduce the re-quired lifting power and allow more power tobe devoted to propulsion. An inflatable airplaneis a possibility. Furthermore, the low gravity oflarge space colonies, say one-sixth to one-tenththat of earth's, could make high-speed human-powered transportation in the air practicablethere.13
The rationale behind the design of the mowershown in figures 12.7 and 12.8 was that the legmuscles would be used more efficiently in ped-aling than in pushing a conventional mower,and the back and arm muscles would be re-lieved; that continuous mowing would be more
efficient than the frequently used to-and-fro mo-tion of push mowing; that a multiratio gearwould enable users to choose the power-output

313 Unusual machines
Figure 12.8Michael Shakespear onhis mower.
rate and make it easier to mow on moderate
slopes; that gasoline shortages and antinoiseregulations might limit the use of power mow-ers; and that riding a pedaled mower might befun as well as good exercise.The original model shown in the figures was
designed and constructed by Michael Shake-spear of the Massachusetts Institute of Technol-ogy for his bachelor's thesis in mechanical
engineering. 14 A three-speed Sturmey-Archerhub gear, a brake, and a differential are incorpo-rated into the transmission. The reel-type cutteris driven directly from the input to the differen-tial drive to the rear wheels. Pulling the lefthandlebar lever releases a catch and makes itpossible to raise the cutter assembly by pullingthe handlebars back; this allows easy maneuver-ing. The prototype, built largely of scrap materi-als and components, was very heavy but stillgave easy cutting. A lightweight model might

314 Mechanics and mechanisms
Figure 12.9Human-powered"satellite" mower.

315 Unusual machines
show real advantages. A more sophisticated ap-proach that would reduce the large energylosses of wheels on soft ground would be tohave a stationary power unit and a "satellite"cutting mechanism (see figure 12.9 and refer-
ence 11).
Energy-storage The concept of storing braking or downhill en-
bicycles ergy (or even energy pedaled into the machinewhile the rider waits at a traffic light), and thendrawing on the stored energy for a burst ofpower to accelerate or to climb a hill, has in-trigued inventors for many years. In every bi-cyclist there is a suppressed desire to leavesports cars standing in a cloud of rubber smoke.Sad to say, the chances are small.Table 12.1 gives the maximum energy-storage
capabilities of various systems. 15 Flywheels areso much better than rubber bands or springsthat they would be the preferred contenders,and they have many enthusiasts." (City buses
driven by flywheels were manufactured bySulzer in Switzerland; the flywheels were spedup by electric motors at stops. This system isbeing given much new attention.)Com paredwith the energy-storage capability of gasoline,however, a flywheel is almost 100 times heavier.Also, a flywheel needs a
continuously-variable ratio transmission if its kinetic energy is to betransferred efficiently to the driving wheel. Andthe "windage" losses constantly degrade thestored energy. All these factors mean highweights and high losses, neither welco me inbicycling.
Batteries are better as far as the weight of theenergy storage alone is concerned, but then amotor, a control system, and a transmission arerequired. At least 0.5 hp (400 W) would be de-sirable, and a minimum weight for a specialmotor and transmission might be 10 lb (4 kg).The battery and its housing would be another10 lb. (Extremely expensive aerospace–typecomponents would be required to keep weights

Table 12.1 Energy-storage data.
Maximum energy-storage capability
Material
of various materials
Electrochemicalconversions Heat-engine conversion'
Mechanicalconversion
W-hr/lbm kJ/kg W-hr/lbm kJ/kg W-hr/lbm kJ/kg
Hydrogenc 14,900 118,250 3,040 24,130
Gasoline' 5,850 46,430 1,130 8,970Methanolc 2,760 21,900 505 4,010
Ammonia c 2,520 20,000 503 4,000
Hydrogen-oxygen (liquid) 1,660 13,175 338 2,680
Lithium-chlorine (700°C) 980 7,780
Magnesium-oxygen d 1,800 14,290
Sodium-oxygen d 775 6,150
Zinc-oxygend 500 3,970
Sodium-sulfur (300°C) 385 3,060
Lithium-copper-fluoride
Zinc-silver dioxide
746
208
5,920
(silver-zinc-battery) 1,650
Lead-lead dioxide 85(lead-acid battery) 675
Cooling lithium hydride 64 508
Flywheel 14 111
Compressed gas and container10 79
Rubber bands1 8
0.06 0.5Springs
0.006 0.05Capacitors

Energy density
Low High
System kWh/ft3 kWh/m3 kWh/ft3 kWh/m3
Electrostatic 0.0045 0.16
Magnetic 0.0007 0.025 0.06 2.1
Gravitational 0.006 0.21 0.15 5.3
Mechanical 0.0007 0.025 0.6 21.2
Phase change 0.007 0.25 75. 2,650
Primary battery 0.15 5.3 7.5 265
Secondary battery 0.45 15.9 1.5 53
Fuel cell 0.75 26.5 75. 2,650
Fuel 300. 10,590
Source: reference 15, p. 54.a. Based on Gibbs free energyb. Assumes 20 percent thermal efficiencyc. Reaction with oxygen from atmosphered. Including weight of oxygen

Figure 12.10Thompson flywheelbicycle.
318 Mechanics and mechanisms
down to these levels.) A lightweight bicyclewould about double its weight, and the ridermight well think about going a step farther to amotorcycle (maybe even a battery-powered one).These conclusions have been given some
weight by a study performed by students atDartmouth College. 17 They adopted specifica-tions that included a price of fifty 1962 dollars,a weight of 30 lb (13.6 kg), and a power outputsufficient to propel the rider and the machineup a hill 2,120 ft (645 m) long and 90 ft(27.4 m) high. Four systems were studied: aspring, a flywheel, electrical storage, and hy-draulic storage. It was decided that there was nospring system that could be described as practi-cal. The hydraulic system would have cost$1,500 and would have been heavy because itwould have had to work at extremely high pres-sures. The mechanical flywheel system consid-ered would have been suitable if it incorporatedtwo 35-lb (15.9-kg) flywheels revolving at 4,800rpm; these characteristics made the concept tooexpensive. The electrical system, consisting of amotor-generator and an electricity accumulator,would have had a price of $74, an overall effi-ciency of 34 percent, and a weight of 40 lb (18.1kg). This is much nearer to the specification.However, the low efficiency and the highweight and cost made the concept veryunattractive.

Figure 12.11Flywheel system forracing bicycle.
319 Unusual machines
Cyclecars
For a flywheel to have the maximum energy-storage capability per unit mass, the rim mustbe moving at the highest velocity that stressconsiderations will allow. For this reason, theapproach used in the Thompson flywheel bicy-cles (figure 12.10) is not valid. The geared-upsystem of figure 12.11 is a little better, but stillunattractive. Recent developments incorporatingflywheels of composite materials rotating in avacuum with sophisticated electrically modu-lated transmissions cannot yet be considered forbicycles.For further discussions of energy storage, in-
cluding earlier attempts, see references 3 and18.
We are using this term to distinguish three- andfour-wheeled pedaled vehicles with automobile-like bodies from the bodyless tricycles andquadracycles that followed more traditional bi-cycle-construction practice from 1880 on. Therehave been such a large number and a wide vari-ety of cyclecars made in many countries that allwe can do here is to refer briefly to those webelieve to be the most worthy of note.
We mentioned in chapter 1 that the Velocar recumbent bicycle was named after a similarlypropelled cyclecar. Cyclecar racing had becomepopular in the 1920s, particularly in Germany.The principal proponent was Manfred Curry,principally known for his research and his texton fast sailboats. He designed and made theLandskiff ("land boat") (figure 12.12), known inthe English-speaking countries as a Rowmobilebecause the driver used the same motions as inrowing a sliding-seat shell. (A similar principlehad been used by George W. Lee in the UnitedStates for a tricycle probably constructed in the1870s; see figure 12.13.) The Curry machineswere used for racing and for commuting, and(according to a 1930 catalog for the "new im-proved model" made by Alexander Metz ofMunich 19) weighed 35 kg in the single-rider

320 Mechanics and mechanisms
Figure 12.12Curry Landskiff (1930)for driver and passenger.
Figure 12.13Rowing-action tricycle.

321 Unusual machines
Figure 12.14Diagram from "How tobuild a rowmobile,"Science and Invention(August 1926).
version and 45 kg for the tandem machine.They were well streamlined, and were reputedto reach 30 mph (13.5 m/sec) on smooth, levelsurfaces. Instructions on building a rowmobile(figure 12.14) appeared in several mechanics'magazines in the 1920s and 1930s.20,21Several "people-powered vehicles" appeared
in the United States in the early 1970s, and one(figure 12.15) was commercially produced innumbers. Although they caught the imaginationof newspeople, they did not displace either au-tomobiles or bicycles on the highways or, to anygreat extent, tricycles in retirement communi-ties. Some of the reasons for this lack of successare discussed in the next chapter.A compromise between the almost totally en-
closed cyclecars with their rigid bodies and thecompletely open standard tricycles was therange of "all-weather cycles" designed in the1970s by Paul Schondorf in Cologne. The "EasyMuscar" shown in figure 12.16 retains the stan-dard tricycle's virtues of easy access, comfort,
luggage-carrying ability, and some weather pro-tection without a large weight or size penalty.

322 Mechanics and mechanisms
Figure 12.15PPV ("people-poweredvehicle").
Figure 12.16Schondorf's "easyMuscar" tricycle.

323 Unusual machines
Human-powered Where the automobile is economically out ofvehicles in the Third reach for most people—over much of Africa andWorld
Asia and some of Europe—the bicycle stillreigns supreme. The Viet Cong were suppliedby trains of bicycles, and when D.G.W. lived in
Nigeria in the late 1950s a bicycle was a highlyprized possession, often taking precedence overa wife (whose purchase price was often compar-able). Bicycles are the mass-transit system inmuch of the Third World. Pedal-powered vehi-
cles are also used as short-distance taxis andfreight carriers. Considerable ingenuity is oftenused to adapt bicycle components to three- andfour-wheeled vehicles, although there is littletechnical sophistication.In African countries, bicycles are used for both
personal and freight transportation. Goods (forinstance, two or three mattresses) will often becarried on the head, gracefully balanced. In Ni-geria in 1958-1960, the almost universal ma-chine was the 28-inch-wheel Raleigh three-speed with a gear case around the chain. Oftenthe shift trigger was bound permanently to thehandlebar with copper wire in the low-gear po-sition. Mirrors were fixed in the middle of thehandlebar to check on the rider's appearancerather than to view traffic coming from the rear.Bicycles arrived from Raleigh with the framesspiral-wrapped in brown paper, and a vigorousrewrapping industry arose to serve those whowanted to maintain the new-bicycle appearance.These observations are made not so much to becondescending as to point out that in an early
stage of development, people of any countrywill use Western technology in an unquestion-ing and distinctive manner.In India and most of Asia, three-wheeled vehi-
cles are used widely. Reference 22 points outthat there are three basic load-carryingdesigns—driver in front, driver behind, andsidecar:

324 Mechanics and mechanisms
In the driver-in-front tricycle, steering remainsas on a regular bicycle, with power transmitted
via a long chain to the two rear wheels. Thedriver-in-rear configuration features two frontwheels, with power supplied to a single rearwheel. Steering is accomplished by turning theentire front compartment.Each design has its own advantages and
disadvantages. The driver-in-front design, usedmostly in India, is lighter and easier to pedaland steer. However, side-car and driver-in-reardesigns, found in Indonesia, Malaysia, andVietnam, can carry heavier loads, becausepower is transmitted more directly.
(It is not clear what is meant by "moredirectly," but it is probably that usually no dif-
ferential is used and that when two wheels areat the rear only one is driven.) Only rarely arehub gears used, and the single gear ratio ischosen as a compromise to allow heavy loads(perhaps 330 lb, or 150 kg) to be started fromrest and taken up gentle inclines while permit-ting cruising speeds of about 4-7 mph (2-3
m/sec). There is little attempt to save weight;when heavy loads are being transported, anysaving in frame weight that might lead to earlyfailure is a poor tradeoff. According to a per-sonal communication to D.G.W. from M. M. Ne-gru of Kerala, South India,
. . . the drivers are hard on the cycles since they
are rented rather than owned; the machine mustbe able to stand this. The roads are cloggedwith trucks, buses, cars, scooters, buffalo,bullock carts, goats, pigs, assorted pedestrians,ordinary bicycles and the odd temple elephant.With such a mix of speeds, traffic is chaotic and
the bicycle rickshaw must be at least asmanoeuvrable as current models; fast swerves
average two per km....
Negru also states that these rickshaws "areclumsy inefficiently designed contrivances,

325 Unusual machines
Figure 12.17Oxtrike. Courtesy of S. S.Wilson.
which are losing their passengers to the faster,more comfortable 'autorickshaws' (a golf-cart-type affair with a scooter motor carrying threeor four persons including the driver)." He callsfor improved designs of human-poweredvehicles.Groups such as the Intermediate Technology
Development Group (U.K.) and Volunteers InTechnical Assistance (U.S.) have tried to infusesome new technology. In particular, S. S. Wil-son of Oxford University, with the support ofthe relief agency Oxfam, has developed the
load-carrying Oxtrike (figure 12.17), which ismade from simple components and suitable forindigenous manufacture but incorporates athree-speed gear. In reference 11 S. S. Wilsongives details of the construction of the Oxtrikeand of other human-powered devices. (That ref-erence also contains a wide variety of other pe-dal-powered machines.)It seems surprising that the bicycle trailer,
which has been used for years in homemadeversions in Europe and has been produced in

326 Mechanics and mechanisms
several lightweight commercial versions in theUnited States in the 1970s, should not find ap-plication in developing countries. A trailer al-lows an unmodified bicycle to be used for loadhauling without adding greatly to the stresses ithas to withstand. The trailer is hitched to thesaddle stem or to the rear-wheel nut, and inter-feres remarkably little with the handling. How-ever, braking deteriorates considerably, andtrailers loaded with goods or children should beused with great caution.
References 1. The Rambler (London: Temple House, 1897).
2. Strange but True, nos. 12,26, and 48, Curry's Ltd.
3. A. J. Palmer, Riding High: The Story of the Bicycle(New York: Dutton, 1956).
4. J. Hadfield, Saturday Book (Boston: Little, Brown,1965).
5. A Dictionary of Applied Physics, ed. R. Glazebrook(London: Macmillan, 1922).
6. The New Encyclopaedia Brittanica, fifteenth edi-tion, s.v. "ship."
7. E. L. Larrabee, The screw propeller, ScientificAmerican 243 (1980), no. 1: 134-148.
8. R. E. Emerson, Design of a Man-Powered Boat,B.S.M.E. thesis, Massachusetts Institute of Technol-ogy, 1973.
9. M. B. Brewster, The Design and Development of aMan-Powered Hydrofoil, B.S.M.E. thesis, Massachu-setts Institute of Technology, 1979.
10. S. F. Hoerner, Fluid-Dynamic Drag (Bricktown,N.J.: Hoerner, 1959).
11. J. C. McCullagh, Pedal Power (Emmaus, Pa.: Ro-dale, 177).
12. T. R. F. Nonweiler, Man-powered aircraft: A de-sign study, Journal of the Royal Aeronautical Society62 (1951): 723-734.
13. D. G. Wilson, Human-Powered Space Transporta-tion (Boston: Galileo, 1978).
14. M. Shakespear, A Pedal-Powered Riding LawnMower, B.S. thesis, Massachusetts Institute of Tech-nology, 1973.

327 Unusual machines
Recommended reading
15. J. F. Kincaid et al., The Automobile and Air Pollu-tion: A Program for Progress, part II, report PB 176885, U.S. Department of Commerce, 1967.
16. R. F. Post and S. F. Post, Flywheels, ScientificAmerican 229 (December 1973): 17-23.
17. Report on the Energy-Storage Bicycle, DartmouthCollege, Hanover, N.H., 1962.
18. F. R. Whitt, Freewheeling uphill—Is it possible?,Cycling (30 January 1965): 13.
19. Curry-Landskiff: Das neue verbesserte Modell 1930(brochure), Alexander Metz, Munich.
20. How to build a rowmobile, Science and Invention(August 1926): 333.
21. W. Goepferich, Building a rowmobile, EverydayScience and Mechanics (January 1933): 130-132,182.
22. A. K. Meier, Becaks, bemos, Lambros and produc-tive pandemonium, Technology Review (January1977): 56-63.
History of Aviation, part 6 (London: New English Li-brary, 1969).
Pedal-power flight beaten by wind, Daily Telegraph(London), 20 March 1972.
C. A. Marchos, Aerodynamics of Sailing (AdlardColes: Granada, 1979).
Man-Powered Flight: The Channel Crossing and theFuture (London: Royal Aeronautical Society, 1979).
H. Rouse, Elementary Mechanics of Fluids (London:Chapman and Hall, 1946), p. 286.
E. C. Shepard, What happened to man-powered flight,New Scientist (27 November 1969).
K. Sherwin, Man-Powered Flight (Hemel, England:Model and Allied, 1971).

13 Human-powered vehicles in the future
Bicycling as a means of transport rose rapidly toan almost incredible level of popularity in the1890s, as has been described in chapter 1. Manyroads were either created or paved as a directresult of the Good Roads Movement of theLeague of American Wheelmen. 1 There was anoutpouring of creative talent, and the designs ofhuman-powered vehicles went through almostevery possible variation before the combinationof the pneumatic tire and the "safety-bicycle"configuration triumphed.There have been very few changes in the de-
sign of the standard bicycle since 1890. Nearly"carbon-copy" bicycles, million after million,have been made since that time, with changesno greater than minor variations in wheel diam-eter, tire diameter, frame angles, and gear ratios.America is a nation on wheels, with well over
100 million motor vehicles on the road. Thereare also over 100 million bicycles, as of 1981.Although one reason for this high figure is theaffluence that makes it possible to buy a bicycleeven if one does not intend to use it every day,it is still true that bicycling is the fastest-grow-ing competitive and recreational sport in theUnited States. Many cities and states have des-ignated bikeways, following the example of theinitial one in Homestead, Florida. When thecommissioner of parks closed Central Park inNew York to all vehicles but bicycles on Sun-day, the response of bicyclists was so great thatit had to be concluded that a much larger por-tion of the population than is generally assumedwould enjoy daily the gentle exercise of bicy-cling if it were not for the constant danger andunpleasantness of competing with automobilesfor space on the roads.

329 The future
That more Americans, even New Yorkers, canand will commute by bicycle when the pres-sures become high enough was shown duringNew York's two-week bus- and subway-workers'strike of 1980. City officials reported that 70,000
people were riding into Manhattan's businessdistricts every day, with perhaps three timesthat number using bicycles citywide. 3 However,the number dropped when the strike was over.Furthermore, the separate bike lanes the city in-stituted in some places to encourage bicyclingcaused uncertainties and conflicts, and three(possibly four) pedestrians died after being hitby bicyclists. 4 These accidents illustrate themost serious impediment to increased futureuse of bicycles in the United States: With theexception of a few distinct communities (suchas Davis, California and Homestead, Florida),state and local governments do not view bicy-cles as serious vehicles. Consequently, laws arehaphazard. In the recent past some communitiesrequired bicyclists to ride on the right and someon the left, and in some places bicyclists weresupposed to use the sidewalks, with little guid-ance on rules in pedestrian-bicyclist conflicts.The federal government has attempted to en-force uniform bicycle regulations, but these,along with almost all other road-use ordinances,are generally not enforced by the police or thecourts. It is to the credit of the League of Ameri-can Wheelmen that it has taken the leadershipin endeavoring to educate bicyclists on the lawsof road use and to have the laws enforced uni-formly on bicyclists as well as on motor-vehicleusers and pedestrians.There is a great potential for increased bicycle
use in the United States, and in most othercountries with high levels of car ownership.The state of mild or severe anarchy on the roadsis one of many contributing factors decreasingthe attractiveness of this otherwise delightfulway of getting around.

330 Mechanics and mechanisms
Most present commuting in the United Statesis accomplished by automobile. Most commutesare under 5 miles, and 36 percent are under 3miles (figure 13.1). For trips of up to 5 miles,repeated trials of door-to-door journeys by ordi-nary bicyclists (not athletes) and automobilecommuters have shown that the bicycle is onaverage the faster vehicle for urban use. The re-sults shown in figure 13.2 are from a particularSierra Club commuter race, but similar resultshave been obtained in many trials held in urbanand dense suburban areas. Buses and subwaysare generally much slower when waiting timesare included.Automobiles are particularly inefficient for
short trips. Figure 13.3 shows that on a 3-miletrip on a cool day, gasoline consumption will beabout twice that normally quoted for thewarmed-up car. 5 About 30 percent of all thegasoline consumed in the United States is usedon trips of 3 miles or less.6Although bicycles are clearly superior for
many people and many trips, automobiles areused in the majority of cases. This is partly be-cause they have been superbly engineered forconvenience and comfort. However, the princi-pal reason is that the use of automobiles is, de-spite current increases and complaints,extremely inexpensive. Gasoline is cheap by thestandards of most of the world, and automobilestoo are still inexpensive. Above all, use of thehighway is inexpensive. All these factors are in-expensive because we have chosen to pay forthe enormous costs the use of the automobilebrings to society—principally through taxes.Our taxes increase while our overall standard ofliving decreases. It is the economic tragedy ofthe commons. Public transportation and bicy-cles cannot compete with this highly subsidizedluxury. If automobile drivers were required topay the approximately $4.00 per mile that econ-omists calculate as the total external cost use ofthe car in an urban rush hour throws onto soci-

Figure 13.1Percentage distribution ofautomobile trips bydistance. Adapted fromAutomobile Facts andFigures (Detroit:AutomobileManufacturers'Association, 1972).
331 The future
Trip length, miles
Figure 13.2Results of Sierra Clubcommuter race, May1974 (•) Bicycle, (A)automobile, (0) tie.Average speeds were 9.8mph for automobiles and10.8 mph for bicycles.

Figure 13.3Gasoline economy ofautomobiles as a functionof engine warmup.Adapted from reference
332 Mechanics and mechanisms
Figure 13.4Data on sales oflightweight bicycles(solid line) and use ofbicycles (dashed line) inUnited States. Adaptedfrom reference 2.

333 The future
ety,7,8 transportation would immediately be-come self-balancing—and more people woulduse bicycles for their own well-being and that oftheir community.
Figure 13.4 shows that more bicycles are nowsold per year in the United States than automo-biles. Of the more than 100 million bicyclesowned, about 75 million are in use (though notthat many are in regular use). In many citiesaround the world the proportion of person-tripsby bicycle is substantial: 17 percent in Copen-hagen; 20 percent in Uppsala, Sweden; 40 per-cent in Davis, California; 47 percent inRotterdam; and around 45 percent in Stevenage,U.K. For general bicycle use to increase to theselevels in the United States, economic and otherdisincentives (some of which were mentionedabove and others of which will be touched onbelow) must be lessened or removed.The bicycle is, in good weather and on smooth
roads, an amazingly convenient means of trans-port. It gives instantly available door-to-doorservice, and at an average speed in urban areasthat is usually better than that of any competitor(at least over distances of up to 5 miles, or 8km, as mentioned above). It is extraordinarilylight, with a payload of up to ten times the un-laden weight, and it is narrow enough to travelthrough and be stored in places inaccessible tomotor vehicles. A bicycle can pay for itself insaved transit fares in much less than a year.And, of course, it is an almost perfect way ofgetting exercise and keeping healthy.All these attributes of this wonderful vehicle
have been with us since before the turn of thecentury. So have nearly all of its shortcomings,some of which are listed here:
• The braking ability of all but speciallyequipped lightweight bicycles is very poor,especially in wet weather.
• A bicyclist without cumbersome clothing isunprotected from rain, snow, hail, and road

334 Mechanics and mechanisms
dirt and from injury in minor accidents.
• It is difficult to carry packages, briefcases,shopping bags, and the like conveniently andsafely.
• The aerodynamic drag in a headwind is veryhigh.
• The riding position and the pedal-crankmethod of power input could be improvedupon, ergonomically.
• Reliability is poor (especially that of brake andgear cables and wheel spokes), and in regardto maintenance the present design is attunedto the low labor costs of an earlier age.
• Whereas standard cars retail at about $2/1b($4/kg), in 1981 prices, regular bicycles sell forabout $4/1b ($8/kg) (and lightweight modelsmay easily cost $20-200/1b), although bicyclescontain much less sophisticated engineeringthan automobiles.
Correcting these drawbacks would provide lit-tle problem to NASA or General Motors. Theirpersistence is the consequence of a vicious cir-cle that is similar to the one that has caused therunning down of public transportation: Toomany cars led to such unpleasant conditions forcycling that demand slackened; manufacturerscut out all "nonessential" expenditures; andnineteenth-century bicycles made poor competi-tors for highly developed modern automobiles.Having automobiles, affluent people moved far-ther and farther from the city centers to avoidthe very congestion that automobiles had playeda large part in causing. Commuting distancesare now over 30 miles each way for many peo-ple—too far for all but the most dedicatedbicyclist.
The situation may be changing. The unhappystate of our cities, the at-last-recognized harmfuleffects of automobile congestion in urban areas,the growing shortages of energy and raw mate-rials, the concern over the damage to our envi-

335 The future
ronment—all of these are helping to recruit notonly new bicyclists but also scientists and engi-neers anxious to solve problems.
Design competitions It was hypothesized in chapter 1 that many ofthe developments in bicycle design in the lastcentury were eagerly accepted only after theyhad proved their worth in competitions (usuallyspeed races or time trials), and that the lack ofnotable developments since then has beenpartly due to the restrictions on the design ofracing bicycles. However, innovative designs incomponents and in the overall vehicle havebeen increasingly in evidence in the last de-cade. These may have been spurred by three de-sign competitions, and new thinking hascertainly been greatly stimulated by the speedand time trials sponsored by the InternationalHuman-Powered-Vehicle Association (IHPVA)since 1974. We will discuss first the results ofthe design competitions.The first modern international design competi-
tion was organized by D.G.W. and the journal
Engineering in 1967-1968. 9 , 10 The aim of thecompetition was to encourage improvements inany aspect of human-powered land transporta-tion. Let us look at the suggestions made bysome of the 73 competitors, and at how theirproposals would overcome some of the deficien-cies, listed above, of present bicycles.There were many proposals incorporating en-
closures to give weather and minor-accidentprotection and luggage space, combined insome cases with a reduction in air drag. Someentrants recognized the penalties in increasedweight, of side force in a cross wind, and ofusually more difficult access. The bodies werevirtually all added to a chassis or spine ratherthan being designed to supply structuralstrength; no one experimented with a "crusta-cean" rather than a "vertebrate" construction,and in this the competitors were probablywisely conservative. Whether the advantages

336 Mechanics and mechanisms
given by an enclosure can justify its drawbackswill be known only through public acceptance.Most riders would not like to sacrifice the bicy-cle's narrow width and its ease of maneuveringand parking, but many would be well preparedto accept a weight penalty of 15 lb (6.8 kg) in acommuting vehicle if the body would keep therider (and the briefcase or pocketbook) cleanand dry, warm in winter, and as cool as possi-ble in summer. The performances of some of theentries in the IHPVA speed trials, reviewedlater, show that this penalty is justified.Many competitors felt that it was logical to
combine a body with a three- or four-wheeledconfiguration. Obviously there is an immediateaddition of weight and of width for stability, ifonly because the wheels and suspension mustnow handle high side loads that are absent frombicycles. If we set out to attract a housewife(perhaps with a baby) to go shopping under herown power, we might find that a three-wheeleror a four-wheeler (which has one more wheelbut one less track than the usual tricycle) wouldhave a great appeal. The additional vehicleweight matters less when one is carrying cargo.A configuration that might have advantages is
that of a two-wheeled single-track vehicle witha semirecumbent riding position, a body, andoutriggers that could be dropped when onestopped (figure 13.5). For a three-wheeler, thearrangement of a bicycle and sidecar gives twotracks instead of three and might have otheradvantages.Body shape, rider attitude, and wheel arrange-
ment are intimately connected with powertransmission, and in this area competitors spentmuch creative effort. There was much preoccu-pation with constant-velocity foot motion in astraight line or through an arc, despite its ap-parent disadvantages.Some entrants proposed hydrostatic transmis-
sions, which would at least give efficient brak-ing on the driven wheel and possibly a

337 The future
Figure 13.5Design for enclosedbicycle with outriggers.
continuously variable gear ratio. The weightpenalty, however, would be severe.There was little evidence of emphasis on the
major problem of braking. The judges were dis-appointed at the lack of brake developments,and would have given the first prize to anyonewho had made or modified a brake to give im-proved wet-weather operation and higher cablereliability without adding greatly to the weightor the cost.The first prize went to W. G. Lydiard, who, be-
sides carrying out careful design and analyticalwork in the areas of stiffness, stability, aerody-namics, and transmission, made three experi-mental machines of different configurations. Hisfirst model was a three-wheeler; the other two(see figure 13.6) had two wheels 16 inches (406mm) in diameter. Lydiard calls his Mark III ma-chine (which he does not claim to be near a fi-nal solution) the Bicar, a name that correctlyimplies that the rider is housed in a body andpedals in a half-reclining position.A problem identified by Lydiard with two-
wheeled reclining-rider bicycles is that eitherthe wheelbase and the overall length becomeexcessive or the feet must pedal over the frontwheel. He found that a conventional chainwheeland cranks in this position gave a marked "feet-up" attitude, and he eventually adopted pullrods swinging through arcs in a more or lessconventional position. He found that these pullrods interfered somewhat with his ability to put

338 Mechanics and mechanisms
Figure 13.6Lydiard Bicar Mark III,with half-reclining ridingposition. A: double-tubeframe. B: single-tubeframe. C: shell support.D: 16-inch front wheelwith hub brake and
generator. E: 16-inch rearwheel with hub gears. F:roller support for pushrod. G: pull rod,actuating swingingcrank. H: rocking pedal.J: universal joint. K:pedal stop. L: pull-rod
bounce limiter. Riderputs legs through flaps inbody to rest feet onground. Towing testsindicated that this designcould increase averagetouring speed by 6 mph.From reference 10.
Figure 13.7Lydiard Bicar Mark IV.Lydiard's proposedfurther development ofhis design would havesprung wheels, and
possibly a variable-ratiofriction gear in the rearwheel activated by thepull rods. From reference10.

339 The future
his feet on the ground through flaps in thebody, and for a later machine (figure 13.7) he isconsidering pull rods operating a variable-ratiooverrunning gear on the rear wheel, togetherwith springing.The Bicar's body is of 1-mm ABS plastic. Ly-
diard intended also to try ABS to reducebody weight, and also possibly *-inch (6.3-mm)
paper honeycomb covered with Melanex, whichwould give an estimated weight of 5 lb (2.3 kg).He rejected, after some consideration, the ideaof using the shell as the principal load-carryingmember, and he employed a fairly conventionaltubular spine frame. He decided to avoid theproblems of windscreen fogging by leaving therider's head in the open, on the theory that "nobicyclist would want to be hermetically sealedin, or object to the sun, wind or rain on his facein moderation."From towing tests made to determine the drag,
it was estimated that Lydiard's Bicar might in-crease a touring bicyclist's average speed (with-out stops) by up to 6 mph (2.68 m/sec).According to the calculations of chapter 7, thisincrement seems conservative.Kazimierz Borkowski was another entrant who
constructed a prototype. His machine (figure13.8) is propelled by a sliding action of the seatalong the long crossbar. The seat is attached toa carriage, which during the power (backward)stroke engages a long loop of chain comingfrom the rear wheel. The handlebars do notmove longitudinally, so the rider must changeposition considerably during the stroke; thiswas of concern to the judges. Borkowski claimsno more than that this is a "sport and recrea-tion" vehicle that gives healthy exercise to moremuscles than does normal cycling.
Stanislaw Garbien's vehicle (figure 13.9) wasdesigned to transmit power to the rear wheelthrough swinging constant-velocity cranks anda continuously variable gear. This machine is abicycle in which the rider sits fairly high over

Figure 13.8Borkowski's rowing-action bicycle. Power istransmitted on thebackward stroke througha sliding seat, whichruns on the longcrossbar. From reference10.
340 Mechanics and mechanisms
Figure 13.9Garbien's semienclosedbicycle design, with bothwheels sprung. Power istransmitted to the rearwheel through swingingconstant-velocity cranksand an infinitely variablegear. From reference 10.

Figure 13.10Winning entry inJapanese BicyclePromotion Institutedesign competition,1974.
341 The future
the rear wheel and pushes levers over the frontwheel. The open sides allow the rider to putfeet on the ground when starting and stopping.
Early in 1974 the results of a design competi-tion were published by the Japanese Design Pro-motion Organization and the Japan BicyclePromotion Institute. The sponsors had adver-tised widely for entries, and had asked for "newideas on cycle(s) which could be for any kind ofvehicle with wheels and driven by humanpower." For comparative purposes the entrieswere categorized in three groups: "utility,""sport and pleasure," and "fantasy." Thejudges were disappointed at the lack of reallynew ideas. Prizes were awarded, however, be-cause of the obvious hard work put in by thecompetitors.The first prize was given to Terje Meyer, Bjorn
Larsen, and Jan Christensen of Norway. Theirmultipurpose bicycle is shown in figure 13.10.They also entered other versions, including atricycle. The judges reported that they were im-pressed by the team's ingenuity, both in theoverall design and in the details. They gavemuch praise to the gearbox in the back hub, al-though it appears to be a version of the old con-stant-velocity system diagrammed in figure 2.13.They thought that the frame design had merits

342 Mechanics and mechanisms
because it avoided the use of welded joints, afeature important for the use of aluminum asproposed by the designers. This design seemsmost ingenious, both in detail and overall, andworthy if novelty was the main aim of the exer-cise. It suffers from various drawbacks, how-ever, when compared with conventionalmachines. For example, the frame, unless maderelatively heavy through the use of a largerquantity of material to compensate for the longcantilevered members, would be flexible; thewheels would soon be twisted out of track. Thelong levers would be bent easily unless theywere deep in section and therefore heavy. Thenonpneumatic tires and small wheels would re-sult in high rolling friction, giving probably aloss of 10-70 percent of the usual "utility"speed. Riding on rough roads would be uncom-fortable, though perhaps the frame would flexsomewhat and help to smooth bumps. The ap-parent lack of vertical adjustment to the saddleand handlebars seems another detriment. Thislever design was claimed go give a "walking ac-tion," but with the lever ends pivoted at fixedpoints, giving largely vertical pedal motions, itappears that the foot motion would be better de-scribed as "stepping." Ergonomic testing hasshown that, in terms of power output for agiven oxygen-breathing rate, stepping exerciseis not superior to that of pedaling on a conven-tional crank system. Cycling history shows thatas soon as good chain drives became available(in the 1880s) the rotary pedaling system wasgenerally accepted. Lever systems have reap-peared spasmodically as "innovations," but nophysiological experiments have backed up theinnovators' enthusiasms. The advent of reliablevariable gearing for bicycles probably gave thefirst place to rotary drive in that they became asacceptable for low road speeds uphill as leverdrives, which had been claimed to be better.The second prize in the Japanese design corn-

343 The future
Figure 13.11Second-prize entry inJapanese BicyclePromotion Institutedesign competition,1974.
petition was awarded to the Japanese designersof two folding bicycles. Figure 13.11 shows oneof these designs, which when folded would beeasy to carry. The designs incorporated shortwheelbases, small wheels, and dubious meansof altering saddle height. The short wheelbaseseems hazardous, and the dimensions of theopened-up machines seem unsafe for other thanflat roads. The steering would be very sensitive,and except on hard, smooth, flat pavements thehigh rolling resistance would be a disadvantagefor other than very short distances. In general,folding bicycles are intended for short trips(from train station to office, for example); per-haps these designs served this purpose.Another prize was awarded to Naef Fridolin of
Switzerland for the "fun" or "fantasy" machineshown in figure 13.12. The rider sits inside aspokeless 1.7-m-diameter wheel and steers via atrailing wheel. The report says that the testersexperienced peculiar sensations. (We remarkedon the difficulties of rear-wheel steering inchapter 9.) Curiously, similar machines ap-peared in the last century and were proposed asserious competitors for the less outlandish bicy-cles and tricycles."

344 Mechanics and mechanisms
Figure 13.12Third-prize entry inJapanese BicyclePromotion Institutedesign competition,1974.
The Japanese competition attracted no designsfor racing bicycles and offered nothing for seri-ous cycle tourists. The most practical entries ap-pear to have been generated mainly by a needfor a machine easily stowed in a car trunk andmeant for traveling short distances on citystreets.The British Cycling Bureau, sponsored by
manufacturers and dealers, joined with the Sun-day Times magazine and the Observer to orga-nize a bicycle-design competition for permanentresidents of the United Kingdom. The competi-tion had three categories: working cycles (ma-chines for short local trips, shopping, and short-distance commuting), leisure cycles (machinesfor longer-distance leisure cycling), and acces-sories. The three winning entries (announced inApril 1979) for a "working cycle" all had smallwheels, were foldable, and emphasized the con-venience of the bicycle for about-town transport.The first prize when to Juan Szumowski, a Lon-don architect, for a bicycle that folded into ahand-carried package (figure 13.13). The shaft-drive transmission was to be made largely ofmolded plastics. The second prize went to theWW group, whose design concealed a rein-forced-rubber-belt transmission in a molded-plastic box frame (figure 13.14). This designalso included a "power point" for recharginglight batteries, a built-in cable lock, and saddle-height adjustment by means of a compressedgas. These two entries were beautifully made

345 The future
Figure 13.13Winning entry in BritishCycling Bureau designcompetition, 1979.Courtesy of BritishCycling Bureau.
but nonfunctional mockups. Grahame Herbert'sthird-prize entry was a functional folding bicy-cle of conventional materials (figure 13.15). De-spite an enthusiastic entry of nearly 100designs, the juding panel reluctantly decidednot to award prizes in this leisure-cycle cate-gory. On the whole, competitors in this categoryeither added design details to conventionalcycles without enlarging their function andrange or submitted imaginative ideas thatproved on examination to be unworkable.The British competition, like the previous one
in Japan, showed the present interest in foldablebicycles. The judges chose, for the premierawards, entries that emphasized style ratherthan function. If the plastic machines were "en-gineered" to be sufficiently stiff to be pedaledefficiently, and with stresses low enough toavoid fatigue failures, they would inevitably beheavier than more conventional present ma-

Figure 13.14Second-prize entry inBritish Cycling Bureaudesign competition,1979. Courtesy of BritishCycling Bureau.
Figure 13.15Third-prize entry inBritish Cycling Bureaudesign competition,1979. Courtesy of BritishCycling Bureau.
346 Mechanics and mechanisms

347 The future
chines. However, the previous two design com-petitions led to trends or to actual commercialproduction (by, for instance, an Italian manufac-turer of an ingenious lever-drive bicycle verysimilar to that of figure 13.10), so we may seeefforts to satisfy the evident desires of part ofthe public for high-style easy-care bicycles likethose of figures 13.13 and 13.14.
IHPVA races The International Human-Powered Vehicle As-sociation (IHPVA) was formed in 1974 by Ches-ter Kyle and fellow enthusiasts, principally as abody through which the record speeds reachedon the bicycles they were building could be rec-ognized. The only restriction on the design ofthe vehicles which could be entered in their an-nual speed trials was that there be no energystorage other than that in the riders. The exist-ing organization that oversaw bicycle racinghad extremely tight design restrictions. We ar-gued above that these restrictions had helped tostifle developments in bicycle design for muchof this century. Whether or not this is true,there is no doubt that the IHPVA speed trials(and, more lately, the one-hour distance race)have had and are having a dramatic effect onhuman-powered racing vehicles. We shall dis-cuss later the question of the influence of thesespecial vehicles on commuting and recreationalbicycles.
The early (1974) IHPVA records (figure 4.9)were set by standard bicycles with faired enclo-sures. One designed by Kyle himself had the ex-tremely low drag coefficient of 0.10 (table 4.3).However, in essence these vehicles were similarto others that had been made at intervalsthroughout this century—notably, perhaps,those of Oscar Egg in Britain (figure 4.5). Theseformer models were merely curiosities, becauseany records they set were not recognized by bi-cycling's governing body, but the new IHPVAmachines and their recognized records started

348 Mechanics and mechanisms
Figure 13.16Abbot's prone recumbentbicycle, with crude body.Courtesy of Chester Kyle.
an inexorable process of development andrefinement.In all the later successful models, the frontal
area was reduced below that of a faired standardracing bicycle plus rider. To do this requiredthat the rider in a single-rider vehicle lie proneor supine. Allan Abbott constructed a bicyclewith an overhead girderlike frame connectingfront and rear wheels, and suspended himselfface down horizontally beneath it (figure 13.16).Abbott had already set a motor-paced speed rec-ord of 138.67 mph (62 m/sec) on a more con-ventional bicycle. When he used a fairing withthe prone recumbent (figure 13.17), he becamethe fastest self-propelled human being. How-ever, control was difficult, possibly because ofthe flexible connection between rider and vehi-cle. Most later machines were designed to havethe riders supine, or else prone and supportedon seats or pads rather than in slings to give amuch stiffer connection and better handling.The 50-, 55-, and 60-mph "barriers" were bro-
ken by a tricycle called White Lightning (figure

349 The future
Figure 13.17Abbot's prone recumbentbicycle with fairing.Courtesy of Chester Kyle.
13.18) constructed by students from NorthrupUniversity and pedaled by two supine riders,one behind the other. This vehicle was beatenin 1979 by a machine, built by a team calledVector, that was thought by some to approachthe ultimate in low drag and high power out-put. It was a quadracycle with three proneriders arranged head to feet (figure 13.19). Thefront rider steered with his hands and pedalednormally; the second and third riders turnedhandgrips on the pedals of the rider ahead inaddition to the pedaling. It is estimated, asstated in chapter 2, that about 12.5 percent morepower can be delivered if the hands are used aswell as the legs, especially in short-durationmaximum-power attempts.Despite their 1979 success, the Vector design
team (led by Al Voight) produced two quite dif-ferent vehicles for the 1980 speed trials (figure13.20). The riders were semireclining in each,with their heads up; thus, they were able to seebetween their knees. In the two-person Vector,which reached 62.92 mph (28.13 m/sec), theriders sat back to back and used pedals only.The single-rider Vector reached 56.66 mph(25.33 m/sec), faster than any multiple-rider ve-hicle had gone until a year before. Both weretricycles with the single driving wheel in therear, behind the rider's back in the single-rider
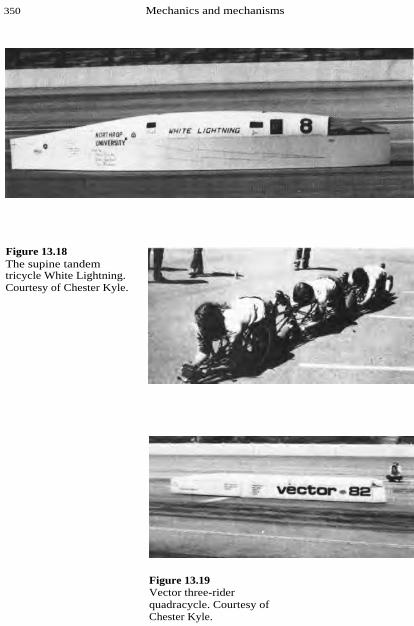
Figure 13.18The supine tandemtricycle White Lightning.Courtesy of Chester Kyle.
350 Mechanics and mechanisms
Figure 13.19Vector three-riderquadracycle. Courtesy ofChester Kyle.

Figure 13.20Vector semirecumbenttricycles, 1980. Courtesyof Chester Kyle.
351 The future
case. The transmission was a fairly conventionalsix-speed derailleur, with added "idler" sprock-ets to route the long chain beneath the rider(s).The 100-tooth chainwheel, in combination withan 11-tooth top-gear sprocket, required only 88rpm on the cranks to produce 60 mph. Thissupports the Japanese data reproduced in chap-ter 2 showing crank rpm between 60 and 100giving maximum output and efficiency. (Muchhigher rpm are frequently advocated.)Some data on the two 1980 Vector vehicles are
shown in table 13.1. When these are comparedwith the hypothetical values listed for the "ulti-mate human-powered vehicle" in table 7.2,some close agreements can be seen. The rollingresistance of the Vectors seems to be above theminimum predicted from Kyle's tests, 12 so thereshould be some scope for further development.

352 Mechanics and mechanisms
Table 13.1 Data on Vector vehicles, 1980.
Single-rider Tandem
Length 2.95 m 3.84 m
Width 0.635 m 0.635 mHeight 0.813 m 0.838 m
Weight 23.13 kg 34.02 kg
Frontal area 0.424 m 2 0.437 m2
Rolling-frictioncoefficient
0.006 0.005
Aerodynamic-dragcoefficient
0.11 0.13
Future commuting
vehicles
The frontal area will be marginally reduced, nodoubt, but there does not seem to be much pros-pect for significant reductions in the aerody-namic drag coefficient unless somesophisticated forms of boundary-layer controlare used. Therefore, the principal scope for evenhigher speeds seems to lie in delivering morepower to the driving wheel, which can beachieved only through the following:
• riders with higher power-weight ratios,
• longer acclimatization and training,
• reduction in transmission losses,
• use of arm and possibly trunk muscles inaddition to leg muscles, and
• use of motions of feet, hands, etc., by whichmore power is given by the human body.
Developments in racing or speed-trial vehicleswill influence the design of commuting vehi-cles, but the two types of machines will be farfrom identical as long as human-powered com-muting vehicles have to share the roads withmotor vehicles. Commuting vehicles must bevisible to motor-vehicle drivers, some of whomsit 6 feet or more above the ground in trucks ofover 20,000 pounds. A flag on a tall stalk makesa conventional bicycle more visible, but a flagalone, no matter how large, will be insufficientto compensate for the dangers of being in a ve-hicle less than a meter high in heavy traffic.

353 The future
Therefore, a commuting vehicle should besomewhat higher than a speed-trial machine.An appropriate rider height is that used in
present automobiles, with the seat about 2 feet(0.6 m) above the ground. The recumbent posi-tion gives lower frontal area, and the supine po-sition is more comfortable and natural than theprone. Also, it is safer to hit an object with thefeet than with the head. Although the 1980 Vec-tors proved the semisupine position to be er-gonomically effective, a higher seat-back anglewould be desirable to give a greater field of vi-sion as well as more visibility.An enclosure is essential to reduce aerody-
namic drag and to give protection from rain andsnow. Throughflow ventilation that can bebrought into operation in hot weather will alsobe essential. We do not yet know to what extentan enclosure will prove detrimental at ex-tremely high temperatures. An enclosure madeof the 10-mm Styrofoam used for inexpensiveinsulated picnic boxes would provide excellentthermal insulation and some injury protection.Present materials of this type are easily dam-aged, and stores would need to stock replace-ment fairings (which, in high volume, shouldcost no more than a pair of tires). It would bepracticable to incorporate an automobile-type"radiator" (actually a convection heat exchan-ger) that could be filled with crushed ice at thestart of short commuting trips in hot weatherand would cool the inflowing ventilation air.For longer trips in extreme heat, riders wouldhave to rely on maximum ventilation and, as atpresent, reduced exertion.All recent winners of the IHPVA speed trials
have had more than two wheels. This has ledmany writers to conclude the future commutingvehicles (dubbed somewhat imprecisely "phase-3 bikes") would not, in fact, be bicycles. But tri-cycles and quadracycles have serious weightand size disadvantages. If a pair of wheels isused for steering, an Ackermann-type steering

354 Mechanics and mechanisms
linkage must be used. If two wheels are drivers,some form of differential has to be incorporated.All wheels and their supporting structures haveto be designed to take the large side loads re-sulting from, for example, a sudden high-speedturn of a heavily laden machine at the bottom ofa long hill. (The wheels of a bicycle must with-stand forces only in the plane of the wheel.)The wheel track also has to be wide enough forthe vehicle not to overturn in the same type ofmaneuver, depositing its rider into the path ofoncoming traffic. The width of a multiwheel ve-hicle would force it to occupy a full traffic lane,incurring the constant wrath of motor-vehicleusers, whereas a bicycle can comfortably use ahalf lane or less. There have been many at-tempts to introduce three- and four-wheeledpedaled vehicles for highway use (see figure12.16). We believe that their failures were duemore to their widths and to the weight requiredto make them sufficiently stiff than to any otherreason.We believe that future human-powered com-
muting vehicles will be bicycles. They may in-corporate outrigger wheels such as those shownin figure 13.5 to be used at rest and duringstartup. They will have enclosures or fairings,but these will be shorter than the very-low-dragshapes used for speed-trial vehicles, for the sakeof maneuverability, side-force reduction incrosswinds, and easier storage. The riding posi-tion will be semirecumbent. The hands andarms will be at the rider's sides (so that poten-tially injurious steering gear can be removedfrom in front), and may be used for power aswell as steering. There will be built-in luggagecapacity and theft-resistant lights. These vehi-cles will be heavier than present commuting bi-cycles, but their flat-road performance will bevery attractive (see figure 7.4 and table 7.2).The additional weight will make these vehicles
less attractive in very hilly regions. One obviousapproach is to dispense with the fairing in such

Figure 13.21The Syracuse Cruswaypowered-guidewayconcept. Courtesy ofSyracuse UniversityResearch Corporation.
355 The future
areas. A fairing would give a measurable dragreduction only on the downhills, where onewould like more drag, and would increaseweight (although one hopes the increase wouldbe small) and thus add to the effort required onthe uphills. Another approach, investigated atSyracuse University, is some form of off-vehiclepowered assistance for steep hills. The Syracuse"Crusway" (figure 13.21) had a form of ski-slopeT bar coming from overhead and hooking ontothe handlebars of conventional bicycles. Refer-ence 10 proposed a moving belt in the roadwayonto which one would pedal one's tricycle, withthe single front wheel on the belt, apply thefront brake, and accelerate to belt speed. Thiscould work for bicycles with deployable outrig-ger wheels. Another possibility, which wouldbe feasible for regular bicycles, would be tohave a moving handrail like those on escalators

356 Mechanics and mechanisms
Figure 13.22Powered handrail foruphill assistance.
A saner future
(figure 13.22). Powered assistance systemswould preferably be installed in a separateright-of-way, although the moving handrailcould be used on ordinary streets if parkingwere prohibited on the uphill curb. The hand-rail could also be used by skaters on thesidewalk.
Whether any of these seemingly desirable devel-
opments will actually take place, or whether theworld will continue to rush to utilize every newdiscovery of stored energy in ever-more-extrava-gant "power trips," cannot be predicted. Whatcan be forecast is that the former pattern of dou-bling energy consumption every decade or socannot continue much longer, for many reasonsof which the limited availability of energy isonly one. Pollution, land-use problems, and thequestion of where to get materials from whichto make all the energy-using gadgets this in-creasing consumption presupposes are almostimmediate problems in several countries. Man-kind's energy dissipation, now about 1/20,000of the incident solar energy, would reach the

357 The future
level of the sun's radiation to the earth in about110 years if we continued the present rate of in-crease. Obviously, long before this could occurthe climate would be so modified as to makeirreversible changes in the whole of the earth'secology, and life would probably be impossiblefor many plants and animals.The gentle way of the bicycle is, for short dis-
tances, a transportation alternative that is com-patible with nature and with a way of life thatmany of us would find an improvement over to-day's frenetic rushing hither and thither. We be-lieve that the present renewed enthusiasm forbicycling is an encouraging sign of a sanerfuture.
References 1. Bates, Good common roads and how to make them,The Wheelmen (Boston) V (1885): 194-200.
2. A calendar of the '70s, American Bicyclist 100(1979), no. 12: 261.
3. J. Krohe, Jr., America on wheels, Across the Board(June 1980): 49-57.
4. W. K. Ezell, New York bike lanes: Use them or losethem, American Wheelmen (January 1981): 4-9,20.
5. T. C. Austin and K. H. Hellman, Passenger-Car FuelEconomy as Influenced by Trip Length, paper, Societyof Automotive Engineers, 1975.
6. R. A. Rice, System Energy as a Factor in Consider-ing Future Transportation, paper, Society of Automo-tive Engineers, 1970.
7. R. J. Smeed, Road Pricing: The Economic andTechnical Possibilities (London: HMSO, 1964).
8. G. Roth, Paying for Roads (Harmondsworth, U.K.:Penguin, 1967).
9. D. G. Wilson, A plan to encourage improvements inman-powered transit, Engineering (London) 204(1967), no. 5283: 97-98.
10. D. G. Wilson, Man-powered land transport, Engi-neering (London) 2071 (1969), no. 5372: 567-573.
11. A. Ritchie, King of the Road (Berkeley, Calif.: Ten-Speed, 1975), pp. 48-49.
12. C. R. Kyle and W. E. Edelman, Man-Powered-Ve-hicle Design Criteria, Third International Conferenceon Vehicle Dynamics, Blacksburg, Va., 1974.

Appendix
Conversion factors Mass: x lbm = 0.4536x kg (kilograms)
Force: x lbf = 4.448x N (newtons)
Length: x in. = 25.4x mm (millimeters)x ft = 0.3048x m (meters)x miles = 1.609x km (kilometers)
Area: x ft' = 0.0929x m2
Volume: x ft" = 0.02832x m3
Pressure, x lbf/in. 2 = 6,895 Pa (pascals)stress, (1 Pa = 1 N/m2modulus of = 6.895x kPa (kilopascals)elasticity: (100 kPa = 1 bar = 14.503 lbf/in.2)
Density: x lbm/ft3 = 16.017x kg/m3
Velocity: x mph = 0.447x m/sec(meters/second)
= 1.609x km/h(kilometers/hour)
x knots = 0.52x m/sec
Torque: x lbf-ft = 1.356x N-m (newton-meters)
Energy: x ft-lbf = 1.356x J (joules)x Btu = 1,054.9x Jx kcal = 4,186.8x Jx kWh = (3.6 x 10 6)x J = 3.6 MJ
(megajoules)
Power: x hp = 746x J/sec = 746x W (watts)x kcal/min = 69.78x Wx ft-lbf/sec = 1.356 W
Specific heat: x Btu/lbm-°R = 4,187x J/kg-°K
Heat flux: x Btu/ft 2-h = 3.154x W/m2x kcal/m 2 -h = 1.163 W/m2

359 Appendix
Derivations
Mass and weight
Properties of dry airat normal pressures
Force (newtons) = Mass (kilograms)x Acceleration (m/sec2)
Energy or Work (joules) = Force (newtons)x Distance (m)
Power (watts) = Work (joules)per Unit time (seconds)
When we refer to the weight of (for instance) abicycle or its rider, we are, strictly, giving thegravitational force. The correct units wouldtherefore be newtons or pounds force (lbf). If wewere to take a bicycle to the moon, its weightwould be about one-sixth of its weight on theearth. The mass would remain unchanged.Therefore, we have usually given the mass (inkilograms or in pounds mass, lbm) when wehave by common usage referred to the"weight." Weight is given by the relation
Mass x Gravitational acceleration gc
where gc is a constant that in the S.I. systemequals unity and in English units equals 32.17
lbm-ft/lbf-sec2.
Temperature Specific Thermalheat C, conductivity k Densityap Viscosity'
°K °F (kJ/kg-°K) (kW/m-°K) (kg/m3) (m2/sec)
275 2 35.6 1.0038 2.428 x 10⁻⁵ 1.284 1.343 x 10⁻⁵
300 27 80.6 1.0049 2.624 x 10 -5 1.177 1.567 x 10⁻⁵
325 52 125.6 1.0063 2.816 x 10 -5 1.086 1.807 x 10⁻⁵
a. These properties are at 1 bar, atmospheric pressure.

360 Appendix
Gear-speedconversion chart
Note: This chart is derived from one issued bythe Tandem Club (U.K.). In continental Europe,the gear size is often specified as 7T x meters, or3.1416 x meters, which gives the distance trav-eled for one revolution of the cranks.
Gear Vehicle Pedalingsize speed speed

Index
Adenosine triphosphate(ATP), 33, 41
Adhesion, coefficient of,200
Adhesives, 252Aerodynamic effects of
passing vehicles, 103Age and breathing capac-
ity, 38Air
properties of, 359resistance of, 71, 85, 93
Aircraft, human-powered,76, 305, 310
Alloysaluminum, 243, 262bronze-brazing, 251chrome-molybdenum-
manganese-carbon,239
magnesium, 243, 264steel vs. aluminum, 253
Aluminum, 243, 252, 262American Star bicycle,
18, 19, 57Amphibious machines,
human-powered, 306Animals, power require-
ments of, 169-176Antivibration mecha-
nisms, 131-132Automobiles, 329, 331,
334
"Backward" bicycle, 234Balancing, 7, 215-236Bamboo, as bicycle mate-
rial, 259Batteries, 185Bearings
ball, 11, 14, 142, 146flexing-gimbal, 286life of, 148nonmetallic, 147, 256steering, 228
Bickerton bicycle, 337"Bicar," 337
Bike lanes, 329Blood sugar, 34Boats and water cycles,
human-powered,305-306
"Boneshaker," 22, 145Brake blocks, 208Brake-cable casings, 204Brake fade, 189Brake linings, 189BrakesCaldarazzo, 210coaster, 191disk, 191, 206dual-leverage, 209internal-expanding hub,
191, 206plunger, 190rim, 189, 191servo-action, 210squealing of, 190
Braking. See also Stop-ping distances
by backpedaling, 212distances for, 199longitudinal stability
during, 196rear-wheel-only, 201wet-weather, 202
Breathing, 32, 38, 41, 48.See also Oxygen
British Cycling Bureau,344
Brown recumbent bicy-cle, 23-24
Caloric expenditure, 39Calorie consumption, 53Carbon-fiber composite
material, 252Caster action, 219Chains. See Drive sys-
temsChainwheels
elliptical, 56expanding, 289-290
Clothing, 80

362 Index
Clutches"dog," 297one-way ("freewheel"),
279sprag, 298
Competitionsin bicycle design, 335-
347for human-powered ve-
hicles, 26, 347-352Convection, 74, 75Coventry Lever tricycle,
15Coventry Rotary balance
gear, 16Cranks, length of, 53, 61,
64, 222"Cruiser" bicycles, 240"Crusway," 355Cyclecars, 319
Derailleurs, 22, 284Drag coefficient, 85Draisienne, 8, 11Drive systems, 13, 21,
277-300belt, 288cam, 57-60chain, 13, 15, 140, 141,
279, 283-294hand-cranked, 32, 44,
278hydrostatic, 300, 336lever, 18, 57, 168, 278linear, 57-58, 278, 298oscillating, 298rotary-crank, 278sector-gear, 278shaft, 297split-sprocket, 293swinging-lever, 278traction, 281treadle-action, 18-19variable-ratio, 280
Dursley-Pederson bicycle,269
Dynamometer pedals,63-64
"Easy Muscar," 321Elasticity, modulus of,
248
Elastomers, 189Endurance, 242Energy storage, 185, 315,
347
Factor of safety, 210Fairings, 97, 151Fatty acids, 34Fiber reinforcement, 33,
257, 298Folding bicycles, 269,
343-345Food, 162, 163Forks, 216, 224, 240Frames, 222, 253, 259,
265Freewheels, 19, 57, 279Frictionair, 72bearing, 85coefficients of, 108, 143,
189, 196, 203of dry solid substances,
189in limb joints, 149mechanical, 140
Frontal area, 91Future vehicles, hypo-
thetical, 156, 352
Gear cases, 141, 283Gears
derailleur, 22, 284epicyclic, 294hub, 148, 283, 295, 313spur, 294-297
Glucose, 34Glycogen, 33Good Roads Movement,
328Gyroscopic action, 218
Handrails, powered, 355Hands-off bicycling, 235Headwinds, 181Heart rate, 64Heat and cooling, 71-81Heat-rejection tempera-
ture, 36Heat stress, 30High-wheeler bicycles,
13-18, 279

363 Index
Hill climbing, 76, 163,182
"Hobby-horse," 6-8Horses, power output of,
177Humans, power output
of, 29, 51-53, 177Humber spring-frame bi-
cycle, 133Humidity, 77Hysteresis, 108, 129
Ice and snow machines,human-powered, 308
Impedances, matching of,279
Intermediate-TechnologyDevelopment Group,325
International CyclingFederation, 97
International CyclingUnion, 26
International Human-Powered Vehicle As-sociation, xii, 96, 97,100, 347-352
Kevlar, 257
Labryinth seals, 148Lactic acid, 42Laminar flow, 87"Landskiff," 319Lawn mower, pedaled,
312League of American
Wheelmen, 328Low-cycle fatigue, 241Lugs, 239, 246, 251-252Lymphatic system, hu-
man, 41
Mass and weight, 359Materials, 239-272. See
also names of specificmaterials
composite, 243fatigue of, 33, 41, 241-
245strength of, 261
Metabolic efficiency, 163
Mopeds, 92, 171Moulton bicycle, 136,
165, 232Mudguards, 252, 259Musclesanaerobic action of,
33, 44chemistry of, 33fibers of, 33-34power of, 29, 67, 163, 176
Nickel, 263Nonferrous metals, 243Nonmetallic components,
147, 256. See alsonames of specific ma-terials and compo-nents
"Normal Bicyclette," 23Notch sensitivity, 250Nylon, 147, 256
glass-reinforced, 257in tires, 166
Off-road vehicles, hu-man-powered, 302
Open frames, 269, 271Ordinances, 329"Ordinary" bicycles,
13, 14Oxygen consumption, 31,
33, 61-64, 166, 182.See also Breathing
Pedalingrate of, 45-48, 61-67thrust of, 61-63, 66-67torque of, 64uphill, 182
"Penny-farthing" bicycle,13, 14
"People-Powered Vehi-cle," 321
Phosphoryl creatine, 33Plastics, 256-260"Pocket Bicycle," 269Pulley, 283
Quadracycles, 319, 349
Racing bicyclists, 64-65,156

364 Index
Railway cycles, 308Records, world, 52, 55,
151, 154, 161Recumbent bicycles, 22,
25, 95, 232Reynolds number, 90Riding positions
prone, 103recumbent, 22, 25, 95,
232supine, 103
Roller skates, 151, 179,265
Rolling resistance, 117Rotational kinetic energy,
161-162Rough surfaces, and
wind resistance, 90Rover safety bicycles, 21Rowing, 32, 43, 303, 305"Rowmobile," 319Royal Salvo tricycle, 16Rubber bands, for energy
storage, 315Running, 50, 180
Saddle, angle and heightof, 52-53
"Safety" bicycle, 19, 21,53, 279
Sales, of lightweight bi-cycles, 332
Shimmy, 215Sidecars, 324Sierra Club commuter
race, 330Skidding, 232Soft ground, wheel resis-
tance on, 109Speed records, 151, 154,
347-349Springing, 125-128Stability, 219-221Stanley bicycle shows,
21, 259Steel, 239, 248Steering, 215-236rear-wheel, 233
Stopping distances, 200Streamlining, 76, 85-86,
91, 97, 100, 151Stress, 239-272
isometric, 33
Stress-concentration fac-tor, 246
Sweat, 34, 35, 73Swimming, 79
Tandem bicycles, 22Tangent-tension spoking,
13Tensile strength, ulti-
mate, 241Tension sprockets, 283Tires
cords of, 137, 166flexing.of, 129friction slip of, 196, 226pneumatic, 19, 21, 106,
111pressures in, 112, 116,
120solid rubber, 111, 121tread patterns of, 212
Titanium, 243, 263Toe straps, 63Track bicycling, 131, 151,
179Trail, steering, 217, 224 .Transmissions. See Drive
systemsTricycles, 15, 16, 95, 171Tubes. See also names of
materialsoval, 265streamlined, 100
Turbulent flow, 87
Units of measure, xix, 358
Victor cycles, 349, 353"Velocar," 25, 26, 95, 319Velocipedes, 10, 11, 25
Wind chill, 77-78Wind, relative, 77Wind-tunnel experi-
ments, 85Wood, as bicycle mate-
rial, 239, 259Work, negative (eccen-
tric), 212Work output, 31
Yielding of materials, 2481Young,s modulus, 248

SPORT
Second Editionby Frank Rowland Whitt andDavid Gordon Wilson
The first edition of this bookwas greeted with such re-sponses as this:
"The human being used asan engine may not be the wayyou look at a bicycle, butthat's how nature looks at it.This exceptional book ana-lyzes, compares and judgesthe measurable aspects ofpeople-power and the bicyclebeing ridden ... pity,[the authors] ha iddenthe findings in a of jar-gon. The chapter on bicyclephysics will get most readersto a useful level of under-standing. The chapter onpeople-powered devices otherthan bicycles is fascinating."— J. Baldwin, The CoEvolutionQuarterly.The se ' ion - :*
cling Sci des newformatio t achieve-ments a ents inhuman-powered transporta-tion, as the "ultimatehuman-powered vehicle"(UHPV), in which supine riders.can achie eeds well over
60 mph s Mc Cullagh,editor of Bicycling Ma.. me,has written a forevvoedition, which alsoman - 4 it r. io olL'4o]
Also ay . pc. Bicycles and Tricycles ,An Elementary TreatisTheir Design and Cons
by Archibald SharpForeword to the reprinteditionby David Gordon Wilson
Published in 1896, Bicyclesand Tricycles was the first se-rious, scientifically basedstudy of the bicycle. It beginswith a general exposition ofmechanical principles andincludes experiments in bicyclzand tricycled ign, includingseveral "m calmonstrositi
A definitive work in its ownti me, Bicycles and Tricycles isa collector's item for historylovers as well as bic cle en-thusiasts—a treat f erersand all thoso .- -r in thehistor of i on.
MassachTeefintologCa bridge