BIG SUNFLOWER RIVER WATERSHED ASSESSMENTmafes.msstate.edu/publications/bulletins/b1203.pdf · big...
21
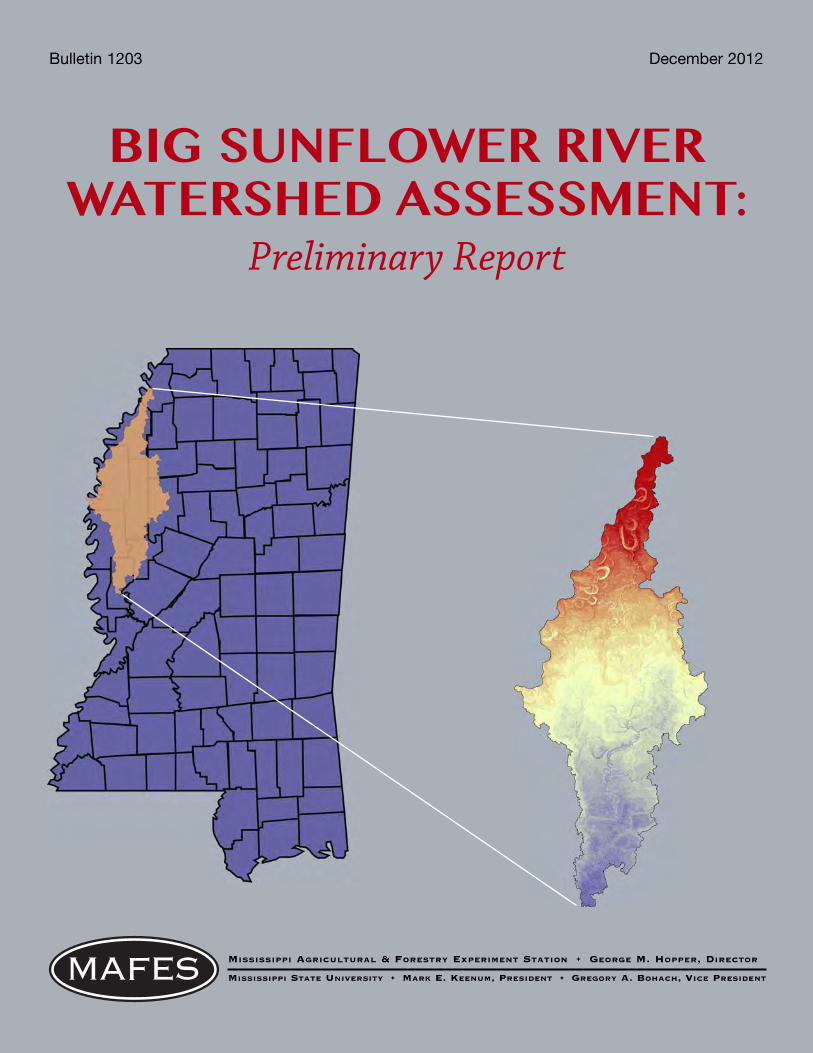
BIG SUNFLOWER RIVER WATERSHED ASSESSMENT: Preliminary Report MISSISSIPPI AGRICULTURAL & FORESTRY EXPERIMENT STATION • GEORGE M. HOPPER, DIRECTOR MISSISSIPPI STATE UNIVERSITY • MARK E. KEENUM, PRESIDENT • GREGORY A. BOHACH, VICE PRESIDENT Bulletin 1203 December 2012
Transcript of BIG SUNFLOWER RIVER WATERSHED ASSESSMENTmafes.msstate.edu/publications/bulletins/b1203.pdf · big...
BIG SUNFLOWER RIVERWATERSHED ASSESSMENT:
Preliminary Report
MISSISSIPPI AGRICULTURAL & FORESTRY EXPERIMENT STATION • GEORGE M. HOPPER, DIRECTOR
MISSISSIPPI STATE UNIVERSITY • MARK E. KEENUM, PRESIDENT • GREGORY A. BOHACH, VICE PRESIDENT
Bulletin 1203 December 2012
Prem B. Parajuli Assistant Professor
Department of Agricultural and Biological Engineering
Priyantha JayakodyGraduate Research Assistant
Department of Agricultural and Biological Engineering
Big Sunflower River WatershedAssessment: Preliminary Report
This document was approved for publication as MAFES Bulletin 1203 of the Mississippi Agricultural and Forestry Experiment Station. It waspublished by the Office of Agricultural Communications, a unit of the Division of Agriculture, Forestry, and Veterinary Medicine at MississippiState University. Copyright 2012 by Mississippi State University. All rights reserved. This publication may be copied and distributed withoutalteration for nonprofit educational purposes provided that credit is given to the Mississippi Agricultural and Forestry Experiment Station.
CONTENTS
Description . . . . . . . . . . . . . . . . . . . . . . . . . . . . . . . . . . . . . . . . . . . . . . . . . . . . . . . . . . . . . . . . 1
Overview of Water Quality Issues . . . . . . . . . . . . . . . . . . . . . . . . . . . . . . . . . . . . . . . . . . . . . . . 2
Land Use . . . . . . . . . . . . . . . . . . . . . . . . . . . . . . . . . . . . . . . . . . . . . . . . . . . . . . . . . . . . . . . . . . 2
Land Uses and Soil Types . . . . . . . . . . . . . . . . . . . . . . . . . . . . . . . . . . . . . . . . . . . . . . . . . . 2
Land Use Key . . . . . . . . . . . . . . . . . . . . . . . . . . . . . . . . . . . . . . . . . . . . . . . . . . . . . . . . . . . 3
Land Use Map . . . . . . . . . . . . . . . . . . . . . . . . . . . . . . . . . . . . . . . . . . . . . . . . . . . . . . . . . . . 4
Soil . . . . . . . . . . . . . . . . . . . . . . . . . . . . . . . . . . . . . . . . . . . . . . . . . . . . . . . . . . . . . . . . . . . . . . . 5
Subbasins . . . . . . . . . . . . . . . . . . . . . . . . . . . . . . . . . . . . . . . . . . . . . . . . . . . . . . . . . . . . . . . . . 6
Subbasins Map . . . . . . . . . . . . . . . . . . . . . . . . . . . . . . . . . . . . . . . . . . . . . . . . . . . . . . . . . . 6
Subbasin Area and Elevation . . . . . . . . . . . . . . . . . . . . . . . . . . . . . . . . . . . . . . . . . . . . . . . . 7
U.S. Geological Survey (USGS) Gages . . . . . . . . . . . . . . . . . . . . . . . . . . . . . . . . . . . . . . . . . . . 8
USGS Gage Station Locations . . . . . . . . . . . . . . . . . . . . . . . . . . . . . . . . . . . . . . . . . . . . . . 8
Slope . . . . . . . . . . . . . . . . . . . . . . . . . . . . . . . . . . . . . . . . . . . . . . . . . . . . . . . . . . . . . . . . . . . . . 9
Major River Network . . . . . . . . . . . . . . . . . . . . . . . . . . . . . . . . . . . . . . . . . . . . . . . . . . . . . . . . 10
Rain Gage . . . . . . . . . . . . . . . . . . . . . . . . . . . . . . . . . . . . . . . . . . . . . . . . . . . . . . . . . . . . . . . . 11
Rain Gage Stations . . . . . . . . . . . . . . . . . . . . . . . . . . . . . . . . . . . . . . . . . . . . . . . . . . . . . . 11
Rain Gage Data . . . . . . . . . . . . . . . . . . . . . . . . . . . . . . . . . . . . . . . . . . . . . . . . . . . . . . . . . 12
Hydrologic Soil Group . . . . . . . . . . . . . . . . . . . . . . . . . . . . . . . . . . . . . . . . . . . . . . . . . . . . . . . 13
Elevation . . . . . . . . . . . . . . . . . . . . . . . . . . . . . . . . . . . . . . . . . . . . . . . . . . . . . . . . . . . . . . . . . 14
Cities and Towns . . . . . . . . . . . . . . . . . . . . . . . . . . . . . . . . . . . . . . . . . . . . . . . . . . . . . . . . . . . 15
Beef Cows . . . . . . . . . . . . . . . . . . . . . . . . . . . . . . . . . . . . . . . . . . . . . . . . . . . . . . . . . . . . . . . . 16
Population by County . . . . . . . . . . . . . . . . . . . . . . . . . . . . . . . . . . . . . . . . . . . . . . . . . . . . . . . 16
Preliminary Results . . . . . . . . . . . . . . . . . . . . . . . . . . . . . . . . . . . . . . . . . . . . . . . . . . . . . . . . . 16
Discussion . . . . . . . . . . . . . . . . . . . . . . . . . . . . . . . . . . . . . . . . . . . . . . . . . . . . . . . . . . . . . . . . 17
Acknowledgments . . . . . . . . . . . . . . . . . . . . . . . . . . . . . . . . . . . . . . . . . . . . . . . . . . . . . . . . . . 17
References . . . . . . . . . . . . . . . . . . . . . . . . . . . . . . . . . . . . . . . . . . . . . . . . . . . . . . . . . . . . . . . 17
Mississippi Agricultural and Forestry Experiment Station 1
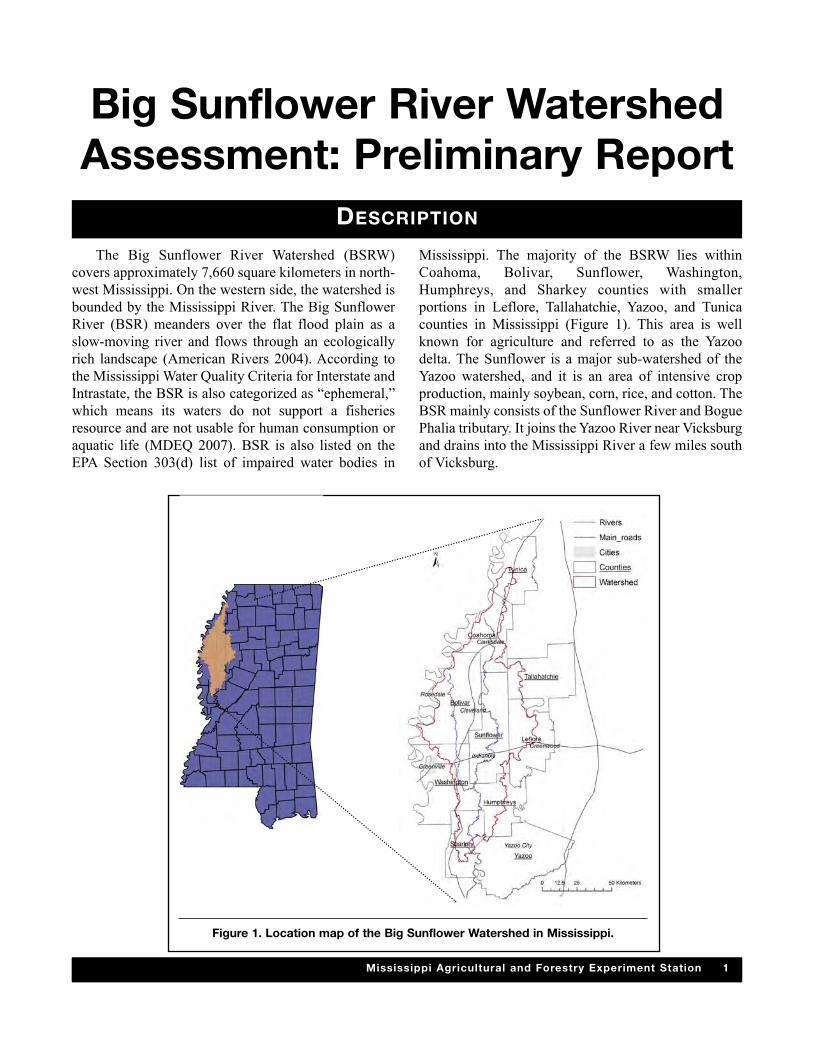
The Big Sunflower River Watershed (BSRW)covers approximately 7,660 square kilometers in north-west Mississippi. On the western side, the watershed isbounded by the Mississippi River. The Big SunflowerRiver (BSR) meanders over the flat flood plain as aslow-moving river and flows through an ecologicallyrich landscape (American Rivers 2004). According tothe Mississippi Water Quality Criteria for Interstate andIntrastate, the BSR is also categorized as “ephemeral,”which means its waters do not support a fisheriesresource and are not usable for human consumption oraquatic life (MDEQ 2007). BSR is also listed on theEPA Section 303(d) list of impaired water bodies in
Mississippi. The majority of the BSRW lies withinCoahoma, Bolivar, Sunflower, Washington,Humphreys, and Sharkey counties with smallerportions in Leflore, Tallahatchie, Yazoo, and Tunicacounties in Mississippi (Figure 1). This area is wellknown for agriculture and referred to as the Yazoodelta. The Sunflower is a major sub-watershed of theYazoo watershed, and it is an area of intensive cropproduction, mainly soybean, corn, rice, and cotton. TheBSR mainly consists of the Sunflower River and BoguePhalia tributary. It joins the Yazoo River near Vicksburgand drains into the Mississippi River a few miles southof Vicksburg.
Big Sunflower River WatershedAssessment: Preliminary Report
DESCRIPTION
Figure 1. Location map of the Big Sunflower Watershed in Mississippi.
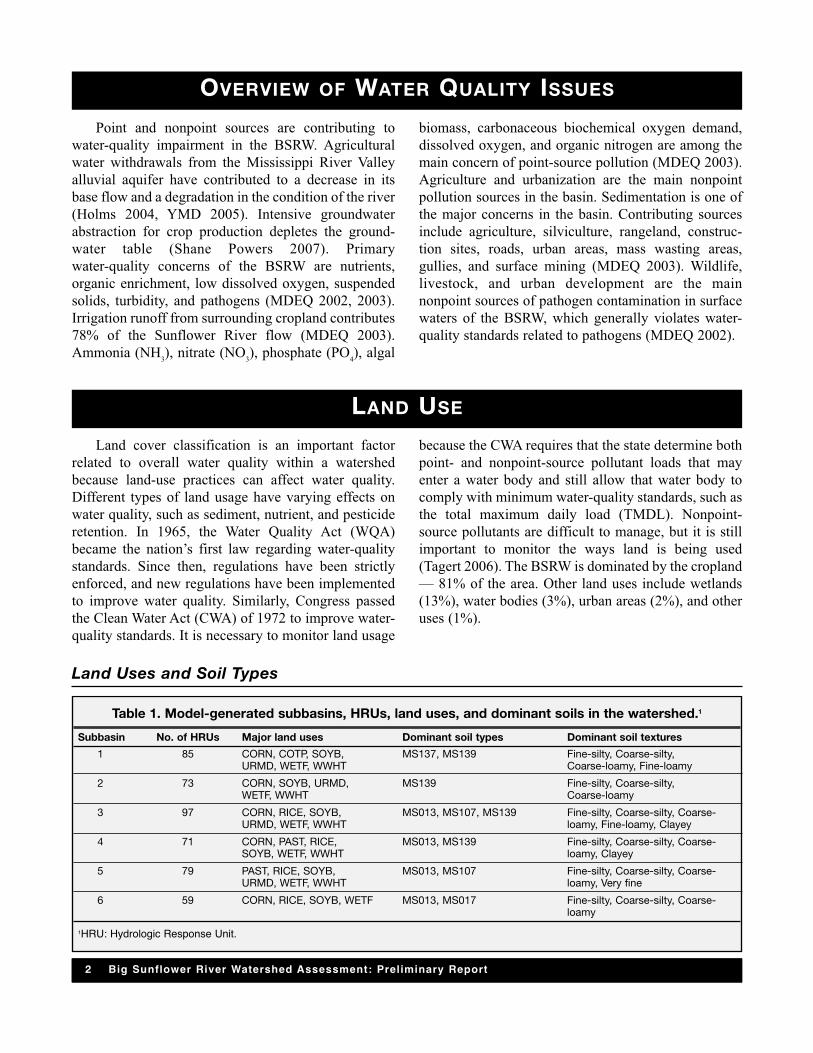
Land cover classification is an important factorrelated to overall water quality within a watershedbecause land-use practices can affect water quality.Different types of land usage have varying effects onwater quality, such as sediment, nutrient, and pesticideretention. In 1965, the Water Quality Act (WQA)became the nation’s first law regarding water-qualitystandards. Since then, regulations have been strictlyenforced, and new regulations have been implementedto improve water quality. Similarly, Congress passedthe Clean Water Act (CWA) of 1972 to improve water-quality standards. It is necessary to monitor land usage
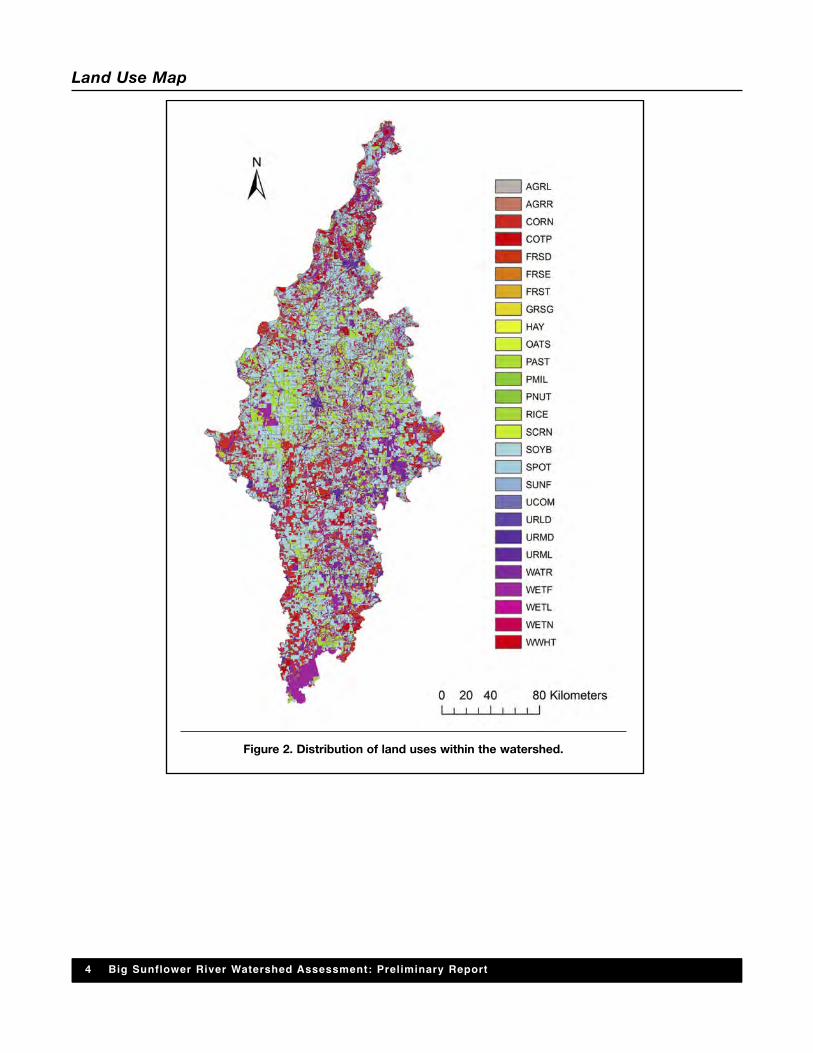
because the CWA requires that the state determine bothpoint- and nonpoint-source pollutant loads that mayenter a water body and still allow that water body tocomply with minimum water-quality standards, such asthe total maximum daily load (TMDL). Nonpoint-source pollutants are difficult to manage, but it is stillimportant to monitor the ways land is being used(Tagert 2006). The BSRW is dominated by the cropland— 81% of the area. Other land uses include wetlands(13%), water bodies (3%), urban areas (2%), and otheruses (1%).
LAND USE
2 Big Sunflower River Watershed Assessment: Preliminary Report
Point and nonpoint sources are contributing towater-quality impairment in the BSRW. Agriculturalwater withdrawals from the Mississippi River Valleyalluvial aquifer have contributed to a decrease in itsbase flow and a degradation in the condition of the river(Holms 2004, YMD 2005). Intensive groundwaterabstraction for crop production depletes the ground-water table (Shane Powers 2007). Primarywater-quality concerns of the BSRW are nutrients,organic enrichment, low dissolved oxygen, suspendedsolids, turbidity, and pathogens (MDEQ 2002, 2003).Irrigation runoff from surrounding cropland contributes78% of the Sunflower River flow (MDEQ 2003).Ammonia (NH3), nitrate (NO3), phosphate (PO4), algal
biomass, carbonaceous biochemical oxygen demand,dissolved oxygen, and organic nitrogen are among themain concern of point-source pollution (MDEQ 2003).Agriculture and urbanization are the main nonpointpollution sources in the basin. Sedimentation is one ofthe major concerns in the basin. Contributing sourcesinclude agriculture, silviculture, rangeland, construc-tion sites, roads, urban areas, mass wasting areas,gullies, and surface mining (MDEQ 2003). Wildlife,livestock, and urban development are the mainnonpoint sources of pathogen contamination in surfacewaters of the BSRW, which generally violates water-quality standards related to pathogens (MDEQ 2002).
OVERVIEW OF WATER QUALITY ISSUES
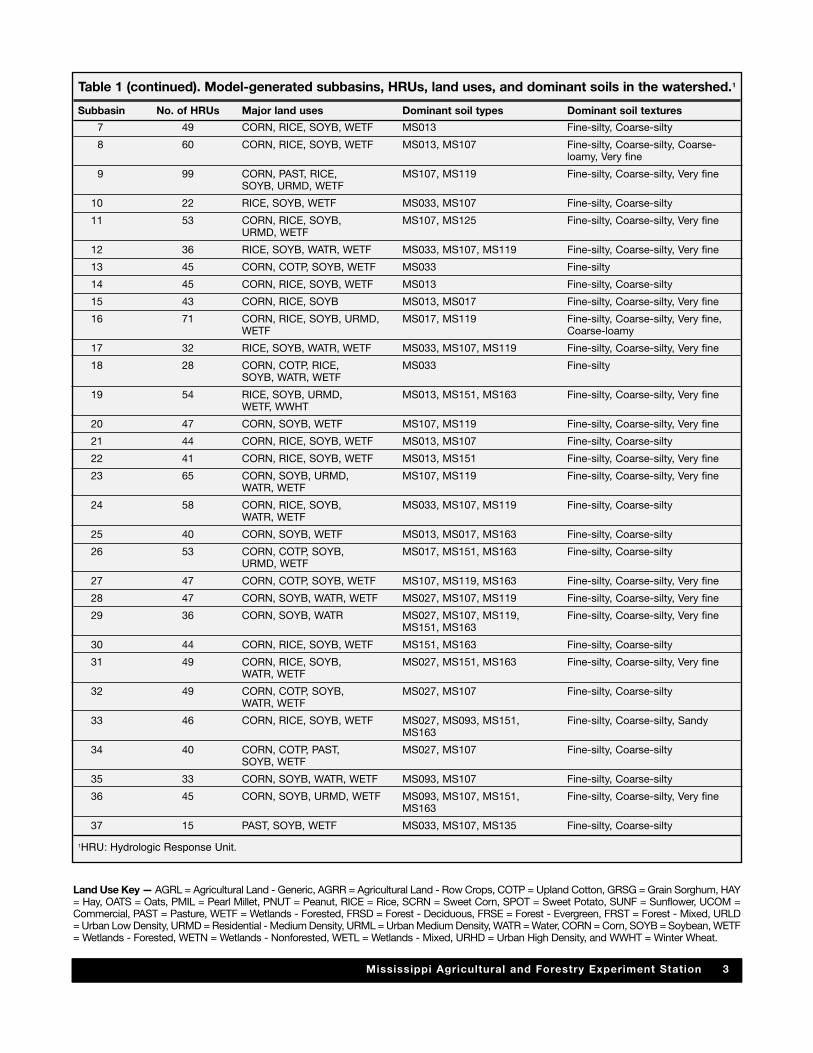
Table 1. Model-generated subbasins, HRUs, land uses, and dominant soils in the watershed.1
Subbasin No. of HRUs Major land uses Dominant soil types Dominant soil textures
1 85 CORN, COTP, SOYB, MS137, MS139 Fine-silty, Coarse-silty,URMD, WETF, WWHT Coarse-loamy, Fine-loamy
2 73 CORN, SOYB, URMD, MS139 Fine-silty, Coarse-silty,WETF, WWHT Coarse-loamy
3 97 CORN, RICE, SOYB, MS013, MS107, MS139 Fine-silty, Coarse-silty, Coarse-URMD, WETF, WWHT loamy, Fine-loamy, Clayey
4 71 CORN, PAST, RICE, MS013, MS139 Fine-silty, Coarse-silty, Coarse-SOYB, WETF, WWHT loamy, Clayey
5 79 PAST, RICE, SOYB, MS013, MS107 Fine-silty, Coarse-silty, Coarse-URMD, WETF, WWHT loamy, Very fine
6 59 CORN, RICE, SOYB, WETF MS013, MS017 Fine-silty, Coarse-silty, Coarse-loamy
1HRU: Hydrologic Response Unit.
Land Uses and Soil Types
Mississippi Agricultural and Forestry Experiment Station 3
Table 1 (continued). Model-generated subbasins, HRUs, land uses, and dominant soils in the watershed.1
Subbasin No. of HRUs Major land uses Dominant soil types Dominant soil textures
7 49 CORN, RICE, SOYB, WETF MS013 Fine-silty, Coarse-silty
8 60 CORN, RICE, SOYB, WETF MS013, MS107 Fine-silty, Coarse-silty, Coarse-loamy, Very fine
9 99 CORN, PAST, RICE, MS107, MS119 Fine-silty, Coarse-silty, Very fineSOYB, URMD, WETF
10 22 RICE, SOYB, WETF MS033, MS107 Fine-silty, Coarse-silty
11 53 CORN, RICE, SOYB, MS107, MS125 Fine-silty, Coarse-silty, Very fineURMD, WETF
12 36 RICE, SOYB, WATR, WETF MS033, MS107, MS119 Fine-silty, Coarse-silty, Very fine
13 45 CORN, COTP, SOYB, WETF MS033 Fine-silty
14 45 CORN, RICE, SOYB, WETF MS013 Fine-silty, Coarse-silty
15 43 CORN, RICE, SOYB MS013, MS017 Fine-silty, Coarse-silty, Very fine
16 71 CORN, RICE, SOYB, URMD, MS017, MS119 Fine-silty, Coarse-silty, Very fine,WETF Coarse-loamy
17 32 RICE, SOYB, WATR, WETF MS033, MS107, MS119 Fine-silty, Coarse-silty, Very fine
18 28 CORN, COTP, RICE, MS033 Fine-siltySOYB, WATR, WETF
19 54 RICE, SOYB, URMD, MS013, MS151, MS163 Fine-silty, Coarse-silty, Very fineWETF, WWHT
20 47 CORN, SOYB, WETF MS107, MS119 Fine-silty, Coarse-silty, Very fine
21 44 CORN, RICE, SOYB, WETF MS013, MS107 Fine-silty, Coarse-silty
22 41 CORN, RICE, SOYB, WETF MS013, MS151 Fine-silty, Coarse-silty, Very fine
23 65 CORN, SOYB, URMD, MS107, MS119 Fine-silty, Coarse-silty, Very fineWATR, WETF
24 58 CORN, RICE, SOYB, MS033, MS107, MS119 Fine-silty, Coarse-siltyWATR, WETF
25 40 CORN, SOYB, WETF MS013, MS017, MS163 Fine-silty, Coarse-silty
26 53 CORN, COTP, SOYB, MS017, MS151, MS163 Fine-silty, Coarse-siltyURMD, WETF
27 47 CORN, COTP, SOYB, WETF MS107, MS119, MS163 Fine-silty, Coarse-silty, Very fine
28 47 CORN, SOYB, WATR, WETF MS027, MS107, MS119 Fine-silty, Coarse-silty, Very fine
29 36 CORN, SOYB, WATR MS027, MS107, MS119, Fine-silty, Coarse-silty, Very fineMS151, MS163
30 44 CORN, RICE, SOYB, WETF MS151, MS163 Fine-silty, Coarse-silty
31 49 CORN, RICE, SOYB, MS027, MS151, MS163 Fine-silty, Coarse-silty, Very fineWATR, WETF
32 49 CORN, COTP, SOYB, MS027, MS107 Fine-silty, Coarse-siltyWATR, WETF
33 46 CORN, RICE, SOYB, WETF MS027, MS093, MS151, Fine-silty, Coarse-silty, SandyMS163
34 40 CORN, COTP, PAST, MS027, MS107 Fine-silty, Coarse-siltySOYB, WETF
35 33 CORN, SOYB, WATR, WETF MS093, MS107 Fine-silty, Coarse-silty
36 45 CORN, SOYB, URMD, WETF MS093, MS107, MS151, Fine-silty, Coarse-silty, Very fineMS163
37 15 PAST, SOYB, WETF MS033, MS107, MS135 Fine-silty, Coarse-silty
1HRU: Hydrologic Response Unit.
Land Use Key — AGRL = Agricultural Land - Generic, AGRR = Agricultural Land - Row Crops, COTP = Upland Cotton, GRSG = Grain Sorghum, HAY= Hay, OATS = Oats, PMIL = Pearl Millet, PNUT = Peanut, RICE = Rice, SCRN = Sweet Corn, SPOT = Sweet Potato, SUNF = Sunflower, UCOM =Commercial, PAST = Pasture, WETF = Wetlands - Forested, FRSD = Forest - Deciduous, FRSE = Forest - Evergreen, FRST = Forest - Mixed, URLD= Urban Low Density, URMD = Residential - Medium Density, URML = Urban Medium Density, WATR = Water, CORN = Corn, SOYB = Soybean, WETF= Wetlands - Forested, WETN = Wetlands - Nonforested, WETL = Wetlands - Mixed, URHD = Urban High Density, and WWHT = Winter Wheat.
4 Big Sunflower River Watershed Assessment: Preliminary Report
Figure 2. Distribution of land uses within the watershed.
Land Use Map
Mississippi Agricultural and Forestry Experiment Station 5
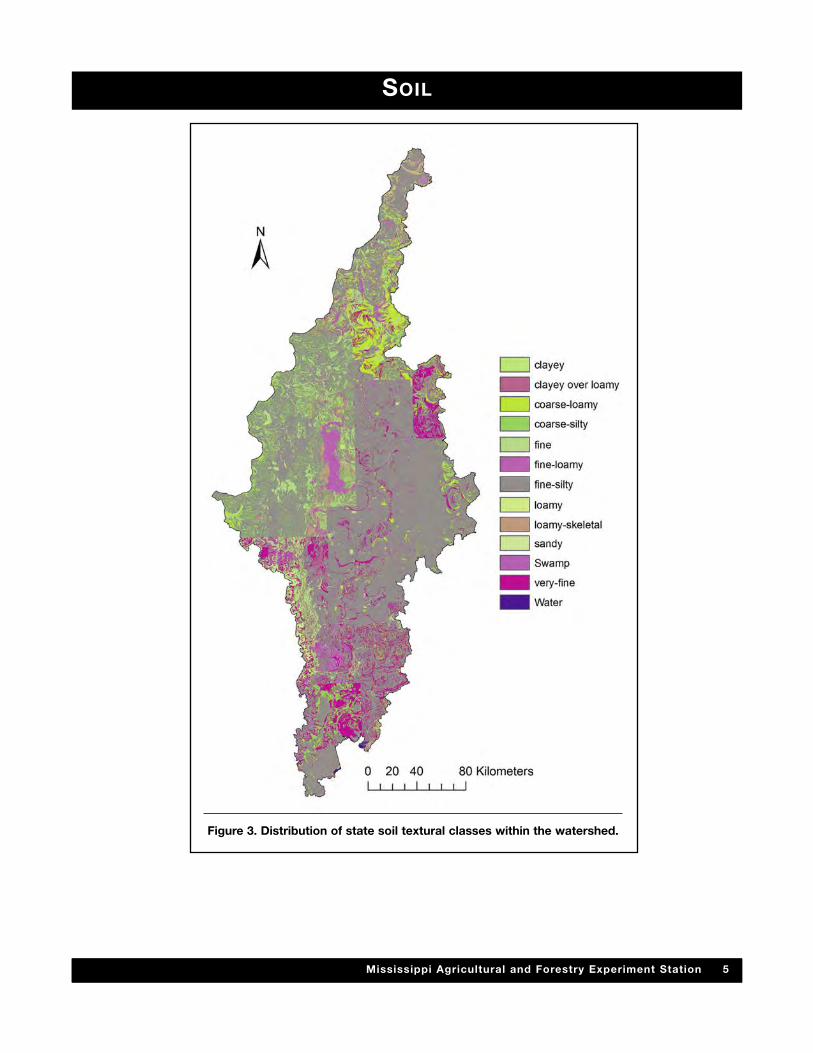
SOIL
Figure 3. Distribution of state soil textural classes within the watershed.
6 Big Sunflower River Watershed Assessment: Preliminary Report
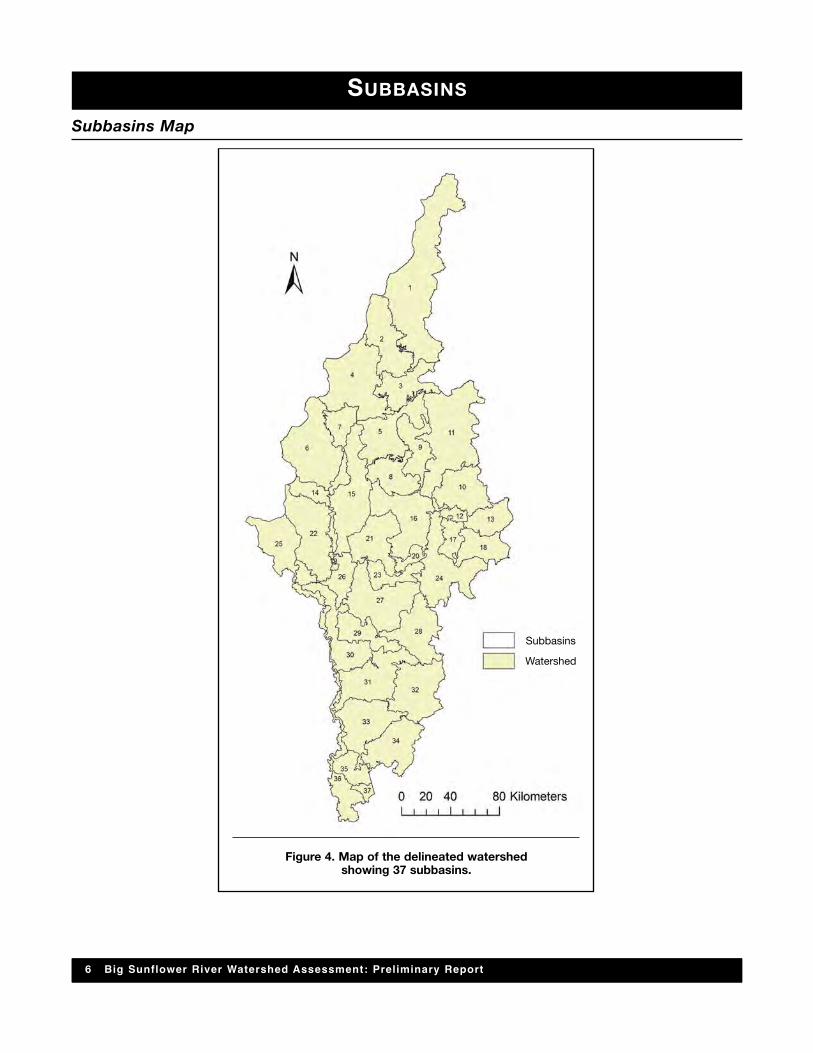
SUBBASINS
Figure 4. Map of the delineated watershedshowing 37 subbasins.
Subbasins
Watershed
Subbasins Map
Mississippi Agricultural and Forestry Experiment Station 7
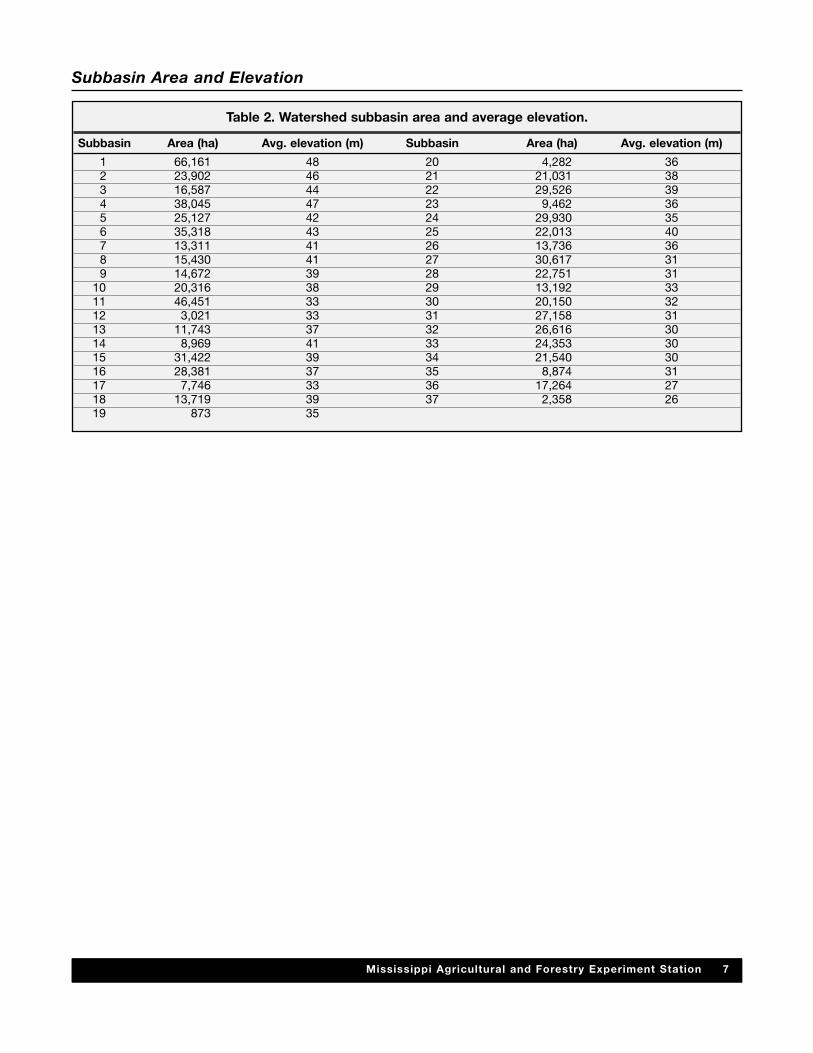
Table 2. Watershed subbasin area and average elevation.
Subbasin Area (ha) Avg. elevation (m) Subbasin Area (ha) Avg. elevation (m)
1 66,161 48 20 4,282 362 23,902 46 21 21,031 383 16,587 44 22 29,526 394 38,045 47 23 9,462 365 25,127 42 24 29,930 356 35,318 43 25 22,013 407 13,311 41 26 13,736 368 15,430 41 27 30,617 319 14,672 39 28 22,751 31
10 20,316 38 29 13,192 3311 46,451 33 30 20,150 3212 3,021 33 31 27,158 3113 11,743 37 32 26,616 3014 8,969 41 33 24,353 3015 31,422 39 34 21,540 3016 28,381 37 35 8,874 3117 7,746 33 36 17,264 2718 13,719 39 37 2,358 2619 873 35
Subbasin Area and Elevation
8 Big Sunflower River Watershed Assessment: Preliminary Report
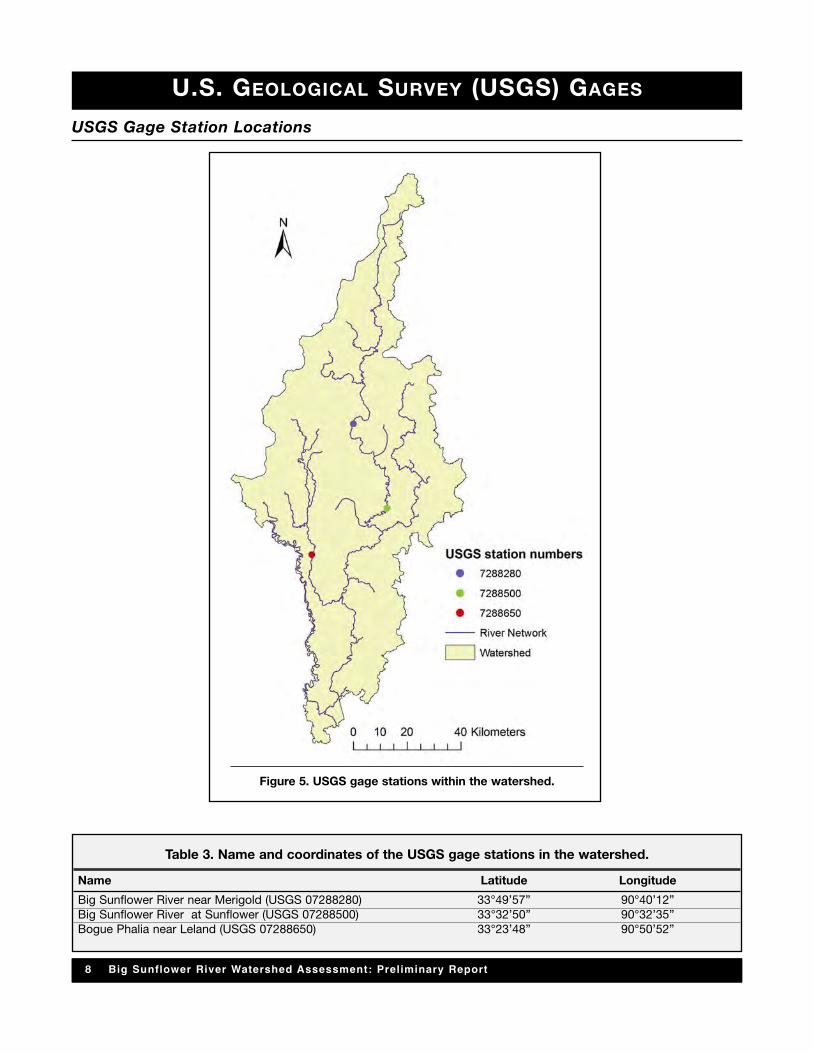
U.S. GEOLOGICAL SURVEY (USGS) GAGES
Figure 5. USGS gage stations within the watershed.
Table 3. Name and coordinates of the USGS gage stations in the watershed.
Name Latitude Longitude
Big Sunflower River near Merigold (USGS 07288280) 33°49’57” 90°40’12”Big Sunflower River at Sunflower (USGS 07288500) 33°32’50” 90°32’35”Bogue Phalia near Leland (USGS 07288650) 33°23’48” 90°50’52”
USGS Gage Station Locations
Mississippi Agricultural and Forestry Experiment Station 9
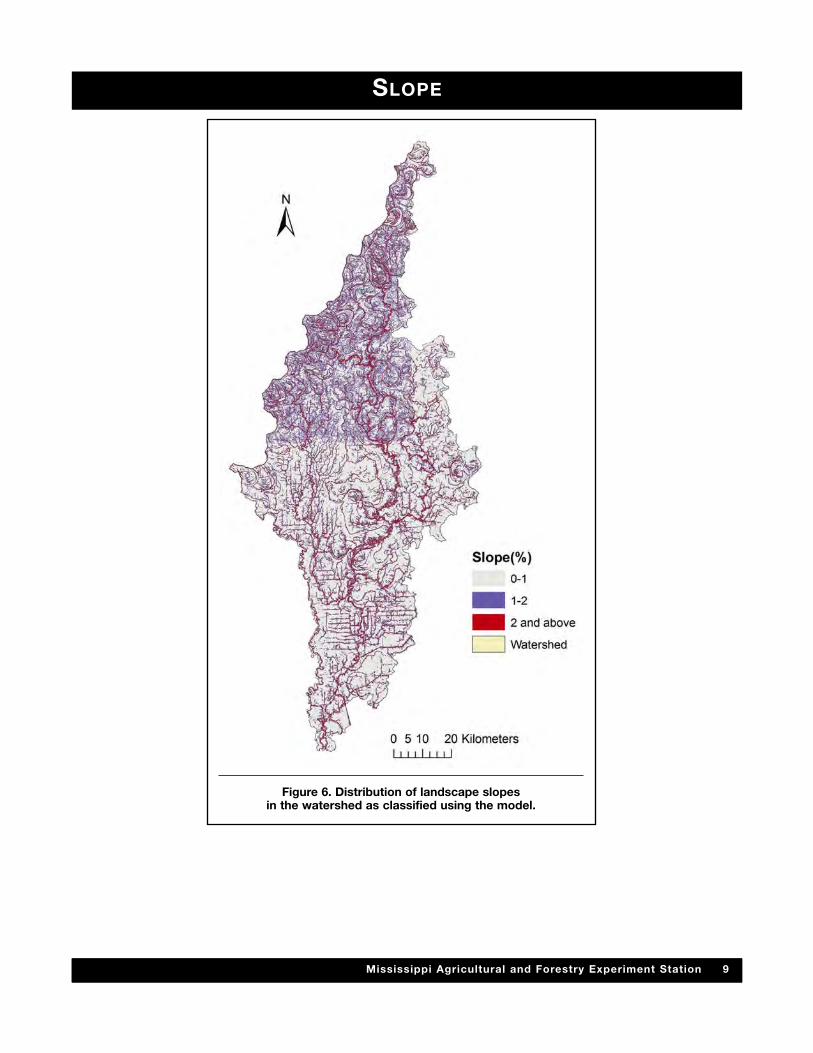
Figure 6. Distribution of landscape slopesin the watershed as classified using the model.
SLOPE
10 Big Sunflower River Watershed Assessment: Preliminary Report
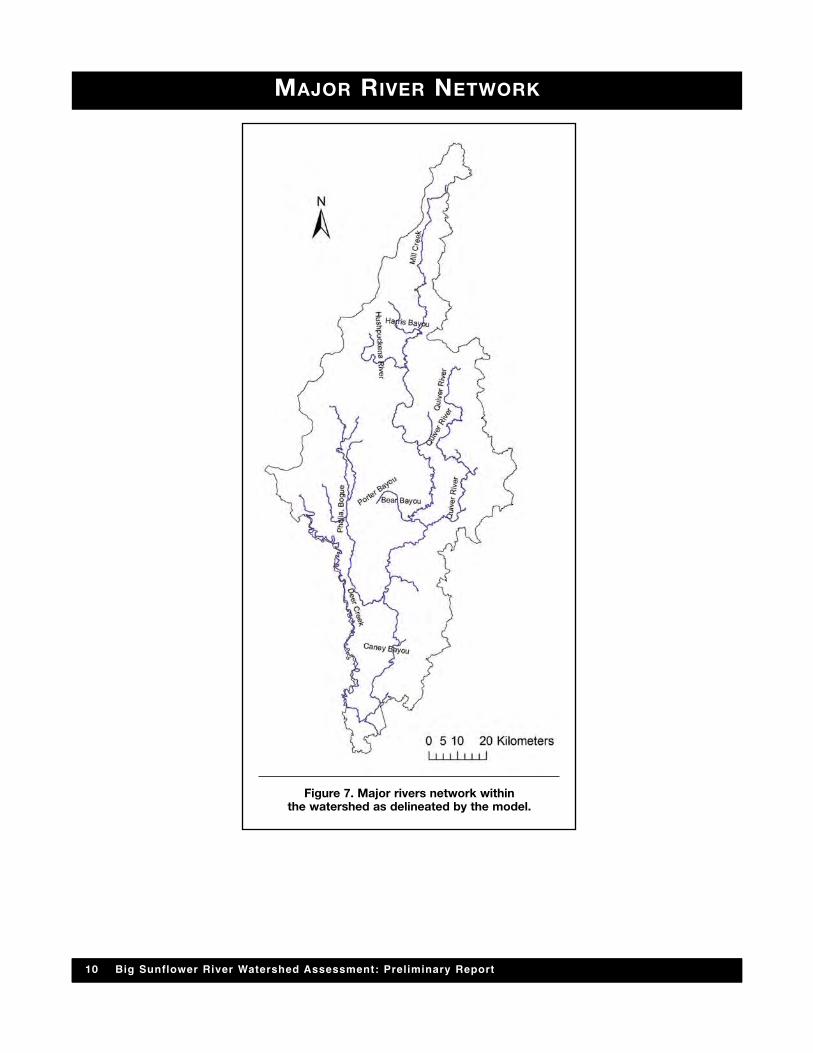
MAJOR RIVER NETWORK
Figure 7. Major rivers network withinthe watershed as delineated by the model.
Mississippi Agricultural and Forestry Experiment Station 11
RAIN GAGE
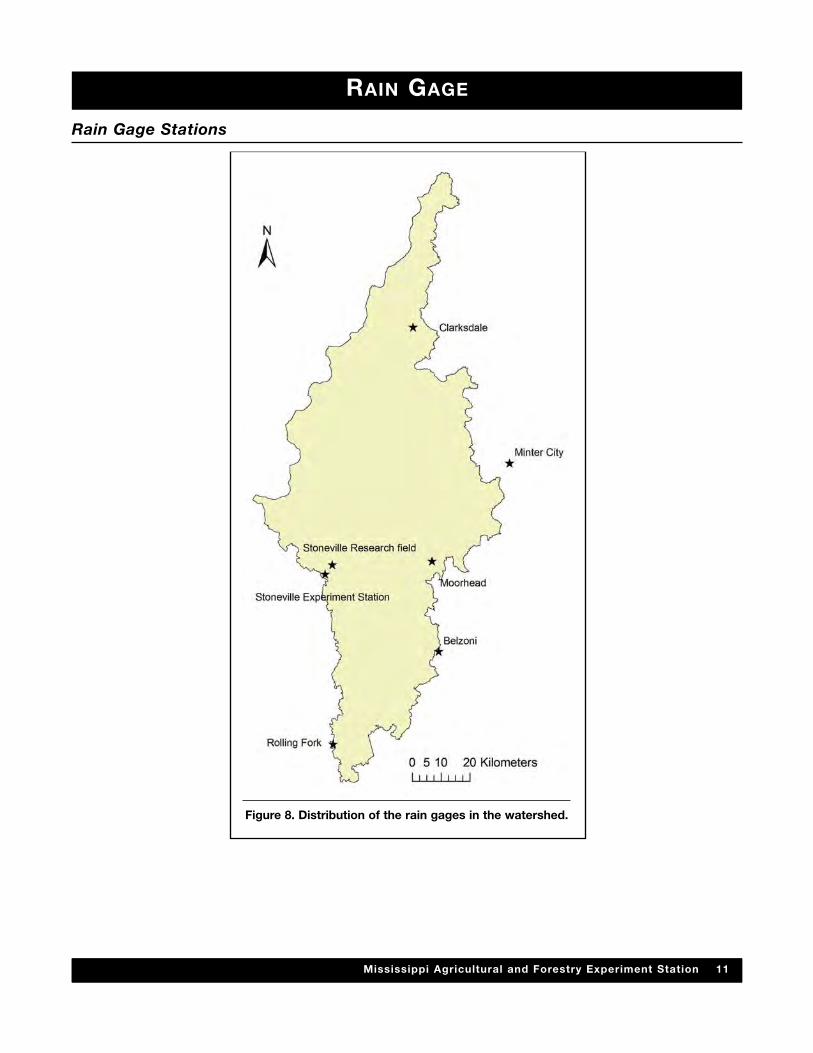
Figure 8. Distribution of the rain gages in the watershed.
Rain Gage Stations
12 Big Sunflower River Watershed Assessment: Preliminary Report
Table 5. Coordinates and elevations of the rain gage locations used by the model.
Name Latitude (degrees) Longitude (degrees) Elevation (m)Clarksdale 34.18 -90.55 52.8Stoneville Research Field 33.45 -90.87 36.0Moorhead 33.45 -90.50 35.7Minter City 33.75 -90.20 44.2Stoneville Experiment Station 33.42 -90.90 38.7Belzoni 33.17 -90.48 35.1Rolling Fork 32.88 -90.88 32.0
Rain Gage Data
Table 4. Location of rain gage stations for each subbasin assigned by the model.
Subbasin Station Subbasin Station
1 Clarksdale 20 Moorhead2 Clarksdale 21 Stoneville Research Field3 Clarksdale 22 Stoneville Research Field4 Clarksdale 23 Moorhead5 Clarksdale 24 Moorhead6 Stoneville Research Field 25 Stoneville Research Field7 Clarksdale 26 Stoneville Research Field8 Moorhead 27 Stoneville Research Field9 Clarksdale 28 Moorhead
10 Minter City 29 Stoneville Experiment Station11 Minter City 30 Stoneville Experiment Station12 Minter City 31 Belzoni13 Minter City 32 Belzoni14 Stoneville Research Field 33 Rolling Fork15 Stoneville Research Field 34 Rolling Fork16 Moorhead 35 Rolling Fork17 Moorhead 36 Rolling Fork18 Moorhead 37 Rolling Fork19 Stoneville Research Field
Mississippi Agricultural and Forestry Experiment Station 13
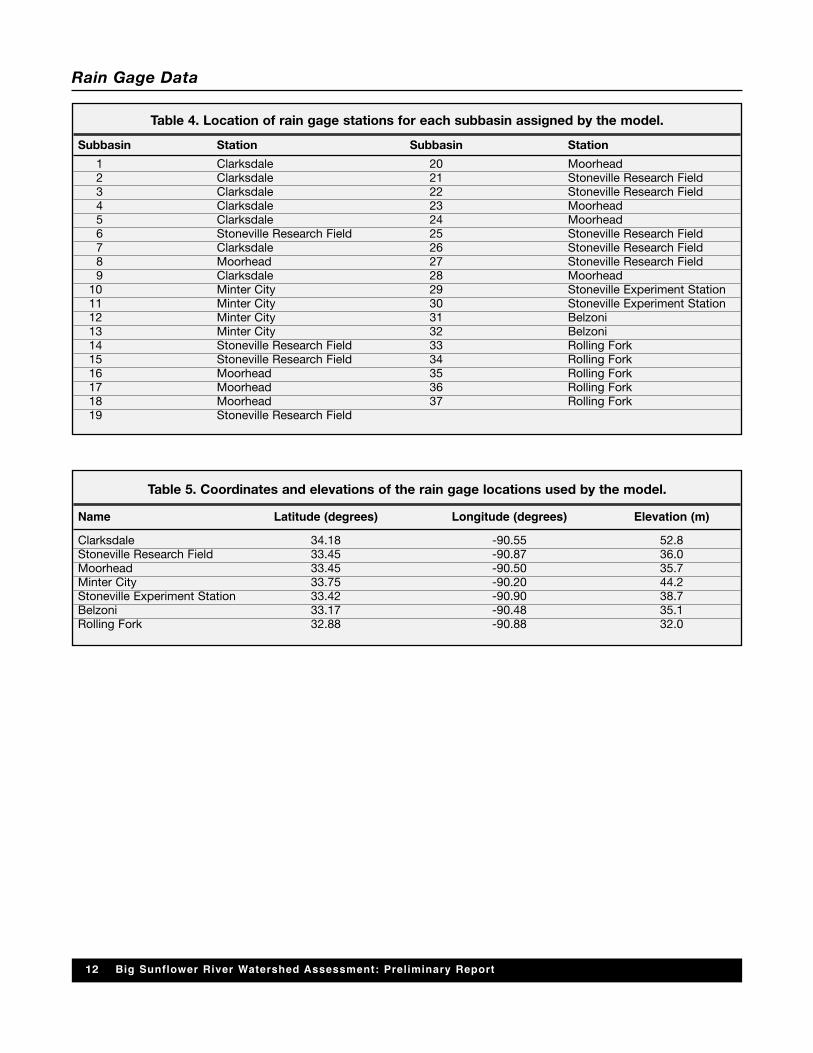
Figure 9. Distribution of hydrologic soil groups within the watershedused by the model. Note: Group A = low runoff potential when verywet; Group B = moderately low runoff potential when very wet;Group C = moderately high runoff potential when very wet; andGroup D = high runoff potential when very wet.
HYDROLOGIC SOIL GROUP
14 Big Sunflower River Watershed Assessment: Preliminary Report
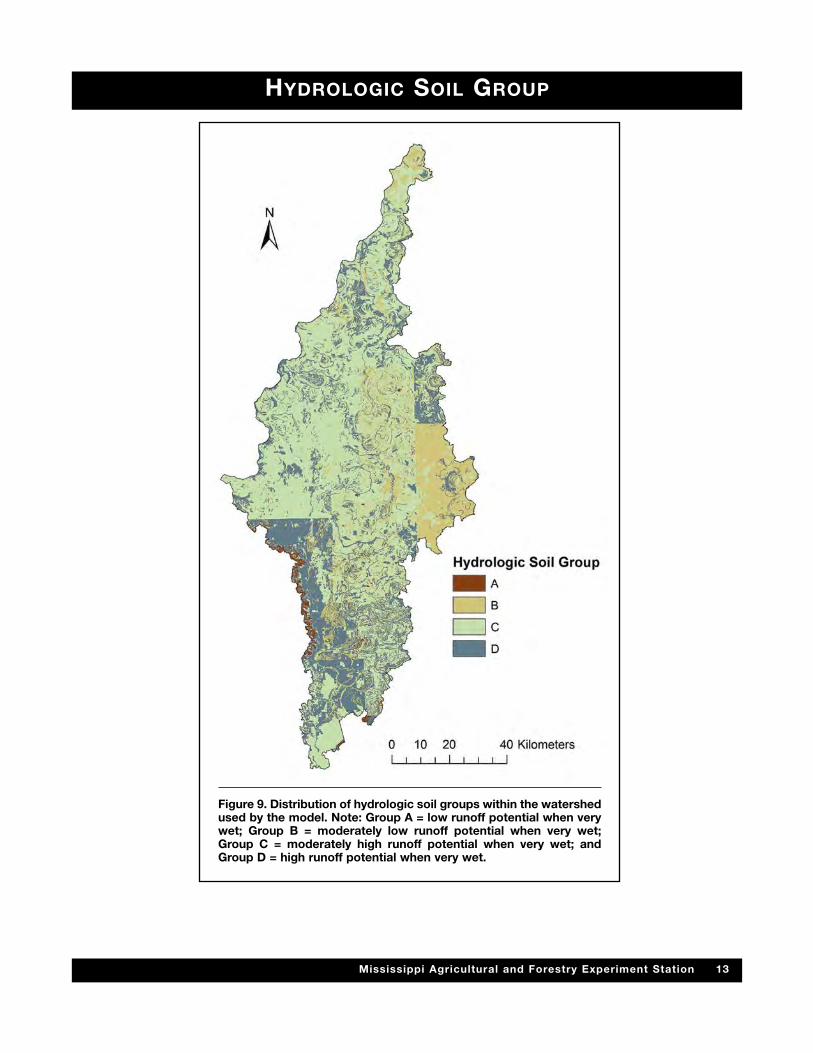
Figure 10. Distribution of elevation ranges within thewatershed based on digital elevation model (DEM) grids.
ELEVATION
Mississippi Agricultural and Forestry Experiment Station 15
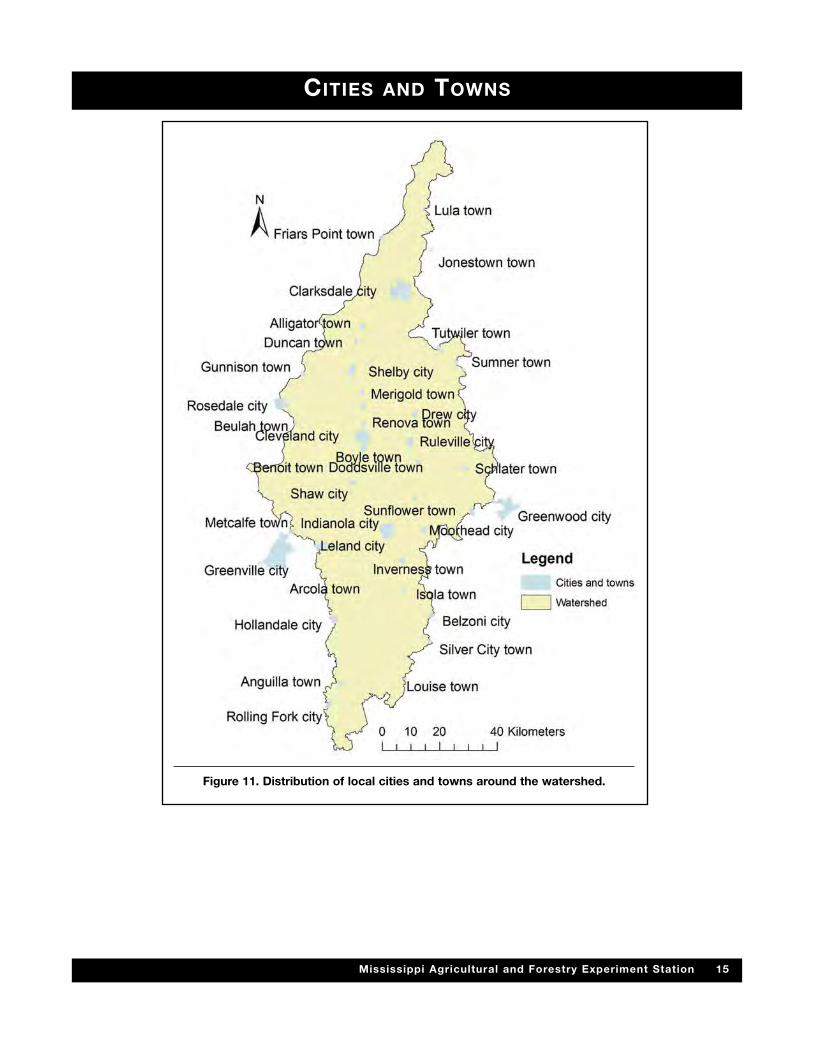
CITIES AND TOWNS
Figure 11. Distribution of local cities and towns around the watershed.
16 Big Sunflower River Watershed Assessment: Preliminary Report
POPULATION BY COUNTY
PRELIMINARY RESULTS
Table 6. Estimated populations of each county.1
County Population County Population
Bolivar 41,000 Sunflower 34,000Coahoma 31,000 Washington 63,000Humphreys 11,000 Sharkey 7,000
1Polidata, 2002.
This research evaluated spatially and temporallyvariable crop production within the watershed.Modeling methods were developed to model crop yieldin the BSRW. The Soil and Water Assessment Tool(SWAT) model was applied to evaluate averagemonthly flow and annual crop production. The SWATmodel was calibrated from 2001 to 2005 and validatedfrom 2006 to 2010 using three USGS gage stations andmonthly measured stream flow data. Preliminaryresults of the calibrated and validated SWAT modeldetermined reasonable performance for mean monthlystream flow prediction with average R2 values of 0.73
during model calibration and average R2 value of 0.80during model validation. SWAT/crop model resultsshowed reasonable performance for corn and soybeanyield from the Delta Branch Experiment Station inStoneville during model calibration, as well as reason-able performance with Clarksdale experiment dataduring model validation. The preliminary results of theSWAT model demonstrated spatial distribution of thecrop yields from each subbasin, which helps to identifyimportant subbasins in the watershed for crop produc-tion.
BEEF COWS
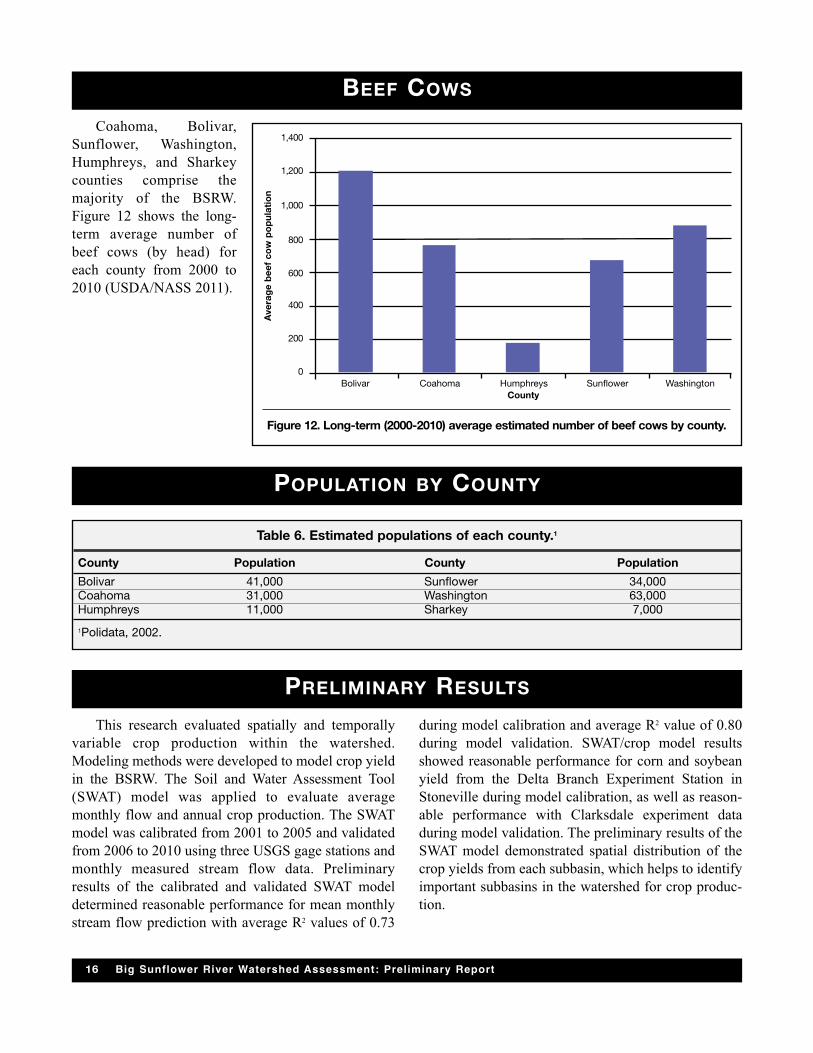
Figure 12. Long-term (2000-2010) average estimated number of beef cows by county.
Coahoma, Bolivar,Sunflower, Washington,Humphreys, and Sharkeycounties comprise themajority of the BSRW.Figure 12 shows the long-term average number ofbeef cows (by head) foreach county from 2000 to2010 (USDA/NASS 2011).
Bolivar Coahoma Humphreys Sunflower WashingtonCounty
Average beef cow population
1,400
1,200
1,000
800
600
400
200
0
Mississippi Agricultural and Forestry Experiment Station 17
DISCUSSIONBased on SWAT simulation results, the water yield
and crop yield from the watershed subbasins werefound to be spatially variable. Crop yield was depen-dent on the management practices, topography,
land-use conditions, and weather conditions in thewatershed. This study helps watershed managers toprioritize areas in the watershed.
ACKNOWLEDGMENTSWe acknowledge the support of the Mississippi
Soybean Promotion Board (MSPB) and SpecialResearch Initiatives (SRI)/Mississippi Agricultural andForestry Experiment Station (MAFES) at Mississippi
State University. We also acknowledge the input ofTom Cathcart, Fei Yu, Jason Ward, and Dennis Rowe inimproving the quality of this report.
REFERENCESMississippi Department of Environmental Quality
(MDEQ). 2003. TMDL for Organic Enrichment,Nutrients and Sediment for the Big Sunflower RiverYazoo River Basin. MDEQ. Available at:http://www.deq.state.ms.us/Mdeq.nsf/pdf/TWB_BigSunDOandSedimentJun03/$File/YazooRBBigSunflowerDOSedimentJun03.pdf?OpenElement. Accessed on3/14/2012.
Mississippi Department of Environmental Quality(MDEQ). 2002. Fecal Coliform TMDL for the BigSunflower River. MDEQ. Available at:http://www.deq.state.ms.us/mdeq.nsf/pdf/TWB_BigSunPathogenOct02/$File/YazooRBBigSunflowerPathogenOct03.pdf?OpenElement. Accessed on 3/14/2012.
Shane Powers. 2007. Agricultural Water Use in theMississippi Delta. 147 in Proceedings, 37th AnnualMississippi Water. Resources Research Conference,Jackson, Mississippi, April 24-25, 2007.
American Rivers, 2004. America’s Most EndangeredRivers of 2004. Available at: http://www.american-rivers.org/assets/pdfs/mer-past-reports/2004reportc2f1.pdf. Accessed on 3/14/2012
Mississippi Department of Environmental Quality(MDEQ). 2007. MDEQ 2007. State of Mississippiwater quality criteria for intrastate, and interstate,coastal waters. Available at:http://water.epa.gov/scitech/swguidance/standards/upload/2008_10_17_standards_wqslibrary_ms_ms_4_wqs.pdf. Accessed on 3/14/2012
Holmes, E.T. 2004. Organization Building of theSoutheastern Water Resources Research andEnvironmental Policy Consortium. Final report for U.S.EPA Southeastern Regional Small Drinking WaterTechnical Assistance Center (SE-TAC) grant (MSU259905-01/UM #300222132A). Department of CivilEngineering, University of Mississippi.
Mississippi Department of Environmental Quality(MDEQ). 2003. Proposed TMDL for OrganicEnrichment, Nutrients and Sediment for the BigSunflower River. June 2003.
Yazoo Mississippi Delta Joint Water ManagementDistrict. 2005. Sunflower River low flow well fieldproject. Information Bulletin.
Tagert, M.L. 2006. Ph.D. dissertation. Water quality,modeling, and land use investigations in the UpperPearl River basin of east-central Mississippi.Department of Plant and Soil Sciences, MississippiState University.
U.S. Department of Agriculture, National AgriculturalStatistics Service (USDA/NASS). 2011. MississippiCounty Data- Livestock. United States Department ofAgriculture (USDA). Available at:http://www.nass.usda.gov/Statistics_by_State/Mississippi/Publications/ County_Estimates/index.asp.Accessed on 3/15/2012.

Discrimination based upon race, color, religion, sex, national origin, age, disability, or veteran's status is a violation of federal and state law and MSU policy andwill not be tolerated. Discrimination based upon sexual orientation or group affiliation is a violation of MSU policy and will not be tolerated.
Mention of a trademark or proprietary product does not constitute a guarantee orwarranty of the product by the Mississippi Agricultural and Forestry Experiment Station anddoes not imply its approval to the exclusion of other products that also may be suitable.
Printed on Recycled Paper