Big Risks, Better Alternatives - Union of Concerned Scientists · Big Risks, Better Alternatives...
57
Big Risks, Better Alternatives An Examination of Two Nuclear Energy Projects in the U.S. October 6, 2011 AUTHORS Max Chang, David White, Ezra Hausman, Nicole Hughes, and Bruce Biewald
-
Upload
dinhnguyet -
Category
Documents
-
view
217 -
download
0
Transcript of Big Risks, Better Alternatives - Union of Concerned Scientists · Big Risks, Better Alternatives...
Big Risks, Better Alternatives
An Examination of Two Nuclear Energy Projects in the U.S. October 6, 2011
AUTHORS
Max Chang, David White, Ezra Hausman, Nicole
Hughes, and Bruce Biewald

Acknowledgements
This study was prepared by Synapse Energy Economics, Inc. for the Union of Concerned
Scientists (UCS). We are grateful to the following people for reviewing this paper: Steve
Clemmer and Ellen Vancko of UCS, Sara Barczak and John Wilson of the Southern Alliance for
Clean Energy, and Susan Glickman and Jamie Whitlock. Melissa Schultz provided editorial
support. This report has benefited from their insights. However, any error or omission in this
report is the responsibility of the authors.
Table of Contents
1. EXECUTIVE SUMMARY .................................................................................................... 1
BACKGROUND ........................................................................................................................ 1
THE PURPOSE OF THIS REPORT ............................................................................................ 1
KEY FINDINGS ........................................................................................................................ 2
POLICY IMPLICATIONS ............................................................................................................ 4
2. INTRODUCTION ................................................................................................................. 6
COST ASSUMPTIONS .............................................................................................................. 6
Subsidies 7
STRUCTURE OF THIS REPORT ............................................................................................... 7
3. FLORIDA: LEVY 1 AND 2 ................................................................................................. 9
COST ESCALATION & DELAYS ............................................................................................... 9
HIGH COSTS & RISKS TO RATEPAYERS .............................................................................. 12
BETTER ALTERNATIVES AVAILABLE IN FLORIDA .................................................................. 14
Time on Our Side 14
Energy Efficiency 15
Renewable Energy 17
FINDINGS & RECOMMENDATIONS ........................................................................................ 19
4. GEORGIA: VOGTLE 3 AND 4 ........................................................................................ 21
LACK OF TRANSPARENCY AND ASSOCIATED RISKS ............................................................ 22
COST RECOVERY MECHANISMS: SHIFTING RISKS TO RATEPAYERS.................................. 24
LOAN GUARANTEES AND THE PTC: SHIFTING RISKS TO TAXPAYERS ................................ 24
BETTER ALTERNATIVES AVAILABLE IN GEORGIA ................................................................ 26
Time on Our Side 26
Energy Efficiency 27
Renewable Energy 29
FINDINGS & RECOMMENDATIONS ........................................................................................ 31
APPENDIX A: NUCLEAR COSTS AND RISKS ..................................................................... 33
COST ESCALATION RISK ...................................................................................................... 34
ADDITIONAL RESEARCH ....................................................................................................... 35
APPENDIX B: DETAILED LEVELIZED COST INPUTS ....................................................... 39
NUCLEAR PROJECT INPUTS ................................................................................................. 39
Levy Specific Inputs 39
Vogtle Specific Inputs 39
COST INFORMATION SOURCES ............................................................................................ 40
GENERAL INPUT ASSUMPTIONS ........................................................................................... 41
APPENDIX C: GENERATION MIX FOR PROGRESS ENERGY FLORIDA AND GEORGIA
POWER ......................................................................................................................................... 42
APPENDIX D: DRIVERS OF COST UNCERTAINTY ............................................................ 44
Capital Costs 44
Fuel Costs 44
Greenhouse Gas Costs and Other Regulatory Risks 45
Inflation Rates, Technology Progress, and Learning by Doing 45
APPENDIX E: COST OF ENERGY EFFICIENCY .................................................................. 46
APPENDIX F: COST OF GREENHOUSE GAS ABATEMENT ........................................... 48
APPENDIX G: RENEWABLE POTENTIAL IN GEORGIA ................................................... 51
BIOMASS POTENTIAL ............................................................................................................ 51
OFFSHORE WIND ................................................................................................................. 52
Big Risks, Better Alternatives ▪ 1
1. Executive Summary
Background
In 2011, nearly three decades after the last nuclear power plant came online in the United States,
developers are pushing forward with a new generation of nuclear energy resources. There are
now more than 20 applications before the Nuclear Regulatory Commission to build new nuclear
plants or expand existing U.S. plants.1 This reawakening of the nation’s nuclear power industry is
generating considerable debate—in part due to the costly bailouts asked of American tax- and
ratepayers to cover hundreds of billions in cost overruns and plant abandonments in the past,
coupled with soaring price tags for many proposed reactors.
Proponents of the nuclear resurgence argue that the latest generation of reactors, which are more
standardized in design than their predecessors, will not be exposed to the same cost and
performance uncertainty as prior nuclear projects in the United States. Nuclear energy is also
touted as a necessary part of the equation to reduce carbon emissions and address climate
change.
Recent experience in the nuclear energy industry world-wide is calling these assumptions into
question. Nuclear projects in Finland and France are experiencing significant delays and cost
overruns. The Fukushima Dai-Ichi plant disaster is raising even broader questions about nuclear
safety and associated costs and risks; following the crisis in Japan, Germany announced that it
will shut down all 17 of its nuclear reactors by 2022, while Switzerland and Italy have abandoned
plans to build new reactors.
At the same time, forecasts for energy demand growth in the U.S. are much lower than they were
just five years ago: demand for electricity declined during the economic recession, post-recession
growth has been sluggish, and demand-side load reduction initiatives have helped to temper
growth still further. On the supply side, renewable portfolio standards in numerous states have
further reduced the need for additional thermal resources. Thus the argument that new baseload
generation is urgently needed for supply reliability is not as credible as it might have been when
many of the new-generation nuclear energy projects were first proposed.
The Purpose of this Report
In light of these trends, this report takes a close look at two modern-day nuclear energy projects in
the U.S. The first project consists of two units, Levy 1 and 2, which have been proposed by
Progress Energy Florida for a new site in Levy County, Florida. The second project also consists
of a pair of units, Vogtle 3 and 4, which would be constructed at the site of the existing two-unit
Vogtle nuclear power facility in Burke County, Georgia.2 Site preparation work has already begun
for the Vogtle units by a consortium consisting of Georgia Power (a subsidiary of Southern
Company) and several municipal and cooperative electric utilities. Both of these projects were
proposed in 2006, before the recession, to meet then-anticipated growth in demand.
1 http://nrc.gov/reactors/new-reactors/new-licensing-files/expected-new-rx-applications.pdf
2 Georgia Power, a subsidiary of Southern Company, owns 45.7 percent of the proposed plant. Other owners
include Oglethorpe Power (30 percent), MEAG Power (22.7 percent), and the City of Dalton, GA (1.6 percent).
Big Risks, Better Alternatives ▪ 2
The Levy project in Florida and the Vogtle project in Georgia provide illuminating case studies for
the next phase of nuclear power generation in the United States for a number of reasons:
They both propose to use the same “modular” reactor design: the Westinghouse AP1000
reactor, which is the same technology proposed by approximately one-half of the
applications for new reactors filed with the U.S. Nuclear Regulatory Commission (NRC).
They are both proposed in states where legislation allows utilities to recover project costs
from ratepayers years before the reactors will actually come online.
They represent different construction scenarios: a new “greenfield” power plant versus an
expansion of an existing plant.
They have different financing situations: the Vogtle project enjoys two subsidies that are
not factored in the Levy project—a federal loan guarantee and production tax credits.
The Vogtle project has a lower degree of transparency than Levy: Georgia Power has
classified almost all cost and schedule information as “trade secret,” while much of the
information regarding Levy projections is publicly available.
Construction progress varies: excavation and site preparation work has commenced for
Vogtle 3 and 4, while site work for Levy 1 and 2 has been suspended.3
This report evaluates both nuclear energy projects, and then compares them to potential
alternatives that are capable of meeting projected consumer demand in their respective states
with low- or no-carbon resources at lower cost and risk.
Key Findings
Our analysis finds that there are major risks associated with the construction of both the Levy and
Vogtle projects. While the AP1000 reactor represents a more standardized design than existing
U.S. reactors, it has never been built in this country nor completed in any country. Nuclear power
construction is still a very complicated process with numerous unknowns that can negatively
impact plant economics. Risks for these projects include cost escalation, construction and
regulatory delays, and lack of transparency (for the Vogtle project), all of which could lead to much
higher costs to ratepayers. Using the companies’ current cost estimates:
By 2021, the Levy project will add at least $718 per year to the bill of a typical Progress
Energy residential customer using 1,100 kWh per month; and
By 2018, the Vogtle project will add at least $120 per year to the bill of a Georgia Power
residential customer using 1,000 kWh per month.
If history is our guide, these cost estimates are likely to increase dramatically over time. The
anticipated cost and rate impact for the Vogtle project, in particular, could increase significantly;
the redaction of all cost and schedule data for this project has hindered independent analysis of
the underlying assumptions that have allowed Georgia Power to maintain old cost estimates
3 Progress notes in its November 8, 2010 Form 10-Q that “excavation and foundation preparation work anticipated
in the initial schedule cannot begin until the COL is issued, resulting in a project shift of at least 20 months. Since then, regulatory and economic conditions identified in the 2010 nuclear cost-recovery filing have changed such that major construction activities on the Levy project are being postponed until after the NRC issues the COL, expected in late 2012 if the current licensing schedule remains on track” (p. 24).
Big Risks, Better Alternatives ▪ 3
despite major changes in economic and regulatory conditions over the past five years. This lack of
transparency puts Georgia Power’s ratepayers at significant risk for major price hikes in the
coming years.
By comparison, based on publically available data, there are alternative options readily available
to Progress Energy and Georgia Power that could meet consumers’ energy needs and be
implemented at a lower cost, with far less risk to ratepayers. Energy sales growth for both of these
companies has slowed considerably compared to earlier projections, making it is possible to meet
their future retail energy sales growth through smaller increments of alternative demand- and
supply-side resources. These options include increased energy efficiency and renewable energy
development.
Our analysis shows that both Florida and Georgia have significant room for improvement when it
comes to energy efficiency investment. According to the American Council for an Energy-Efficient
Economy (ACEEE), in 2010, Georgia ranked 37th overall and Florida ranked 30th overall among
U.S. states as benchmarked against six energy efficiency categories.4
- In Florida: The Florida Public Service Commission (PSC) recently approved scaled-back
demand-side management plans for Progress that are projected to capture a maximum of
2 percent energy savings over a 10-year period.5 If Progress were to pursue an EE target
of 15 percent cumulative load reduction over the same timeframe, it could maintain its
energy load below peak 2006 levels based on its 2010 10-Year Site Plan retail sales
forecast.
- In Georgia: The state currently has no energy efficiency targets. Recent reports support
the fact that the state has large, untapped energy efficiency potential.
Both states also have significant potential for increased development of renewable energy
resources. No meaningful renewable energy standards currently exist in Florida or Georgia.6
- In Florida: A 2008 Navigant Consulting report prepared for the Florida Public Service
Commission found that, even without the benefit of Renewable Energy Certificates, the
achievable installed renewable capacity in the state could account for 4 to 16 percent of
electricity sales in 2020.7
In Georgia: Available studies indicate that the renewable energy potential in the state
could meet much of the state’s future energy needs. A 2009 Southern Alliance for Clean
Energy (SACE) report identified statewide renewable energy potential equal to
approximately 27 percent of 2008 retail electricity sales.8
4 These benchmark categories include 1) program funding and policy, 2) transportation, 3) building energy, 4)
combined heat and power, 5) state government initiatives, and 6) appliance efficiency. The full report is available at www.aceee.org/sector/state-policy/scorecard. 5 Southern Alliance for Clean Energy’s projection of the state energy savings impact over a 10-year period of the
scaled-back demand-side management plans for Progress Energy Florida and Florida Power and Light. The Florida PSC had set a higher energy savings goal in 2009 of 3.5 percent over a 10-year period, but the recently scaled-back demand-side management plans for the state’s two largest investor-owned utilities has significantly reduced the energy savings goal. 6 http://apps1.eere.energy.gov/states/maps/renewable_portfolio_states.cfm 7 http://www.psc.state.fl.us/utilities/electricgas/RenewableEnergy/FL_Final_Report_2008_12_29.pdf
8 Southern Alliance for Clean Energy. Yes We Can: Southern Solutions for a National Renewable Energy Standard.
Revised February 23, 2009. Report available at www.cleanenergy.org/images/files/SERenewables022309rev.pdf.
Big Risks, Better Alternatives ▪ 4
Available EE and RE alternatives are not only capable of meeting the projected growth in demand
for each state at a lower cost than adding new nuclear capacity, but they also provide the benefit
of reducing each state’s greenhouse gas emissions. While neither Florida nor Georgia currently
has established carbon reduction goals, the ability of the studied alternatives to reduce
greenhouse gas emissions is important to note in comparing the overall impact of these options to
the proposed nuclear projects.
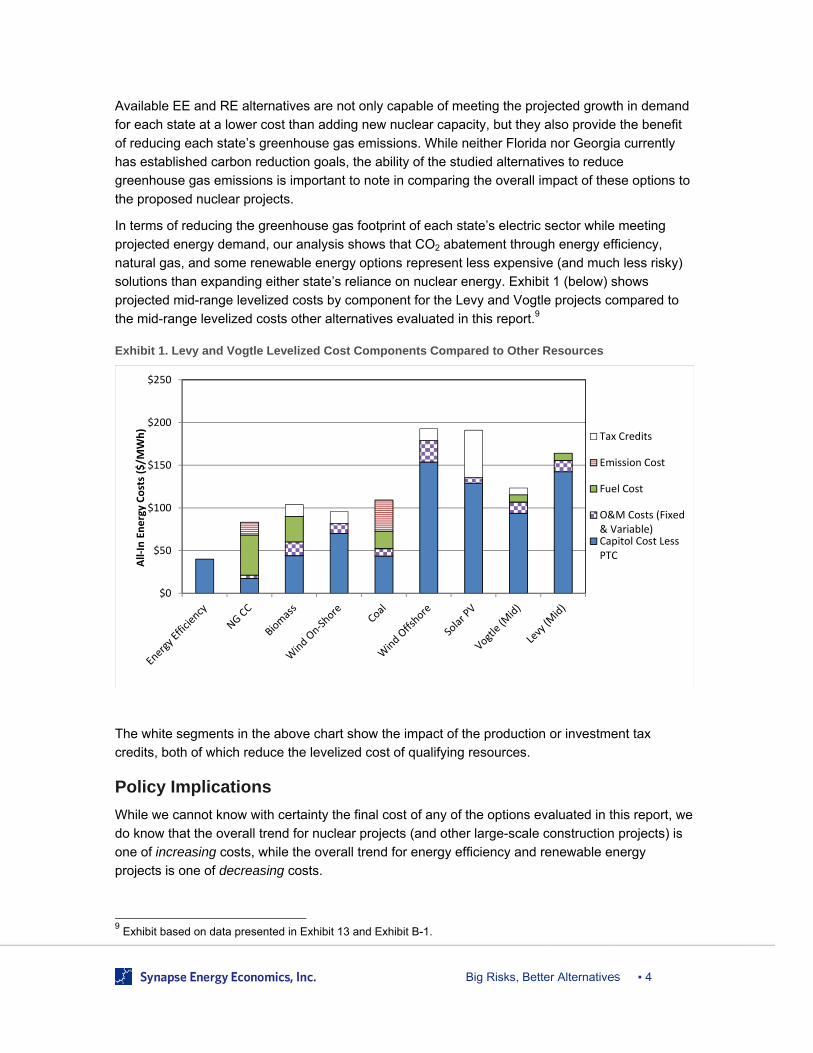
In terms of reducing the greenhouse gas footprint of each state’s electric sector while meeting
projected energy demand, our analysis shows that CO2 abatement through energy efficiency,
natural gas, and some renewable energy options represent less expensive (and much less risky)
solutions than expanding either state’s reliance on nuclear energy. Exhibit 1 (below) shows
projected mid-range levelized costs by component for the Levy and Vogtle projects compared to
the mid-range levelized costs other alternatives evaluated in this report.9
Exhibit 1. Levy and Vogtle Levelized Cost Components Compared to Other Resources
The white segments in the above chart show the impact of the production or investment tax
credits, both of which reduce the levelized cost of qualifying resources.
Policy Implications While we cannot know with certainty the final cost of any of the options evaluated in this report, we
do know that the overall trend for nuclear projects (and other large-scale construction projects) is
one of increasing costs, while the overall trend for energy efficiency and renewable energy
projects is one of decreasing costs.
9 Exhibit based on data presented in Exhibit 13 and Exhibit B-1.
$0
$50
$100
$150
$200
$250
All‐In Energy Costs ($/M
Wh)
Tax Credits
Emission Cost
Fuel Cost
O&M Costs (Fixed& Variable)Capitol Cost LessPTC
Big Risks, Better Alternatives ▪ 5
Moreover, there is considerable reason to believe that the Levy and Vogtle projects will present
much greater risks and added costs for consumers than those anticipated by the projects’
sponsors. The question is “to what degree?” And, why should ratepayers bear these sizable risks,
when viable alternatives can meet energy needs and achieve environmental goals at lower cost?
Our analysis strongly suggests that both Florida and Georgia should reexamine their decision to
place the risk of new nuclear construction on the states’ ratepayers, and instead pursue options
that are more cost-effective and environmentally sustainable to meet their energy needs.
Specifically:
Florida should take steps to increase energy efficiency targets to levels more consistent
with leading states. Achieving an EE target of 15 percent over ten years would allow
Progress Energy to meet its projected energy sales growth without the Levy units. With
additional investment in renewable energy resources, Progress could retire some older,
less-efficient, and more expensive generating plants—in addition to the coal-fired Crystal
River plant, which is already slated for retirement.
Georgia should commission new energy efficiency and renewable energy studies for the
entire state, and take steps to set statewide energy efficiency and renewable energy
targets. Existing studies suggest that Georgia Power could viably and economically meet
its projected energy sales growth through a reasonable mix of energy efficiency and
renewable energy resources—without the Vogtle units.
Pursuing these alternatives would enable Florida and Georgia to reliably meet demand growth and
reduce carbon emissions at lower cost and with less risk than through the proposed Levy and
Vogtle projects.
Big Risks, Better Alternatives ▪ 6
2. Introduction A nuclear power plant has not been built in the United States since the early 1980s. Now, after 30
years of inactivity, the nuclear industry is seeking approval for a new generation of nuclear
resources in the U.S.; nearly two dozen proposed projects are currently filed with the Nuclear
Regulatory Commission.
This report takes a close look at two of these proposed projects: Levy 1 and 2 in Florida, and
Vogtle 3 and 4 in Georgia. Costs and risks associated with these projects are evaluated, and then
compared to alternative options capable of meeting the sought-after energy and carbon reduction
goals.
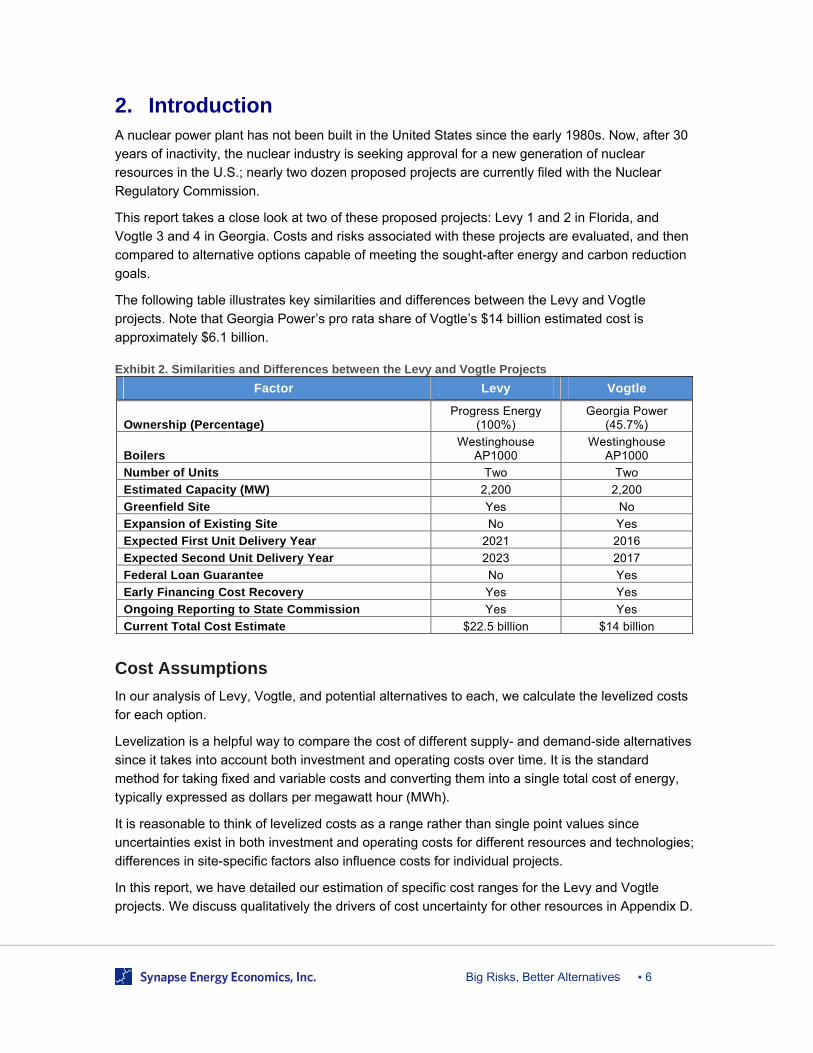
The following table illustrates key similarities and differences between the Levy and Vogtle
projects. Note that Georgia Power’s pro rata share of Vogtle’s $14 billion estimated cost is
approximately $6.1 billion.
Exhibit 2. Similarities and Differences between the Levy and Vogtle Projects
Factor Levy Vogtle
Ownership (Percentage) Progress Energy
(100%) Georgia Power
(45.7%)
Boilers Westinghouse
AP1000 Westinghouse
AP1000
Number of Units Two Two
Estimated Capacity (MW) 2,200 2,200
Greenfield Site Yes No
Expansion of Existing Site No Yes
Expected First Unit Delivery Year 2021 2016
Expected Second Unit Delivery Year 2023 2017
Federal Loan Guarantee No Yes
Early Financing Cost Recovery Yes Yes
Ongoing Reporting to State Commission Yes Yes
Current Total Cost Estimate $22.5 billion $14 billion
Cost Assumptions
In our analysis of Levy, Vogtle, and potential alternatives to each, we calculate the levelized costs
for each option.
Levelization is a helpful way to compare the cost of different supply- and demand-side alternatives
since it takes into account both investment and operating costs over time. It is the standard
method for taking fixed and variable costs and converting them into a single total cost of energy,
typically expressed as dollars per megawatt hour (MWh).
It is reasonable to think of levelized costs as a range rather than single point values since
uncertainties exist in both investment and operating costs for different resources and technologies;
differences in site-specific factors also influence costs for individual projects.
In this report, we have detailed our estimation of specific cost ranges for the Levy and Vogtle
projects. We discuss qualitatively the drivers of cost uncertainty for other resources in Appendix D.
Big Risks, Better Alternatives ▪ 7
The levelized costs of these alternative resources are provided as points of comparison to the
proposed nuclear projects.
To identify a cost range for the Levy and Vogtle projects, we first determined the low end of the
range by converting the project costs currently reported by the two companies to levelized costs.
High-end cost estimates for the two projects were determined based on historical precedent for
the two companies. Historical information provides a reasonable, if uncertain, proxy for future
nuclear construction costs associated with a new, unproven design.10
The intention of the levelized cost analysis is to provide ratepayers and policymakers with a useful
and plausible range of costs to reference in considering these two projects. However, our costs for
these projects do not include nuclear waste disposal and decommissioning costs, which are
another, albeit uncertain, cost component of nuclear power. These cost ranges, expressed in
dollars per megawatt hour, are discussed in Sections 3 and 4 of this report.
The range in our cost estimates reflects the uncertainty associated with developing complex
projects with the newly designed AP1000 reactor in this country. More detail about our levelized
cost inputs is provided in Appendix B.
Subsidies
An important factor influencing the levelized cost of electricity for the Vogtle project is the
availability of a Production Tax Credit (PTC) of $0.018 per kWh for the first 6,000 MW of capacity
(nationwide) for the first eight years of operation. This PTC is capped at $125 million per year per
1,000 MW of capacity.
The PTC was included as part of the Energy Policy Act of 2005, and currently requires a unit to
have an in-service date before January 1, 2021. In our calculations of the levelized cost for Vogtle
3 and 4, which are currently scheduled to come online in 2016 and 2017, we have assumed that
both units will receive the full amount of the PTC. On the other hand, in our analysis of the Levy
project, we have assumed that Levy 1, slated for delivery in 2021, will not meet the PTC cut-off
date. Levy 2, which is projected to come online in 2023, does not receive the PTC either.
While the PTC reduces the cost of the Vogtle project for developers and, ultimately, ratepayers, it
is not free money. The project costs covered by the PTC are paid by taxpayers.
Capital costs for Vogtle 3 and 4 also include the impact of a federal loan guarantee that is
discussed later in this report. In addition to reducing the borrowing costs, a major impact of the
loan guarantee will be an increase in the debt fraction and a significant decrease in the equity
costs. Similar to the PTC, the federal loan guarantee serves to shift risks associated with the
Vogtle project onto taxpayers.
Structure of This Report This report discusses the Levy project in Section 3 and the Vogtle project in Section 4. Findings and recommendations specific to each project are included in these sections.
10
Kessides, I. Nuclear power: Understanding the economic risks and uncertainties. Energy Policy. 38(2010) 3849-3864. As noted by the author, “There is widespread agreement that the best predictors for the future costs of nuclear plants are based on actual experience rather than detailed engineering cost models and estimates.”

Big Risks, Better Alternatives ▪ 8
The appendices that follow provide information relevant to both projects, including nuclear costs and risks, input assumptions, and other important data.
Big Risks, Better Alternatives ▪ 9
3. Florida: Levy 1 and 2 Progress Energy is proposing to build two new reactors, Levy 1 and 2, with a combined generating
capacity of approximately 2,200 megawatts (MW). This greenfield project was originally proposed
in 2006; at the time, Progress was proposing one 1,100 MW unit for the Levy site, at a projected
cost of $2.5 to $3.5 billion.11 In 2008, when Progress filed a petition for an affirmative
Determination of Need, the company changed its proposal to include two reactor units for the Levy
site, with an estimated cost (including Transmission) of approximately $17 billion, and an
expectation that the reactors would come online in 2016.
Cost Escalation & Delays
During the first half of 2010, Progress announced another increase in the expected cost of the
project, from $17 to $22.5 billion.12 The projected cost for the Levy project has already increased
nearly four-fold (per 1,100-MW unit) from Progress Energy’s original estimate in 2006—before
construction work has even begun. Based on an analysis of recent testimony from the company,
we calculate the current projected cost of the two units to be even higher.13
As with prior-generation nuclear projects, Levy’s cost escalation is being driven largely by
regulatory and construction delays. In Progress Energy’s 10-Q filing on November 8, 2010 (“Nov.
8 10-Q”), the company noted that:
In 2009, the NRC Staff determined that certain schedule-critical work that
PEF [Progress Energy Florida] had proposed to perform within the scope of
the Limited Work Authorization will not be authorized until the NRC issues the
COL [Combined Operating License]. Consequently, excavation and
foundation preparation work will be shifted until after COL issuance. This
factor alone resulted in a minimum 20-month schedule shift later than the
originally anticipated timeframe. Since then, regulatory and economic
conditions have changed, resulting in additional schedule shifts. These
conditions include the permitting and licensing process, national and state
economic conditions, recent FPSC DSM goals and the resulting impact on
ratepayers, and other FPSC decisions. Uncertainty regarding PEF’s access to
capital on reasonable terms and increasing uncertainty surrounding carbon
regulation and its costs could be other factors to affect the Levy schedule.
With the anticipated delays, Levy 1 is now scheduled for delivery in 2021 and Levy 2 is scheduled
for 2023. If industry experience is a guide, further delays are likely. The company’s 2011 Ten-Year
11 Gainesville Sun. “Utility Eyes Site for Nuclear Plant.” December 13, 2006. Available at http://tinyurl.com/6jm8qmn. 12
Reuters. “Progress ups Levy nuclear costs, delays start.” May 6, 2010. Available at http://www.reuters.com/article/idUSN0611303620100506. 13
Synapse estimates the current cost of the project at $23.9 billion. This is based upon data from John Elnitsky testimony dated May 2, 2011, Exhibit RE-4, and carrying cost allocation from Progress Energy’s 2010 Ten-Year Site Plan dated April 1, 2010.
Big Risks, Better Alternatives ▪ 10
Site Plan, dated March 31, 2011, does not include the proposed Levy project, since it is outside of
the current ten-year planning horizon.14
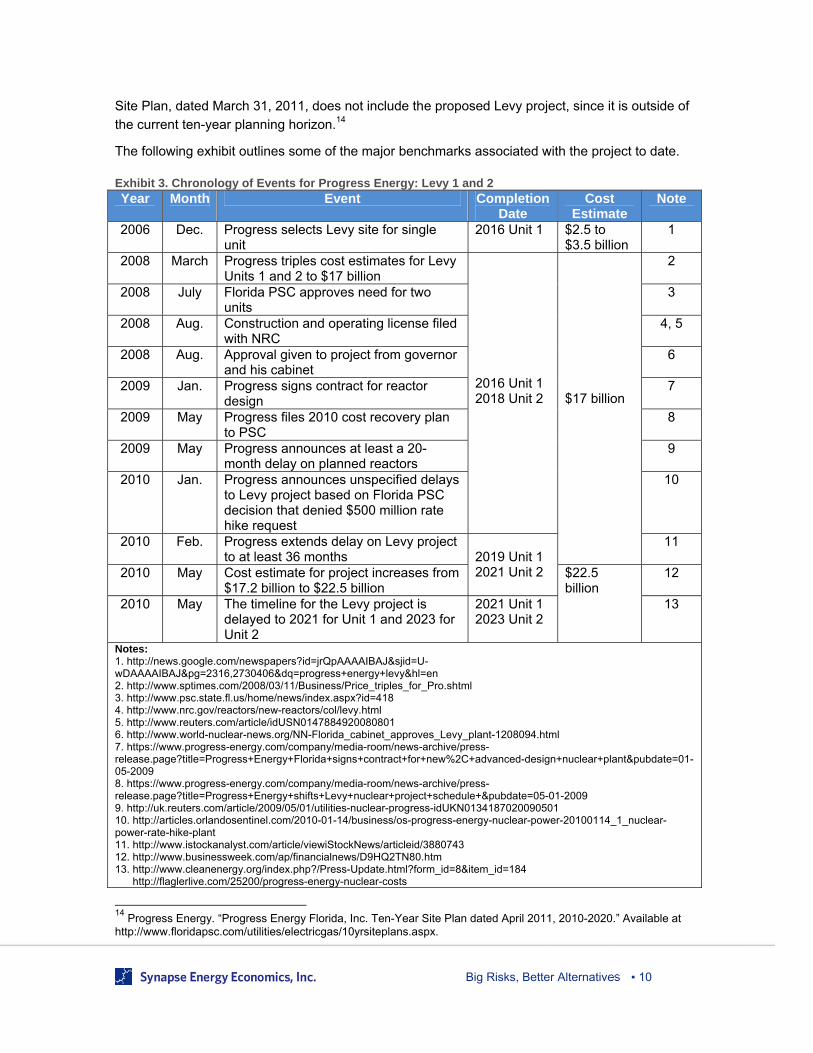
The following exhibit outlines some of the major benchmarks associated with the project to date.
Exhibit 3. Chronology of Events for Progress Energy: Levy 1 and 2 Year Month Event Completion
Date Cost
Estimate Note
2006 Dec. Progress selects Levy site for single unit
2016 Unit 1 $2.5 to $3.5 billion
1
2008 March Progress triples cost estimates for Levy Units 1 and 2 to $17 billion
2016 Unit 1 2018 Unit 2
$17 billion
2
2008 July Florida PSC approves need for two units
3
2008 Aug. Construction and operating license filed with NRC
4, 5
2008 Aug. Approval given to project from governor and his cabinet
6
2009 Jan. Progress signs contract for reactor design
7
2009 May Progress files 2010 cost recovery plan to PSC
8
2009 May Progress announces at least a 20-month delay on planned reactors
9
2010 Jan. Progress announces unspecified delays to Levy project based on Florida PSC decision that denied $500 million rate hike request
10
2010 Feb. Progress extends delay on Levy project to at least 36 months
2019 Unit 1 2021 Unit 2
11
2010 May Cost estimate for project increases from $17.2 billion to $22.5 billion
$22.5 billion
12
2010 May The timeline for the Levy project is delayed to 2021 for Unit 1 and 2023 for Unit 2
2021 Unit 1 2023 Unit 2
13
Notes: 1. http://news.google.com/newspapers?id=jrQpAAAAIBAJ&sjid=U-wDAAAAIBAJ&pg=2316,2730406&dq=progress+energy+levy&hl=en 2. http://www.sptimes.com/2008/03/11/Business/Price_triples_for_Pro.shtml 3. http://www.psc.state.fl.us/home/news/index.aspx?id=418 4. http://www.nrc.gov/reactors/new-reactors/col/levy.html 5. http://www.reuters.com/article/idUSN0147884920080801 6. http://www.world-nuclear-news.org/NN-Florida_cabinet_approves_Levy_plant-1208094.html 7. https://www.progress-energy.com/company/media-room/news-archive/press-release.page?title=Progress+Energy+Florida+signs+contract+for+new%2C+advanced-design+nuclear+plant&pubdate=01-05-2009 8. https://www.progress-energy.com/company/media-room/news-archive/press-release.page?title=Progress+Energy+shifts+Levy+nuclear+project+schedule+&pubdate=05-01-2009 9. http://uk.reuters.com/article/2009/05/01/utilities-nuclear-progress-idUKN0134187020090501 10. http://articles.orlandosentinel.com/2010-01-14/business/os-progress-energy-nuclear-power-20100114_1_nuclear-power-rate-hike-plant 11. http://www.istockanalyst.com/article/viewiStockNews/articleid/3880743 12. http://www.businessweek.com/ap/financialnews/D9HQ2TN80.htm 13. http://www.cleanenergy.org/index.php?/Press-Update.html?form_id=8&item_id=184 http://flaglerlive.com/25200/progress-energy-nuclear-costs
14
Progress Energy. “Progress Energy Florida, Inc. Ten-Year Site Plan dated April 2011, 2010-2020.” Available at http://www.floridapsc.com/utilities/electricgas/10yrsiteplans.aspx.
Big Risks, Better Alternatives ▪ 11
This exhibit shows that the project has already experienced significant cost escalation and multiple
delays. Levy is not alone in this trend. Other modern-day nuclear projects are experiencing similar
escalations in cost, as well as delays due to unforeseen regulatory, construction, and economic
challenges. The Fukushima disaster in Japan is raising nuclear safety questions that could cause
additional delays. See Appendix A for more information.
Given Progress Energy’s announcements and the delay in starting the project, we anticipate that
the company’s most recent estimate of $22.5 billion is unlikely to be the final cost for the Levy
project. Progress’s Nov. 8 10-Q indicates that additional cost and schedule changes are expected:
“…once PEF receives the COL, it will further refine the project timeline and budget.”
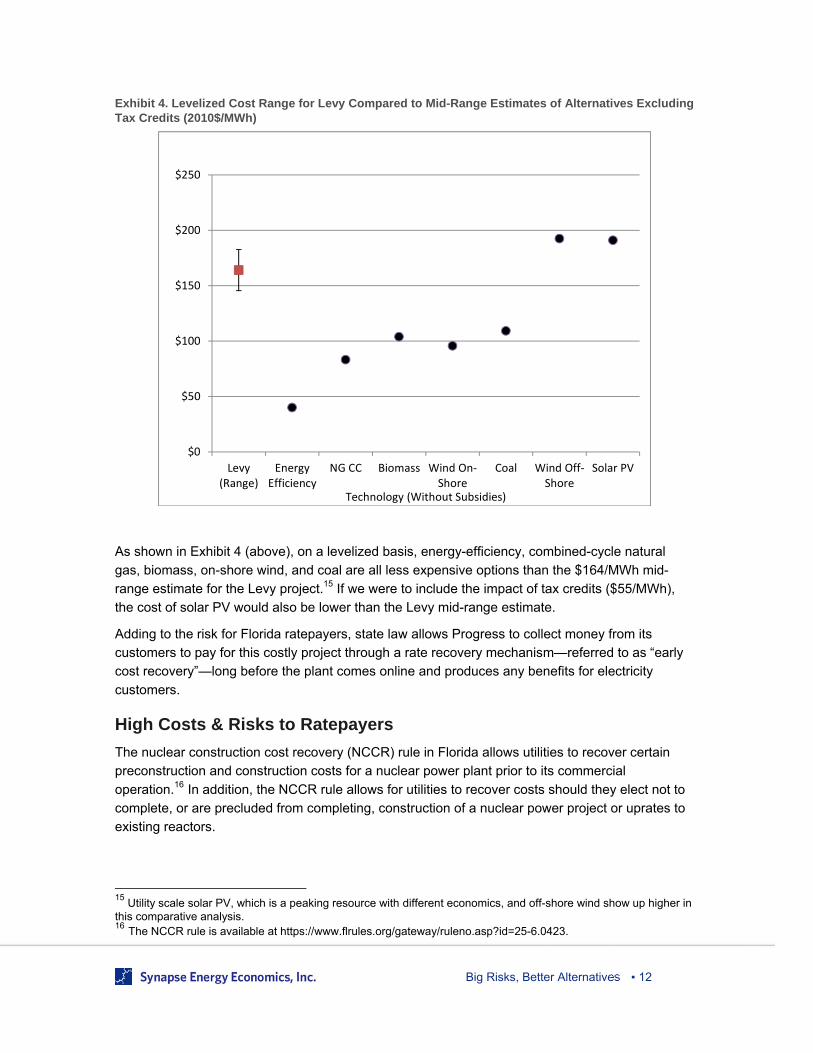
In this report, we estimate the levelized cost range for Levy 1 and 2 to be $146 – $183 per MWh
(see Exhibit 4, below).
Low estimate: In the study, we use the current $22.5 billion project cost as the starting
point, resulting in a low-end levelized cost estimate of $146 per MWh.
High estimate: Given that the project cost for Levy has already increased several times,
our high-end estimate assumes that costs will continue to rise. In the study, the high-end
cost estimate is based on a 30-percent increase in the current cost of the Levy project.
While this number is an estimate (based on Progress Energy’s 30-percent increase in
Levy construction costs between 2008 and 2010), it is certainly a plausible, potential
outcome given Levy’s observed trend of cost increases. The result is a high cost estimate
of $183 per MWh, or $29.3 billion dollars (nominal) for the project when Unit 2 is currently
scheduled for completion in 2023.
Mid-range estimate: The mid-range cost estimate is based on a 15-percent increase in
the current project cost, resulting in an estimate of $164 per MWh, or $25.9 billion dollars
(nominal) for the project when Unit 2 is currently scheduled for completion in 2023.
For the other technology alternatives, we present our mid-range estimates for project installation in
2016, recognizing that there are cost uncertainties for any project.
Big Risks, Better Alternatives ▪ 12
Exhibit 4. Levelized Cost Range for Levy Compared to Mid-Range Estimates of Alternatives Excluding Tax Credits (2010$/MWh)
As shown in Exhibit 4 (above), on a levelized basis, energy-efficiency, combined-cycle natural
gas, biomass, on-shore wind, and coal are all less expensive options than the $164/MWh mid-
range estimate for the Levy project.15 If we were to include the impact of tax credits ($55/MWh),
the cost of solar PV would also be lower than the Levy mid-range estimate.
Adding to the risk for Florida ratepayers, state law allows Progress to collect money from its
customers to pay for this costly project through a rate recovery mechanism—referred to as “early
cost recovery”—long before the plant comes online and produces any benefits for electricity
customers.
High Costs & Risks to Ratepayers
The nuclear construction cost recovery (NCCR) rule in Florida allows utilities to recover certain
preconstruction and construction costs for a nuclear power plant prior to its commercial
operation.16 In addition, the NCCR rule allows for utilities to recover costs should they elect not to
complete, or are precluded from completing, construction of a nuclear power project or uprates to
existing reactors.
15
Utility scale solar PV, which is a peaking resource with different economics, and off-shore wind show up higher in this comparative analysis. 16 The NCCR rule is available at https://www.flrules.org/gateway/ruleno.asp?id=25-6.0423.
$0
$50
$100
$150
$200
$250
Levy(Range)
EnergyEfficiency
NG CC Biomass Wind On‐Shore
Coal Wind Off‐Shore
Solar PV
Technology (Without Subsidies)
Big Risks, Better Alternatives ▪ 13
Progress has already begun collecting money from its customers for the Levy project. In 2010, an
average Progress Energy residential customer using 1,100 kWh a month paid approximately
$7.46 per month, or $89.52 for the year, to fund the Levy project. In 2011, that monthly charge
went down to $6.08 per month ($72.99 for the year) due to schedule changes that delayed
anticipated site work and associated expenses. In recent hearings, Progress Energy has asked to
reduce the monthly charge further, to approximately $5.14 per month, for the Levy project.17
Progress has argued that customers will benefit in the long-run from the NCCR rule through
reduced interest payments associated with financing the construction costs of the project.
However, in reality this policy serves to shift the financing costs of this expensive project from
Progress shareholders to its ratepayers during the construction period. In effect, ratepayers are
forced to provide Progress with an interest-free loan, while the company shifts all the risk to
consumers.
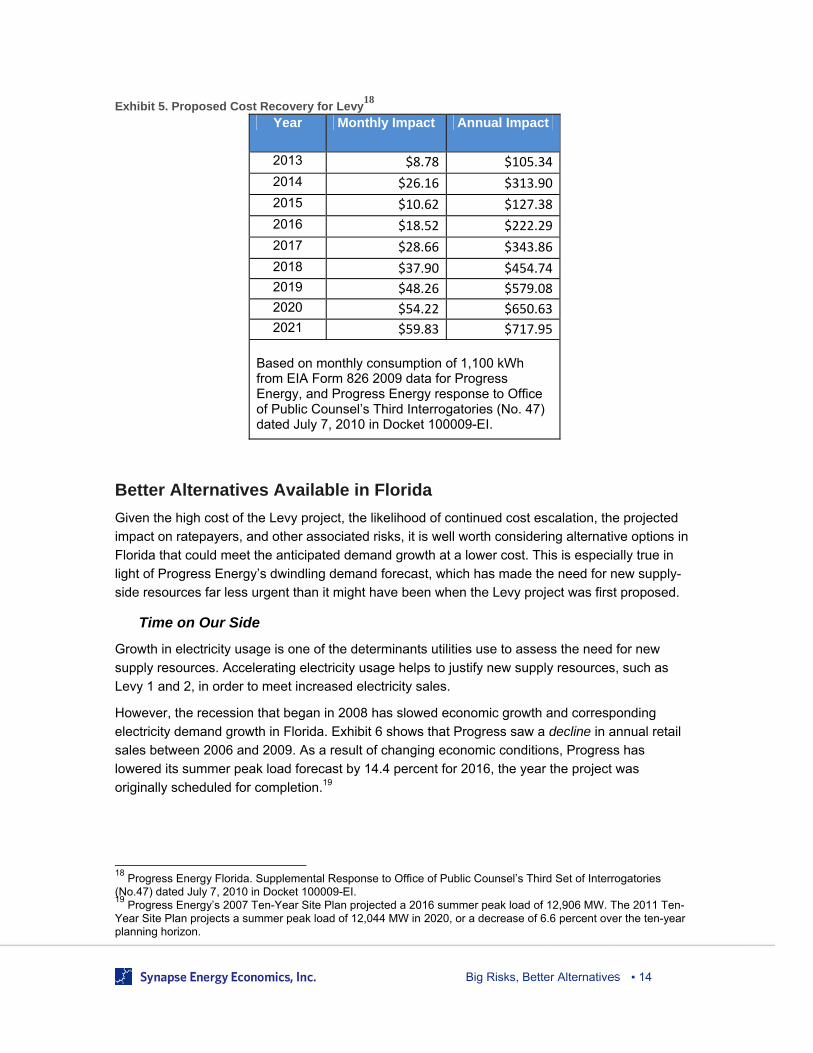
In a 2009 filing with the Florida PSC, Progress provided a cost recovery impact for the Levy
project, which is summarized in Exhibit 5 below. While Progress’s cost recovery impact was
presented based on 1,000 kWh per month usage, the bill impacts shown in Exhibit 5 are
calculated on 1,100 kWh per month usage. This is consistent with the 2009 EIA Form 826, which
indicates that the average Progress Energy residential customer currently consumes 1,100 kWh
per month.
Exhibit 5 shows that, based on the company’s current cost estimate of $22.5 billion, the additional
monthly charge from the Levy project for a customer using 1,100 kWh per month increases from
$8.78 in 2013 to $59.83 in 2021. It is uncertain how the cost estimate will actually fluctuate year to
year based on the current delay in the project’s schedule and the amounts approved by the
Florida PSC. Should the project come in at a higher cost than $22.5 billion, ratepayers will pay a
correspondingly larger amount.
17
Amounts from Progress Energy (2011). Progress Energy Florida makes annual fuel and environmental filings with the Florida Public Service Commission. Press Release: https://www.progress-energy.com/company/media-room/news-archive/press-release.page?title=Progress+Energy+Florida+makes+annual+fuel+and+environmental+filings+with+Florida+Public+Service+Commission+&pubdate=09-01-2011
Big Risks, Better Alternatives ▪ 14
Exhibit 5. Proposed Cost Recovery for Levy18
Year Monthly Impact Annual Impact
2013 $8.78 $105.34
2014 $26.16 $313.90
2015 $10.62 $127.38
2016 $18.52 $222.29
2017 $28.66 $343.86
2018 $37.90 $454.74
2019 $48.26 $579.08
2020 $54.22 $650.63
2021 $59.83 $717.95
Based on monthly consumption of 1,100 kWh from EIA Form 826 2009 data for Progress Energy, and Progress Energy response to Office of Public Counsel’s Third Interrogatories (No. 47) dated July 7, 2010 in Docket 100009-EI.
Better Alternatives Available in Florida
Given the high cost of the Levy project, the likelihood of continued cost escalation, the projected
impact on ratepayers, and other associated risks, it is well worth considering alternative options in
Florida that could meet the anticipated demand growth at a lower cost. This is especially true in
light of Progress Energy’s dwindling demand forecast, which has made the need for new supply-
side resources far less urgent than it might have been when the Levy project was first proposed.
Time on Our Side
Growth in electricity usage is one of the determinants utilities use to assess the need for new
supply resources. Accelerating electricity usage helps to justify new supply resources, such as
Levy 1 and 2, in order to meet increased electricity sales.
However, the recession that began in 2008 has slowed economic growth and corresponding
electricity demand growth in Florida. Exhibit 6 shows that Progress saw a decline in annual retail
sales between 2006 and 2009. As a result of changing economic conditions, Progress has
lowered its summer peak load forecast by 14.4 percent for 2016, the year the project was
originally scheduled for completion.19
18
Progress Energy Florida. Supplemental Response to Office of Public Counsel’s Third Set of Interrogatories (No.47) dated July 7, 2010 in Docket 100009-EI. 19
Progress Energy’s 2007 Ten-Year Site Plan projected a 2016 summer peak load of 12,906 MW. The 2011 Ten-Year Site Plan projects a summer peak load of 12,044 MW in 2020, or a decrease of 6.6 percent over the ten-year planning horizon.
Big Risks, Better Alternatives ▪ 15
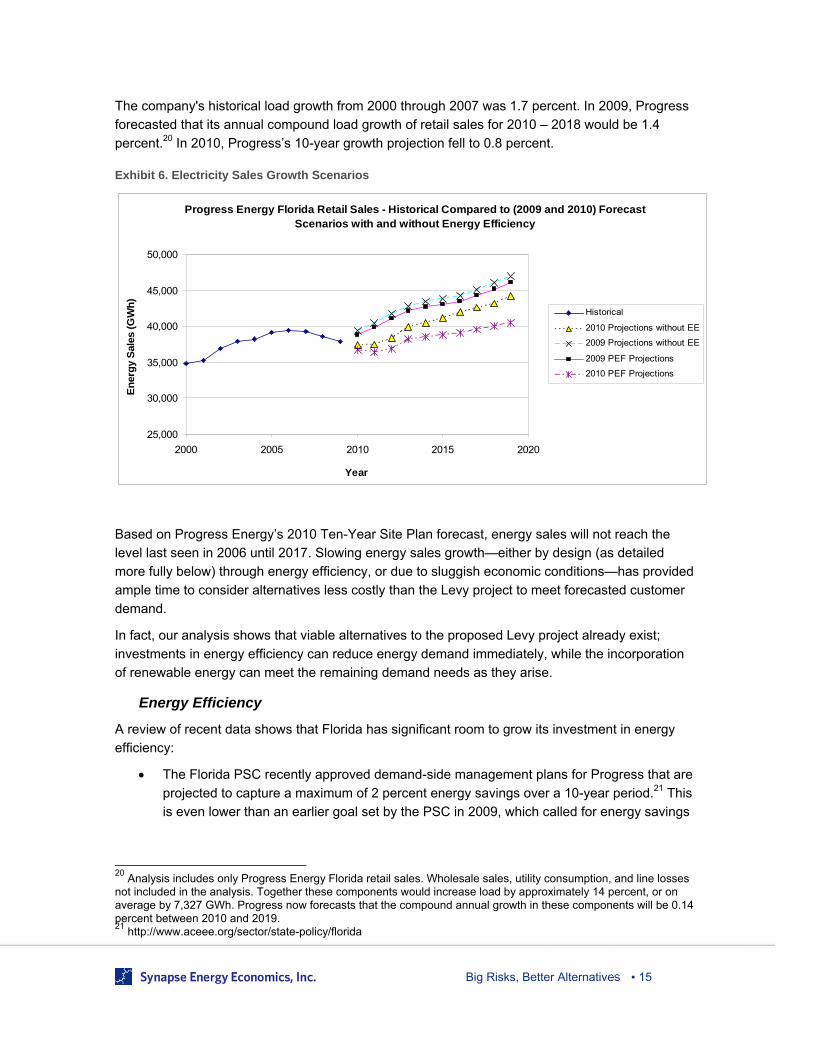
The company's historical load growth from 2000 through 2007 was 1.7 percent. In 2009, Progress
forecasted that its annual compound load growth of retail sales for 2010 – 2018 would be 1.4
percent.20 In 2010, Progress’s 10-year growth projection fell to 0.8 percent.
Exhibit 6. Electricity Sales Growth Scenarios
Based on Progress Energy’s 2010 Ten-Year Site Plan forecast, energy sales will not reach the
level last seen in 2006 until 2017. Slowing energy sales growth—either by design (as detailed
more fully below) through energy efficiency, or due to sluggish economic conditions—has provided
ample time to consider alternatives less costly than the Levy project to meet forecasted customer
demand.
In fact, our analysis shows that viable alternatives to the proposed Levy project already exist;
investments in energy efficiency can reduce energy demand immediately, while the incorporation
of renewable energy can meet the remaining demand needs as they arise.
Energy Efficiency
A review of recent data shows that Florida has significant room to grow its investment in energy
efficiency:
The Florida PSC recently approved demand-side management plans for Progress that are
projected to capture a maximum of 2 percent energy savings over a 10-year period.21 This
is even lower than an earlier goal set by the PSC in 2009, which called for energy savings
20
Analysis includes only Progress Energy Florida retail sales. Wholesale sales, utility consumption, and line losses not included in the analysis. Together these components would increase load by approximately 14 percent, or on average by 7,327 GWh. Progress now forecasts that the compound annual growth in these components will be 0.14 percent between 2010 and 2019. 21
http://www.aceee.org/sector/state-policy/florida
Progress Energy Florida Retail Sales - Historical Compared to (2009 and 2010) Forecast Scenarios with and without Energy Efficiency
25,000
30,000
35,000
40,000
45,000
50,000
2000 2005 2010 2015 2020
Year
En
erg
y S
ales
(G
Wh
)
Historical
2010 Projections without EE
2009 Projections without EE
2009 PEF Projections
2010 PEF Projections
Big Risks, Better Alternatives ▪ 16
of 3.5 percent over a 10-year period, and is only a fraction of the goal recommended by
the Commission staff’s own expert.22
Seventeen other states have set energy efficiency targets between 1.0 and 2.3 percent
annually, with six states setting targets of at least 2.0 percent per year.23
According to data from the American Council for an Energy-Efficient Economy (ACEEE)
and the Energy Information Administration (EIA),24 Florida saved 348,360 MWh in 2008
due to energy efficiency. Florida’s per capita spending on energy efficiency was $7.15
across the state, well below the national average per capita spending of $11.08.25 Leading
states are investing even more in energy efficiency; the top five states per capita spending
on energy efficiency range from $27.01 to $49.38.26
According to the Southern Alliance for Clean Energy (SACE), Florida’s largest utilities
currently achieve energy efficiency of less than 0.2 percent of electricity sales. SACE
estimates that energy efficiency investments would cost 2 – 4¢/kWh, while the average
cost for electricity in the state is 12¢/kWh.27 In comparison, the cost of energy from Levy,
using our analysis, would be 17¢/kWh.
In 2007, ACEEE conducted a study on the potential for energy efficiency and renewable
energy to meet Florida’s growing energy demands.28 The study found that Florida could
reduce its projected future electricity use by about 19 percent through energy efficiency
programs.
Our analysis shows that, if Progress Energy Florida pursued an aggressive but achievable energy
efficiency target of 1.5 percent of annual retail sales, it would result in virtually flat load growth
from 2012 onward, using the 2010 ten-year forecast. This level of EE would place Progress above
what many utilities have historically achieved, but still well below the savings and commitments of
the most aggressive utilities, and well below ACEEE’s identified potential of 19 percent of end-use
sales by 2023.
This higher energy efficiency target (leading to a cumulative savings of 14 percent of retail sales
by 2019) would enable Progress to maintain annual sales below its 2006 peak level. It would also
negate the need to invest $22.5 billion in new nuclear units.
However, if Progress reduces its energy efficiency target to 880 GWh by 2019, as suggested in
continuing with the company’s current energy efficiency targets, load growth will rise through
2019, thus providing the company with additional justification to build Levy 1 and 2.
22
Direct Testimony of PSC Staff Expert Richard Spellman, Docket No. 080407-13, July 17, 2009. 23
ACEEE. The 2010 State Energy Efficiency Scorecard. Report Number E097.E107. October 2010. Available at http://www.aceee.org/research-report/e107. 24
http://www.aceee.org/sector/state-policy/florida. 25
Data from Appendix E. ACEEE 2010 Scorecard. 26
ACEEE (2010). Per capita spending on energy efficiency for the top five states: 1) Vermont ($49.38), Rhode Island ($28.01), 3) Massachusetts ($27.88), 4) Hawaii ($27.41), and 5) California ($27.01). 27
Southern Alliance for Clean Energy, “Removing Barriers to Energy Efficiency Investment is Key to Slashing Customer Electricity Bills and Creation of Clean Energy Jobs” February 2010. Available at http://www.cleanenergy.org/images/factsheets/Fla%20EE%20Recom%20Brief-SACE-Feb%202010.pdf. 28
ACEEE, “Potential for Energy Efficiency and Renewable Energy to Meet Florida’s Growing Energy Demands.” February 2007. Available at http://www.aceee.org/sites/default/files/publications/researchreports/e072.pdf.
Big Risks, Better Alternatives ▪ 17
While increasing funding for an aggressive energy efficiency program would require an initial
investment that would result in a slight increase in electricity prices (compared to what ratepayers
pay today), overall electricity bills would be lowered as customer electricity consumption is
reduced. This investment in EE would defer or even prevent the need for investments in more
expensive generation and associated transmission and distribution facilities, and further insulate
consumers from potential increases in fuel costs.29
Finally, if we take Progress’s 2010 Ten-Year Site Plan savings of 3,200 GWh and multiply that by
an assumed cost of energy efficiency of $0.027/kWh, the result is a rough approximated cost of
$0.086 billion—a tiny fraction of the current price tag of $22.5 billion for Levy 1 and 2. Importantly,
the cost of EE could be even less: research by Synapse in 2008 has shown that utilities are
achieving economies of scale as efficiency programs increase.30 More detail on the costs of
carbon abatement options is provided in Appendix F.
Renewable Energy
While increased energy efficiency could flatten load growth for Progress Energy, a concurrent
increase in renewable energy could actually reduce system load and allow for the retirement of
older, polluting, more expensive fossil-fired generation.
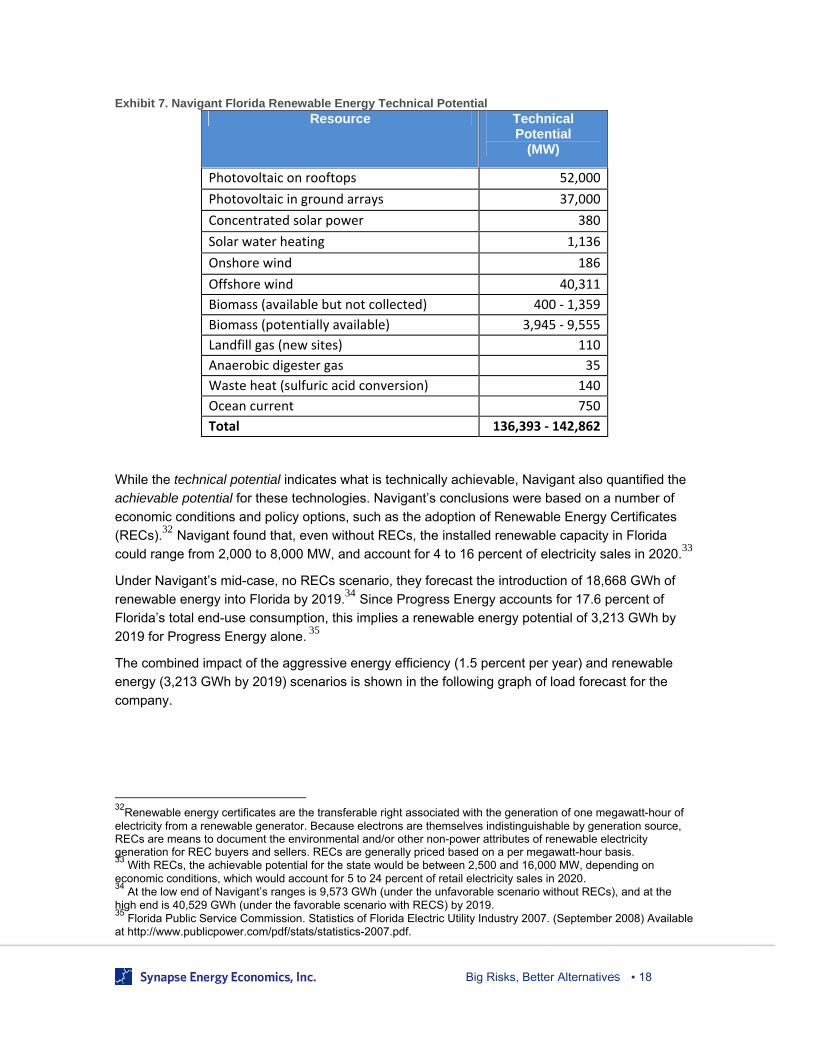
No renewable energy mandates currently exist in Florida, and the potential for renewable energy
development is significant. According to a 2008 Navigant Consulting report prepared for the
Florida PSC, the technical potential for renewable energy in Florida by 2020 ranges from 136,393
to 142,862 MW (see Exhibit 7 below).31
The report found that Florida currently has about 1,500 MW of renewable energy capacity, most of
which is biomass. Photovoltaic accounts for 1.8 MW, and hydroelectric accounts for another 64
MW. The current generation mix for Progress Energy Florida is presented in Appendix C.
29
A more detailed description of associated benefits resulting from aggressive energy efficiency may be found in the Synapse report, “Cost and Benefits of Electric Utility Energy Efficiency in Massachusetts.” Available at http://www.synapse-energy.com/cgi-bin/synapsePublications.pl. 30
Takahashi, Kenji., Nichols, David. The Sustainability and Costs of increasing Energy Efficiency Impacts: Evidence from Experience to Date. 2008 ACEEE Summer Study on Energy Efficiency in Buildings, August 20, 2008. Available at http://www.synapse-energy.com/Downloads/SynapsePresentation.2008-08.0.Sustainability-and-Costs-of-Efficiency-Impacts.S0051.pdf 31
While the results of other renewable potential studies and installed projects may suggest changes to the exact aggregate numbers in the Navigant report, these modifications do not change the fact, as demonstrated in Exhibit 7, that there is a large, untapped potential for renewable resources in Florida.
Big Risks, Better Alternatives ▪ 18
Exhibit 7. Navigant Florida Renewable Energy Technical Potential Resource Technical
Potential (MW)
Photovoltaic on rooftops 52,000
Photovoltaic in ground arrays 37,000
Concentrated solar power 380
Solar water heating 1,136
Onshore wind 186
Offshore wind 40,311
Biomass (available but not collected) 400 ‐ 1,359
Biomass (potentially available) 3,945 ‐ 9,555
Landfill gas (new sites) 110
Anaerobic digester gas 35
Waste heat (sulfuric acid conversion) 140
Ocean current 750
Total 136,393 ‐ 142,862
While the technical potential indicates what is technically achievable, Navigant also quantified the
achievable potential for these technologies. Navigant’s conclusions were based on a number of
economic conditions and policy options, such as the adoption of Renewable Energy Certificates
(RECs).32 Navigant found that, even without RECs, the installed renewable capacity in Florida
could range from 2,000 to 8,000 MW, and account for 4 to 16 percent of electricity sales in 2020.33
Under Navigant’s mid-case, no RECs scenario, they forecast the introduction of 18,668 GWh of
renewable energy into Florida by 2019.34 Since Progress Energy accounts for 17.6 percent of
Florida’s total end-use consumption, this implies a renewable energy potential of 3,213 GWh by
2019 for Progress Energy alone. 35
The combined impact of the aggressive energy efficiency (1.5 percent per year) and renewable
energy (3,213 GWh by 2019) scenarios is shown in the following graph of load forecast for the
company.
32
Renewable energy certificates are the transferable right associated with the generation of one megawatt-hour of electricity from a renewable generator. Because electrons are themselves indistinguishable by generation source, RECs are means to document the environmental and/or other non-power attributes of renewable electricity generation for REC buyers and sellers. RECs are generally priced based on a per megawatt-hour basis. 33
With RECs, the achievable potential for the state would be between 2,500 and 16,000 MW, depending on economic conditions, which would account for 5 to 24 percent of retail electricity sales in 2020. 34
At the low end of Navigant’s ranges is 9,573 GWh (under the unfavorable scenario without RECs), and at the high end is 40,529 GWh (under the favorable scenario with RECS) by 2019. 35
Florida Public Service Commission. Statistics of Florida Electric Utility Industry 2007. (September 2008) Available at http://www.publicpower.com/pdf/stats/statistics-2007.pdf.
Big Risks, Better Alternatives ▪ 19
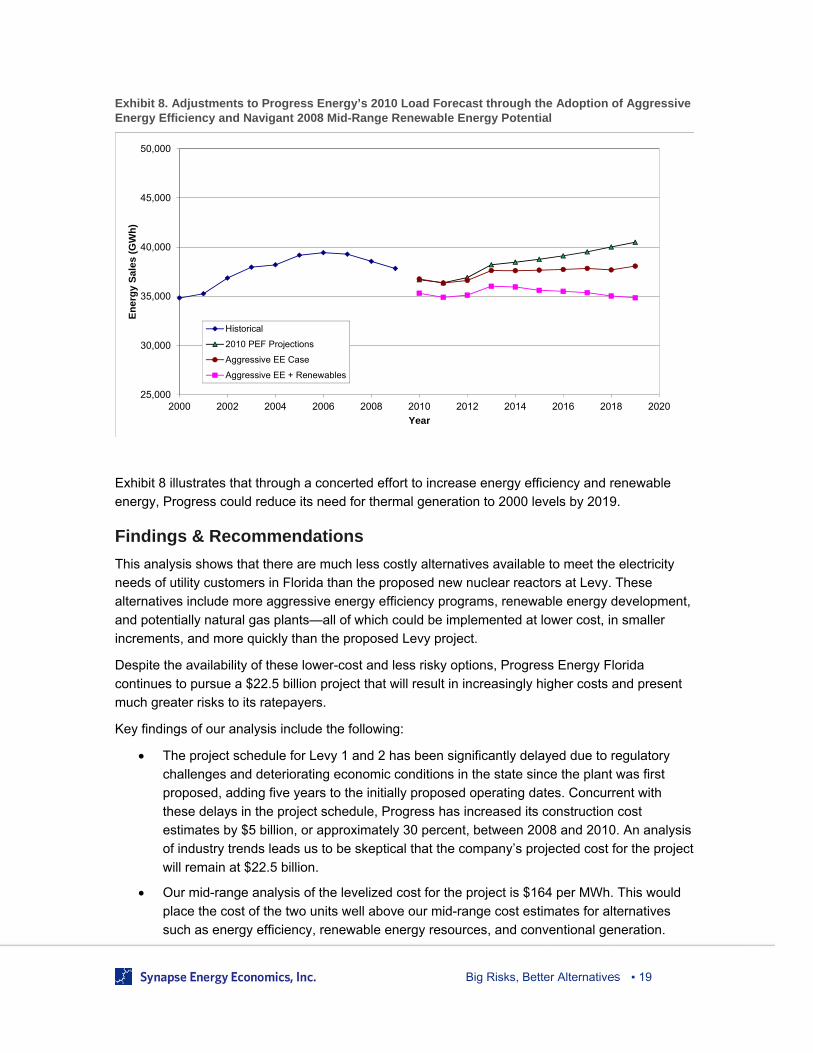
Exhibit 8. Adjustments to Progress Energy’s 2010 Load Forecast through the Adoption of Aggressive Energy Efficiency and Navigant 2008 Mid-Range Renewable Energy Potential
Exhibit 8 illustrates that through a concerted effort to increase energy efficiency and renewable
energy, Progress could reduce its need for thermal generation to 2000 levels by 2019.
Findings & Recommendations
This analysis shows that there are much less costly alternatives available to meet the electricity
needs of utility customers in Florida than the proposed new nuclear reactors at Levy. These
alternatives include more aggressive energy efficiency programs, renewable energy development,
and potentially natural gas plants—all of which could be implemented at lower cost, in smaller
increments, and more quickly than the proposed Levy project.
Despite the availability of these lower-cost and less risky options, Progress Energy Florida
continues to pursue a $22.5 billion project that will result in increasingly higher costs and present
much greater risks to its ratepayers.
Key findings of our analysis include the following:
The project schedule for Levy 1 and 2 has been significantly delayed due to regulatory
challenges and deteriorating economic conditions in the state since the plant was first
proposed, adding five years to the initially proposed operating dates. Concurrent with
these delays in the project schedule, Progress has increased its construction cost
estimates by $5 billion, or approximately 30 percent, between 2008 and 2010. An analysis
of industry trends leads us to be skeptical that the company’s projected cost for the project
will remain at $22.5 billion.
Our mid-range analysis of the levelized cost for the project is $164 per MWh. This would
place the cost of the two units well above our mid-range cost estimates for alternatives
such as energy efficiency, renewable energy resources, and conventional generation.
25,000
30,000
35,000
40,000
45,000
50,000
2000 2002 2004 2006 2008 2010 2012 2014 2016 2018 2020
En
erg
y S
ales
(G
Wh
)
Year
Historical
2010 PEF Projections
Aggressive EE Case
Aggressive EE + Renewables
Big Risks, Better Alternatives ▪ 20
Progress Energy’s own filings show that, based on current cost estimates, its residential
ratepayers will pay $718 per year by 2021 for the Levy project—even before it generates
any electricity. Should project costs increase further, customers will see a corresponding
increase in their bills.
Based on these findings, we strongly recommend that the State of Florida and Progress Energy
pursue more sustainable and cost-effective alternatives to the Levy project. Specifically:
Florida should take steps to increase its energy efficiency targets to levels more
consistent with leading states. If Progress Energy were to pursue an aggressive energy
efficiency target of 1.5 percent of annual retail energy sales, the company could maintain
its energy load below 2006 levels based on its 2010 Ten-Year Site Plan retail sales
forecast—without the Levy units. While a 1.5 percent annual target is well above Florida’s
current energy efficiency goal (expected to achieve a total of 2 percent energy savings
over 10 years), it is well below savings targets achieved by utilities in leading states.
Any additional demand growth in Florida can be met through available and cost-effective
renewable energy resources and conventional resources such as natural gas.
Development of these resources could further allow Progress to retire some older, less-
efficient, and more expensive generating plants.
Big Risks, Better Alternatives ▪ 21
4. Georgia: Vogtle 3 and 4 Georgia Power and its consortium partners have started site work to expand the Vogtle nuclear
station by adding two new units, Vogtle 3 and 4. Combined, these new units would add
approximately 2,200 MW of generation capacity. Georgia Power anticipates that Vogtle 3 will be
completed in 2016 and Vogtle 4 in 2017, at a total cost of $14 billion.
Both the scheduled completion date and total estimated cost of the project remain the same as
when the project was announced in 2006; however, given recent press announcements about
delays with rebar, backfill, and NRC licensing of the Westinghouse AP1000 design, we anticipate
that the final project cost and schedule are far from certain.36
According to our analysis, the levelized cost range for Vogtle 3 and 4 is $63 – $168 per MWh. In
all of the estimates, we have included the impact of the federal loan guarantee and production tax
credits for the project.
Low estimate: At the low end, using Georgia Power’s current project cost of $14 billion,
the levelized cost of electricity from Vogtle 3 and 4 would be $63 per MWh.
High estimate: In the absence of well-documented, publically available information from
the company on which to base our analysis, we have based the high estimate for Vogtle
on historical precedent. In 1972, Georgia Power estimated the cost for the original Vogtle
project (Vogtle 1 and 2) to be $5.63 billion (in inflation adjusted 2007$).37 When both units
were completed in 1988, the final cost was $17.09 billion, or a real cost increase of 304
percent. For Vogtle 3 and 4, we calculated the high end of the cost range by taking two-
thirds of the historical 304-percent increase for Vogtle 1 and 2.38 This results in a high-
cost estimate of $168 per MWh for the project. The high-end estimate for this plant does
not necessarily imply certainty in project costs, only a possible outcome that should be
considered given the lack of well-documented, publically available information from the
company. The final cost of the next generation of nuclear plants is simply unknown.
Mid-range estimate: Our mid-range cost estimate for Vogtle 3 and 4 is one half of the
Vogtle 1 and 2 high estimate cost trajectory, resulting in an estimate of $115 per MWh.
These levelized cost estimates factor in two subsidies currently available to the Vogtle project:
Under the Department of Energy (DOE) Title XVII loan guarantee program, the project
has been awarded $8.33 billion in federal loan guarantees that will allow Vogtle’s owners
to finance a substantial portion of their construction costs at interest rates well below
market rates, and to increase their debt fraction, which significantly reduces overall
financing costs.
36
Recent testimony from the project’s construction monitor, William Jacobs, highlights unresolved issues relating to the project. See Jacobs, W. Direct Testimony of and Exhibits of William Jacobs, Jr., PhD. Docket 29849. Dated December 10, 2010. (p.5-6). 37
From EIA Form 257 data provided by James Hewett of EIA. 38
We chose the historical costs for Vogtle 1 and 2 as a starting point for our cost projections for several reasons. One, Vogtle 1 and 2 have the same ownership structure as Vogtle 3 and 4. Two, all four units would be on the same location, so site specific issues would be the same. Three, the cost escalations for Vogtle 1 and 2 are documented.
Big Risks, Better Alternatives ▪ 22
Vogtle’s current project schedule would also allow the plant to receive a production tax
credit capped at $125 million per year per 1,000 MW of capacity for the first eight years of
production—assuming the project comes online in time to qualify.
Lack of Transparency and Associated Risks
A key risk specific to the Vogtle project is the lack of transparency. While detailed information
about the project’s cost and schedule is provided to the Georgia Public Service Commission
(PSC) in Georgia Power’s construction monitoring filings,39 the company has classified almost all
of this cost and schedule information as trade secret.
In June of 2010, the Georgia PSC found that Georgia Power’s estimated cost for its share of the
project is reasonable and remains at $6.1 billion, since the company was granted the early
recovery of financing costs in 2009 through the passage of the Georgia Nuclear Energy Financing
Act.40 The lack of transparency surrounding this project, however, undermines such assurances of
cost reasonableness, hinders independent analyses of Georgia Power’s assumptions, and
exposes Georgia Power’s ratepayers to greater risk.
While Georgia Power has redacted quantitative information, some of the risks associated with the
Vogtle project have been expressed in qualitative terms in filings made by the Independent
Construction Monitor (ICM). The ICM was hired by the Georgia PSC, using Georgia Power’s
money, to provide monthly progress reports on the Vogtle project.
In June of 2011, testimony from the ICM identified unresolved issues from the previous
construction monitoring report that include:41
Design and fabrication of modules and sub-modules at the Shaw Modular Solutions
(“SMS”) facility as required to meet the project schedule; and
Production of Vogtle-specific Certified for Construction (“CFC”) construction packages as
required to meet the project schedule.
The ICM’s testimony also identified new issues that could potentially impact the project schedule,
including:
Certification of the AP1000 Design Control Document (“DCD”) by the NRC as required to
meet the project schedule;
Issuance of the Vogtle Combined Operating License (“COL”) by the NRC as required to
meet the project schedule; and
Recovery of Unit 3 COD to April 1, 2016.
The following exhibit outlines some of the benchmarks associated with the Vogtle project to date:
39
Georgia Public Service Commission. Docket No. 29849. 40 Georgia Public Service Commission. Docket No. 27800, Georgia Power’s Application for the Certification of Units 3 and 4 at Plant Vogtle and Updated Integrated Resource Plan Order on Remand. June 17, 2010. The Commission’s June 2010 order in Docket 27800 references Georgia Power’s original estimate of $6.4 billion and the adjustment to $6.1 billion based on the recovery of financing costs from Georgia Power ratepayers through the passage of the Georgia Nuclear Energy Financing Act. 41
Jacobs, William. Direct Testimony and Exhibits In the Matter of Georgia Power Company’s Fourth Semi-Annual Vogtle Construction Monitoring Report.” Docket 29849, filed June 9, 2011. Page 6.
Big Risks, Better Alternatives ▪ 23
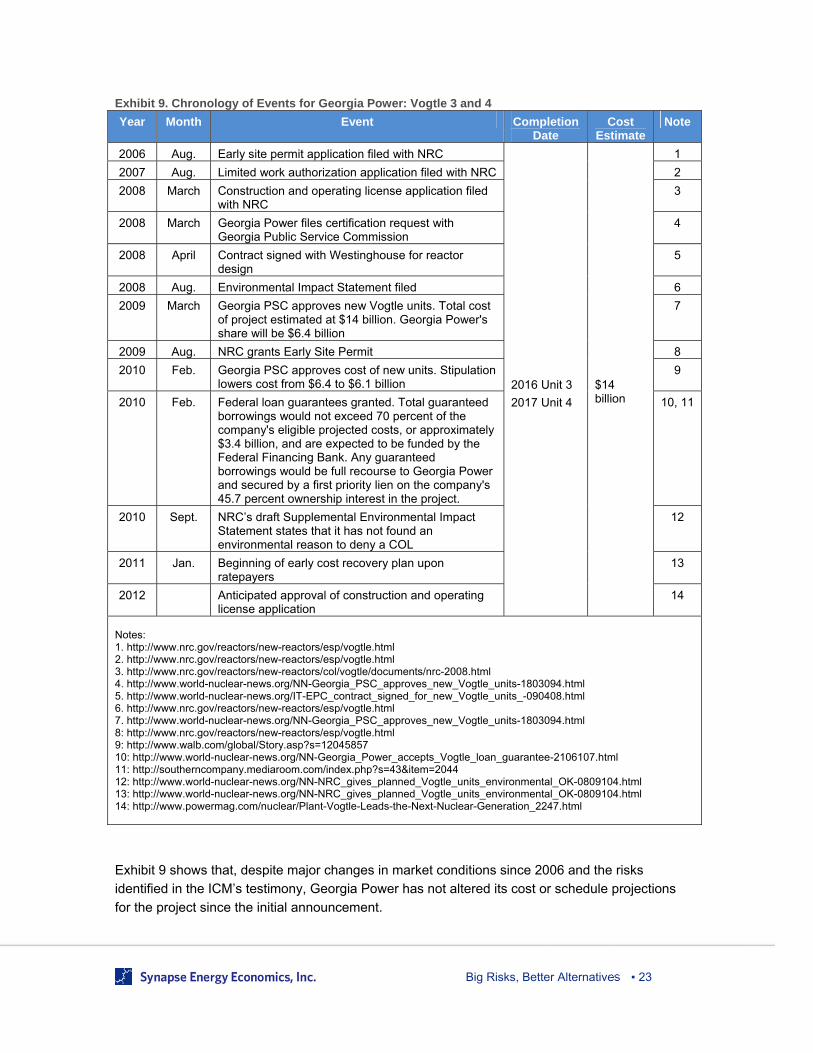
Exhibit 9. Chronology of Events for Georgia Power: Vogtle 3 and 4
Year Month Event Completion Date
Cost Estimate
Note
2006 Aug. Early site permit application filed with NRC
2016 Unit 3
2017 Unit 4
$14 billion
1
2007 Aug. Limited work authorization application filed with NRC 2
2008 March Construction and operating license application filed with NRC
3
2008 March Georgia Power files certification request with Georgia Public Service Commission
4
2008 April Contract signed with Westinghouse for reactor design
5
2008 Aug. Environmental Impact Statement filed 6
2009 March Georgia PSC approves new Vogtle units. Total cost of project estimated at $14 billion. Georgia Power's share will be $6.4 billion
7
2009 Aug. NRC grants Early Site Permit 8
2010 Feb. Georgia PSC approves cost of new units. Stipulation lowers cost from $6.4 to $6.1 billion
9
2010 Feb. Federal loan guarantees granted. Total guaranteed borrowings would not exceed 70 percent of the company's eligible projected costs, or approximately $3.4 billion, and are expected to be funded by the Federal Financing Bank. Any guaranteed borrowings would be full recourse to Georgia Power and secured by a first priority lien on the company's 45.7 percent ownership interest in the project.
10, 11
2010 Sept. NRC’s draft Supplemental Environmental Impact Statement states that it has not found an environmental reason to deny a COL
12
2011 Jan. Beginning of early cost recovery plan upon ratepayers
13
2012 Anticipated approval of construction and operating license application
14
Notes: 1. http://www.nrc.gov/reactors/new-reactors/esp/vogtle.html 2. http://www.nrc.gov/reactors/new-reactors/esp/vogtle.html 3. http://www.nrc.gov/reactors/new-reactors/col/vogtle/documents/nrc-2008.html 4. http://www.world-nuclear-news.org/NN-Georgia_PSC_approves_new_Vogtle_units-1803094.html 5. http://www.world-nuclear-news.org/IT-EPC_contract_signed_for_new_Vogtle_units_-090408.html 6. http://www.nrc.gov/reactors/new-reactors/esp/vogtle.html 7. http://www.world-nuclear-news.org/NN-Georgia_PSC_approves_new_Vogtle_units-1803094.html 8: http://www.nrc.gov/reactors/new-reactors/esp/vogtle.html 9: http://www.walb.com/global/Story.asp?s=12045857 10: http://www.world-nuclear-news.org/NN-Georgia_Power_accepts_Vogtle_loan_guarantee-2106107.html 11: http://southerncompany.mediaroom.com/index.php?s=43&item=2044 12: http://www.world-nuclear-news.org/NN-NRC_gives_planned_Vogtle_units_environmental_OK-0809104.html 13: http://www.world-nuclear-news.org/NN-NRC_gives_planned_Vogtle_units_environmental_OK-0809104.html 14: http://www.powermag.com/nuclear/Plant-Vogtle-Leads-the-Next-Nuclear-Generation_2247.html
Exhibit 9 shows that, despite major changes in market conditions since 2006 and the risks
identified in the ICM’s testimony, Georgia Power has not altered its cost or schedule projections
for the project since the initial announcement.
Big Risks, Better Alternatives ▪ 24
Ultimately, the risks associated with the Vogtle project—including the lack of transparency, and
the likelihood of cost escalation and regulatory and construction delays—are likely to result in very
high costs to ratepayers. As in Florida, ratepayers in Georgia are required by law to fund this
expensive nuclear energy project long before it begins producing energy, whether or not it ever
does.
Cost Recovery Mechanisms: Shifting Risks to Ratepayers
The Georgia Nuclear Energy Financing Act, signed into law in 2009, allows regulated utilities to
recover from their customers the financing costs associated with the construction of nuclear
generation projects—years before those projects begin producing benefits for ratepayers. In
effect, this shifts the financing costs of these massive, risk-prone projects away from utilities and
onto ratepayers.
Of Georgia Power’s estimated $6.1 billion Vogtle costs, $1.7 billion is financing costs.42 The utility
began recovering these financing costs from its customers starting in 2011. According to Georgia
Power’s website, effective in 2011, “all bills rendered subject to the Nuclear Construction Cost
Recovery Schedule shall be respectively increased in an amount equal to 5.8619% of their base
bill calculations.” For 2011, that translates to Georgia Power electric bills going up by an average
of $3.73 per month.
Georgia Power estimates that this monthly charge will escalate so that by 2018, a Georgia Power
residential customer using 1,000 kWh per month will see their bill go up by $10 per month, or
approximately $120 per year, due to Vogtle 3 and 4.43
Should the cost of the project increase in coming years, due to regulatory and construction delays
or other causes, future charges to Georgia Power ratepayers will increase accordingly.
Loan Guarantees and the PTC: Shifting Risks to Taxpayers
In February 2010, the DOE announced that it had awarded, on a conditional basis, $8.33 billion in
federal loan guarantees to underwrite the construction costs of Vogtle 3 and 4. The total amount is
spread among three of the four owners of the project:44
$3.4 billion for Georgia Power45
$3.0 billion for Oglethorpe Power46
$1.8 billion for MEAG Power47
Under the terms of the agreement, the loan guarantees will allow the owners of the project to
borrow at below-market Federal Financing Bank rates with the assurance of the U.S.
Government.48
42
The Atlanta Business News, “Impact of new Georgia Power reactors on monthly bills uncertain.” August 5, 2011. Available at http://www.ajc.com/business/impact-of-new-georgia-1079955.html. 43
The Atlanta Business Chronicle, “GA Power files cost plan for nuclear project.” August 5, 2011. Georgia Power. (2011) Costs. Retrieved from http://www.southerncompany.com/nuclearenergy/costs.aspx. 44
Exact terms and conditions for each of the loan guarantees are not detailed. Sum does not equal total announced loan guarantee. 45
http://www.southerncompany.com/news/dyn_pressroom.aspx?s=43&item=2044 46
http://www.faqs.org/sec-filings/100521/OGLETHORPE-POWER-CORP_8-K/a10-10697_1ex99d1.htm 47
http://online.wsj.com/article/SB10001424052748704541304575099384196590568.html
Big Risks, Better Alternatives ▪ 25
For the Vogtle consortium, the federally backed loan guarantee reduces the project’s financing
costs. During an analyst conference call, Southern Company president David Radcliffe indicated
that the federal loan guarantee would reduce Georgia Power’s cost of borrowing its pro rata share
of the $8.33 billion loan guarantee by 50 basis points, or by 0.5 percent.49
A very significant impact is that the federal loan guarantee allows those building Vogtle to increase
their debt financing and reduce their equity requirements. Since the cost of equity is much greater
than the cost of borrowing, this substantially reduces the levelized cost for the plant. Although the
final debt/equity fractions for the project are uncertain, we believe that a 75 percent debt/25
percent equity fraction is quite reasonable for this project, compared to a more typical 50
percent/50 percent mix.
While these loan guarantees will covey considerable benefits to the plant’s developers, they pose
risks to U.S. taxpayers. How significant are these risks? The federal loan guarantee program,
authorized by Congress in 2005, came about because investors would not provide financing for
the new-generation nuclear energy projects without them. When institutional lenders denied
financing to these projects, Congress put taxpayer dollars on the line to shoulder the risks that
neither Wall Street nor the utilities themselves were willing to bear.
Moreover, concerns have been raised about the process used to select applications for the federal
loan guarantee program.50 The Southern Alliance for Clean Energy (SACE) filed a lawsuit
pertaining to the lack of information provided by DOE specific to the Vogtle loan guarantee, stating
that the loan guarantees result in “socializing the risk and privatizing the profits for big power
companies.” 51 The SACE lawsuit follows the issuance of a report by the Government
Accountability Office (GAO) that expressed concern that the DOE “has not developed all the tools
necessary to assess progress.”52 Specifically, the GAO report found that the DOE has not fully
developed performance goals associated with the loan guarantee program.
Another factor to consider is the Production Tax Credit (PTC). While the PTC will lower the cost of
the Vogtle project for Georgia Power and, ultimately, its ratepayers, it will be provided using
taxpayer dollars. The fact that billions in taxpayer money is on the line to help pay for the Vogtle
reactors provides additional incentive to investigate whether this project is the best, most cost-
effective option available to meet Georgia’s energy needs. It further begs the question, “Why
should taxpayers throughout the U.S. subsidize over-priced nuclear energy for Georgia?”
48
http://www.ucsusa.org/nuclear_power/nuclear_power_and_global_warming/nuclear-loan-guarantees.html. Nuclear power plant project owners will have to pay a Credit Subsidy Fee that in theory covers the risk of default; however, the nuclear industry is lobbying to have the fee set at around 1 percent of the principle of the loan guarantee. 49
For the other owners of the plant, the reduction in the cost of borrowing may be more significant, since Georgia Power/Southern Company has such a strong credit rating. 50
A detailed critique of risks associated with loan guarantees for new nuclear plants was conducted by David Schlissel, Michael Mullet, and Robert Alvarez in “Nuclear Loan Guarantees: Another Taxpayer Bailout Ahead” (2009) Available at http://www.synapse-energy.com. 51
http://www.cleanenergy.org/index.php?/Press-Update.html?form_id=8&item_id=181 52
http://www.gao.gov/products/GAO-10-627
Big Risks, Better Alternatives ▪ 26
Better Alternatives Available in Georgia
Time on Our Side
Growth in electricity usage is one of the determinants utilities use to assess the need for new
supply resources. While Georgia Power does not provide publicly available energy sales or load
growth projections, it is reasonable to assume that the 2008 recession, which slowed economic
growth in Georgia, also impacted energy sales growth in Georgia Power’s service territory.
Therefore we will focus our analysis on past (actual) Georgia Power energy sales trends. The
historical energy sales growth for Georgia Power from 2004 through 2009 is presented in the
following chart.
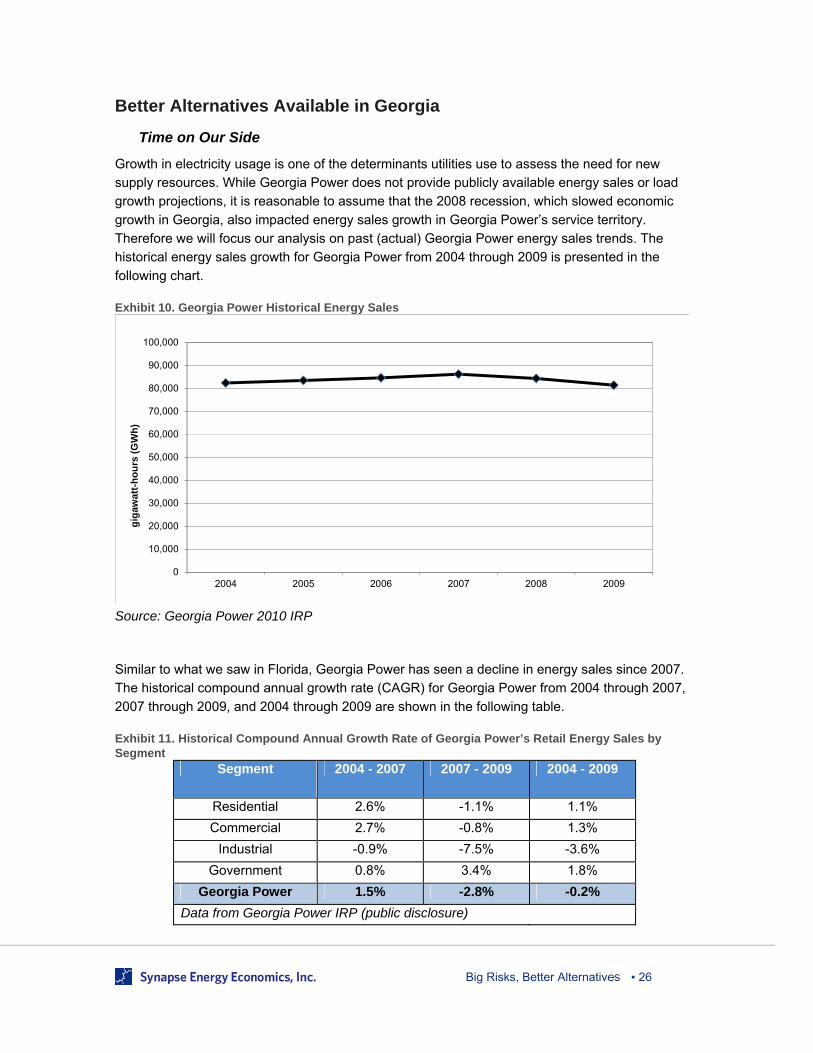
Exhibit 10. Georgia Power Historical Energy Sales
Source: Georgia Power 2010 IRP
Similar to what we saw in Florida, Georgia Power has seen a decline in energy sales since 2007.
The historical compound annual growth rate (CAGR) for Georgia Power from 2004 through 2007,
2007 through 2009, and 2004 through 2009 are shown in the following table.
Exhibit 11. Historical Compound Annual Growth Rate of Georgia Power’s Retail Energy Sales by Segment
Segment 2004 - 2007 2007 - 2009 2004 - 2009
Residential 2.6% -1.1% 1.1%
Commercial 2.7% -0.8% 1.3%
Industrial -0.9% -7.5% -3.6%
Government 0.8% 3.4% 1.8%
Georgia Power 1.5% -2.8% -0.2%
Data from Georgia Power IRP (public disclosure)
0
10,000
20,000
30,000
40,000
50,000
60,000
70,000
80,000
90,000
100,000
2004 2005 2006 2007 2008 2009
gig
awat
t-h
ou
rs (
GW
h)
Big Risks, Better Alternatives ▪ 27
Exhibit 11 shows that growth in Georgia Power’s retail sales appears to have peaked in 2007 at
86,137 GWh following a period of 1.5 percent annual growth from 2004 to 2007. As the national
and regional economy slowed down, Georgia Power saw a corresponding decline in sales to
81,347 GWh in 2009. Overall, growth in retail sales across Georgia Power has stayed flat from
2004 to 2009 at negative 0.2 percent, with modest growth in the residential and commercial
sectors offset by declines in sales in the industrial sector.
Based on this trend and the slow rate of economic recovery in the U.S., it is likely that future load
growth in Georgia Power’s service territory will be slower than pre-recession levels. Specific
growth forecasts are redacted in the company’s Integrated Resource Plan (IRP) filings. However,
comments made by Georgia Power executives during Wall Street analyst conference calls shed
some insight into the company’s growth projections, which appear to be noticeably scaled back
from historical growth. During the company’s 2010 second quarter analyst call, company
executives anticipated that residential growth would be between 1.2 and 1.3 percent, representing
approximately 30 percent of Georgia Power’s annual sales.53 Absent actual load projections from
Georgia Power, we have assumed that retail load will continue to grow at the actual 2004 to 2009
growth rate of 1.1 percent for the residential sector, below the historical growth of 1.5 percent
achieved from 2004 to 2007.54 We have also assumed that there will be no changes to Georgia
Power’s investment in energy efficiency. Based on these assumptions, we calculate that Georgia
Power will reach its 2007 load peak in 2014, which is consistent with the company’s 2010 IRP
assertion that its resource mix is adequate through 2015.
Because energy sales growth for Georgia Power has slowed considerably compared to earlier
projections, we find that it is entirely possible for the company to meet future retail energy sales
growth through investments in energy efficiency, which is the lowest-cost resource compared to all
supply-side generating options, as well as through modest investment in affordable and available
renewable resources.
Energy Efficiency
Georgia currently does not have any statewide energy efficiency targets. By comparison, 17 states
have set energy efficiency targets of between 1.0 and 2.3 percent of total electricity sales per year.
This includes six states that have targets of 2.0 percent per year or more.
Meanwhile, several studies support the fact that Georgia has large, untapped energy efficiency
potential.
In 2005, the Georgia Environmental Finance Authority commissioned the consulting firm
ICF to conduct an energy efficiency potential study. 55 The study found that Georgia could
achieve 3,339 GWh of savings, or 2.3 percent of electricity sales, by 2010 under a
minimally aggressive energy efficiency scenario. Under a very aggressive scenario, the
53
Southern Company. 2nd Quarter Call July 28, 2010. Available at http://seekingalpha.com/article/217222-southern-q2-2010-earnings-call-transcript. 54
Using a 1.1 percent growth rate for all end-use sectors probably understates historical commercial sector growth, but overstates historical industrial sector sales. 55 ICF Consulting. Assessment of Energy Efficiency Potential in Georgia Final Report. May 5, 2005. Available at http://www.gefa.org/index.aspx?page=192.
Big Risks, Better Alternatives ▪ 28
state could achieve 12,515 GWh of savings by 2010. EIA data shows that in 2008,
Georgia achieved just 62 GWh of savings through energy efficiency.
In 2007, Georgia Power commissioned Nextant to conduct an energy efficiency potential
study for its service territory as a follow-up to the 2005 ICF report.56 While detailed
findings from the report are redacted, the report’s theoretically achievable potential for
cumulative energy efficiency reductions range from 1.7 to 6.2 percent of 2010 forecast
sales. This study, which was funded by Georgia Power, concluded that the energy
savings would come at “a substantial cost to ratepayers.” They reached this conclusion
based on the application of the so-called Ratepayer Impact Measure (RIM) test, a flawed
and misleading test that looks only at impacts on electricity rates, and ignores the
substantially lower costs resulting from energy savings. When the same study applied the
more comprehensive Total Resource Cost (TRC) test, the net benefits to ratepayers from
energy efficiency were estimated to be between $0.8 and $3.1 billion. In sum, the Nextant
report confirms a large, cost-effective energy efficiency potential within Georgia Power’s
service territory.
In a more recent study, Chandler and Brown reviewed Georgia’s energy-efficiency studies
in Meta-Review of Efficiency Potential Studies and Their Implications for the South
(2009).57 Their study indicated that Georgia could achieve electricity savings ranging from
11 to 27 percent from projected energy consumption under the maximum achievable
scenarios they modeled.
Another recent study, by the Ochs Center for Metropolitan Studies, found that six of
Georgia’s Electric Membership Corporations (EMC) could achieve lifetime energy
efficiency savings of 22,930 GWh at a cost of $0.06 per kWh over a 14-year
implementation period.58 In 2007, these six EMCs consumed 7,675 GWh of the 137,274
GWh of electricity consumed in Georgia.59 While this analysis was conducted in the
context of the proposed 850 MW Plant Washington coal-fired power plant in Washington
County, it provides additional context to the potential for energy efficiency and associated
costs within Georgia.
According to ACEEE’s 2010 State Energy Efficiency Scorecard, Georgia ranked 37th out
of 50 states in its national ranking of states for energy efficiency in 2010. Also according to
ACEEE, Georgia’s per capita spending on energy efficiency was $2.16 across the state
for all utilities, which is well below the national average per capita spending of $11.08.
Leading states are investing even more in energy efficiency; the top five states per capita
spending on energy efficiency range from $27.01 to $49.38.60
56 Available at http://www.seealliance.org/pdf/GAIRPTechGAPowerPotentialStudy_052007.pdf. 57
See http://www.seealliance.org/se_efficiency_study/georgia_efficiency_in_the_south.pdf. 58
Tharp, William., Quillen, Lori. “Energy Efficiency as an Alternative Strategy for the Power4Gerogians EMCs.” The Ochs Center for Metropolitan Studies. March 2010. Available at http://www.cleanenergy.org/images/files/PlantWashingtonFinal030510.pdf. 59
Ibid. The six EMCs are Central, Cobb, Pataula, SSEMC, Upson, and Washington, representing 43 counties within the state. 60
ACEEE (2010). Per capita spending on energy efficiency for the top five states: 1) Vermont ($49.38), Rhode Island ($28.01), 3) Massachusetts ($27.88), 4) Hawaii ($27.41), and 5) California ($27.01).
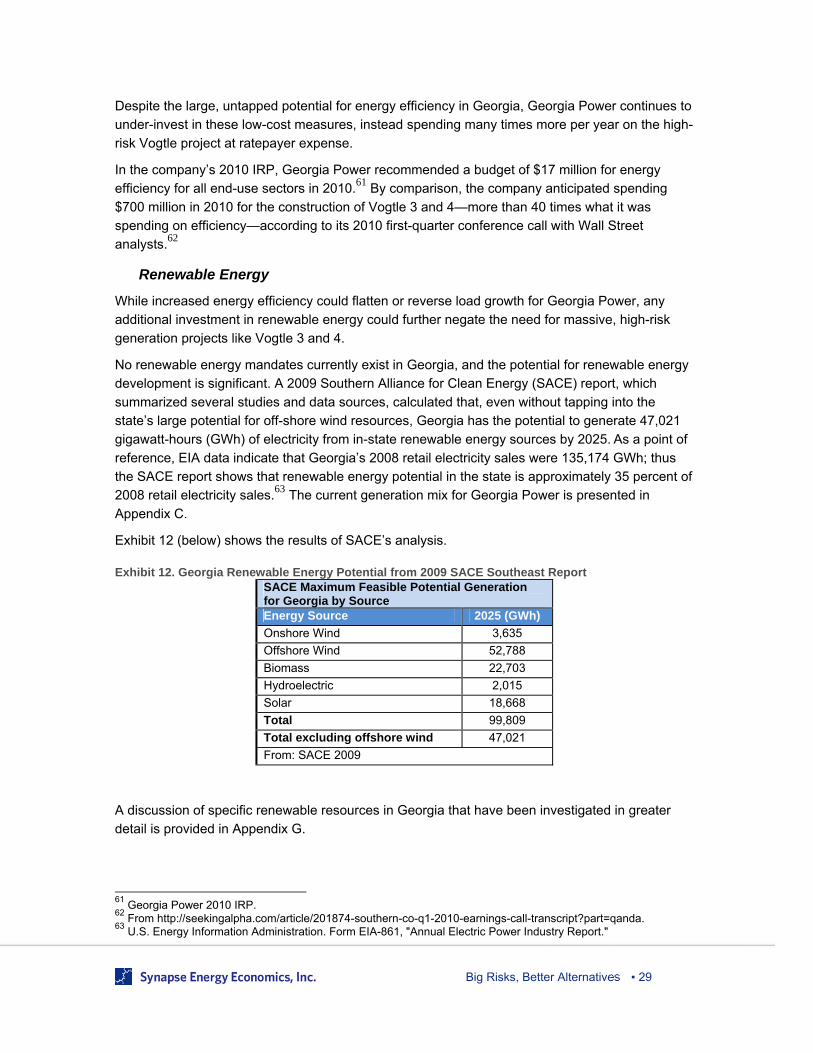
Big Risks, Better Alternatives ▪ 29
Despite the large, untapped potential for energy efficiency in Georgia, Georgia Power continues to
under-invest in these low-cost measures, instead spending many times more per year on the high-
risk Vogtle project at ratepayer expense.
In the company’s 2010 IRP, Georgia Power recommended a budget of $17 million for energy
efficiency for all end-use sectors in 2010.61 By comparison, the company anticipated spending
$700 million in 2010 for the construction of Vogtle 3 and 4—more than 40 times what it was
spending on efficiency—according to its 2010 first-quarter conference call with Wall Street
analysts.62
Renewable Energy
While increased energy efficiency could flatten or reverse load growth for Georgia Power, any
additional investment in renewable energy could further negate the need for massive, high-risk
generation projects like Vogtle 3 and 4.
No renewable energy mandates currently exist in Georgia, and the potential for renewable energy
development is significant. A 2009 Southern Alliance for Clean Energy (SACE) report, which
summarized several studies and data sources, calculated that, even without tapping into the
state’s large potential for off-shore wind resources, Georgia has the potential to generate 47,021
gigawatt-hours (GWh) of electricity from in-state renewable energy sources by 2025. As a point of
reference, EIA data indicate that Georgia’s 2008 retail electricity sales were 135,174 GWh; thus
the SACE report shows that renewable energy potential in the state is approximately 35 percent of
2008 retail electricity sales.63 The current generation mix for Georgia Power is presented in
Appendix C.
Exhibit 12 (below) shows the results of SACE’s analysis.
Exhibit 12. Georgia Renewable Energy Potential from 2009 SACE Southeast Report SACE Maximum Feasible Potential Generation for Georgia by Source Energy Source 2025 (GWh)
Onshore Wind 3,635
Offshore Wind 52,788
Biomass 22,703
Hydroelectric 2,015
Solar 18,668
Total 99,809
Total excluding offshore wind 47,021
From: SACE 2009
A discussion of specific renewable resources in Georgia that have been investigated in greater
detail is provided in Appendix G.
61
Georgia Power 2010 IRP. 62
From http://seekingalpha.com/article/201874-southern-co-q1-2010-earnings-call-transcript?part=qanda. 63
U.S. Energy Information Administration. Form EIA-861, "Annual Electric Power Industry Report."
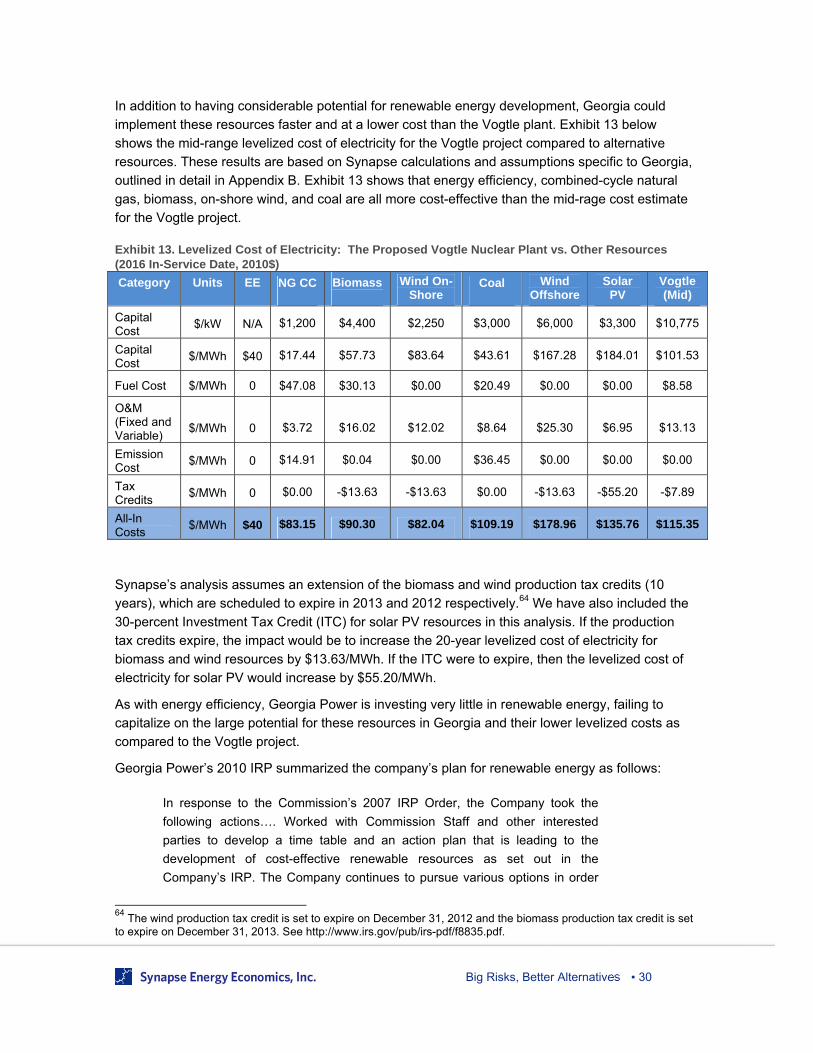
Big Risks, Better Alternatives ▪ 30
In addition to having considerable potential for renewable energy development, Georgia could
implement these resources faster and at a lower cost than the Vogtle plant. Exhibit 13 below
shows the mid-range levelized cost of electricity for the Vogtle project compared to alternative
resources. These results are based on Synapse calculations and assumptions specific to Georgia,
outlined in detail in Appendix B. Exhibit 13 shows that energy efficiency, combined-cycle natural
gas, biomass, on-shore wind, and coal are all more cost-effective than the mid-rage cost estimate
for the Vogtle project.
Exhibit 13. Levelized Cost of Electricity: The Proposed Vogtle Nuclear Plant vs. Other Resources (2016 In-Service Date, 2010$) Category Units EE NG CC Biomass
Wind On-Shore
Coal Wind Offshore
Solar PV
Vogtle (Mid)
Capital Cost
$/kW N/A $1,200 $4,400 $2,250 $3,000 $6,000 $3,300 $10,775
Capital Cost
$/MWh $40 $17.44 $57.73 $83.64 $43.61 $167.28 $184.01 $101.53
Fuel Cost $/MWh 0 $47.08 $30.13 $0.00 $20.49 $0.00 $0.00 $8.58
O&M (Fixed and Variable)
$/MWh 0 $3.72 $16.02 $12.02 $8.64 $25.30 $6.95 $13.13
Emission Cost
$/MWh 0 $14.91 $0.04 $0.00 $36.45 $0.00 $0.00 $0.00
Tax Credits
$/MWh 0 $0.00 -$13.63 -$13.63 $0.00 -$13.63 -$55.20 -$7.89
All-In Costs
$/MWh $40 $83.15 $90.30 $82.04 $109.19 $178.96 $135.76 $115.35
Synapse’s analysis assumes an extension of the biomass and wind production tax credits (10
years), which are scheduled to expire in 2013 and 2012 respectively.64 We have also included the
30-percent Investment Tax Credit (ITC) for solar PV resources in this analysis. If the production
tax credits expire, the impact would be to increase the 20-year levelized cost of electricity for
biomass and wind resources by $13.63/MWh. If the ITC were to expire, then the levelized cost of
electricity for solar PV would increase by $55.20/MWh.
As with energy efficiency, Georgia Power is investing very little in renewable energy, failing to
capitalize on the large potential for these resources in Georgia and their lower levelized costs as
compared to the Vogtle project.
Georgia Power’s 2010 IRP summarized the company’s plan for renewable energy as follows:
In response to the Commission’s 2007 IRP Order, the Company took the
following actions…. Worked with Commission Staff and other interested
parties to develop a time table and an action plan that is leading to the
development of cost-effective renewable resources as set out in the
Company’s IRP. The Company continues to pursue various options in order
64
The wind production tax credit is set to expire on December 31, 2012 and the biomass production tax credit is set to expire on December 31, 2013. See http://www.irs.gov/pub/irs-pdf/f8835.pdf.
Big Risks, Better Alternatives ▪ 31
to develop up to three cost-effective renewable projects with capacity of 30
MWs or less. 65
If all three projects are developed within the IRP timeframe, this would result in the addition of 90
MW. This would represent less than one percent of the company’s 2009 generation capacity of
15,995 MW.66
Findings & Recommendations
This analysis shows that there are less costly and far less risky alternatives available to meet the
electricity needs of Georgia Power customers than the proposed new nuclear reactors at Vogtle.
These alternatives include more aggressive energy efficiency programs, biomass and onshore
wind development, and potentially natural gas plants—all of which could be implemented at lower
cost, in smaller increments, and more quickly than the proposed Vogtle project.
Despite the availability of these lower-cost and less risky options, Georgia Power and its
consortium partners continue to pursue a $14 billion-plus project that will present much greater
risks and result in higher costs for their ratepayers. U.S. taxpayer money is also on the line to
subsidize this multi-billion-dollar project.
Key findings of our analysis include the following:
Georgia Power has stated that it will complete Vogtle 3 by 2016 and Vogtle 4 by 2017,
and has implied that the cost estimate for the project will remain at $14 billion. Detailed
information about the project’s schedule and the cost projections have been redacted from
public documents by Georgia Power. Our analysis suggests that the final project cost is
far from certain, and is likely to be much higher than the current estimate.
Our mid-range analysis of the levelized cost for the project is $115 per MWh, based on a
percentage of the cost increases experienced by Georgia Power during the construction
of Vogtle 1 and 2. This would place the cost of the two units above all of our mid-range
cost estimates for energy efficiency, renewable resources (except off-shore wind and
solar PV), and conventional generation.
Georgia Power ratepayers will pay an estimated $120 per year by 2018 in financing
charges, prior to the operation of the project, based on the annualized monthly tariff
submitted by Georgia Power at the current cost estimate. Should the cost of the project
increase, then the impact on customer bills will also increase.
Available studies show that the substantial energy efficiency and renewable energy
resource potential in Georgia could be utilized to meet the state’s future energy needs at
far lower cost and risk.
Based on these findings, we strongly recommend that the State of Georgia, Georgia Power and its
partners pursue more sustainable and cost-effective alternatives to the Vogtle project. Specifically:
Georgia should commission new, independent energy efficiency and renewable energy
studies for the entire state to help inform and guide policymakers in weighing the costs
65
Georgia Power. 2010 Integrated Resource Management Plan: Main Document. January 2010. (Page 1-5) 66
Information accessed from http://www.georgiapower.com/about/facts.asp.

Big Risks, Better Alternatives ▪ 32
and benefits of different alternatives for meeting future energy needs. The last energy
efficiency potential study was conducted in 2005, and the state has never commissioned a
study to assess the renewable resource potential in Georgia.
Georgia should take immediate steps to set statewide energy efficiency and renewable
energy targets that are consistent with those of leading states. Existing studies suggest
that Georgia Power could viably and economically meet its projected energy sales growth
though a reasonable mix of energy efficiency and renewable energy resources—without
the proposed new Vogtle reactors. Cost-effective investment in these resources could
further allow Georgia to reduce its reliance on imported nuclear fuel, and avoid increasing
costs and risks associated with on-site storage of spent nuclear fuel.
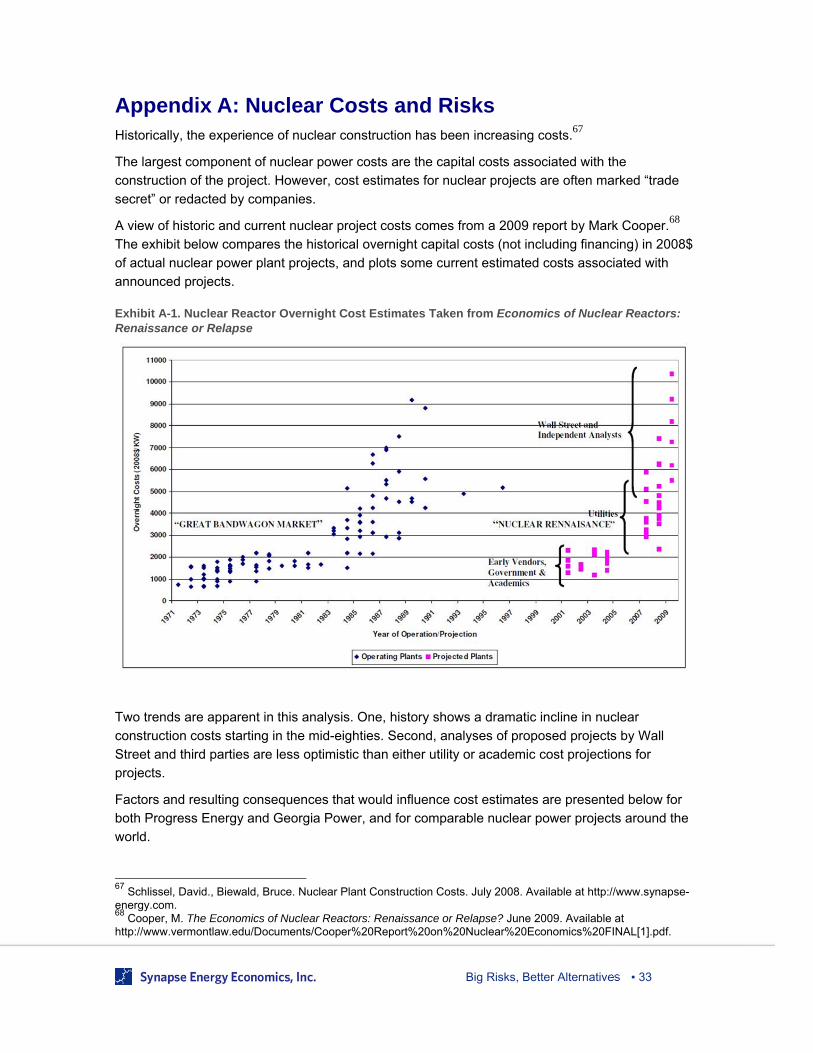
Big Risks, Better Alternatives ▪ 33
Appendix A: Nuclear Costs and Risks Historically, the experience of nuclear construction has been increasing costs.67
The largest component of nuclear power costs are the capital costs associated with the
construction of the project. However, cost estimates for nuclear projects are often marked “trade
secret” or redacted by companies.
A view of historic and current nuclear project costs comes from a 2009 report by Mark Cooper.68
The exhibit below compares the historical overnight capital costs (not including financing) in 2008$
of actual nuclear power plant projects, and plots some current estimated costs associated with
announced projects.
Exhibit A-1. Nuclear Reactor Overnight Cost Estimates Taken from Economics of Nuclear Reactors: Renaissance or Relapse
Two trends are apparent in this analysis. One, history shows a dramatic incline in nuclear
construction costs starting in the mid-eighties. Second, analyses of proposed projects by Wall
Street and third parties are less optimistic than either utility or academic cost projections for
projects.
Factors and resulting consequences that would influence cost estimates are presented below for
both Progress Energy and Georgia Power, and for comparable nuclear power projects around the
world.
67
Schlissel, David., Biewald, Bruce. Nuclear Plant Construction Costs. July 2008. Available at http://www.synapse-energy.com. 68
Cooper, M. The Economics of Nuclear Reactors: Renaissance or Relapse? June 2009. Available at http://www.vermontlaw.edu/Documents/Cooper%20Report%20on%20Nuclear%20Economics%20FINAL[1].pdf.
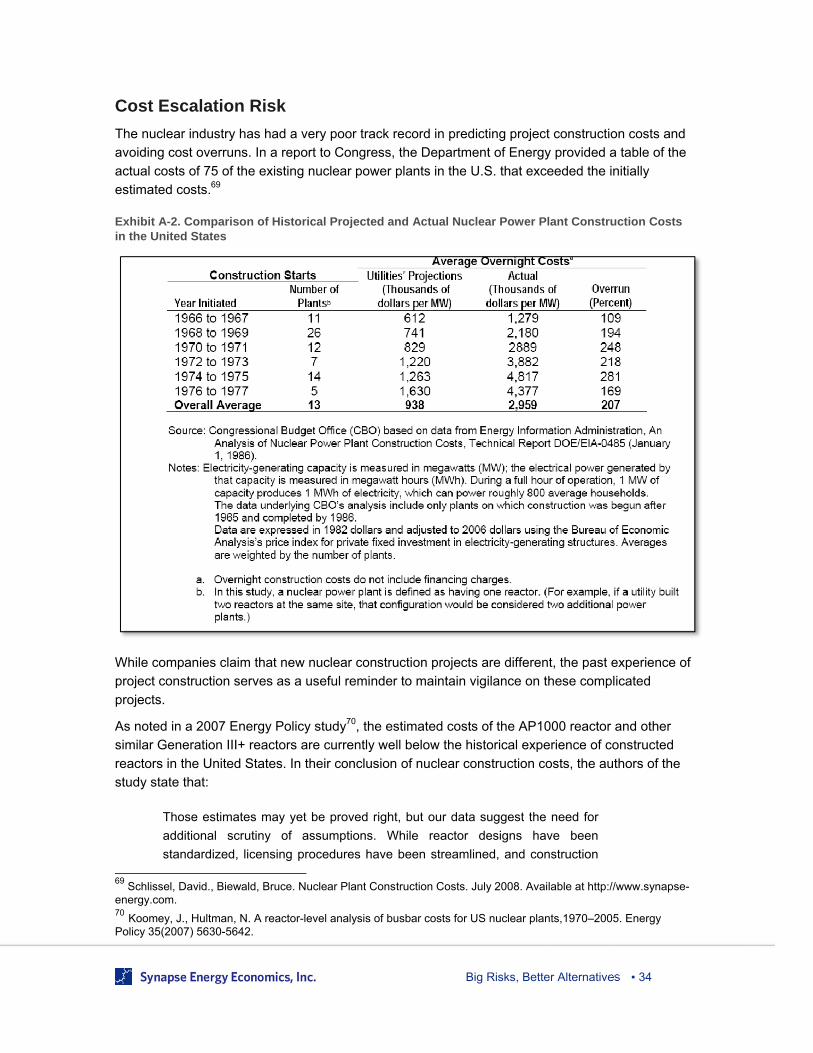
Big Risks, Better Alternatives ▪ 34
Cost Escalation Risk
The nuclear industry has had a very poor track record in predicting project construction costs and
avoiding cost overruns. In a report to Congress, the Department of Energy provided a table of the
actual costs of 75 of the existing nuclear power plants in the U.S. that exceeded the initially
estimated costs.69
Exhibit A-2. Comparison of Historical Projected and Actual Nuclear Power Plant Construction Costs in the United States
While companies claim that new nuclear construction projects are different, the past experience of
project construction serves as a useful reminder to maintain vigilance on these complicated
projects.
As noted in a 2007 Energy Policy study70, the estimated costs of the AP1000 reactor and other
similar Generation III+ reactors are currently well below the historical experience of constructed
reactors in the United States. In their conclusion of nuclear construction costs, the authors of the
study state that:
Those estimates may yet be proved right, but our data suggest the need for
additional scrutiny of assumptions. While reactor designs have been
standardized, licensing procedures have been streamlined, and construction
69
Schlissel, David., Biewald, Bruce. Nuclear Plant Construction Costs. July 2008. Available at http://www.synapse-energy.com. 70 Koomey, J., Hultman, N. A reactor-level analysis of busbar costs for US nuclear plants,1970–2005. Energy Policy 35(2007) 5630-5642.
Big Risks, Better Alternatives ▪ 35
management techniques are much more sophisticated than before, some old
problems remain, and new ones may emerge. The policy and design changes
represented by Gen III+ and Gen IV reactors do represent improvements over
the current fleet, but the interlinked issues of reactor scale, customization of
site-built technologies, slow electricity demand growth, intense competition
from other energy sources, deregulated electricity markets, slow speed of
industry learning, nuclear waste disposal, terrorism, and proliferation remain
potential impediments to the cost competitiveness of next-generation nuclear
power in the 21st century.
At a general level, a 2010 Electricity Policy article on an analysis of the French nuclear industry
further notes that:
These findings also suggest a need for in-depth sensitivity analysis across a
much wider range of technological cost uncertainties. Perhaps climate policy
analysis could begin by embracing in sensitivity analyses the engineering rule
of thumb that large-scale infrastructure construction projects trend to always
cost 2–3 times the original estimate. Nuclear is not the only example of a
large-scale, complex technology that might be subject to this engineering rule:
coal-based integrated gasification combined cycles with carbon capture and
sequestration (or very large-scale solar plants in desert areas) would be
prime candidates as well.
Lastly, the French nuclear case has also demonstrated the limits of the
learning paradigm: the assumption that costs invariably decrease with
accumulated technology deployment. The French example serves as a useful
reminder of the limits of the generalizability of simplistic learning/experience
curve models71
Both the Levy and Vogtle projects are subject to the risks outlined in the excerpts above—all of
which could lead to significant escalation in costs.
Additional Research
A 2008 Synapse Energy Economics report detailed two major categories of risk that are
impacting nuclear construction costs:72 These include:
o Limited experience in new reactor designs
o Competition for limited construction and fabrication materials and expertise
Those risks have not diminished since our report, and continue to plague the nuclear
industry.
71
Gruebler, A. The costs of the French nuclear scale-up: A case of negative learning by doing. Energy Policy. 38 (2010) 5174-5188. 72
Ibid.
Big Risks, Better Alternatives ▪ 36
In recent testimony filed before the Florida Public Service Commission, Dr. Mark Cooper,
testifying on behalf of SACE, identified additional factors that have influenced the cost of
new nuclear reactors.73 These include:
o Declining natural gas costs
o Declining estimates of carbon prices
o Declining demand due to the economic slowdown
o Reduced need for nonrenewable generation due to likely efficiency and renewable
mandates in climate change legislation, which was pending at the time
o Rising projections of nuclear construction costs
o High degree of uncertainty in the economic environment that new reactors face
A more detailed description of these impacts is provided in his testimony. While Dr.
Cooper’s testimony is specific to Progress Energy, these risks are also applicable to
Georgia Power and to other proposed nuclear power plant construction projects.
A 2009 Citigroup equity research report cited several cost overruns and delays in the
current generation of nuclear power plants. We highlight some examples of cost
escalation trends from the report, along with subsequent developments, which confirm
that trend:74
o Towards the end of 2008, the French company EdF increased its cost
assumptions for the Flamanville 3-reactor unit, raising the cost to €4 billion/$5.6
billion or €2,434/kW or $3,400/kW in real money terms. These costs were
confirmed in mid-2009, when EdF had already spent nearly €2 billion. In July
2011, EdF announced that the plant was expected to cost €6 billion, and pushed
back the unit operating date to 2016.75
o NRG, in June 2009, said that the cost of two 1,350 MW GE Westinghouse units at
the South Texas Project near Houston would be about $10 billion—not including
financing costs. This would be a merchant plant, not a regulated one, operating on
cost-plus basis with the first unit expected on line in 2016. At the time, this
equated to $3,700/kW. However, in late 2009 Toshiba, the plant’s main
contractor, notified plant owners that costs would be up to $4 billion more.76 In
April 2011, NRG Energy Inc., the primary investor in the project, announced that it
was abandoning the permitting process for the two new units due to the ongoing
expense of planning the reactors combined with lower wholesale electricity prices
73
Cooper. (2010) p. 5. 74
Atherton, Peter., Simms, Andrew., Savvantidou, Sofia., and Hunt, Stephen. “New Nuclear- The Economics Say No” Citi Investment Research and Analysis. November 9, 2009. Available at https://www.citigroupgeo.com/pdf/SEU27102.pdf. 75
“Flamanville-3 operations delayed to 2016.” Platts. July 21, 2011. 76
http://www.mysanantonio.com/news/environment/article/Nuclear-cost-estimate-rises-by-as-much-as-4-844529.php
Big Risks, Better Alternatives ▪ 37
and the uncertainty raised by the ongoing nuclear disaster in Fukushima; NRG
subsequently wrote off its $331 million investment in the project.77
o The Finnish EPR at Olkiluoto has been plagued by many delays during
construction and is currently three years behind schedule, having originally
targeted commissioning in 2009. Citigroup noted that the original cost estimate for
Olkiluoto was €3 billion. However, due to delays, planning problems (construction
started in 2005), and issues with materials, a 2009 Areva estimate indicated that
costs for the project increased by €2.3 billion and could increase further
depending on the outcome of negotiations between the owner, TVO, and Areva
on the timeline for completion. In June 2010, Areva announced €400 million of
further provisions, taking the cost overrun to €2.7 billion, while the timescale
slipped to the end of 2012 from June 2012, with operation set to start in 2013.78 79
The Victoria County Station in Texas is another recent example. In 2010, Exelon Nuclear
Texas Holdings, LLC (Exelon) filed with the NRC to remove its application for a Combined
Operating License and instead submitted an application for an early site permit for a plant
that may never get built.80 At the time, John Rowe, Exelon chairman and CEO, said he
expected natural gas prices to remain low for at least a decade. “As long as natural gas is
anywhere near current price forecasts, you can't economically build a merchant nuclear
plant.” 81
Entergy, the operator of 12 nuclear units at ten plants across the country, has also been
hesitant to invest in new nuclear construction projects. In a November 2010 article,
Entergy’s CEO, J. Wayne Leonard, is quoted about Southern Company’s Vogtle project:
“I’ve wondered how Southern—how anybody—makes the numbers work. Sitting on the
outside looking in, they have some reason we don't see.”82 One distinct possibility is that
both Georgia Power and Progress Energy have nuclear construction early cost recovery
clauses approved in Florida and Georgia, as discussed in the report.
Finally, a 2010 research report issued by Arthur D. Little (ADL) shows the proportional increase
associated with some of the noted construction delays. Figure 9 from the ADL report illustrates
cost overruns from some examples.83
77
http://www.dallasnews.com/business/energy/20110419-nrg-ends-project-to-build-new-nuclear-reactors.ece 78
http://www.mineweb.co.za/mineweb/view/mineweb/en/page72103?oid=107035&sn=Detail&pid=102055 79
http://www.world-nuclear-news.org/NN-Startup_of_Finnish_EPR_pushed_back_to_2013-0806104.html 80
http://www.exeloncorp.com/newsroom/pages/pr_20100325_Nuclear_VictoriaPermit.aspx?k=victoria%20county 81
http://saxo.dailyherald.com/article/20100910/business/309109888/#ixzz1Vyd94kY8 82
http://www.reuters.com/article/idUSTRE64N5S420100524. 83
Von Bechtolsheim, Matthias., Kruse, Michael., and Junker, Jan. “Nuclear New Build Unveiled: Managing the Complexity Challenge” Arthur D. Little. June 2010. Available at http://www.adl.com/reports.html?view=483.
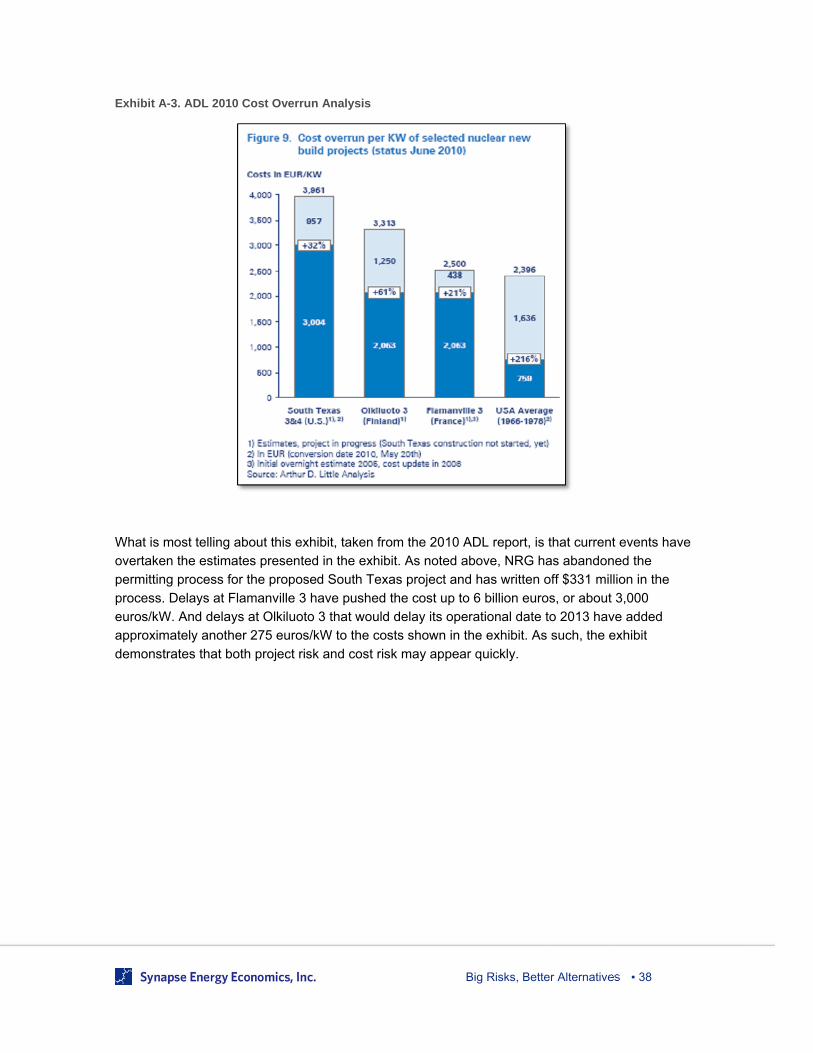
Big Risks, Better Alternatives ▪ 38
Exhibit A-3. ADL 2010 Cost Overrun Analysis
What is most telling about this exhibit, taken from the 2010 ADL report, is that current events have
overtaken the estimates presented in the exhibit. As noted above, NRG has abandoned the
permitting process for the proposed South Texas project and has written off $331 million in the
process. Delays at Flamanville 3 have pushed the cost up to 6 billion euros, or about 3,000
euros/kW. And delays at Olkiluoto 3 that would delay its operational date to 2013 have added
approximately another 275 euros/kW to the costs shown in the exhibit. As such, the exhibit
demonstrates that both project risk and cost risk may appear quickly.
Big Risks, Better Alternatives ▪ 39
Appendix B: Detailed Levelized Cost Inputs Following is a detailed description of the inputs used in the levelized cost assumptions for this
analysis.
Nuclear Project Inputs
For both projects, the following major common inputs included:
15-year accelerated depreciation
85 percent capacity factor
Fixed and variable operations and maintenance costs of $93.9/kW-year based on AEO
projections
Levy Specific Inputs
For the Levy project, capital cost data incorporated cost data provided in Progress Energy
Florida’s Ten-Year Site Plan. The company’s Return on Equity of 10.5 percent is based on the
company’s last base rate case, as determined by the Florida PSC.
The Levy project cost estimates exclude the production tax credit since Levy 1 is not expected
until 2021, after the cutoff date for the program. In addition, the Levy project does not include
nuclear federal loan guarantees.
Vogtle Specific Inputs
For the Vogtle project, capital cost data incorporated generalized cost data, since specific cost
data has been marked trade secret by Georgia Power. The company’s Return on Equity of 11.15
percent is based on the company’s last base rate case, as determined by the GA PSC.84
In addition, the Vogtle project cost estimates include the nuclear production tax credit (PTC) of 1.8
cents per kWh for the first 1,000 MW of capacity for each unit up to $125 million per year for the
first eight years of operation. Both Vogtle units in our analysis are expected to receive the PTC,
which decreases the levelized cost of the project by $7.9 per MWh in all three scenarios. By far
the most important driver of our cost estimate for Vogtle 3 and 4 is the federal nuclear loan
guarantee, which effectively reduces Georgia Power’s cost of borrowing (which already is lower
than Progress Energy’s) and increases the debt fraction of the project. Because Georgia Power
receives favorable credit ratings, the ability for Georgia Power to borrow from the Federal
Financing Bank does not materially impact the cost of borrowing for the project. We also make the
assumption that the federal loan guarantee allows a debt financing fraction of 75 percent for the
plant. This further reduces the overall financing and levelization rates.
Exhibit B-1 below provides a summary of cost inputs for Levy and Vogtle based upon our
described methodology.
84
In December 2010 a Return on Equity (ROE) rate of 11.15 percent was approved.
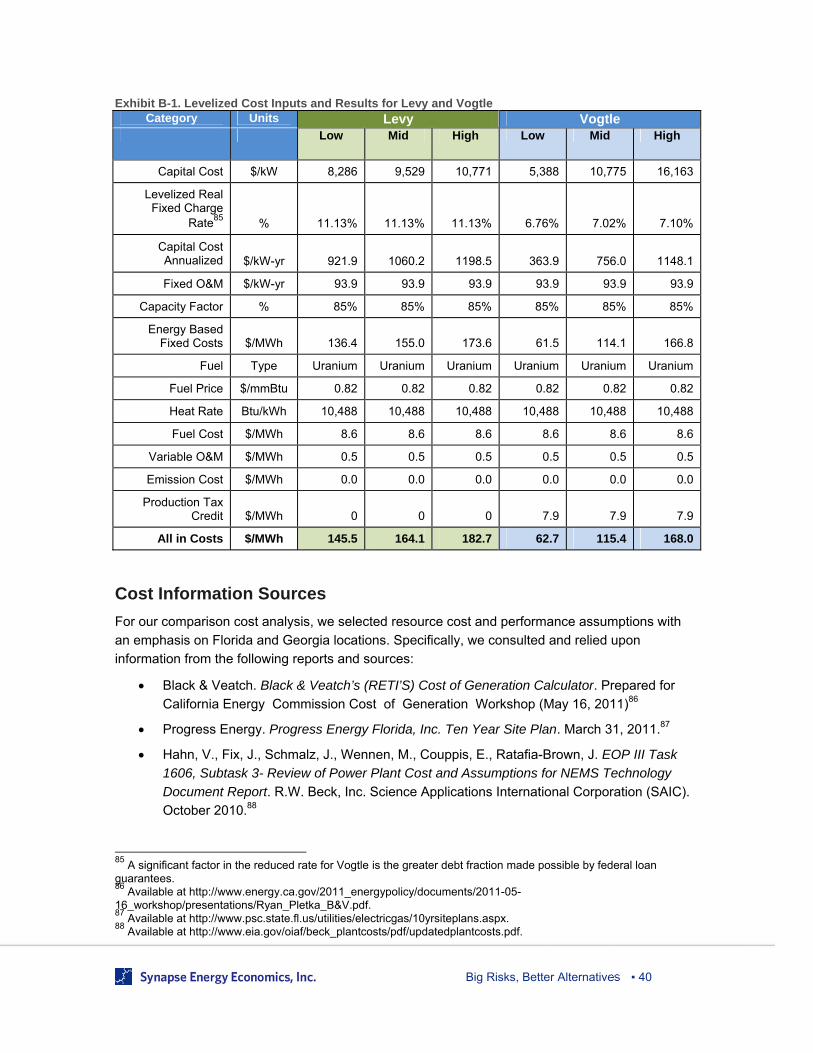
Big Risks, Better Alternatives ▪ 40
Exhibit B-1. Levelized Cost Inputs and Results for Levy and Vogtle Category Units Levy Vogtle
Low Mid High Low Mid High
Capital Cost $/kW 8,286 9,529 10,771 5,388 10,775 16,163
Levelized Real Fixed Charge
Rate85 % 11.13% 11.13% 11.13% 6.76% 7.02% 7.10%
Capital Cost Annualized $/kW-yr 921.9 1060.2 1198.5 363.9 756.0 1148.1
Fixed O&M $/kW-yr 93.9 93.9 93.9 93.9 93.9 93.9
Capacity Factor % 85% 85% 85% 85% 85% 85%
Energy Based Fixed Costs $/MWh 136.4 155.0 173.6 61.5 114.1 166.8
Fuel Type Uranium Uranium Uranium Uranium Uranium Uranium
Fuel Price $/mmBtu 0.82 0.82 0.82 0.82 0.82 0.82
Heat Rate Btu/kWh 10,488 10,488 10,488 10,488 10,488 10,488
Fuel Cost $/MWh 8.6 8.6 8.6 8.6 8.6 8.6
Variable O&M $/MWh 0.5 0.5 0.5 0.5 0.5 0.5
Emission Cost $/MWh 0.0 0.0 0.0 0.0 0.0 0.0
Production Tax Credit $/MWh 0 0 0 7.9 7.9 7.9
All in Costs $/MWh 145.5 164.1 182.7 62.7 115.4 168.0
Cost Information Sources
For our comparison cost analysis, we selected resource cost and performance assumptions with
an emphasis on Florida and Georgia locations. Specifically, we consulted and relied upon
information from the following reports and sources:
Black & Veatch. Black & Veatch’s (RETI’S) Cost of Generation Calculator. Prepared for
California Energy Commission Cost of Generation Workshop (May 16, 2011)86
Progress Energy. Progress Energy Florida, Inc. Ten Year Site Plan. March 31, 2011.87
Hahn, V., Fix, J., Schmalz, J., Wennen, M., Couppis, E., Ratafia-Brown, J. EOP III Task
1606, Subtask 3- Review of Power Plant Cost and Assumptions for NEMS Technology
Document Report. R.W. Beck, Inc. Science Applications International Corporation (SAIC).
October 2010.88
85
A significant factor in the reduced rate for Vogtle is the greater debt fraction made possible by federal loan guarantees. 86
Available at http://www.energy.ca.gov/2011_energypolicy/documents/2011-05-16_workshop/presentations/Ryan_Pletka_B&V.pdf. 87
Available at http://www.psc.state.fl.us/utilities/electricgas/10yrsiteplans.aspx. 88
Available at http://www.eia.gov/oiaf/beck_plantcosts/pdf/updatedplantcosts.pdf.
Big Risks, Better Alternatives ▪ 41
R.W. Beck Inc. Task 692, Subtask 6.2 – Review of Power Plant Cost and Performance
Assumptions for NEMS- Technology Documentation Report. October 2010.
National Renewable Energy Laboratory. Energy Technology Cost and Performance Data.
July 2010.89
Lazard. Levelized Cost of Energy Analysis – Version 4.0. May 2010.
Keith, G., Biewald, B., Takahashi, K., Napoleon, A., Hughes, N., Mancinelli, L., Brand, E.
Beyond Business as Usual: Investigating a Future without Coal and Nuclear Power in the
U.S. Synapse Energy Economics. May 11, 2010.90
U.S. Energy Information Administration. Annual Energy Outlook 2010 with Projections to
2035. DOE/EIA-0383(2010). April 2010.91
Lazard. Levelized Cost of Energy Analysis – Version 3.0. June 2009.92
Cleetus, R., Clemmer, S., Friedman, D. Climate 2030 A National Blueprint For a Clean
Energy Economy. Union of Concerned Scientists. May 2009.93
Navigant Consulting Inc. Florida Renewable Energy Potential Assessment. Prepared for
the Florida Public Service Commission, Florida Governor’s Energy Office, and Lawrence
Berkeley National Laboratory. December 30, 2008.94
General Input Assumptions
Based on these reports, our general input assumptions are summarized as follows:
All values are stated in 2010 dollars
20-year levelization period across resources
2016 in-service date for alternative resources
2.0 percent inflation rate
Nominal discount rate of 7.09 percent
Real discount rate of 4.99 percent
50/50 debt equity ratio
Debt cost of 5.125 percent (30-year treasuries plus 125 basis points)
Equity rate of 11.0 percent
38 percent income tax rate
Levelization rate for fossil fuel generators: 10.82 percent
Levelization rate for renewable energy: 9.77 percent
89
Available at http://www.nrel.gov/analysis/costs.html. 90
Available at http://www.synapse-energy.com/Downloads/SynapseReport.2010-05.CSI.Beyond-Business-as-Usual.10-002.pdf. 91
Available at http://www.eia.doe.gov/oiaf/archive/aeo10/pdf/0383(2010).pdf. 92
Available at http://efile.mpsc.state.mi.us/efile/docs/15996/0145.pdf. 93
Available at http://www.ucsusa.org/global_warming/solutions/big_picture_solutions/climate-2030-blueprint.html. 94
Available at http://www.psc.state.fl.us/utilities/electricgas/RenewableEnergy/FL_Final_Report_2008_12_29.pdf.
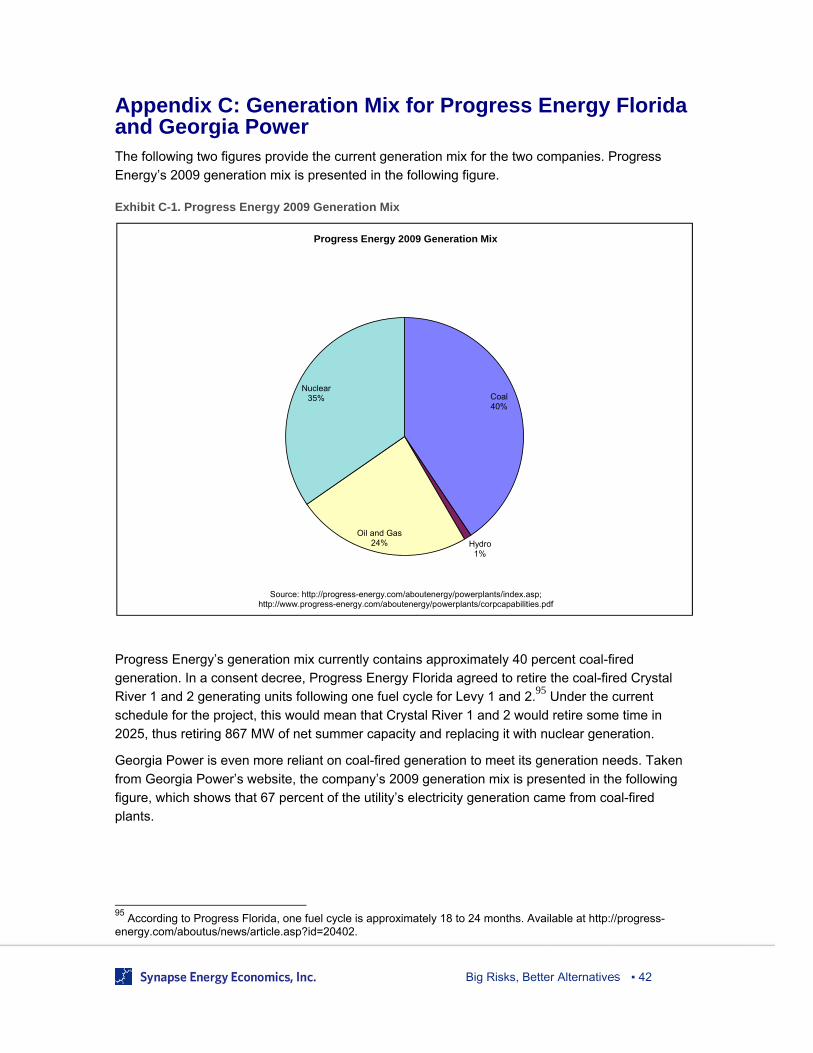
Big Risks, Better Alternatives ▪ 42
Appendix C: Generation Mix for Progress Energy Florida and Georgia Power The following two figures provide the current generation mix for the two companies. Progress
Energy’s 2009 generation mix is presented in the following figure.
Exhibit C-1. Progress Energy 2009 Generation Mix
Progress Energy’s generation mix currently contains approximately 40 percent coal-fired
generation. In a consent decree, Progress Energy Florida agreed to retire the coal-fired Crystal
River 1 and 2 generating units following one fuel cycle for Levy 1 and 2.95 Under the current
schedule for the project, this would mean that Crystal River 1 and 2 would retire some time in
2025, thus retiring 867 MW of net summer capacity and replacing it with nuclear generation.
Georgia Power is even more reliant on coal-fired generation to meet its generation needs. Taken
from Georgia Power’s website, the company’s 2009 generation mix is presented in the following
figure, which shows that 67 percent of the utility’s electricity generation came from coal-fired
plants.
95
According to Progress Florida, one fuel cycle is approximately 18 to 24 months. Available at http://progress-energy.com/aboutus/news/article.asp?id=20402.
Coal40%
Hydro1%
Oil and Gas24%
Nuclear35%
Progress Energy 2009 Generation Mix
Source: http://progress-energy.com/aboutenergy/powerplants/index.asp; http://www.progress-energy.com/aboutenergy/powerplants/corpcapabilities.pdf
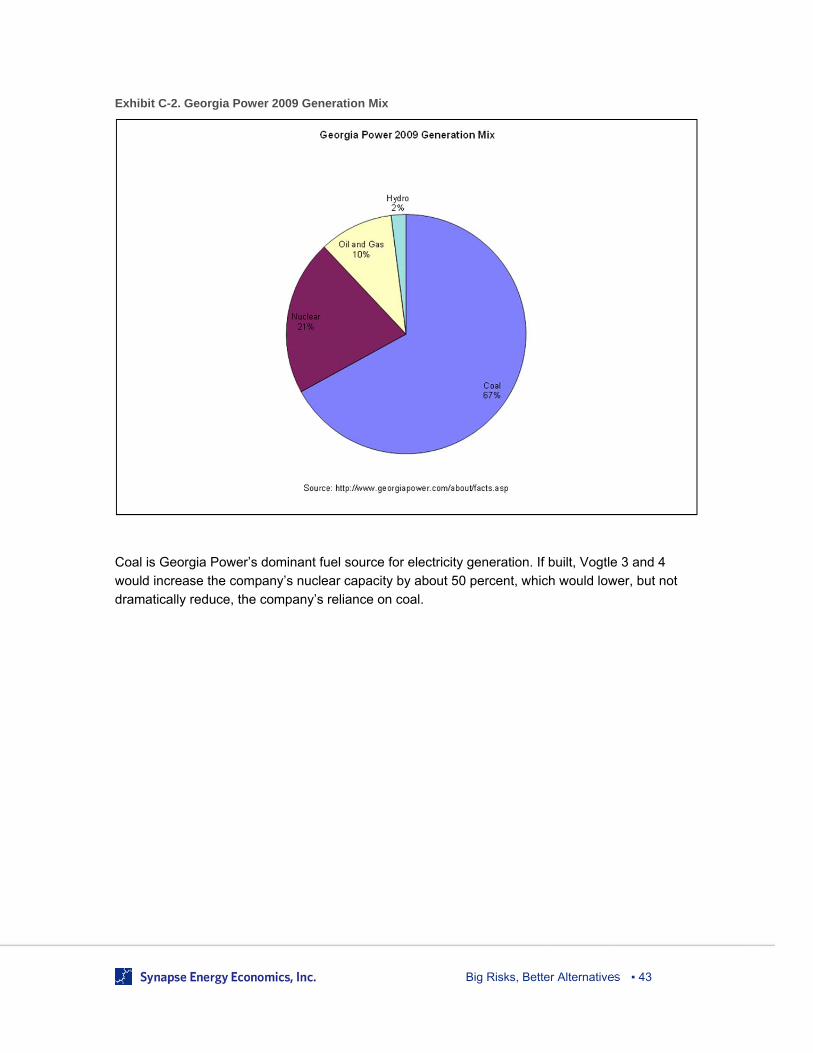
Big Risks, Better Alternatives ▪ 43
Exhibit C-2. Georgia Power 2009 Generation Mix
Coal is Georgia Power’s dominant fuel source for electricity generation. If built, Vogtle 3 and 4
would increase the company’s nuclear capacity by about 50 percent, which would lower, but not
dramatically reduce, the company’s reliance on coal.
Big Risks, Better Alternatives ▪ 44
Appendix D: Drivers of Cost Uncertainty
Capital Costs
For nuclear and renewable energy resources, capital costs are the most significant part of the
levelized costs.
For non-coal conventional generating resources (e.g. natural gas plants), capital costs are fairly
stable. The technology is mature and surprises are rare. Nevertheless, the costs for a given
technology can vary from site to site by as much as 20 percent depending on special conditions
such as fuel supply, financing costs, transmission infrastructure, and regional construction cost
differences.
Fuel Costs
For natural gas and coal plants, the fuel and operating costs are the most significant part of the
levelized costs. For natural gas plants, fuel costs account for more than half of the total levelized
cost. Thus variations in capital cost are of lesser importance. Although natural gas prices were
fairly high and volatile several years ago, the current development of non-conventional resources
such as the Marcellus shale has turned that around.
For wind and solar technologies, the fuel cost would be zero. For nuclear power, the fuel costs of
uranium represent less than 10 percent of the levelized cost of a project.
The development of shale gas has dramatically altered projections of natural gas reserves in the
last few years. Shale gas is now generally viewed as the long-term marginal source of gas in
North America. This means that the cost of producing shale gas is expected to set the market
price. Due to the apparent availability of ample quantities of shale gas and declines in gas use due
to the recession, natural gas prices in 2009 and 2010 were substantially lower than prices in the
prior years.
The most recent Annual Energy Outlook released by the Department of Energy’s Energy
Information Administration (EIA) identifies that natural gas reserves in the United States are
double from a year ago. In addition it noted that,
Because of a revised representation of natural gas pricing and a significant
increase in estimated technically recoverable shale gas resources, the price
of natural gas at the wellhead is consistently lower in the AEO2011 Reference
case than it was in AEO2010.
The annual average natural gas wellhead price remains under $5 per
thousand cubic feet through 2022, but it increases thereafter because
significantly more shale wells must be drilled to meet growth in natural gas
demand and offset declines in natural gas production from other sources.96
96
http://www.eia.doe.gov/forecasts/aeo/early_prices.cfm
Big Risks, Better Alternatives ▪ 45
Greenhouse Gas Costs and Other Regulatory Risks
Although some form of greenhouse gas regulation is probably inevitable, the precise form that this
will take and the resulting CO2 prices are quite uncertain. The effect would be to increase the
levelized costs for all plants burning fossil fuels (coal, oil, and natural gas). In this analysis we use
a mid-range estimate based on a previous Synapse study.97
Other regulatory risks include uncertainty regarding the extension of the production tax credit and
the availability of federal loan guarantees.
Inflation Rates, Technology Progress, and Learning by Doing
Levelized costs are also affected by three dynamic forces that drive changes in plant costs over
time. These factors have been detailed by the EIA, and include: 98
The projected relationship between rate of inflation for key drivers of plant costs, such as
materials and construction costs, and the overall economy-wide rate of inflation. A
projected economy-wide inflation rate that exceeds projected inflation for key plant cost
drivers results in a projected decline in real (inflation-adjusted) capital costs.
Projected technology progress over time.
Learning-by-doing, which allows for additional reductions in projected capital costs as a
function of cumulative additions of new technologies, has a further effect on technology
costs.99
97
Synapse 2008 CO2 Price Forecasts, July 2008. http://www.synapse-energy.com/Downloads/SynapsePaper.2008-07.0.2008-Carbon-Paper.A0020.pdf 98 http://www.eia.gov/oiaf/beck_plantcosts/index.html 99
Although as noted in the section of nuclear cost uncertainty, for the nuclear industry the reverse has also been true, in that learning has resulted in increasing costs.
Big Risks, Better Alternatives ▪ 46
Appendix E: Cost of Energy Efficiency Energy efficiency has been consistently proven to be one of the most cost-effective electricity
resources available.100 For example, efficiency programs were recently incorporated into electric
capacity markets in New England, and these resources, along with demand response programs,
have helped to drive down the costs of capacity in the region.101
The cost of saved energy (CSE) from utility energy efficiency programs is currently well below the
all-in cost of new conventional supply-side resources. In 2009, ACEEE conducted a study that
reviewed the cost of saved energy in utility and third party efficiency programs from 14 leading
states, and concluded that the average utility costs ranged from 1.5 to 3.4 cents per kWh, an
average value of 2.5 cents/kWh.102 That study also found that, on average, utilities bear about 60
percent of the energy efficiency cost and customers about 40 percent. This implies that the total
cost of energy efficiency measures, including participants’ costs, is about 4 cents/kWh.
Both Florida and Georgia have significant room for improvement when it comes to making energy
efficiency investments. According to ACEEE, in 2010, overall Georgia ranked 37th and Florida
ranked 30th as benchmarked against six energy efficiency categories, including 1) program
funding and policy, 2) transportation, 3) building energy, 4) combined heat and power, 5) state
government initiatives, and 6) appliance efficiency.103 For specific attributes, we have detailed
Georgia and Florida’s rankings compared to leading states. One metric is how the states’
incremental savings compared to electricity sales. ACEEE used 2008 electricity sales in its recent
scorecard analysis, as shown in Exhibit E-1 below.
100
Friedrich, Katherine., Eldridge, Maggie., York, Dan., Witte, Patti., Kushler, Marty. Saving Energy Cost-effectively: A National Review of the Cost of Energy Saved through Utility-sector Energy Efficiency Programs. ACEEE. September 2009. 101
In the first Forward Capacity Auction, February 2008, the auction ended at the floor price of $4.50 per kW per month with an excess capacity of 2,047 MW above the installed capacity requirement of 32,305 MW. In the auction, 2,554 MW of capacity were from demand resources (including efficiency). Thus it is likely that without the demand resources, the clearing price would be above the floor price of $4.50 per kW per month since there would not have been an excess of capacity to meet the installed capacity requirement. Taken from, Jenkins, C., Neme, C., Enterline, S.. “Energy efficiency as a resource in the ISO New England forward capacity market.” 2009. Available at http://www.veic.org/Libraries/Resource_Library_Documents/ISO_NewENgland_ECEEE_Jenkins.sflb.ashx. 102
The utility cost of saved energy through energy efficiency programs represents the costs incurred by the utility or efficiency program administrator. This metric typically includes the costs associated with program administration, marketing, measurement and evaluation, and participant incentives and rebates, but it excludes participants’ costs – the cost participants pay minus the amount of utility incentives. Total costs capture both cost categories. 103
The full report is available at http://www.aceee.org/sector/state-policy/scorecard.
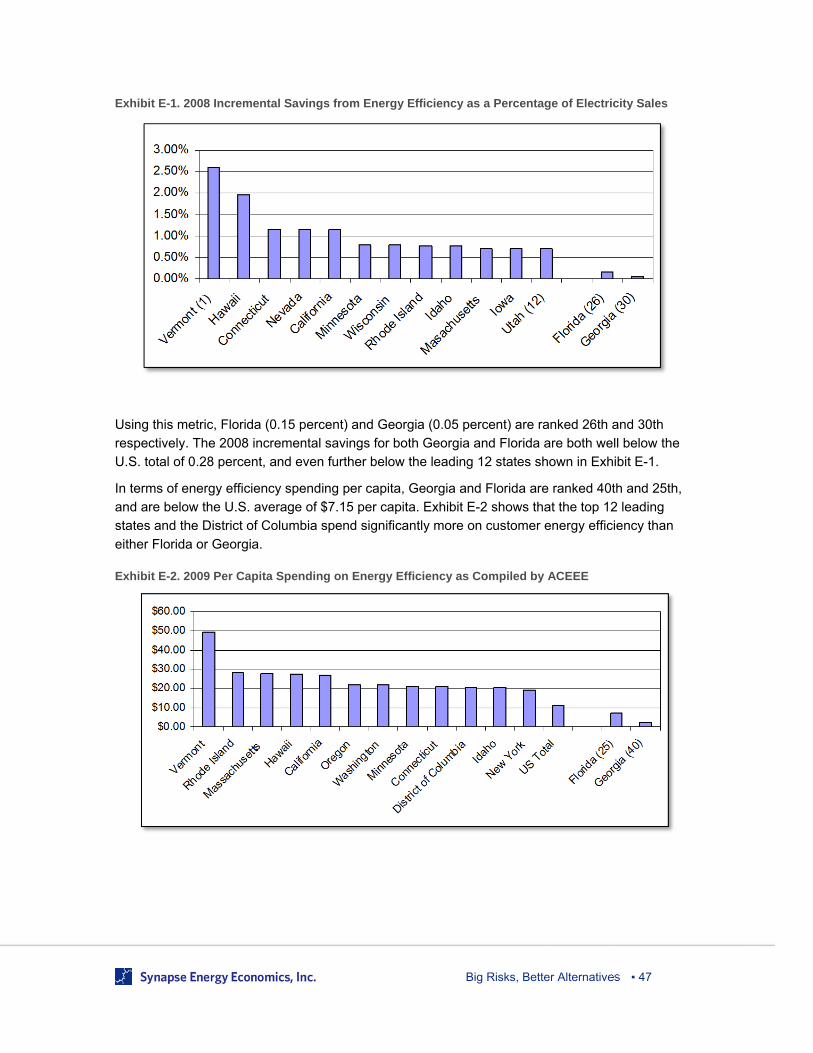
Big Risks, Better Alternatives ▪ 47
Exhibit E-1. 2008 Incremental Savings from Energy Efficiency as a Percentage of Electricity Sales
Using this metric, Florida (0.15 percent) and Georgia (0.05 percent) are ranked 26th and 30th
respectively. The 2008 incremental savings for both Georgia and Florida are both well below the
U.S. total of 0.28 percent, and even further below the leading 12 states shown in Exhibit E-1.
In terms of energy efficiency spending per capita, Georgia and Florida are ranked 40th and 25th,
and are below the U.S. average of $7.15 per capita. Exhibit E-2 shows that the top 12 leading
states and the District of Columbia spend significantly more on customer energy efficiency than
either Florida or Georgia.
Exhibit E-2. 2009 Per Capita Spending on Energy Efficiency as Compiled by ACEEE
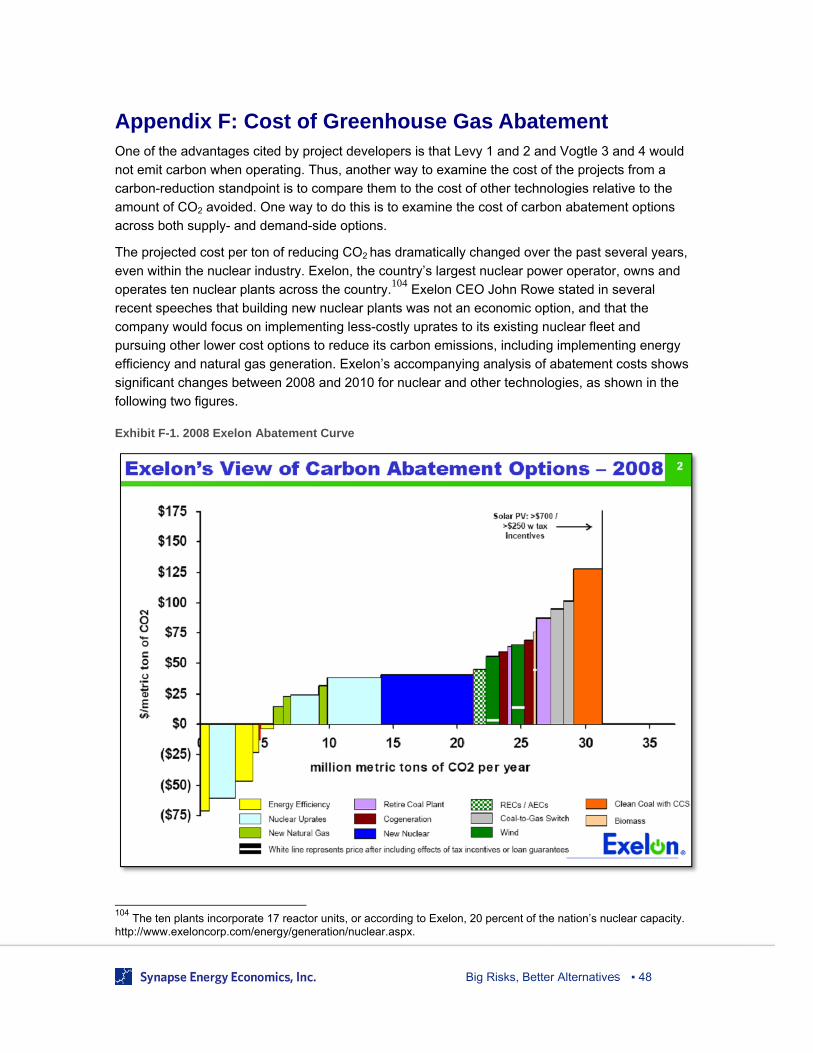
Big Risks, Better Alternatives ▪ 48
Appendix F: Cost of Greenhouse Gas Abatement One of the advantages cited by project developers is that Levy 1 and 2 and Vogtle 3 and 4 would
not emit carbon when operating. Thus, another way to examine the cost of the projects from a
carbon-reduction standpoint is to compare them to the cost of other technologies relative to the
amount of CO2 avoided. One way to do this is to examine the cost of carbon abatement options
across both supply- and demand-side options.
The projected cost per ton of reducing CO2 has dramatically changed over the past several years,
even within the nuclear industry. Exelon, the country’s largest nuclear power operator, owns and
operates ten nuclear plants across the country.104 Exelon CEO John Rowe stated in several
recent speeches that building new nuclear plants was not an economic option, and that the
company would focus on implementing less-costly uprates to its existing nuclear fleet and
pursuing other lower cost options to reduce its carbon emissions, including implementing energy
efficiency and natural gas generation. Exelon’s accompanying analysis of abatement costs shows
significant changes between 2008 and 2010 for nuclear and other technologies, as shown in the
following two figures.
Exhibit F-1. 2008 Exelon Abatement Curve
104
The ten plants incorporate 17 reactor units, or according to Exelon, 20 percent of the nation’s nuclear capacity. http://www.exeloncorp.com/energy/generation/nuclear.aspx.
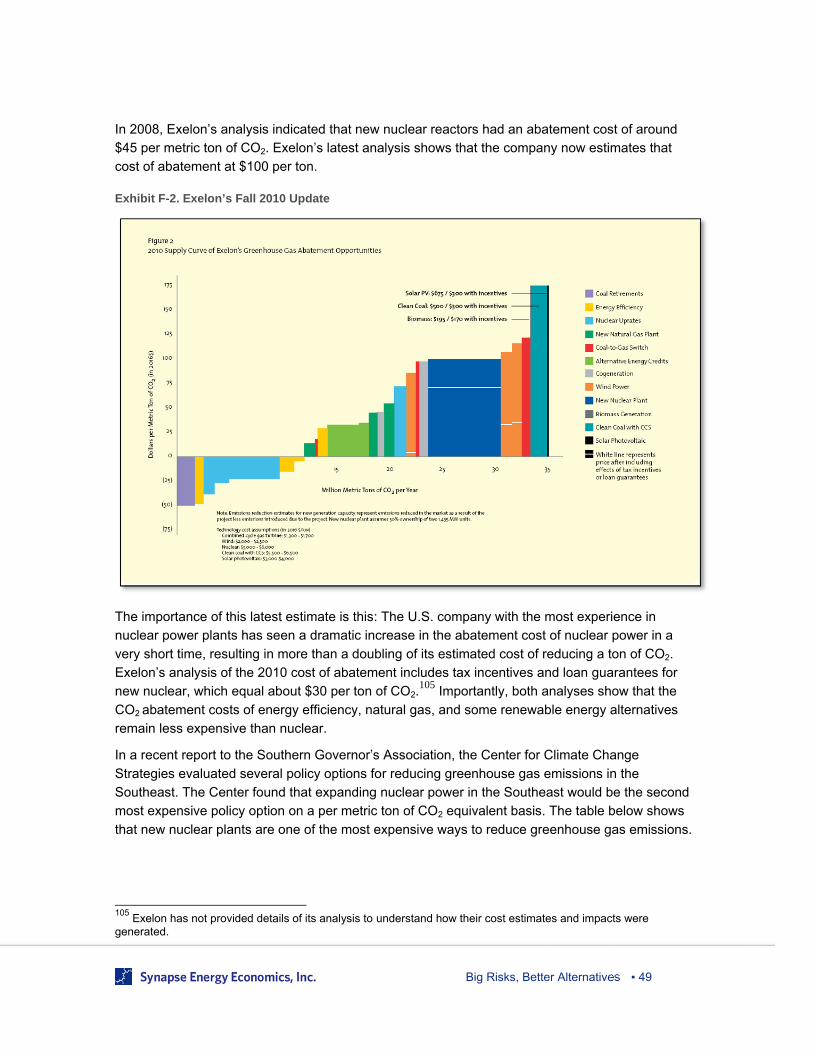
Big Risks, Better Alternatives ▪ 49
In 2008, Exelon’s analysis indicated that new nuclear reactors had an abatement cost of around
$45 per metric ton of CO2. Exelon’s latest analysis shows that the company now estimates that
cost of abatement at $100 per ton.
Exhibit F-2. Exelon’s Fall 2010 Update
The importance of this latest estimate is this: The U.S. company with the most experience in
nuclear power plants has seen a dramatic increase in the abatement cost of nuclear power in a
very short time, resulting in more than a doubling of its estimated cost of reducing a ton of CO2.
Exelon’s analysis of the 2010 cost of abatement includes tax incentives and loan guarantees for
new nuclear, which equal about $30 per ton of CO2.105 Importantly, both analyses show that the
CO2 abatement costs of energy efficiency, natural gas, and some renewable energy alternatives
remain less expensive than nuclear.
In a recent report to the Southern Governor’s Association, the Center for Climate Change
Strategies evaluated several policy options for reducing greenhouse gas emissions in the
Southeast. The Center found that expanding nuclear power in the Southeast would be the second
most expensive policy option on a per metric ton of CO2 equivalent basis. The table below shows
that new nuclear plants are one of the most expensive ways to reduce greenhouse gas emissions.
105
Exelon has not provided details of its analysis to understand how their cost estimates and impacts were generated.
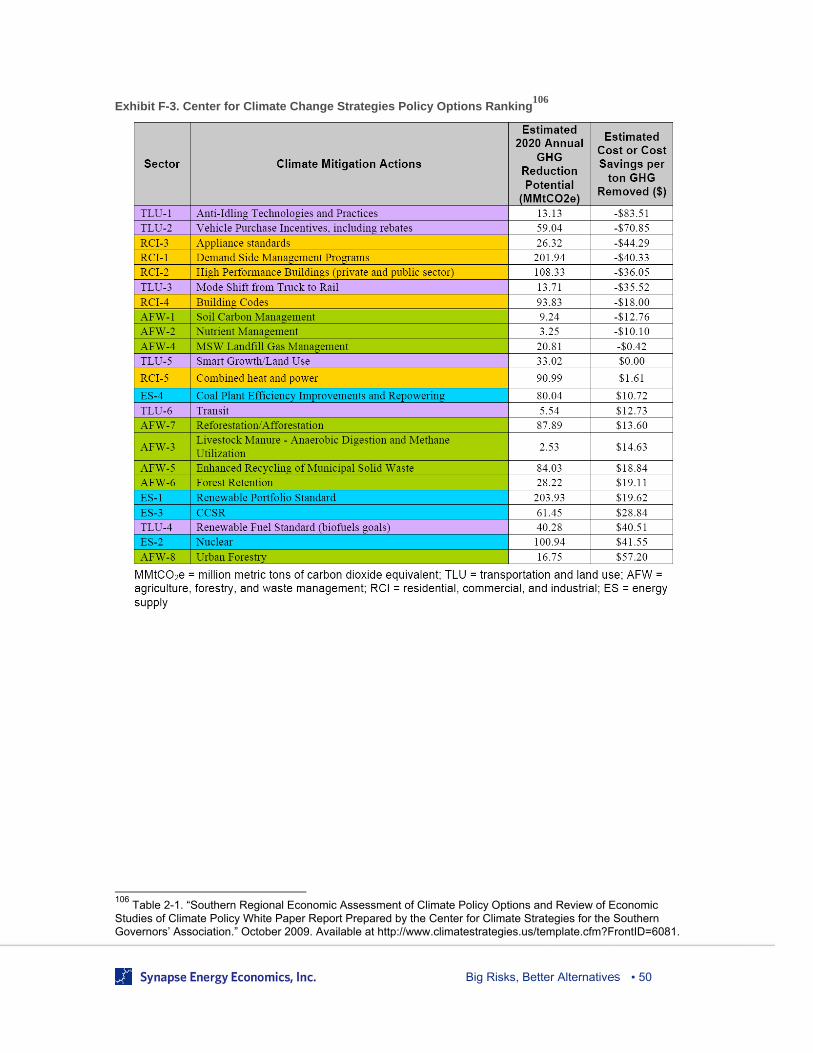
Big Risks, Better Alternatives ▪ 50
Exhibit F-3. Center for Climate Change Strategies Policy Options Ranking106
106
Table 2-1. “Southern Regional Economic Assessment of Climate Policy Options and Review of Economic Studies of Climate Policy White Paper Report Prepared by the Center for Climate Strategies for the Southern Governors’ Association.” October 2009. Available at http://www.climatestrategies.us/template.cfm?FrontID=6081.
Big Risks, Better Alternatives ▪ 51
Appendix G: Renewable Potential in Georgia The following section provides more detail about biomass and off-shore wind potential in Georgia.
Biomass Potential
A number of studies have investigated the biomass potential in Georgia:
In its 2010 IRP, Georgia Power found that Georgia has significant woody biomass
potential:
The state of Georgia and the Southeast have an abundance of
forestry and woody biomass resources available for energy use, as
evidenced, for example, by fuel studies for Plant Mitchell, as well as
data produced by the Georgia Forestry Commission and the U.S.
Forest Service.107
In addition, Southern Company has commissioned the Electric Power Research Institute
to conduct feasibility studies into converting existing power plants to biomass.108 These
studies are ongoing and their results are not currently publicly available. One example has
been the discussion of converting the 156 MW coal-fired Plant Mitchell into a 96 MW
biomass plant.109
A 2005 study conducted for the Georgia Forestry Commission identified approximately
23,000 GWh, or approximately 17 percent of 2008 statewide retail electricity sales, of
biomass potential in Georgia.110 It further identified 18.8 million dry tons of wood biomass
available annually.111 While this value does not represent what is economically possible
since it ignores transport costs and new plant infrastructure, it does suggest that there is a
resource potential that should be analyzed in the context of new resource planning within
the state.
As a rough exercise, we converted the annual available dry tons to electricity to determine an
approximate technical potential for woody biomass for the state. To convert the woody biomass to
heat energy content, we used conversion factors from a 2007 woody biomass study conducted for
the City of Gainesville, FL.112 We then multiplied the heat energy content by a heat rate of a
biomass boiler, in this case 8,657 Btu/kWh with an 80 percent capacity factor taken from a 2007
107
Georgia Power. 2010 Integrated Resource Plan Main Document. Georgia Public Service Commission Docket 31081. (p.10-16) 108
Georgia Power. (2010) (p.10-14) 109
Georgia Power. (2010) (p.15-4) 110
General Bioenergy Inc. “Biomass Wood Resource Assessment on a County-by-County Basis for the State of Georgia.” November 9, 2005. Available at http://www.gfc.state.ga.us/ForestMarketing/documents/BiomassWRACountybyCountyGA05.pdf. 111
General*Bioenergy Inc. “Biomass Wood Resource Assessment on a County-by-County Basis for the State of Georgia.” November 9, 2005. Available at http://www.gfc.state.ga.us/ForestMarketing/documents/BiomassWRACountybyCountyGA05.pdf. 112 Carter, Douglas., Langholtz, Matthew., Schroeder, Richard. Biomass Resource Assessment Part I: Availability and Cost of Analysis of Woody Biomass for Gainesville Regional Utilities. October, 2007. Available at http://www.gru.com/AboutGRU/PublicDiscussion/FuturePower/default.jsp.
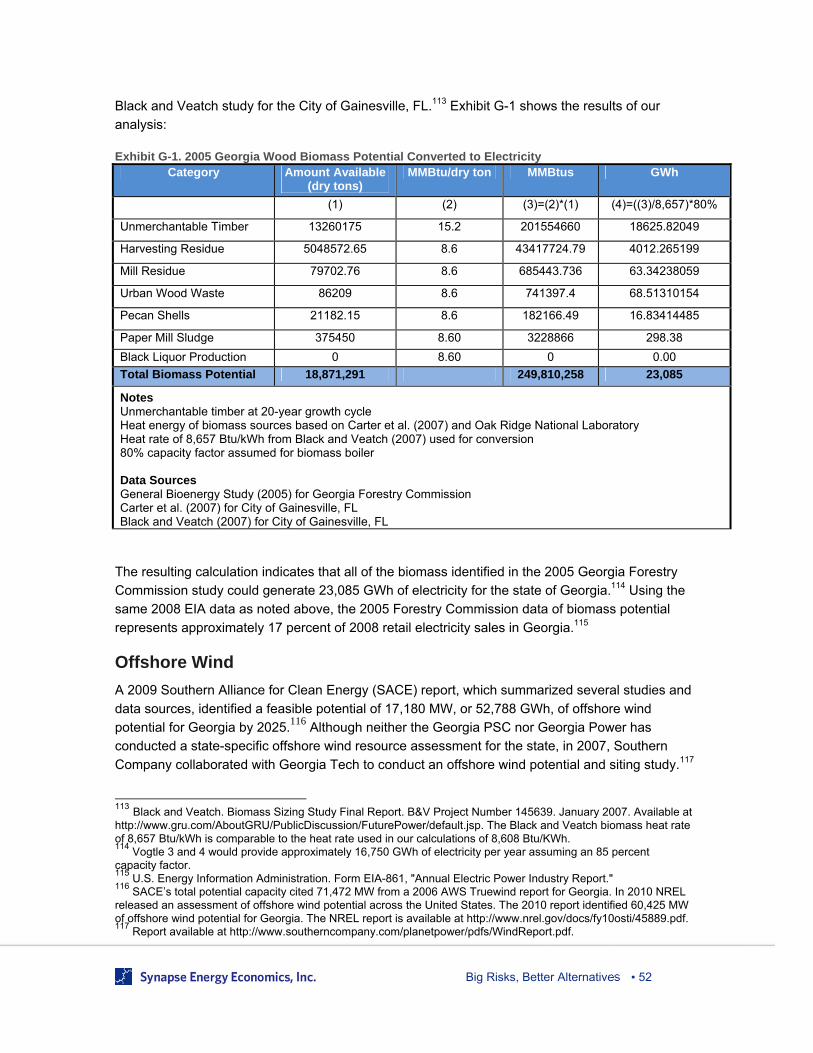
Big Risks, Better Alternatives ▪ 52
Black and Veatch study for the City of Gainesville, FL.113 Exhibit G-1 shows the results of our
analysis:
Exhibit G-1. 2005 Georgia Wood Biomass Potential Converted to Electricity Category Amount Available
(dry tons) MMBtu/dry ton MMBtus GWh
(1) (2) (3)=(2)*(1) (4)=((3)/8,657)*80%
Unmerchantable Timber 13260175 15.2 201554660 18625.82049
Harvesting Residue 5048572.65 8.6 43417724.79 4012.265199
Mill Residue 79702.76 8.6 685443.736 63.34238059
Urban Wood Waste 86209 8.6 741397.4 68.51310154
Pecan Shells 21182.15 8.6 182166.49 16.83414485
Paper Mill Sludge 375450 8.60 3228866 298.38
Black Liquor Production 0 8.60 0 0.00
Total Biomass Potential 18,871,291 249,810,258 23,085
Notes Unmerchantable timber at 20-year growth cycle Heat energy of biomass sources based on Carter et al. (2007) and Oak Ridge National Laboratory Heat rate of 8,657 Btu/kWh from Black and Veatch (2007) used for conversion 80% capacity factor assumed for biomass boiler Data Sources General Bioenergy Study (2005) for Georgia Forestry Commission Carter et al. (2007) for City of Gainesville, FL Black and Veatch (2007) for City of Gainesville, FL
The resulting calculation indicates that all of the biomass identified in the 2005 Georgia Forestry
Commission study could generate 23,085 GWh of electricity for the state of Georgia.114 Using the
same 2008 EIA data as noted above, the 2005 Forestry Commission data of biomass potential
represents approximately 17 percent of 2008 retail electricity sales in Georgia.115
Offshore Wind
A 2009 Southern Alliance for Clean Energy (SACE) report, which summarized several studies and
data sources, identified a feasible potential of 17,180 MW, or 52,788 GWh, of offshore wind
potential for Georgia by 2025.116 Although neither the Georgia PSC nor Georgia Power has
conducted a state-specific offshore wind resource assessment for the state, in 2007, Southern
Company collaborated with Georgia Tech to conduct an offshore wind potential and siting study.117
113 Black and Veatch. Biomass Sizing Study Final Report. B&V Project Number 145639. January 2007. Available at http://www.gru.com/AboutGRU/PublicDiscussion/FuturePower/default.jsp. The Black and Veatch biomass heat rate of 8,657 Btu/kWh is comparable to the heat rate used in our calculations of 8,608 Btu/KWh. 114
Vogtle 3 and 4 would provide approximately 16,750 GWh of electricity per year assuming an 85 percent capacity factor. 115
U.S. Energy Information Administration. Form EIA-861, "Annual Electric Power Industry Report." 116
SACE’s total potential capacity cited 71,472 MW from a 2006 AWS Truewind report for Georgia. In 2010 NREL released an assessment of offshore wind potential across the United States. The 2010 report identified 60,425 MW of offshore wind potential for Georgia. The NREL report is available at http://www.nrel.gov/docs/fy10osti/45889.pdf. 117
Report available at http://www.southerncompany.com/planetpower/pdfs/WindReport.pdf.

Big Risks, Better Alternatives ▪ 53
This report did not attempt to evaluate the full potential of offshore wind in Georgia; rather, it was a
Georgia Power analysis of a specific offshore wind project. The Southern Company report
concluded that a 160 MW offshore wind farm could cost $88 per MWh on a 20-year levelized
basis (2010$).118
118
We have inflated the Company’s reported levelized dollars from $82 per MWh in 2006$ to $87.7 in 2010$.