BIG IN YOUR LIFE
66
STOCK CODE: BSE: 532538 NSE: ULTRACEMCO REUTERS: UTCL.NS BLOOMBERG: UTCEM IS / UTCEM LX UltraTech Cement Limited BIG IN YOUR LIFE
Transcript of BIG IN YOUR LIFE
STOCK CODE: BSE: 532538 NSE: ULTRACEMCO REUTERS: UTCL.NS BLOOMBERG: UTCEM IS / UTCEM LX
UltraTech Cement Limited
BIG IN YOUR LIFE

Contents
2
Aditya Birla Group Overview
01
Indian Cement Sector
02
UltraTech Landscape
03
Operational and Financial Performance
04
GLOSSARY: MNT – Million Metric Tons, LMT – Lakh Metric Tons, MTPA – Million Tons Per Annum, MW – Mega Watts, Q1 – April-June, Q2 – July-September,
Q3 – October-December, Q4 – January -March, CY – Current Year period, LY – Corresponding period Last Year, FY – Financial Year (April-March)

Aditya Birla Group - Overview
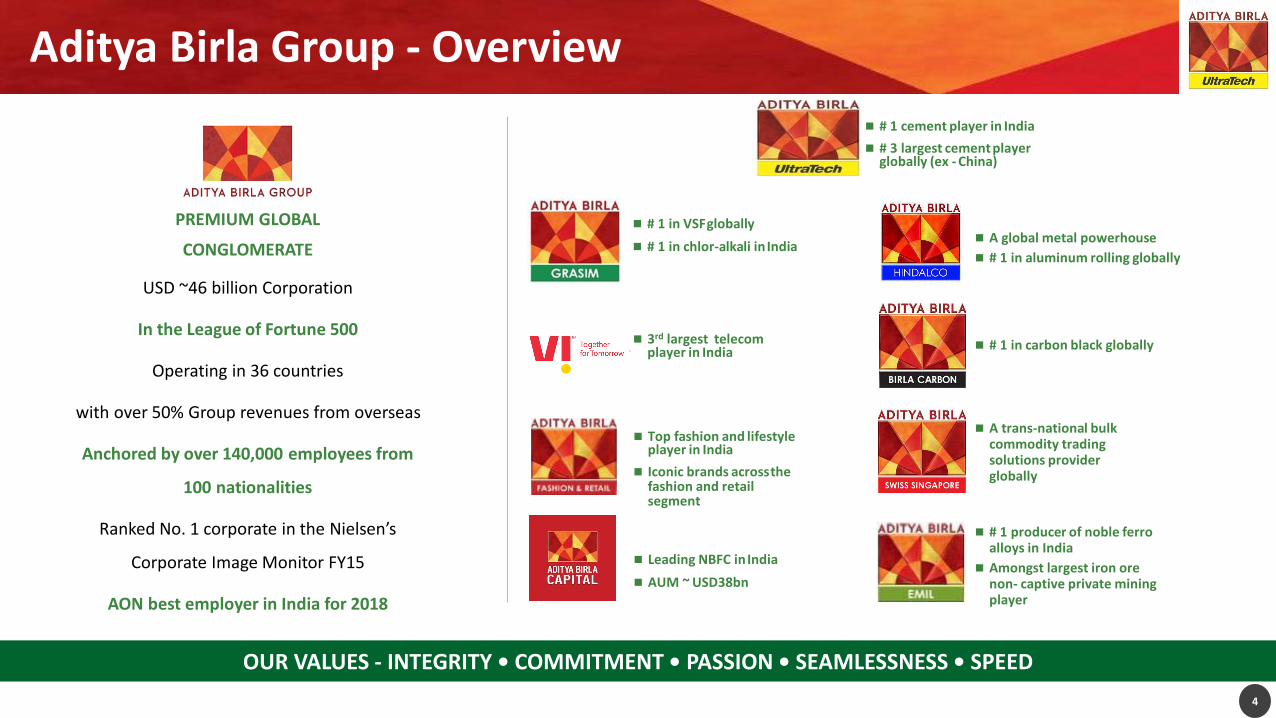
Aditya Birla Group - Overview
4
PREMIUM GLOBAL
CONGLOMERATE
USD ~46 billion Corporation
In the League of Fortune 500
Operating in 36 countries
with over 50% Group revenues from overseas
Anchored by over 140,000 employees from
100 nationalities
Ranked No. 1 corporate in the Nielsen’s
Corporate Image Monitor FY15
AON best employer in India for 2018
◼ A global metal powerhouse
◼ # 1 in aluminum rolling globally
◼ # 1 in carbon black globally
◼ A trans-national bulk commodity trading solutions provider globally
◼ # 1 producer of noble ferro alloys in India
◼ Amongst largest iron ore non- captive private mining player
OUR VALUES - INTEGRITY • COMMITMENT • PASSION • SEAMLESSNESS • SPEED
◼ Leading NBFC inIndia
◼ AUM ~ USD38bn
◼ Top fashion and lifestyle player in India
◼ Iconic brands acrossthe fashion and retail segment
◼ 3rd largest telecom player in India
◼ # 1 in VSFglobally
◼ # 1 in chlor-alkali inIndia
◼ # 1 cement player in India
◼ # 3 largest cement player globally (ex - China)
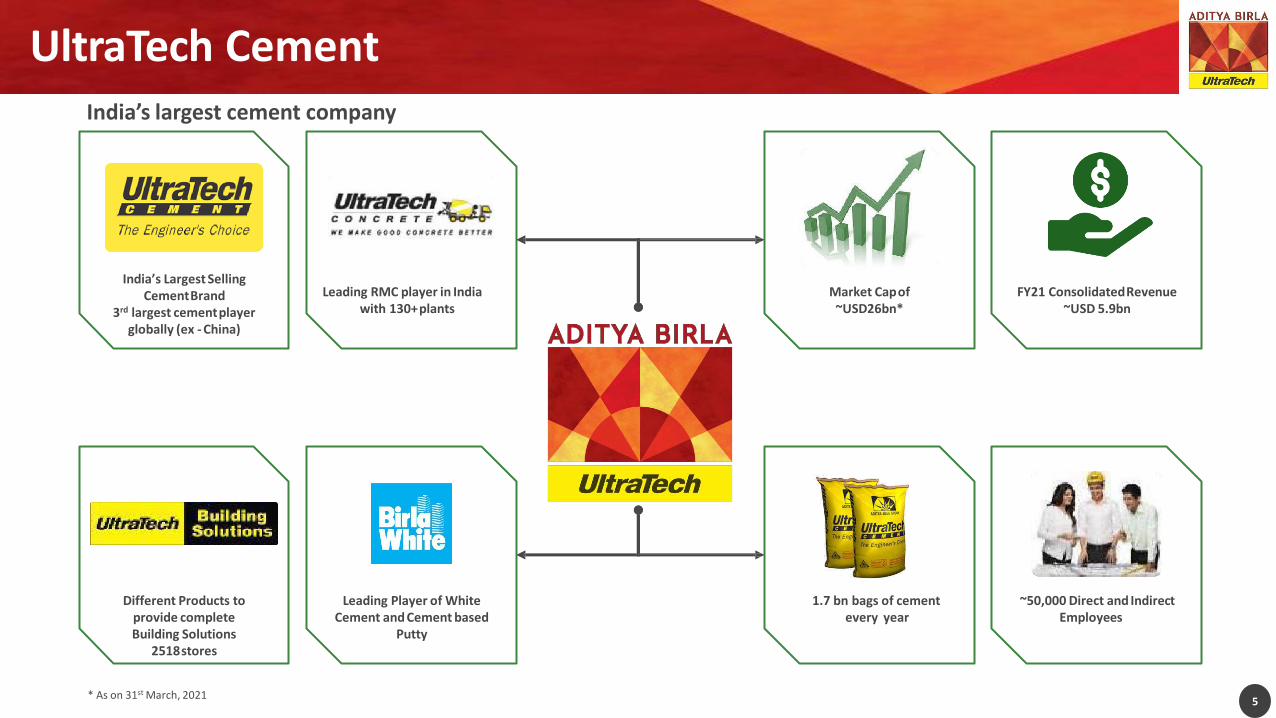
UltraTech CementIndia’s largest cement company
India’s Largest Selling CementBrand
3rd largest cementplayer globally (ex - China)
Leading RMC player in India with 130+plants
Market Capof~USD26bn*
FY21 ConsolidatedRevenue~USD 5.9bn
Different Products to provide completeBuilding Solutions
2518stores
Leading Player of White Cement and Cement based
Putty
1.7 bn bags of cementevery year
~50,000 Direct and Indirect Employees
5* As on 31st March, 2021
Building the Sustainable Future
6
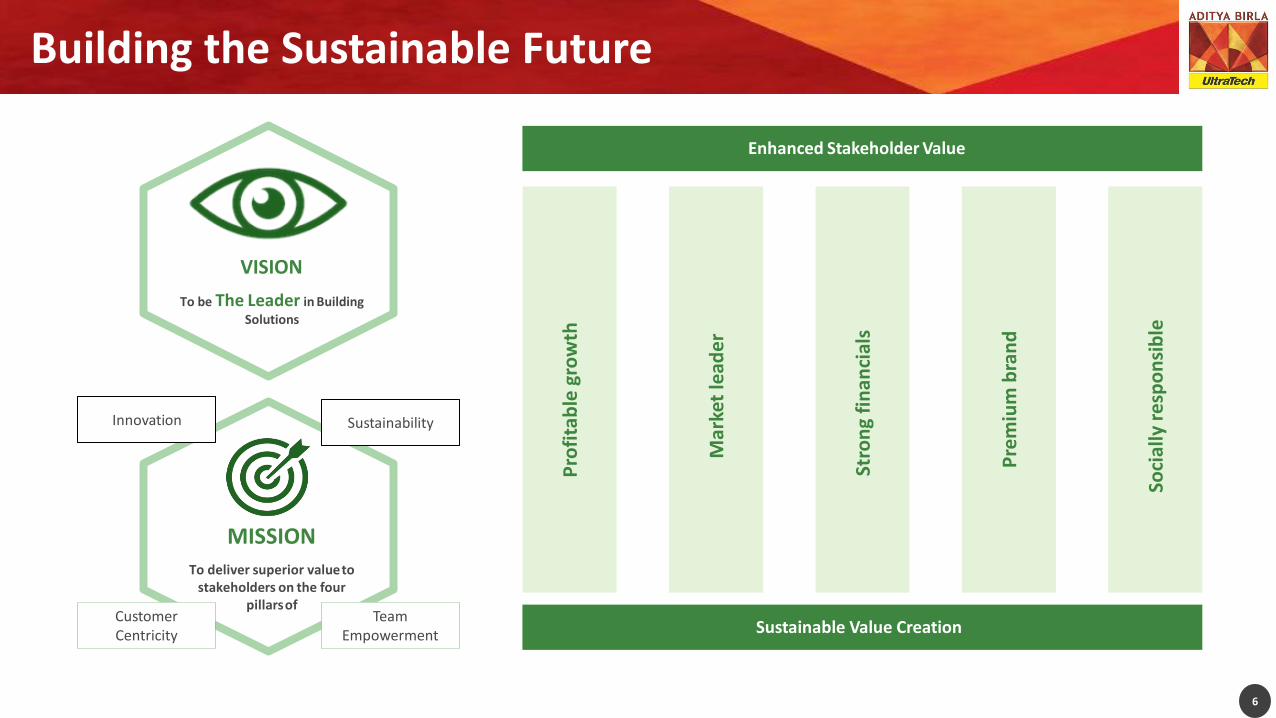
VISION
To be The Leader in Building
Solutions
MISSION
To deliver superior valueto stakeholders on the four
pillarsof
SustainabilityInnovation
Pro
fita
ble
gro
wth
Mar
ket
lead
er
Stro
ng
fin
an
cial
s
Pre
miu
mb
ran
d
Soci
ally
resp
on
sib
le
Enhanced Stakeholder Value
Sustainable Value CreationCustomerCentricity
Team Empowerment

Diversified product portfolio catering a full suite of building solutions
7
White Cement: 1988White Putty : 2001
1998
Ready mix Concrete
Building Solutions
Building Products
Portfolio of white cement, white putty, VAPS Textura,
Levelplast, pre-cote and fragrance putty
Tailor made concrete solutions with 35 specialty
concretes based onapplication
One-stop building solutions for the retail customer
Portfolio of building solution products such as plasters and mortars, tile adhesive, waterproofing
products etc.
1st Cement plant
set up in 1983
Grey Cement
Ordinary Portland Cement, Portland blast-furnace slag
Cement, Portland Pozzolana Cement, Portland Composite
Cement
White Cement
Contemporary: Providing an umbrellaof related construction products and services
Leading player
in India
130+ RMC plants in
41cities
2,518 outlets in
21 States
Range of
15products
Conventional: Positioning cement at the core of all construction
Current capacity
116.8MTPA
7
2007
2012
Building solutions
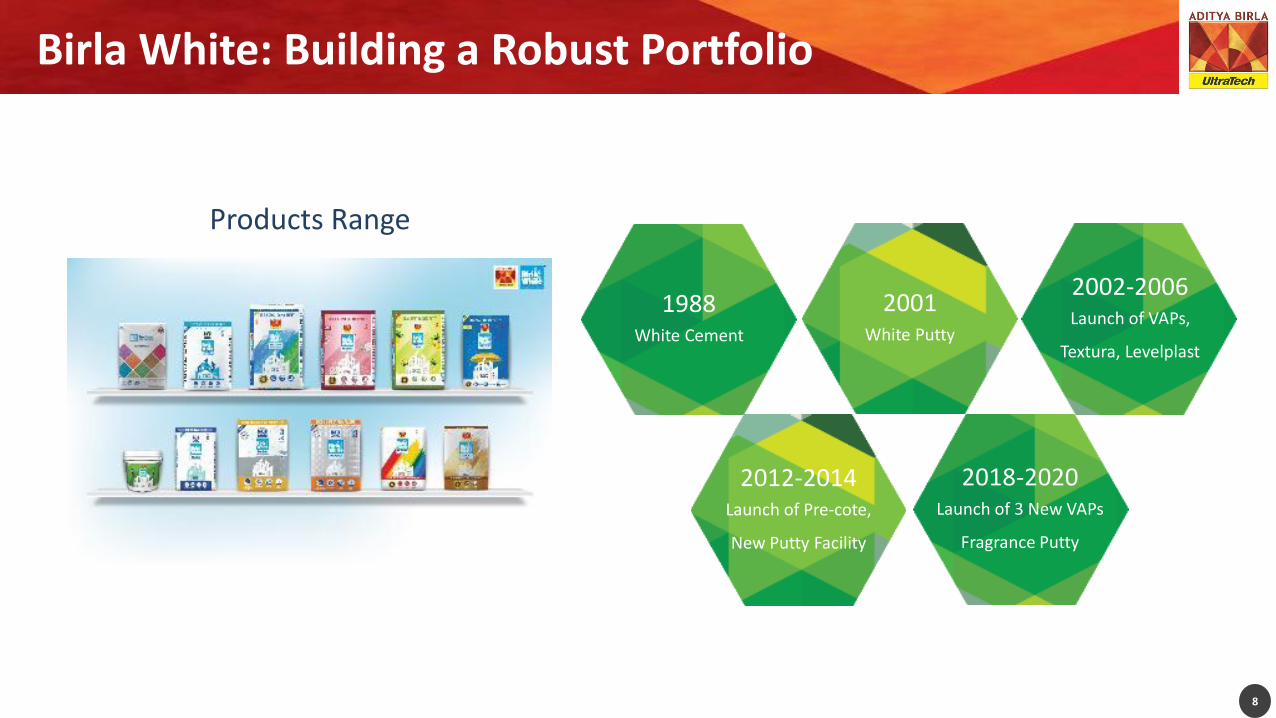
Birla White: Building a Robust Portfolio
Products Range
8
8
1988White Cement
2001White Putty
2002-2006Launch of VAPs,
Textura, Levelplast
2012-2014 Launch of Pre-cote,
New Putty Facility
2018-2020 Launch of 3 New VAPs
Fragrance Putty
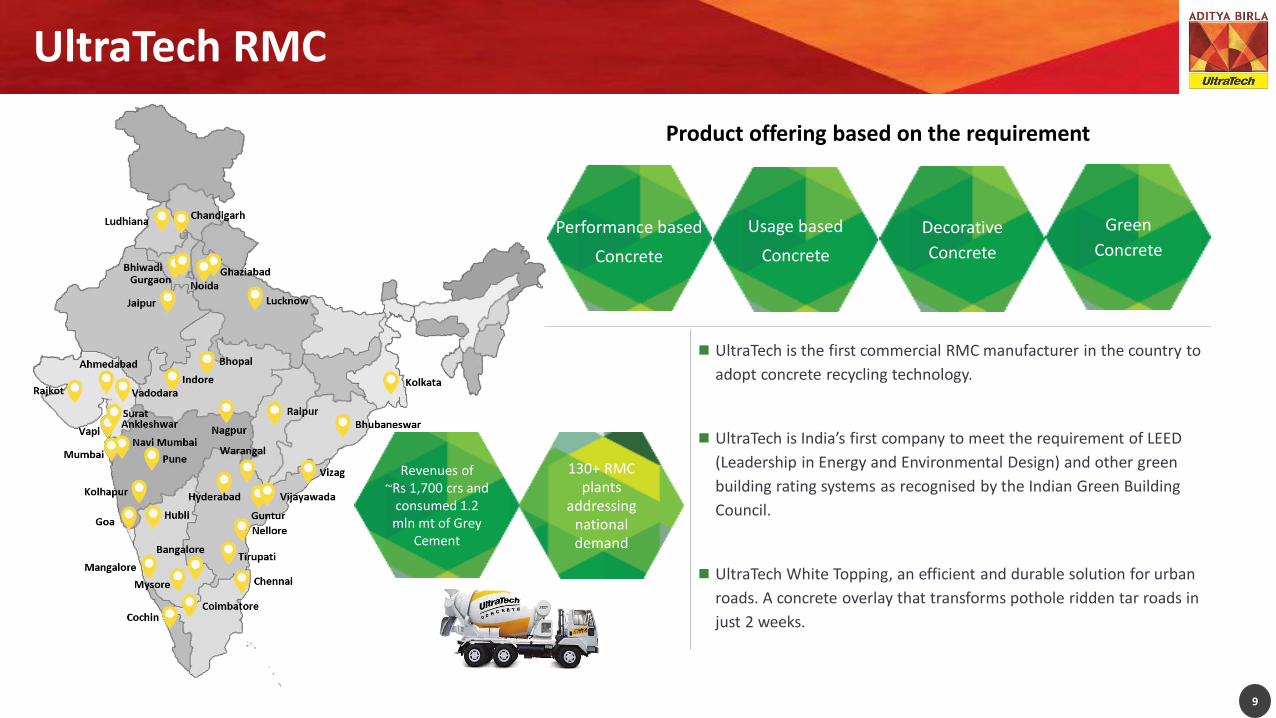
UltraTech RMC
9
Performance based
Concrete
Usage based
Concrete
Decorative
Concrete
Green
Concrete
Revenues of ~Rs 1,700 crs and
consumed 1.2 mln mt of Grey
Cement
130+ RMC plants
addressing national demand
◼ UltraTech is the first commercial RMC manufacturer in the country to
adopt concrete recycling technology.
◼ UltraTech is India’s first company to meet the requirement of LEED
(Leadership in Energy and Environmental Design) and other green
building rating systems as recognised by the Indian Green Building
Council.
◼ UltraTech White Topping, an efficient and durable solution for urban
roads. A concrete overlay that transforms pothole ridden tar roads in
just 2 weeks.
Product offering based on the requirement

UltraTech Building SolutionsOne-stop building solution for the retail customer
2,518 UltraTech Building Solutions outlets
Helps to increase the share ofcustomer wallet
New Product Launches
Tiles
Electricals
Power and Hand Tools
Vaastu
Pest ControlPaint Preview
Mobile Concrere Lab
Benefits for Home Builders
◼ Convenience, trust empowerment
Benefits for Dealers
◼ Increase in earning capacity
◼ Better fit with aspirations of new generation
Sanitary and Fittings
Rain Water Harvesting Wood Ply
Business partners at UltraTech Building Solutions stores
10
Services through UBS Outlets
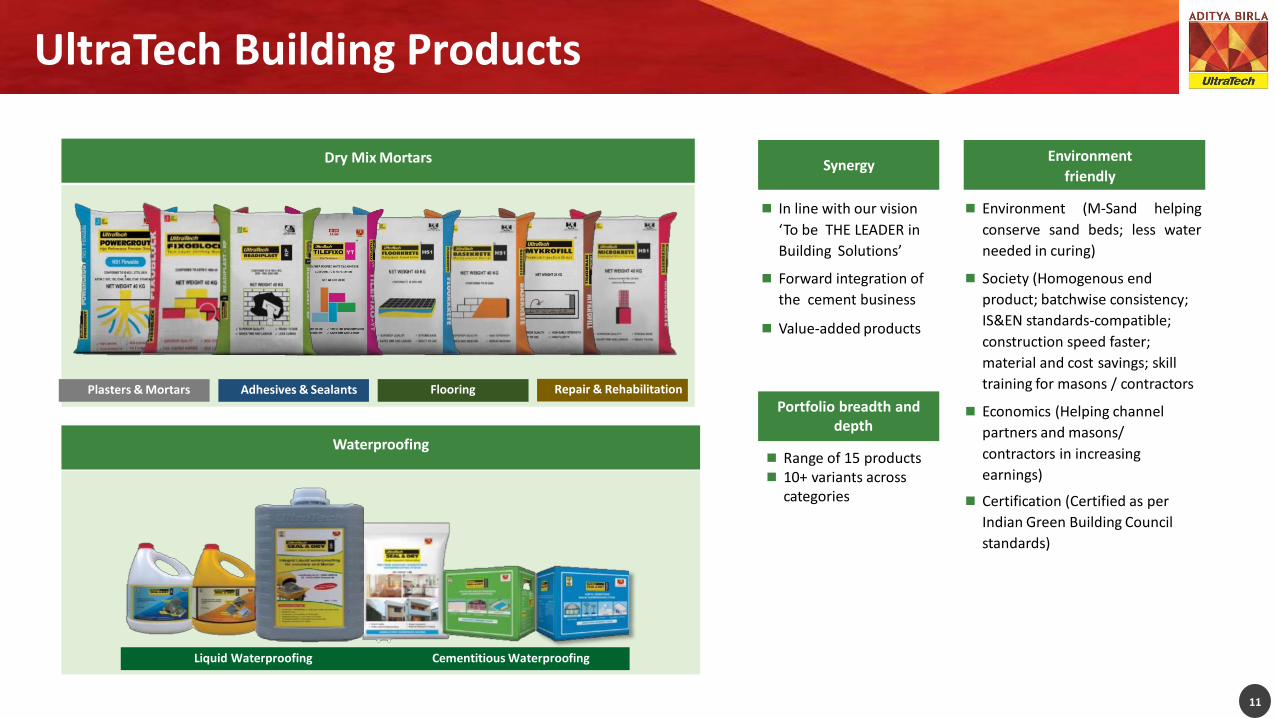
UltraTech Building Products
11
◼ Environment (M-Sand helping
conserve sand beds; less water
needed in curing)
◼ Society (Homogenous end
product; batchwise consistency;
IS&EN standards-compatible;
construction speed faster;
material and cost savings; skill
training for masons / contractors
◼ Economics (Helping channel
partners and masons/
contractors in increasing
earnings)
◼ Certification (Certified as per
Indian Green Building Council
standards)
Environment
friendly
◼ In line with our vision
‘To be THE LEADER in
Building Solutions’
◼ Forward integration of
the cement business
◼ Value-added products
◼ Range of 15 products◼ 10+ variants across
categories
Synergy
Portfolio breadth anddepth
Dry Mix Mortars
Waterproofing
Plasters & Mortars Adhesives & Sealants Flooring Repair & Rehabilitation
Liquid Waterproofing Cementitious Waterproofing

Board of Directors
12
Kumar MangalamBirla
Chairman
◼ Chairman of the Aditya Birla Group since 1995
◼ Chairs the Boards of all the Aditya Birla Group’s major companies in India (Hindalco, Grasim, Vodafone Idea, Aditya Birla Capital and UltraTech Cement) and globally; Global companies include Novelis, Birla Carbon, Aditya Birla Minerals, Aditya Birla Chemicals, Domsjö Fabriker and Terrace Bay Pulp Mill
◼ Professionally a Chartered Accountant and an MBA from London Business School
Rajashree Birla
Non-ExecutiveDirector
◼ Director on the board of Hindalco and Grasim
◼ Chairperson of the Aditya Birla Centre for Community Initiatives and Rural Development
K.K. Maheshwari
Vice Chairman and
Non-Executive Director
◼ Chartered Accountant and has held a variety of roles in the Aditya Birla Group
◼ Brought in strong execution rigor to his work and has considerably strengthened both innovation and new products development
◼ Scripted the growth of the Aditya Birla Group’s VSF Business towards a more competitive and sustainable model
K. C. Jhanwar
ManagingDirector
◼ Chartered Accountant with over 40 years experience of which 39 years is with the Aditya Birla Group
◼ Operations and General Management across the Cement and Chemicals Business of the Aditya Birla Group, including greenfield and brownfield expansions
◼ Chartered Accountant with over 33 years experience, of which over 28 years have been with the Aditya Birla Group
◼ Key responsibilities include risk management, audit and compliance, planning, treasury, capital structuring and capital allocation
◼ Instrumental in M&A deals worth $ 5 bn, portfolio restructuring bringing sharper focus and setting new benchmarks for raising long term borrowings in the domestic and global market, set-up 700 seats shared service centre
Atul Daga
Whole-time Director andChief FinancialOfficer

Board of Directors
13
Arun Adhikari
IndependentDirector
◼ Alumni of the Indian Institute of Technology, Kanpur and the Indian Institute of Management, Calcutta
◼ Areas of expertise - sales and marketing, culminating in general management and leadership roles
Alka Bharucha
IndependentDirector
◼ Masters in Law from the University of Bombay and University of London and Solicitor High Court Mumbai and Supreme Court of England andWales
◼ Co-founded Bharucha & Partners in 2008
◼ Core areas of expertise are mergers and acquisitions, joint ventures, private equity, banking and finance
S.B. Mathur
IndependentDirector
◼ Chartered Accountant by profession
◼ Served as the Chairman of the Life Insurance Corporation of India from August, 2002 to October, 2004
◼ Has held Trusteeships, Advisory / Administrative Roles on Government Bodies, Authorities and Corporations
SukanyaKripalu
IndependentDirector◼ Graduate from St. Xavier’s College and the Indian Institute of Management, Calcutta.
◼ Consultant in the fields of marketing, strategy, advertising and market research.
◼ Bachelor of Technology Hons. (Electrical Engineering) and post graduate diploma in Business Management (Marketing) from the Indian Institute of Management, Calcutta
◼ Served as CEO of the FMCG major Dabur Limited for 17 years from 2002 till 2019
◼ Chaired and co-chaired numerous committees such as Indo-Turkish JBC and FICCI Committee on Food processing
Sunil Duggal
IndependentDirector
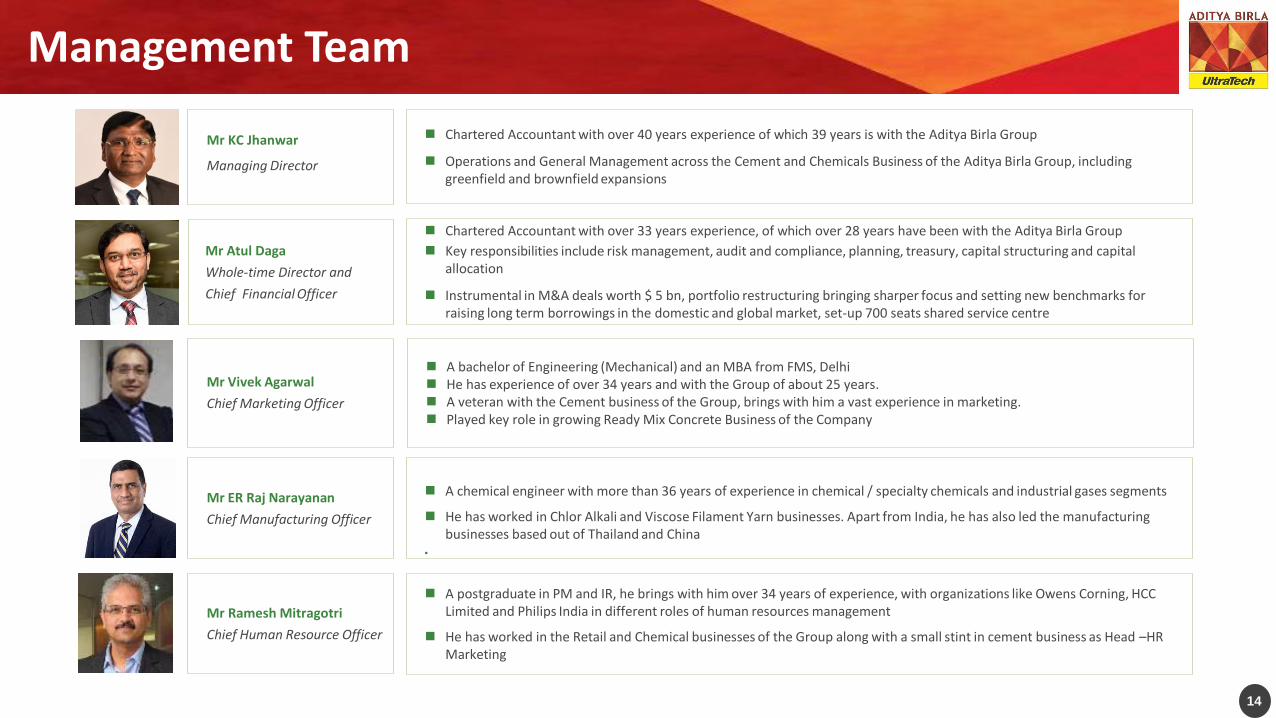
Management Team
14 14
Mr KC Jhanwar
Managing Director
◼ Chartered Accountant with over 40 years experience of which 39 years is with the Aditya Birla Group
◼ Operations and General Management across the Cement and Chemicals Business of the Aditya Birla Group, including greenfield and brownfield expansions
Mr Atul Daga
Whole-time Director and
Chief Financial Officer
◼ Chartered Accountant with over 33 years experience, of which over 28 years have been with the Aditya Birla Group
◼ Key responsibilities include risk management, audit and compliance, planning, treasury, capital structuring and capital allocation
◼ Instrumental in M&A deals worth $ 5 bn, portfolio restructuring bringing sharper focus and setting new benchmarks for raising long term borrowings in the domestic and global market, set-up 700 seats shared service centre
Mr Vivek Agarwal
Chief Marketing Officer
◼ A bachelor of Engineering (Mechanical) and an MBA from FMS, Delhi◼ He has experience of over 34 years and with the Group of about 25 years.◼ A veteran with the Cement business of the Group, brings with him a vast experience in marketing. ◼ Played key role in growing Ready Mix Concrete Business of the Company
Mr ER Raj Narayanan
Chief Manufacturing Officer
◼ A chemical engineer with more than 36 years of experience in chemical / specialty chemicals and industrial gases segments
◼ He has worked in Chlor Alkali and Viscose Filament Yarn businesses. Apart from India, he has also led the manufacturing businesses based out of Thailand and China
◼ c
Mr Ramesh Mitragotri
Chief Human Resource Officer
◼ A postgraduate in PM and IR, he brings with him over 34 years of experience, with organizations like Owens Corning, HCC Limited and Philips India in different roles of human resources management
◼ He has worked in the Retail and Chemical businesses of the Group along with a small stint in cement business as Head –HR Marketing
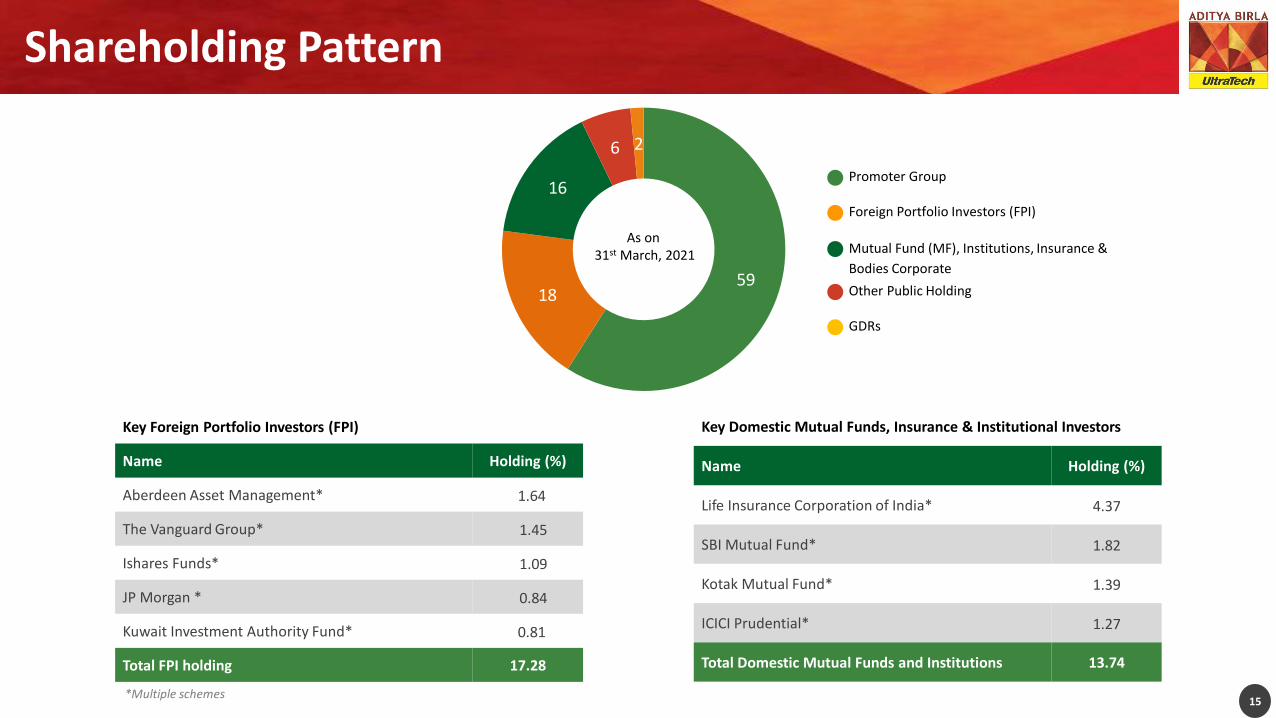
Shareholding Pattern
15
Key Foreign Portfolio Investors (FPI)
Name Holding (%)
Aberdeen Asset Management* 1.64
The Vanguard Group* 1.45
Ishares Funds* 1.09
JP Morgan * 0.84
Kuwait Investment Authority Fund* 0.81
Total FPI holding 17.28
Key Domestic Mutual Funds, Insurance & Institutional Investors
Name Holding (%)
Life Insurance Corporation of India* 4.37
SBI Mutual Fund* 1.82
Kotak Mutual Fund* 1.39
ICICI Prudential* 1.27
Total Domestic Mutual Funds and Institutions 13.74
*Multiple schemes
5918
16
6 2
As on31st March, 2021
Promoter Group
Foreign Portfolio Investors (FPI)
Mutual Fund (MF), Institutions, Insurance &
Bodies Corporate
Other Public Holding
GDRs

Indian Cement Sector

Indian Cement Industry - Overview
17
…but remains a highly underpenetrated market
…but remains a highly underpenetrated market
(per capita cement consumption in kg)1
World average : 500-550
India is the second largest cement
producer in the world…
Global cementproduction
2
3
Source: CRISIL Research
Note: India production data are on a fiscal year (Apr-Mar) 2020 basis, whereas others are calendar year basis; 1 The figures mentioned are CRISIL estimates and arrived at by assessing various data points from sources such as United Nations comtrade
database (for trade data of cement), US Geological survey, and World population estimates published by the UN population division; 2 Includes Puerto Rico; 3 include Vietnam, Indonesia, Iran, Korea, Japan, Turkey as well as remaining countries of the world

Standalone local market sizes comparable to key cement producing countries
18
Brazil: ~100 mtpa
West India: ~71 mtpa
East India: ~109 mtpaNorth India: ~106 mtpa
Italy + Germany: ~79 mtpa South India: ~162 mtpa Thailand + Indonesia: ~168 mtpa
Vietnam: ~119 mtpa
Central India: ~69 mtpa Mexico: ~60 mtpa
Latest Cement Capacity (mtpa)1
Source: CRISIL Research; 1 CY2019 for global countries and FY20 for India

Rural Housing~28-30%
Urban Housing~25-26%
Low Cost Housing~11-12%
Infrastructure~ 22-23%
Commercial and Industrial
~ 11-12%
Demand Growth Drivers
19
Source: CRISIL Research, Industry
▪ Rural demand rising with the improvement in rural economy
▪ Good monsoons for FY21 should support for healthy cash flows in rural markets
▪ Better agriculture income and govt. support will support rural housing
▪ Infrastructure investment plan of USD 1.5 trillion in next five years
▪ Investment projected across sectors viz. roads, railways, metro, airports, irrigation, ports, etc.
▪ the use of paver blocks and concrete tiles, construction of flyovers and other structures have increased the cement intensity of road projects.
▪ Rapid Urbanisation (33% in 2011 to 40% in 2030)
▪ Number of Cities (population of 1Mn.+) to grow from 53 cities (2011) to 87 cities (2030)
▪ Benefit of reduced home loan interest
▪ Strong demand from IT / ITES, historically - like Chennai, Bangalore and Hyderabad
▪ Private sector Capex is slow

Sector Highlights – Budget 2021
20
Key projects announced in states of
Kerala, Tamil Nadu, Assam and West Bengal,
aggregating to around 6,500 KMs highway length,
with total spending of Rs 2.3 Lakh crores
Government capital expenditure on key infrastructure up by 15.6% to Rs 2.4 Lakh
crores in FY22, compared to 2.1 Lakh
crores in FY21
A new centrally sponsored scheme with
an outlay of about Rs. 64,180 crores over 6 years, with focus on health-related social
infrastructure
Capital expenditure budgeted at a robust
~26.2% growth
New Metro projects announced in Kochi,
Nagpur, Bengaluru and Chennai – total funding
from the Centre to the tune
of Rs 88,000 crores
Total capital outlay on Roads is up 10% to Rs 1.73 Lakh crores from Rs 1.57 Lakh crores in FY21. Outlay for NHAI
increased by 7%
33% higher target spending on Railways,
to the tune of Rs 3.22 Lakh crores
UltraTech Landscape
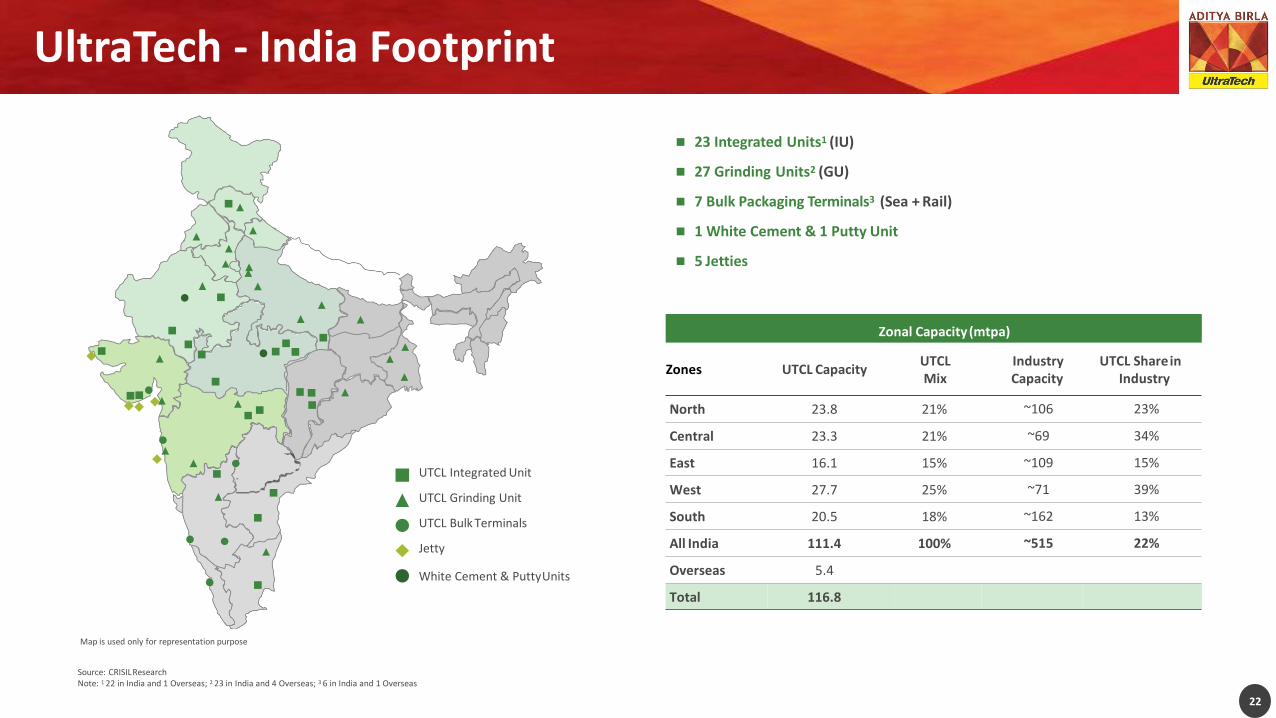
UltraTech - India Footprint
22
◼ 23 Integrated Units1 (IU)
◼ 27 Grinding Units2 (GU)
◼ 7 Bulk Packaging Terminals3 (Sea + Rail)
◼ 1 White Cement & 1 Putty Unit
◼ 5 Jetties
Zonal Capacity (mtpa)
Zones UTCL CapacityUTCLMix
Industry Capacity
UTCL Sharein Industry
North 23.8 21% ~106 23%
Central 23.3 21% ~69 34%
East 16.1 15% ~109 15%
West 27.7 25% ~71 39%
South 20.5 18% ~162 13%
All India 111.4 100% ~515 22%
Overseas 5.4
Total 116.8
UTCL Integrated Unit
UTCL Grinding Unit
UTCL Bulk Terminals
Jetty
White Cement & PuttyUnits
Map is used only for representation purpose
Source: CRISILResearchNote: 1 22 in India and 1 Overseas; 2 23 in India and 4 Overseas; 3 6 in India and 1 Overseas
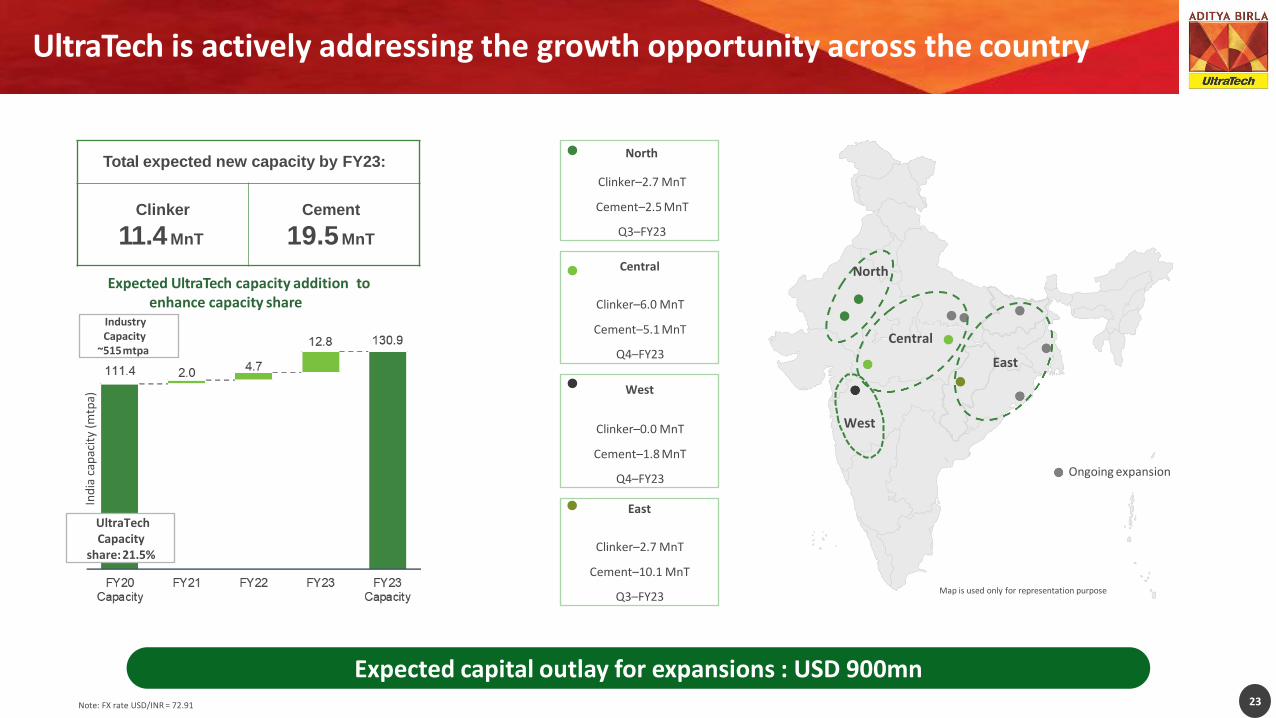
UltraTech is actively addressing the growth opportunity across the country
23Note: FX rate USD/INR = 72.91
North
Clinker–2.7 MnT
Cement–2.5 MnT
Q3–FY23
Central
Clinker–6.0 MnT
Cement–5.1 MnT
Q4–FY23
East
Clinker–2.7 MnT
Cement–10.1 MnT
Q3–FY23
Total expected new capacity by FY23:
Clinker
11.4 MnT
Cement
19.5MnT
Industry Capacity
~515mtpa
UltraTech Capacity
share:21.5%
Ind
ia c
apac
ity
(mtp
a)
Expected UltraTech capacity addition to enhance capacity share
North
Central
East
Ongoing expansion
West
West
Clinker–0.0 MnT
Cement–1.8 MnT
Q4–FY23
Map is used only for representation purpose
Expected capital outlay for expansions : USD 900mn
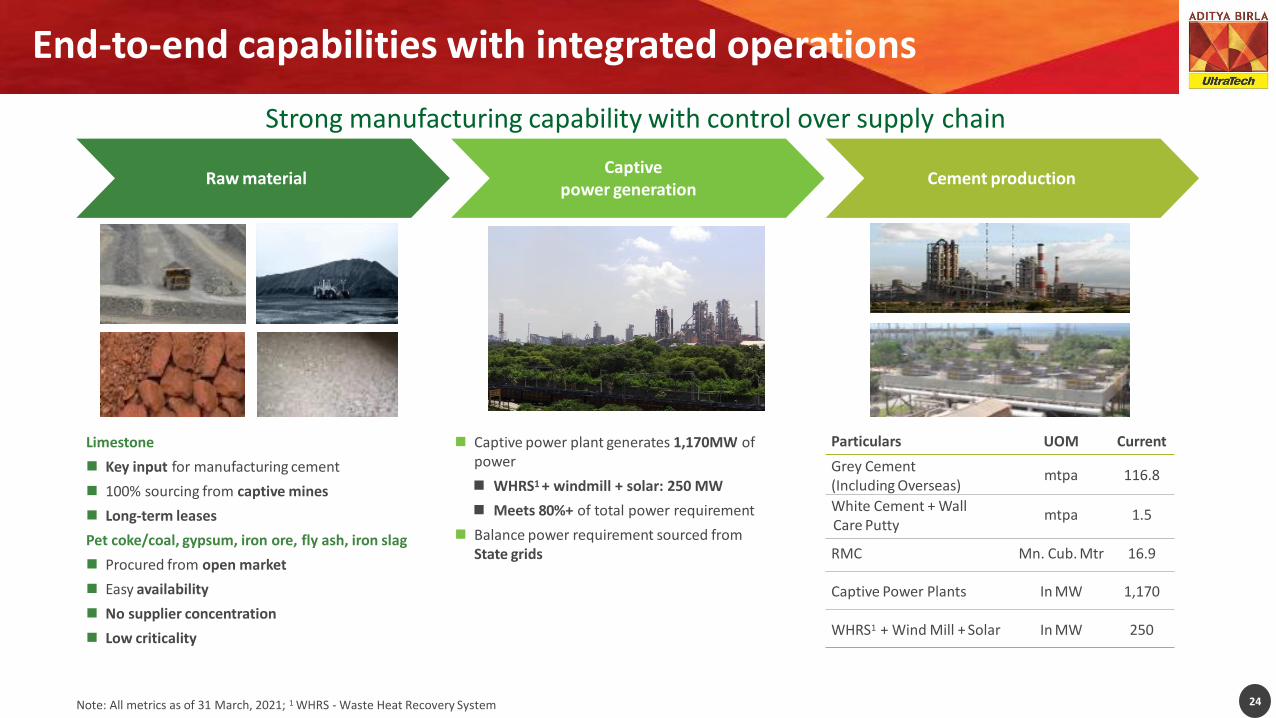
End-to-end capabilities with integrated operations
24
Strong manufacturing capability with control over supply chain
Captive power generation
Cement productionRaw material
◼ Captive power plant generates 1,170MW ofpower
◼ WHRS1 + windmill + solar: 250 MW
◼ Meets 80%+ of total power requirement
◼ Balance power requirement sourced from State grids
Limestone
◼ Key input for manufacturing cement
◼ 100% sourcing from captive mines
◼ Long-term leases
Pet coke/coal, gypsum, iron ore, fly ash, iron slag
◼ Procured from open market
◼ Easy availability
◼ No supplier concentration
◼ Low criticality
Particulars UOM Current
Grey Cement (Including Overseas)
mtpa 116.8
White Cement + WallCare Putty
mtpa 1.5
RMC Mn. Cub. Mtr 16.9
Captive Power Plants In MW 1,170
WHRS1 + Wind Mill + Solar In MW 250
Note: All metrics as of 31 March, 2021; 1 WHRS - Waste Heat Recovery System

Nationwide reach with strong logistics presence across India
25
>45% Dedicated fleet
~4.65mn bags per day1
~23,000 destinations
~60% lifting by GPS enabled fleet
~30,000 orders processed daily
Roads 72%
Railways 26%
Sea 2%
Inland water transport
Jetty
Jetty
Integrated Unit
Grinding Unit
Bulk Terminals
Sea routesOne of the few cement companies in India to utilize captive jetties to service coastaldemand
Integratedmodel
Select rail / road routes
Sea routes
Map is used only for representation purpose
Note: 1 By sales volume as of FY21
Mix of transportation 1
~8,000 trucks loaded per day
900+Warehouses260+ Railheads
30+ Rakes a day
~ 1,00,000 + Channel Partners
5 Specialized Carriers
4 Mini Bulk Carriers and 1 Coal Ship

Extensive Technical Support to the Distribution Network
26Note: 1 As of 31 March, 2021
◼ Over 1,2001 personnel deployed to provide technical support to home builders, engineers, architects, contractors
◼ Mobile concrete vans providing on-site testing, civil engineering, tips and advisories
Homebuilders
▪ Provides construction tips, virtual tools, Vastu advisory
Mason’s program
▪ Includes site demo, meets, plant visits and training
▪ Builders and Contractors Meet and education seminars and programs
▪ On-site concrete plants covering over
▪ 2,600 construction sites
Engineers/architects
▪ Engages engineers and architects through technical meets, workshops and plant visits
Contractors
▪ Engages contractors and builders through meets, plant visits
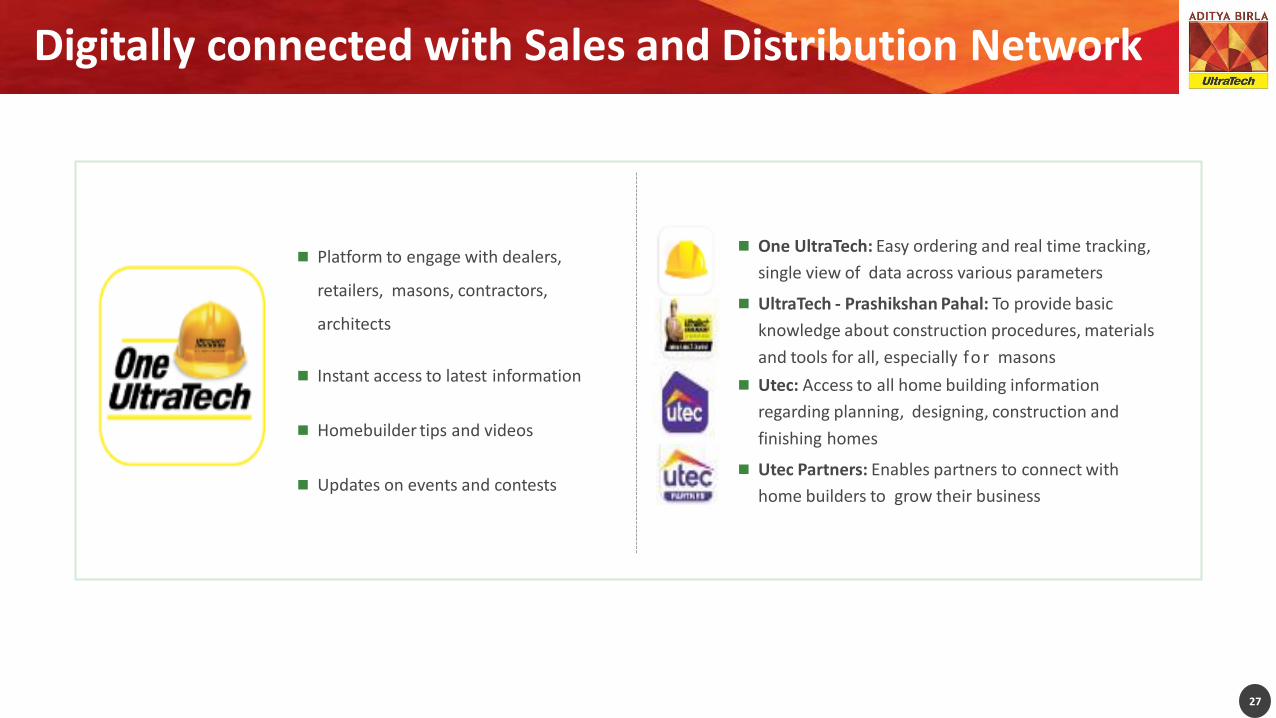
Digitally connected with Sales and Distribution Network
27
◼ Platform to engage with dealers,
retailers, masons, contractors,
architects
◼ Instant access to latest information
◼ Homebuilder tips and videos
◼ Updates on events and contests
◼ One UltraTech: Easy ordering and real time tracking,
single view of data across various parameters
◼ UltraTech - Prashikshan Pahal: To provide basic
knowledge about construction procedures, materials
and tools for all, especially fo r masons
◼ Utec: Access to all home building information
regarding planning, designing, construction and
finishing homes
◼ Utec Partners: Enables partners to connect with
home builders to grow their business

ESG at UltraTech

UltraTech Sustainability Strategy
29
❑ Sustainability is an integral part ofUltraTech’s operations
❑ Chief Sustainability Officer to manage sustainability related initiatives reporting directly to the CEO
❑ The sustainability strategy is aligned to the UN SDGs
❑ The alignment enables the Company to anticipate stakeholder expectations, identify future business opportunities and future-proof the business
❑ The UN SDGs along withUltraTech’s sustainability framework enables the Company to create meaningful and measurable progress on issues relevant to its stakeholders
Climate change, energy and emissions
Water Management
BiodiversityCircular
Economy
Internalcarbon pricing
Carbon offset projects in community
Increasing share of renewableenergy
Water recycling Groundwater recharging
Rainwater harvesting
Water efficient technologies
Zero water discharge
Environmental Impact Assessments
Municipal solid waste as alternative fuel
Concrete recycling
Waste management
Industrial waste to blended cements
Industrial waste as alternative fuel
Note: 1 Waste heat recovery systems

Management buy-in
March to June 2020
✓ Peer benchmarking✓ Summarized
presentations with benefits
Sign-up to SBTi
Incubator
August 2020
✓ Anchored by CDP and WWF
✓ Expert pool with knowledge on SBTi requirements
Closure of findings and Target validation
December to January 2021
✓ Three rounds of responses
✓ Quick turn-around
SBTiCommitment
July 2020
✓ Letter submitted to SBTi
Data collection and
SBTi model simulation
August to November 2020
✓ Data analysis to finalize base year SBTi targeting method and tool
Public announcement
on target validation
March 2021
✓ Press release on 11th March
UltraTech joined the growing list of
companies adopting science based
target initiative (SBTi) as part of its
climate commitment. Our targets will
prepare our business to be in line with
below 2o C threshold as per the Paris
agreement.
Benefits of SBTi target
setting
30
Boosts brand reputation
Competitive advantage
Drives Innovation
Increased regulatory resilience
Bottom line savings
ESG at UltraTech: SBTi targets validated

ESG at UltraTech: Path to meet SBTi targets
31
Use of decision making tools
o Use of internal carbon price
o Adoption of TCFD framework
Product mixo Low clinker cement
o Product that reduces usage of other resources
Technology leverso Alternative fuel and clean energy
o Adoption of emerging technologies
External partnerships
o #EP100 commitment
o GCCA Climate Ambition 2050
Reduce carbon intensity by
~27% by 2032 as compared to 2017 emission
levels *
*UltraTech Cement Limited also commits to reduce scope 2 GHG emissions 69% per ton of cementitious material within the same time frame.

FY19FY19
ESG at UltraTech: Continuous Improvement
FY18
17.6
0%
FY19
18.5
0%
FY20
19.1
0%
FY21
21.5
%*
Target:Reduction of carbon intensity by 25% from base year FY06
Zero Carbon
FY18
7%
FY19
10%
FY2011
%FY21
13%
*Target:Increase the share of green energy to 34% by FY24
Green Energy
FY18
2.50
2.60
FY20
2.80
FY21
3.90
*
Target:Become 5 times water positive by FY24
Water Positive(Project Jal)
FY18
1
3
FY20
5
FY21
8*
Target:Complete biodiversityassessment for all integratedplants by FY24
Biodiversity
32*unaudited

ESG at UltraTech
33
CSR at UltraTech
Education
Healthcare
Infrastructure Development
Sustainable Livelihood
SocialChange
People benefited:1.6 million
Education for:0.1 million children
Rural Health Camps for: 0.2 million people
Villages Covered: 507
Program coverage: 16 States, 24 Districts, 39 Blocks
➢ Child Education
➢ Women Empowerment
➢ Pro-active engagement with local communities and other stakeholders
➢ Awareness about Covid19 and its prevention measures
CSR Spend in FY21: Rs 120 crores

Board Structure and Compliance
34
Shareholders
Board of Directors
Nomination,
Remuneration and
CompensationAudit
Stakeholders
Relationship
FinanceRisk Management
and Sustainability
Corporate Social
Responsibility
Executive Management
Organization
Independent Directors
Woman Directors
BoardAttendance
CommitteeAttendance
50%
30%
>90%
>90%

UltraTech: Policies governing our business
35
1. Sustainability Policy
2. Code of Conduct
3. Tax Policy
4. Policy on Related Party Transaction
5. Whistleblower Policy
6. CSR Policy
7. Board Diversity Policy
8. Dividend Distribution Policy
9. Internal Audit Charter
10. Supplier Code of Conduct
11. Human Rights Policy
12. Safety Policy
13. Occupational Health Policy
14. Energy & Carbon Policy
15. Water Stewardship Policy
16. Biodiversity Policy
17. Stakeholder Engagement Policy
Operational and Financial Performance
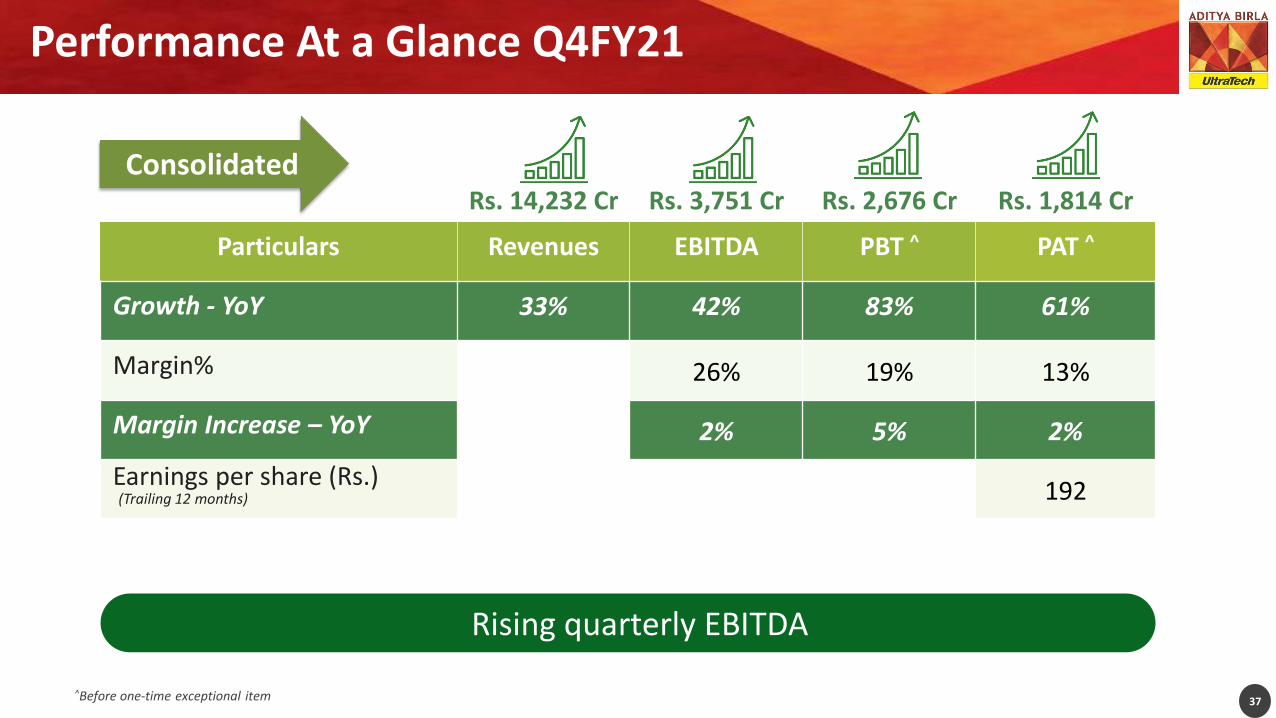
Rs. 14,232 Cr Rs. 3,751 Cr Rs. 2,676 Cr Rs. 1,814 Cr
Particulars Revenues EBITDA PBT ^ PAT ^
Growth - YoY 33% 42% 83% 61%
Margin% 26% 19% 13%
Margin Increase – YoY 2% 5% 2%
Earnings per share (Rs.)(Trailing 12 months) 192
Performance At a Glance Q4FY21
^Before one-time exceptional item 37
Rising quarterly EBITDA
Consolidated

Rs. 44,239 Cr Rs. 12,302 Cr Rs. 8,116 Cr Rs. 5,530 Cr
Particulars Revenues EBITDA PBT ^ PAT ^
Growth - YoY 6% 24% 57% 52%
Margin% 28% 18% 12%
Margin Increase – YoY 4% 6% 4%
Earnings per share (Rs.) 192
Performance At a Glance FY21
38
EPS growth: 52%
Consolidated
^Before one-time exceptional item

UltraTech: Financial Strength
39
Consolidated Net Debt
• Reduction of Rs 10,264 Crs
• Net Debt / EBITDA : 0.55 x
• Net Debt / Equity : 0.15 x
16,981
14,651
12,132
9,436
6,717
1.72
1.60
1.22
0.84
0.55
0.00
0.20
0.40
0.60
0.80
1.00
1.20
1.40
1.60
1.80
2.00
0
2,000
4,000
6,000
8,000
10,000
12,000
14,000
16,000
18,000
Mar-20 Jun-20 Sep-20 Dec-20 Mar-21
Net Debt Net Debt / EBITDA
Domestic Credit Rating: AAA ^International Credit Rating- Fitch: BBB- ; Moody’s: Baa3
^Investment Grade constrained by Sovereign rating

Grey Cement RMC White
CementExport and
OthersIndia
Operations Overseas Consolidated
Volumes (Mnt) 25.95 132 0.42 0.22 26.59 1.41 27.78
Growth 30% 23 31% -19% 30% -3% 28%
Revenues (Rs Crs) 12,251 671 558 277 13,757 532 14,232
Growth 36% 32% 32% -24% 35% 2.1% 33%
Sales Performance: Q4 FY21
40
No of RMC plants
No of RMC plants

Grey Cement
White Cement
Export and Others
India Operations Overseas Consolidated
Volumes (Mnt) 80.18 1.32 1.07 82.56 4.90 86.42
Growth 5% 1% 0.2% 5% -8% 4%
Revenues (Rs Crs) 38,090 1,779 2,710 42,578 1,954 44,239
Growth 8% 3% 4% 7% -9% 6%
Sales Performance: FY21
41

Logistics Cost Trend
56
1149
1176
Q4FY20 Q4FY21
YoY cost increased: 2%
• Diesel price higher by ~22%
• Due to change in market mix
10289
123
100
116129
141
107
107
Q1 18 Q4 20 Q3 21 Q4 21
Crude Prices (Index) Diesel Prices (index) Logistics Cost (index)
42
Logi
stic
s co
st (
Rs.
/mt)
Logistics cost v/s Diesel Price Index)
QoQ cost remained flat
• Rail freight discount
• Road freight saving through various initiatives
27
Increase in costs mitigated by efficiency improvement
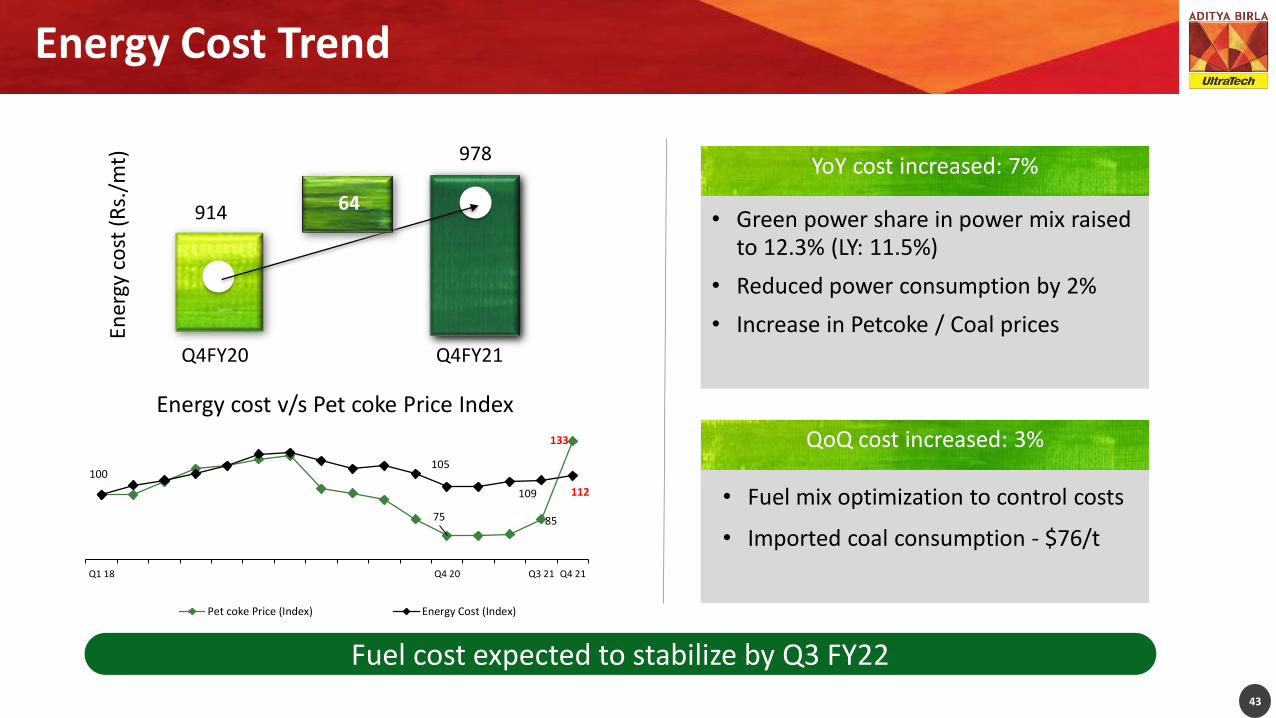
Energy Cost Trend
56
914
978
Q4FY20 Q4FY21
YoY cost increased: 7%
• Green power share in power mix raised to 12.3% (LY: 11.5%)
• Reduced power consumption by 2%
• Increase in Petcoke / Coal prices
43
Ener
gy c
ost
(R
s./m
t)
QoQ cost increased: 3%
• Fuel mix optimization to control costs
• Imported coal consumption - $76/t
64
Fuel cost expected to stabilize by Q3 FY22
Energy cost v/s Pet coke Price Index
75 85
133
100105
109 112
Q1 18 Q4 20 Q3 21 Q4 21
Pet coke Price (Index) Energy Cost (Index)

Raw Material Cost Trend
56497
520
Q4FY20 Q4FY21
• Diesel price hike impacted inbound transportation
• Improved clinker to cement conversion ratio
44
Raw
Mat
eria
l co
st (
Rs.
/mt)
Conversion ratio and Fly ash Prices (Index) Trends
QoQ cost increased: 4%
• Increase in input costs100 100
102100
108 106109
Q1 18 Q4 20 Q3 21 Q4 21
Conversion Ratio Index (Clinker to cement) Flyash Price Index
YoY cost increased: 4%
23

Other Cost Trend
56
659
628
Q4FY20 Q4FY21
YoY cost decreased: 5%
• Lower Fixed Cost – 2 % YoY
• Higher Volumes ~30%
45
Oth
er C
ost
(R
s./m
t)
WPI (Index) Trend QoQ cost decreased: 2%
• Higher Volumes ~17%
• Increase in packing cost
100
108
110113
Q1 18 Q4 20 Q3 21 Q4 21
31
FY21: Fixed cost reduction of ~Rs 500 crores

Q4 FY21 Financial Performance
ParticularsUTCL Standalone India Operations
CY LY % CY LY %
Revenues (Net of Taxes) 13,784 10,237 35 13,757 10,200 35
Operating Income 181 123 47 190 167 14
Other Income 84 224 (62) 82 212 (61)
Total Income 14,050 10,584 33 14,029 10,578 33
Expenses :
Raw Materials Consumed 1,732 1,356 (28) 1,774 1,373 (29)
Purchase of Traded Goods 634 502 (26) 262 228 (15)
Changes in Inventory 184 (228) (181) 181 (229) (179)
Employee Costs 575 612 6 590 629 6
Power and Fuel 2,456 1,932 (27) 2,592 2,018 (28)
Logistics Cost 3,257 2,611 (25) 3,268 2,615 (25)
Other Expenses 1,615 1,312 (23) 1,675 1,352 (24)
EBITDA 3,597 2,486 45 3,687 2,592 42
^After elimination of inter company clinker sales
46
^ ^
EBITDA Margin @ 27%
Rs Crs

47
Income Statement : Q4FY21
^After elimination of inter company clinker sales # After eliminating Deferred Tax Reversal of Rs 2112 Crs
ConsolidatedParticulars
India Operations
CY LY % CY LY %
14232 10689 33 Revenues (net of taxes)^ 13757 10200 35
3751 2645 42 EBITDA 3687 2592 42
26% 25% 2 Margin (%) 27% 25% 1
377 506 25 Finance costs 367 485 24
698 678 (3) Depreciation and Amortization 670 646 (4)
2676 1461 84 PBT 2649 1462 81
39 Exceptional Item 36
865 334 Tax expenses 865 344
(1) (3) Minority interest - -
1775 1129 57 Normalized PAT 1748 1117 57
191.7 126.3 52Normalized EPS (Rs.)(basis trailing 12 months and before exceptional item) 188.4 125.9 50
Rs Crs
PAT up 57%
# #

FY21 Financial Performance
ParticularsUTCL Standalone India Operations
CY LY % CY LY %
Revenues (Net of Taxes) 42,677 40,033 7 42,578 39,923 7
Operating Income 511 616 (17) 537 696 (23)
Other Income 789 727 9 746 646 16
Total Income 43,977 41,376 6 43,860 41,265 6
Expenses :
Raw Materials Consumed 5,175 4,961 (4) 5,290 5,060 (5)
Purchase of Traded Goods 1,937 2,263 14 757 1,046 28
Changes in Inventory 426 (363) (218) 436 (356) (222)
Employee Costs 2,182 2,336 7 2,241 2,395 6
Power and Fuel 7,552 7,703 2 7,935 8,103 2
Logistics Cost 9,940 9,632 (3) 9,977 9,669 (3)
Other Expenses 5,012 5,465 8 5,170 5,623 8
EBITDA 11,754 9,379 25 12,055 9,724 24
^After elimination of inter company clinker sales 48
^ ^
Strong financial performance
Rs Crs

49
Income Statement : FY21
ConsolidatedParticulars
India Operations
CY LY % CY LY %
44239 41781 6 Revenues (net of taxes)^ 42578 39923 7
12302 9898 24 EBITDA 12055 9724 24
28% 24% 4 Margin (%) 28% 24% 4
1486 1992 25 Finance costs 1443 1926 25
2700 2723 1 Depreciation and Amortization 2573 2594 1
8116 5184 57 PBT 8039 5204 55
118 Exceptional Item 114
2539 1543 Tax expenses 2554 1570
(1) (4) Minority interest - -
5463 3644 50 Normalized PAT 5370 3633 48
191.7 126.6 52 Normalized EPS (Rs.) (before exceptional item) 188.4 125.9 50
Rs Crs
EBITDA Margin increased to 28%
# #
^After elimination of inter company clinker sales # After eliminating Deferred Tax Reversal of Rs 2112 Crs

50
Financial Position
ConsolidatedParticulars
India Operations
Mar-20 Mar-21 Mar-20 Mar-21
60724 64482 Capital Employed* 59287 64432
12.0% 15.3% ROCE* 12.2% 15.3%
12.1% 15.6% ROE* 11.9% 15.1%
Rs Crs
Value creation for Shareholders
* Excluding Goodwill
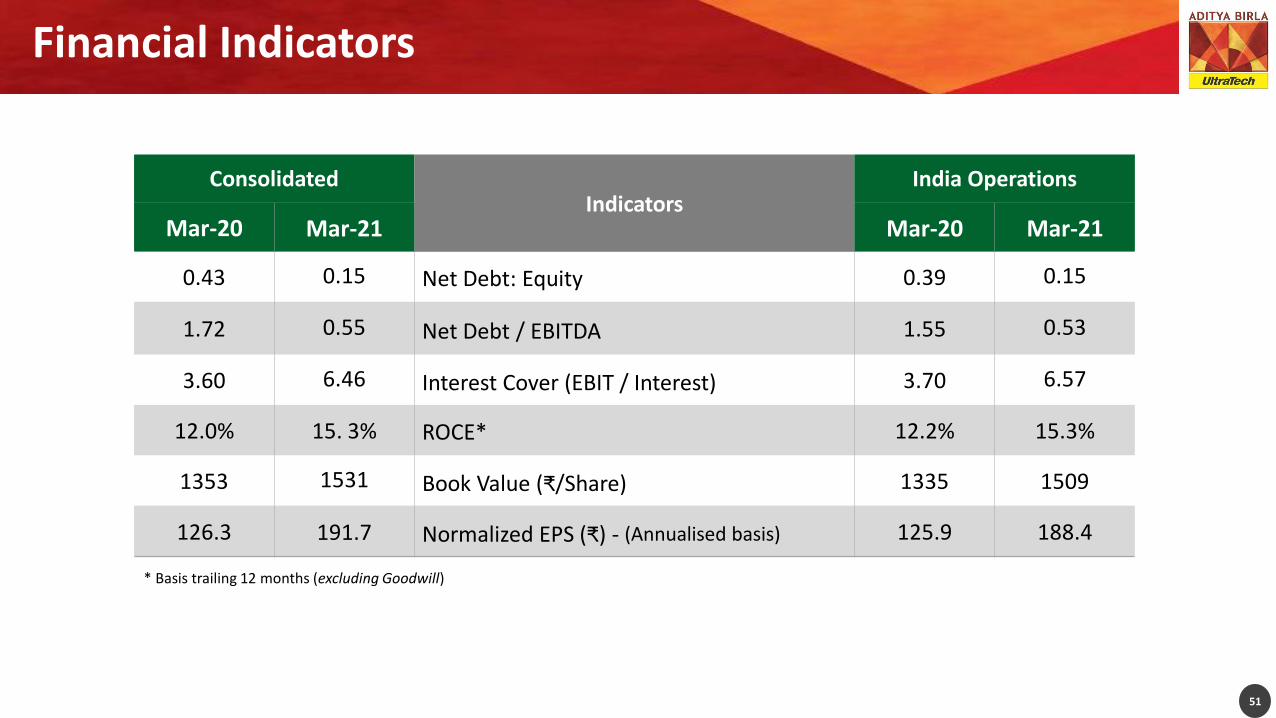
Financial Indicators
51
ConsolidatedIndicators
India Operations
Mar-20 Mar-21 Mar-20 Mar-21
0.43 0.15 Net Debt: Equity 0.39 0.15
1.72 0.55 Net Debt / EBITDA 1.55 0.53
3.60 6.46 Interest Cover (EBIT / Interest) 3.70 6.57
12.0% 15. 3% ROCE* 12.2% 15.3%
1353 1531 Book Value (₹/Share) 1335 1509
126.3 191.7 Normalized EPS (₹) - (Annualised basis) 125.9 188.4
* Basis trailing 12 months (excluding Goodwill)

Historical Performance Trend

Key Performance Trends - Consolidated
53
Grey Cement Sales Volume (Million tons)Cement Production (Million tons)
FY 15 FY 16 FY17 FY 18 FY 19 FY 20 FY21
48.1851.33
52.40
63.28
84.64 81.8185.10
FY 15 FY 16 FY17 FY18 FY19 FY 20 FY21
46.71
50.57 51.00
60.79
80.82 80.0082.72

Key Performance Trends - Consolidated
54
EBITDA (Rs Crs)Revenue (Rs Crs)
FY 15 FY 16 FY 17 FY 18 FY 19 FY 20 FY21
2405624880 25092
30541
41052 41781 44239
FY 15 FY 16 FY 17 FY 18 FY 19 FY 20 FY 21
4776
5365
5861
6734
7807
9898
12302

Grey Cement Costs Trends – India Operations
55
Energy Cost (Rs / Mt) Comparative Cost (TPP / WHRS )
Fuel Mix - Kiln FY15 FY16 FY17 FY18 FY19 FY 20 FY 21
Imported Coal 26% 20% 14% 14% 15% 17% 62%
Petcoke 52% 70% 74% 72% 68% 69% 28%
Ind. Coal & Others 22% 10% 12% 14% 17% 14% 10%
FY 15 FY16 FY17 FY18 FY 19 FY20 FY21
979
824
763
938
1065
985 978
FY 15 FY16 FY17 FY18 FY 19 FY 20 FY 21
4.3
3.8 3.7
4.54.9 4.8
4.5
0.40.6 0.6 0.7 0.7 0.8 0.7
TPP Rate WHRS Rate
Fuel Mix - Kiln FY15 FY16 FY17 FY18 FY19 FY 20 FY 21
TPP 82% 82% 80% 79% 75% 72% 70%
Green Power 2% 5% 7% 8% 7% 10% 13%
Others 16% 13% 13% 12% 18% 18% 18%
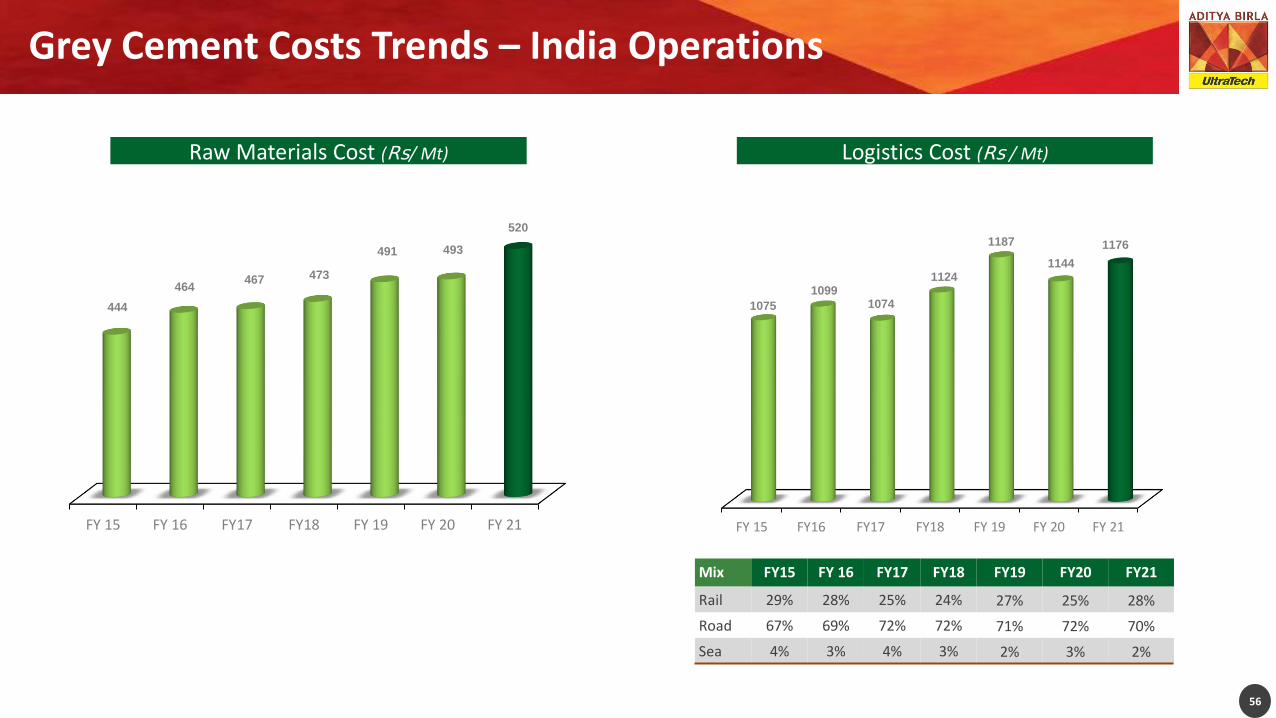
Grey Cement Costs Trends – India Operations
56
Raw Materials Cost (Rs/ Mt) Logistics Cost (Rs / Mt)
Mix FY15 FY 16 FY17 FY18 FY19 FY20 FY21
Rail 29% 28% 25% 24% 27% 25% 28%
Road 67% 69% 72% 72% 71% 72% 70%
Sea 4% 3% 4% 3% 2% 3% 2%
FY 15 FY 16 FY17 FY18 FY 19 FY 20 FY 21
444
464467 473
491 493
520
FY 15 FY16 FY17 FY18 FY 19 FY 20 FY 21
1075
10991074
1124
1187
1144
1176

Key Inputs: Historical Price Trends
57
Pet coke Price Trend
114 114 116
98 95 9180
70 70 71 74
125
Q1FY19 Q2FY19 Q3FY19 Q4FY19 Q1FY20 Q2FY20 Q3FY20 Q4FY20 Q1FY21 Q2FY21 Q3FY21 Q4FY21
Petcoke Consumption Price Trend (US$/t)
Diesel Price Trend
6972 74
68 68 68 69 68 68
77 76
82
Q1FY19 Q2FY19 Q3FY19 Q4FY19 Q1FY20 Q2FY20 Q3FY20 Q4FY20 Q1FY21 Q2FY21 Q3FY21 Q4FY21
Diesel Consumption Price Trend (Rs/Ltr)

Quarterly Performance Trends – India Operations
Particulars Q4FY21 Q3FY21 Q2FY21 Q1FY21 Q4FY20 Q3FY20 Q2FY20 Q1FY20 Q4FY19 Q3FY19 Q2FY19 Q1FY19 Q4FY18
Capacity (MTPA) 111.4 111.4 111.4 111.4 111.4 109.4 109.4 109.4 111.9 109.4 103.1 103.1 85.0
Capacity Utilisation (%) 93% 80% 66% 46% 74% 69% 62% 73% 84% 74% 67% 77% 80%
Grey Sales Volume (MnT) 26.17 22.44 18.89 13.75 20.20 19.65 17.45 20.16 24.15 20.41 17.76 18.64 18.07
Net Sales 13757 11698 9861 7262 10200 9800 9098 10825 11730 9831 8710 8986 8750
Realisation (Rs/mt) 5174 5126 5133 5209 4971 4900 5121 5286 4776 4731 4819 4744 4738
EBITDA 3687 3282 2784 2302 2592 2046 2059 3027 2619 1659 1544 1802 1814
EBITDA Margin 27% 28% 28% 32% 25% 21% 23% 28% 22% 17% 18% 20% 21%
EBIDTA (Rs/mt) 1387 1438 1449 1651 1262 1090 1159 1478 1066 798 855 951 982
EBIT 3016 2645 2138 1683 1945 1399 1418 2367 1999 1043 942 1275 1333
Profit Before Tax 2649 2299 1791 1300 1460 940 924 1878 1503 576 538 795 767
Tax Expenses 865 753 569 366 344 291 312 623 476 195 167 243 279
Net Earnings 1748 1546 1300 776 1117 650 612 1255 1028 382 371 552 488
Cash Earnings 2806 2527 2197 1552 1860 1423 1396 2203 1808 1063 1029 1273 1311
58
Rs Crs
^ Before provision for disputed liabilities offered under Sabka Vishwas Scheme
* Excludes benefit of opening Deferred tax liabilities (DTL) reversal of Rs 2112 Crs due to change in income tax rates (34.944% to 25.168%)
*
^
*

Quarterly Performance Trends – India Operations
Particulars Mar’21 Dec’20 Sep’20 Jun’20 Mar’20 Dec’19 Sep’19 Mar’19 Dec’18* Sep’18* Jun’18* Mar’18
FINANCIAL POSITION
Net Fixed Assets incl. CWIP 51281 50814 51069 51296 51748 51861 51934 51778 44792 40529 40628 40782
NWC + Derivative Assets (2336) (1623) (1049) (669) 87 571 1420 368 1467 1141 226 (428)
Shareholders Fund 43553 41735 40173 39311 38533 35346 34690 33220 27070 26583 26537 25923
Total Debt 19975 21029 20931 21446 20978 22777 24515 23336 21895 17480 17066 17420
Net Debt 6353 7973 10741 12950 15096 16923 18719 20112 19525 12516 11799 12007
Capital Employed 70562 69275 67279 66695 65316 65925 66857 62964 52359 47387 46872 46517
RATIOS
Normalized Quarterly EPS (Rs/Share) 61.8 53.6 42.3 30.7 38.7 22.5 21.2 35.9 14.5 14.2 21.8 17.8
Book value per share (Rs/Share) 1509 1446 1392 1362 1336 1225 1203 1151 986 968 966 944
59
Rs Crs
* Excludes impact of century cement merger. Century merger appointed date : May 19, 2018.

Particulars FY21 FY20 FY19 FY18 FY17 FY16 FY15 FY14 FY13 FY12 FY11
Capacity (MTPA) 111.4 111.4 109.4 85.0 66.3 64.7 60.2 54.0 50.9 48.8 48.8
Capacity Utilisation (%) 71% 69% 76% 71% 72% 76% 75% 79% 82% 83% 81%
Grey Cement Volume (MnT) 81.25 77.5 81.0 59.3 48.9 48.0 44.8 41.5 40.7 40.7 34.8
Net Sales 42578 39923 39257 28930 23616 23440 22648 20078 20023 18158 13206
Realisation (Rs/mt) 5157 5069 4766 4770 4706 4757 4915 4713 4804 4359 3727
EBITDA 12055 9724 7623 6483 5629 5107 4567 4147 4980 4519 2822
EBITDA Margin 28% 24% 19% 22% 24% 22% 20% 21% 25% 25% 21%
EBIDTA (Rs/mt) 1460 1251 926 1051 1122 1036 992 973 1195 1085 851
EBIT 9482 7129 5259 4719 4347 3810 3434 3095 4035 3617 2056
Profit Before Tax 7924 5203 3412 3302 3776 3299 2887 2776 3825 3393 1783
Tax Expenses 2554 1570 1080 1071 1148 928 872 631 1170 947 379
Net Earnings 5370 3633 2332 2231 2628 2370 2015 2144 2655 2446 1404
Cash Earnings 9082 6882 5059 4580 4251 3972 3523 3269 3765 3356 2167
Annual Performance Trends – India Operations
60
Note:1. Figures of FY15 & prior are reported nos. as per previous Indian Accounting Standards
* Excludes benefit of opening Deferred tax liabilities (DTL) reversal of Rs 2112 Crs due to change in income tax rates (34.944% to 25.168%)
^ Before provision for disputed liabilities offered under Sabka Vishwas Scheme
*
*
Rs Crs
^
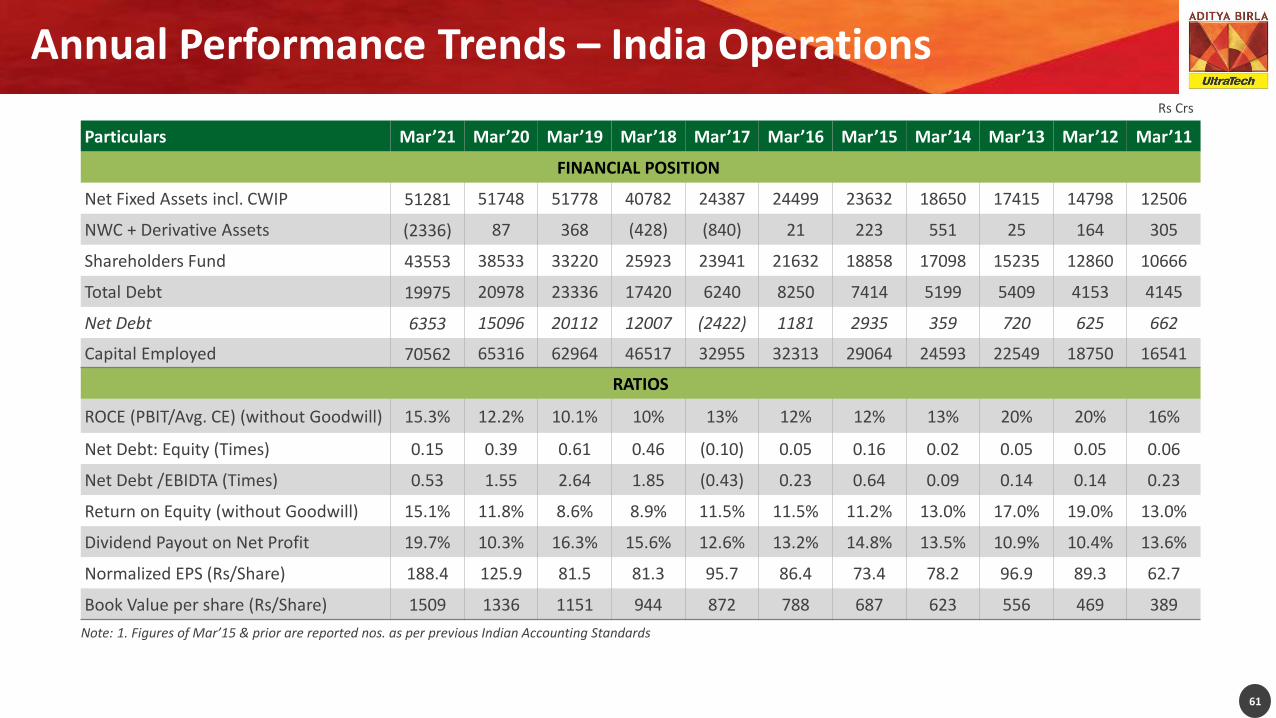
Annual Performance Trends – India Operations
61
Note: 1. Figures of Mar’15 & prior are reported nos. as per previous Indian Accounting Standards
Particulars Mar’21 Mar’20 Mar’19 Mar’18 Mar’17 Mar’16 Mar’15 Mar’14 Mar’13 Mar’12 Mar’11
FINANCIAL POSITION
Net Fixed Assets incl. CWIP 51281 51748 51778 40782 24387 24499 23632 18650 17415 14798 12506
NWC + Derivative Assets (2336) 87 368 (428) (840) 21 223 551 25 164 305
Shareholders Fund 43553 38533 33220 25923 23941 21632 18858 17098 15235 12860 10666
Total Debt 19975 20978 23336 17420 6240 8250 7414 5199 5409 4153 4145
Net Debt 6353 15096 20112 12007 (2422) 1181 2935 359 720 625 662
Capital Employed 70562 65316 62964 46517 32955 32313 29064 24593 22549 18750 16541
RATIOS
ROCE (PBIT/Avg. CE) (without Goodwill) 15.3% 12.2% 10.1% 10% 13% 12% 12% 13% 20% 20% 16%
Net Debt: Equity (Times) 0.15 0.39 0.61 0.46 (0.10) 0.05 0.16 0.02 0.05 0.05 0.06
Net Debt /EBIDTA (Times) 0.53 1.55 2.64 1.85 (0.43) 0.23 0.64 0.09 0.14 0.14 0.23
Return on Equity (without Goodwill) 15.1% 11.8% 8.6% 8.9% 11.5% 11.5% 11.2% 13.0% 17.0% 19.0% 13.0%
Dividend Payout on Net Profit 19.7% 10.3% 16.3% 15.6% 12.6% 13.2% 14.8% 13.5% 10.9% 10.4% 13.6%
Normalized EPS (Rs/Share) 188.4 125.9 81.5 81.3 95.7 86.4 73.4 78.2 96.9 89.3 62.7
Book Value per share (Rs/Share) 1509 1336 1151 944 872 788 687 623 556 469 389
Rs Crs

Quarterly Performance Trends - Consolidated
62
Rs Crs
Particulars Q4FY21 Q3FY21 Q2FY21 Q1FY21 Q4FY20 Q3FY20 Q2FY20 Q1FY20 Q4FY19 Q3FY19 Q2FY19 Q1FY19
Capacity (MTPA) 116.8 116.8 116.8 116.8 116.8 115.4 115.4 115.4 115.4 115.4 107.1 107.1
Capacity Utilisation (%) 92% 81% 65% 47% 74% 69% 69% 73% 84% 72% 67% 76%
Grey Sales Volume (MnT) 27.4 23.5 19.9 14.6 21.4 20.8 18.5 21.3 25.1 21.5 18.6 19.5
Net Sales 14232 12144 10264 7600 10689 10263 9543 11286 12319 10294 9088 9352
Realisation (Rs/mt) 5123 5086 5085 5136 4927 4863 5073 5233 4826 4712 4814 4727
EBITDA 3751 3362 2833 2356 2643 2147 2020 3086 2668 1707 1564 1868
EBITDA Margin 26% 28% 28% 31% 25% 21% 21% 27% 22% 17% 17% 20%
EBITDA (Rs/mt) 1350 1408 1403 1592 1218 1080 1074 1431 1045 781 828 944
EBIT 3053 2688 2156 1705 1965 1469 1345 2394 2021 1069 940 1320
Profit Before Tax 2637 2332 1799 1153 1459 997 837 1889 1514 591 524 828
Tax Expenses 865 747 566 360 334 286 311 612 461 197 168 243
Net Earnings after Minority Interest 1775 1584 1309 794 1129 712 526 1277 1052 396 357 586
Cash Earnings 2859 2597 2158 1594 1891 1510 1342 2242 1851 1100 1040 1326
^ Before provision for disputed liabilities offered under Sabka Vishwas Scheme
* Excludes benefit of opening Deferred tax liabilities (DTL) reversal of Rs 2112 Crs due to change in income tax rates (34.944% to 25.168%)
*
*
^
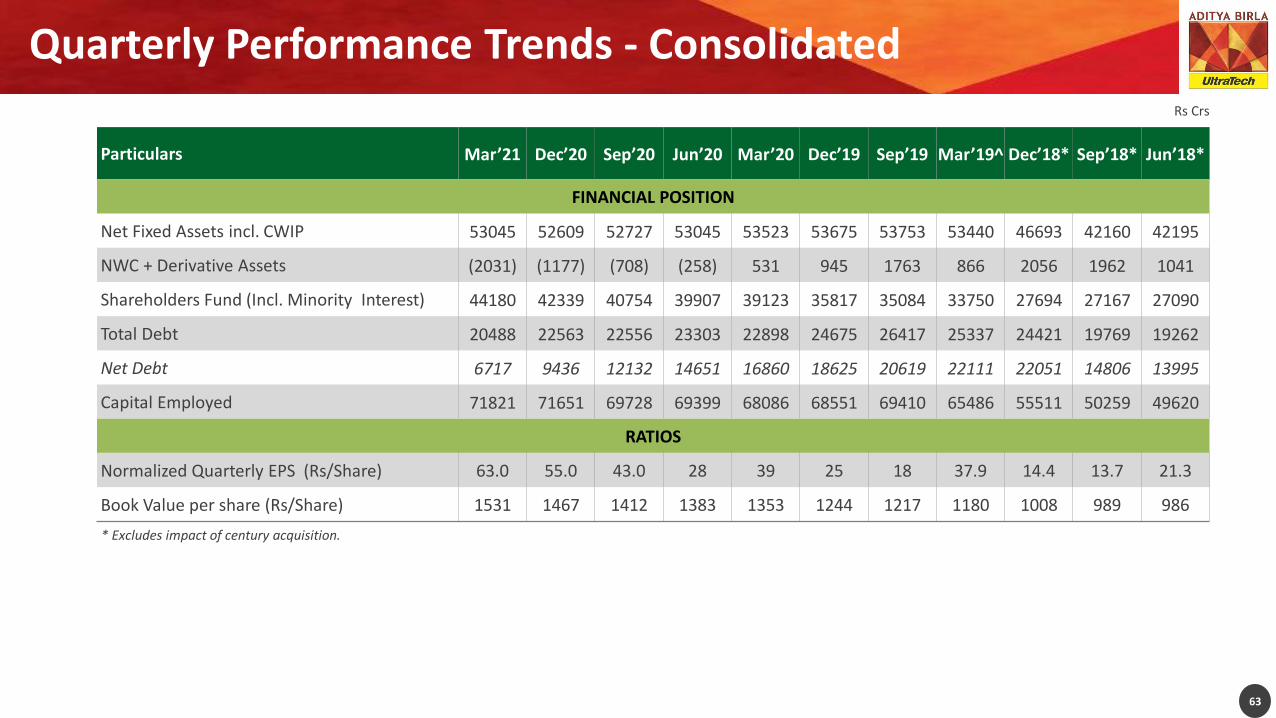
Quarterly Performance Trends - Consolidated
Particulars Mar’21 Dec’20 Sep’20 Jun’20 Mar’20 Dec’19 Sep’19 Mar’19^ Dec’18* Sep’18* Jun’18*
FINANCIAL POSITION
Net Fixed Assets incl. CWIP 53045 52609 52727 53045 53523 53675 53753 53440 46693 42160 42195
NWC + Derivative Assets (2031) (1177) (708) (258) 531 945 1763 866 2056 1962 1041
Shareholders Fund (Incl. Minority Interest) 44180 42339 40754 39907 39123 35817 35084 33750 27694 27167 27090
Total Debt 20488 22563 22556 23303 22898 24675 26417 25337 24421 19769 19262
Net Debt 6717 9436 12132 14651 16860 18625 20619 22111 22051 14806 13995
Capital Employed 71821 71651 69728 69399 68086 68551 69410 65486 55511 50259 49620
RATIOS
Normalized Quarterly EPS (Rs/Share) 63.0 55.0 43.0 28 39 25 18 37.9 14.4 13.7 21.3
Book Value per share (Rs/Share) 1531 1467 1412 1383 1353 1244 1217 1180 1008 989 986
63
* Excludes impact of century acquisition.
Rs Crs

Annual Performance Trends - Consolidated
Particulars FY21 FY20 FY19 FY18 FY17 FY16 FY15 FY14 FY13 FY12 FY11
Capacity (MTPA) 116.8 116.8 115.4 89.0 70.3 67.7 63.2 57.0 53.9 51.8 51.8
Capacity Utilisation (%) 70% 70% 73% 72% 74% 77% 76% 80% 82% 84% 81%
Grey Cement Volume (MnT) 85.10 81.8 84.6 63.3 52.4 51.3 48.2 44.7 43.6 44.0 36.9
Net Sales 44239 41781 41052 30541 25092 24880 24056 5272 21161 19077 13687
Realisation (Rs/mt) 5119 5020 4771 4728 4671 4727 4869 1151 4739 4251 3641
EBITDA 12302 9898 7807 6734 5861 5365 4776 4358 5143 4565 2850
EBITDA Margin 28% 24% 19% 22% 23% 22% 20% 83% 24% 24% 21%
EBIDTA (Rs/mt) 1424 1205 907 1042 1091 1019 967 951 1152 1017 758
EBIT 9602 7176 5351 4765 4512 3988 3572 3219 4120 3602 2037
Profit Before Tax 7998 5184 3456 3301 3872 3421 2986 2858 3867 3345 1745
Tax Expenses 2539 1543 1068 1077 1159 942 884 645 1179 948 384
Net Earnings after Minority Interest 5463 3644 2391 2222 2715 2478 2098 2206 2678 2403 1367
Cash Earnings 9284 6986 5192 4777 4404 4166 3680 3424 3869 3370 2172
64
Note: 1. Figures of Mar’15 & prior are reported nos. as per previous Indian Accounting Standards
^ Before provision for disputed liabilities offered under Sabka Vishwas Scheme
* Excludes benefit of opening Deferred tax liabilities (DTL) reversal of Rs 2112 Crs due to change in income tax rates (34.944% to 25.168%)
*
*
^
Rs Crs

Annual Performance Trends – Consolidated
Particulars Mar’21 Mar’20 Mar’19 Mar’18 Mar’17 Mar’16 Mar’15 Mar’14 Mar’13 Mar’12 Mar’11
FINANCIAL POSITION
Net Fixed Assets incl. CWIP 53045 53692 53440 42296 26039 26127 25186 20090 18733 15999 13505
NWC + Loans + Derivative Assets (2031) 414 866 266 (188) 667 780 902 376 420 493
Shareholders Fund 44180 39051 33750 26397 24402 21961 19059 17199 15308 12887 10712
Total Debt 20488 23019 25337 19480 8474 10616 9829 7332 7342 5891 5541
Net Debt 6717 16981 22111 14062 (215) 3523 5195 2491 2654 2353 2047
Capital Employed 71821 68137 65486 49051 35649 35008 31674 26821 24551 20511 17983
RATIOS
ROCE (PBIT/Avg. CE) (without Goodwill) 15.3% 12.0% 9.9% 10% 13% 12% 11% 13% 18% 19% 15%
Net Debt: Equity 0.15 0.43 0.66 0.53 (0.01) 0.16 0.27 0.14 0.17 0.18 0.19
Net Debt /EBIDTA 0.55 1.72 2.83 2.09 (0.04) 0.66 1.09 0.57 0.52 0.52 0.59
Return on Equity (without Goodwill) 15.6% 12.1% 8.9% 8.7% 11.7% 11.9% 11.0% 12.8% 17.6% 18.7% 12.8%
Normalized EPS (Rs/Share) 191.7 126.6 83.6 80.9 98.9 90.3 76.5 80.5 97.7 87.7 61.4
Book Value (Rs/Share) 1531 1353 1180 961 889 800 694 627 555 468 389
65
Note: 1. Figures of Mar’15 & prior are reported nos. as per previous Indian Accounting Standards
Rs Crs

Disclaimer
Statements in this ‘presentation’ describing the Company’s objectives, estimates,expectations or predictions may be “forward looking statements” within the meaning ofapplicable securities laws and regulations. Actual results could differ materially from thoseexpressed or implied. Important factors that could make difference to the Company’soperations include global and Indian demand supply conditions, finished goods prices,feedstock availability and prices, cyclical demand and pricing in the Company’s principalmarkets, changes in governmental regulations, tax regimes, economic developments withinIndia and the countries within which the Company conducts business and other factors suchas litigation and labour negotiations. The Company assumes no responsibility to publiclyamend, modify or revise any forward-looking statement, due to any subsequentdevelopment, information or events, or otherwise.
UltraTech Cement Limited
Regd. Office: Ahura Centre, Mahakali Caves Road, Andheri (E), Mumbai – 400 093[Corporate Identity Number L26940MH2000PLC128420]
www.ultratechcement.com or [email protected]