From Big Data, fast computers and complex models towards learning machines

Big Data + Big Computers=
Computational Psychology?
Joop HoxUtrecht University
Big Data SymposiumDubrovnik, 2019Leibniz-Psy
2019 Big Data
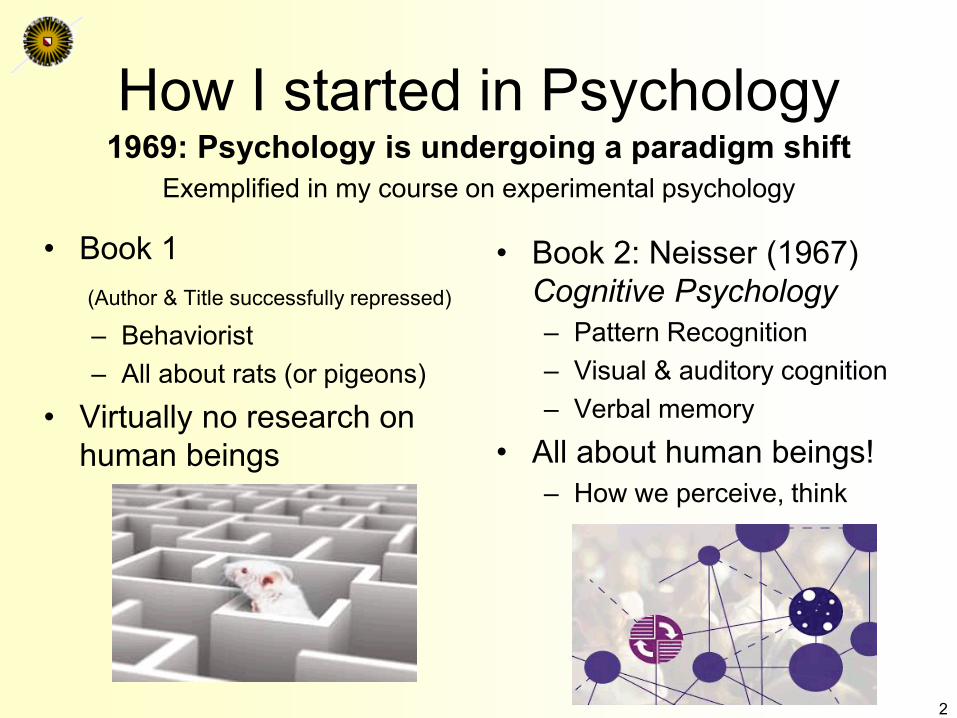
How I started in Psychology
• Book 1(Author & Title successfully repressed)
– Behaviorist– All about rats (or pigeons)
• Virtually no research on human beings
1969: Psychology is undergoing a paradigm shiftExemplified in my course on experimental psychology
• Book 2: Neisser (1967) Cognitive Psychology– Pattern Recognition– Visual & auditory cognition– Verbal memory
• All about human beings!– How we perceive, think
2

40 Years Later
• Sternberg (2009) Cognitive Psychology– Much the same topics– Some attention to brain
structures
• But much like Neisser– Cognitive structures viewed
as ‘demons’ that carry out specific processes
– MRI mentioned but hardly used
– “Big Data” not mentioned
± 2010: Is Psychology undergoing another paradigm shift?
3

Structure of Presentation
• Big Data• Data Analytics• Simulation• Computational Psychology• What is in it for us?
4

Buzzword #1: Big Data
• What is big data? How big must it be?• John Tukey (19-fifties): big data is
anything that won’t fit on one device
5
± 6 Mb 64 Gb

Big Data in General
• Origin in physical sciences: nuclear research, astrophysics all collect many exabytes of data– which must be stored and analyzed
• These massive amounts of data require new technology and analysis methods
• Recently, market research and later official statistics and social & behavioral science have picked up this trend
6
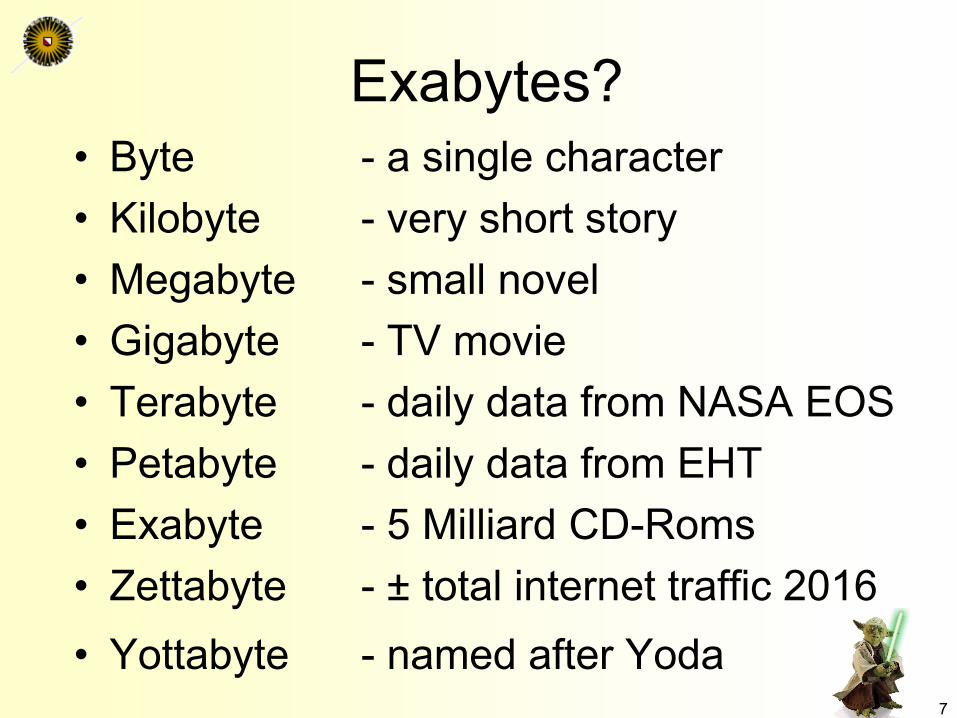
Exabytes?• Byte - a single character• Kilobyte - very short story• Megabyte - small novel• Gigabyte - TV movie• Terabyte - daily data from NASA EOS• Petabyte - daily data from EHT• Exabyte - 5 Milliard CD-Roms• Zettabyte - ± total internet traffic 2016
7
• Yottabyte - named after Yoda
Social Science Examples
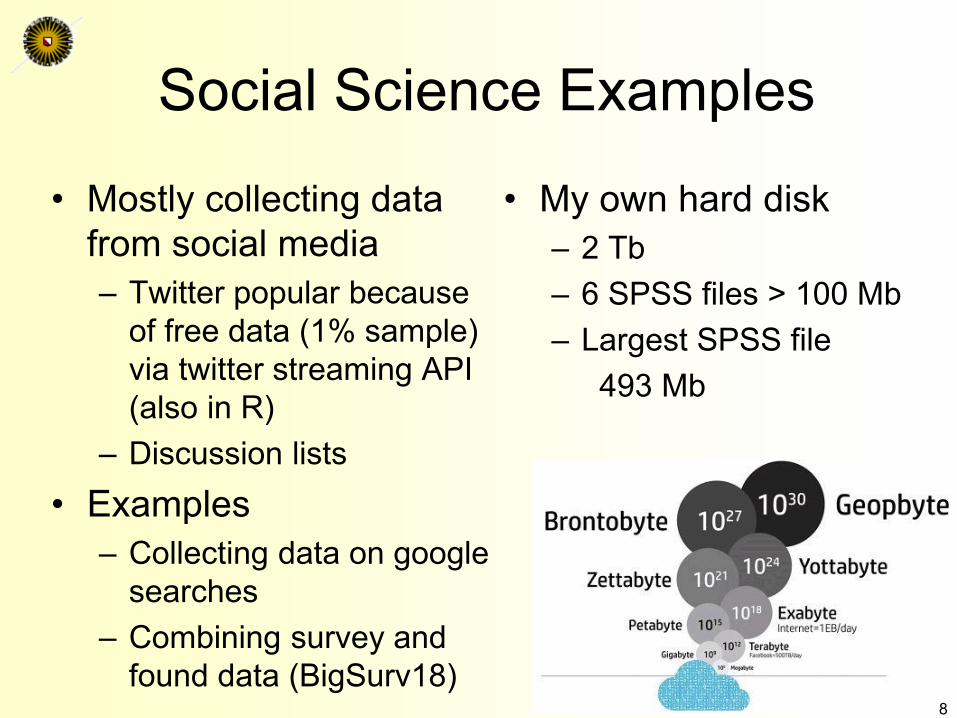
• Mostly collecting data from social media– Twitter popular because
of free data (1% sample) via twitter streaming API (also in R)
– Discussion lists• Examples
– Collecting data on google searches
– Combining survey and found data (BigSurv18)
8
• My own hard disk– 2 Tb– 6 SPSS files > 100 Mb– Largest SPSS file
493 Mb

Do Social and BehavioralSciences really have Big Data?
9
• Example from astronomy: the Event Horizon Telescope’s photo of a black hole
• The Event Horizon Telescope (EHT) is not one single telescope, it is many– 8 locations– each >1 telescopes– 5 days observation
• 1 petabyte / day– data sent on disks

So What do the EHT datalook like?
10
• They definitely do not fit on one device!

Extended Examplefrom Social Science
• Are human sexual cycles driven by culture or environment?– Pattern of birth dates not uniform over time– Cultural or environmental?
• IF Cultural→ same pattern in similar cultures, everywhere• IF Environmental→ pattern reversed in Northern (NH) vs. Southern
Hemisphere (SH)11
Human Sexual Cycles
• Data collection– Direct observation of sexual activity difficult– Survey suffers from image management
• Both underreporting and boasting– Proxy: google “sex” searches, split across NH
and SH, and Christian (C) and Muslim (M)– Observation period: 10 years
• Analysis: is pattern seasonal or cultural?– Cultural = related to important dates, such as
Christmas (C ) or Eid-al-Fitr (sugar feast) (M) 12
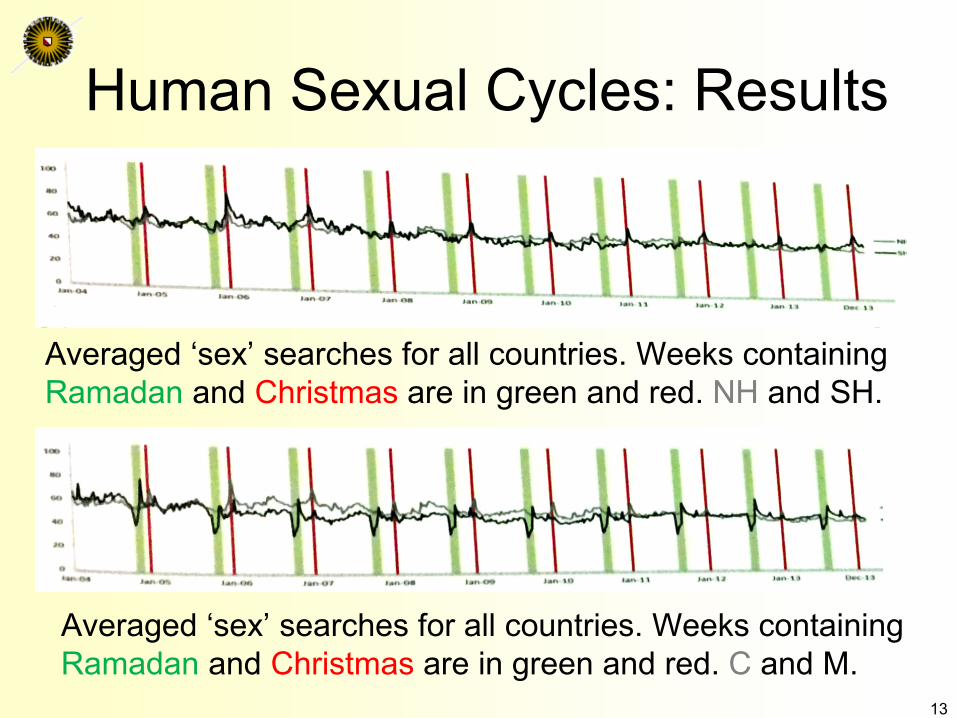
Human Sexual Cycles: Results
Averaged ‘sex’ searches for all countries. Weeks containing Ramadan and Christmas are in green and red. NH and SH.
13
Averaged ‘sex’ searches for all countries. Weeks containing Ramadan and Christmas are in green and red. C and M.

Human Sexual Cycles: Results
14
Averaged Z-scores of 1) Christian countries centered on Christmas, 2) Muslim countries centered on Eid-al-Fitr and SH countries centered on Summer Solstice

Characteristics of Big Data:the Classical Three V’s
15http://www.rosebt.com/blog/data-veracity

Characteristics of Big Data:the 4th V
16http://www.rosebt.com/blog/data-veracity
The Promise of Big Data
• Individual behavior increasingly leaves digital traces, which can be collected
• Expensive data collections replaced by inexpensive ‘found’ data
• Sampling replaced by N = All• Large data sets permit complex analyses
– The end of theory (Wired, 2008)– Automatic modeling, Data based modeling
17

The Problems of Big Datathe 4th V: Veracity
• Is N really all?– Who are we missing? Who are included
several times? Can we generalize?• Representativity, external validity
– Example: in the 2016 American elections about 30% of the tweets about Clinton or Trump were generated by bots
18
The Problems of Big Datathe 4th V: Veracity
• Data is never just ‘found’ & is never ‘organic’– Who created the data for what purpose?– What do we measure? What do we fail to
measure?• Operationalization problem = Construct validity
• Classical scale development– start with construct, chose indicators (top down)
• Big data– start with data, munge, transform, aggregate– transform data to making it ready for analysis
19

The Problems of Big Datathe 4th V: Veracity
• Data: munge, transform, aggregate– Extract raw data, use algorithms (sorting,
parsing, projecting on existing data structure) to prepare for analysis
20
How replicable are these transformations?

The Problems of Big Datathe 4th V: Veracity
• Data: munge, transform, aggregate
21
How replicable are these transformations?
This goes way beyond data cleaning!

Example of the black hole photo• Data from 8 sites• Observations in wide
frequency bands over time, about 350 terabytes per telescope per day
• Combined and calibrated, different kinds of noise removed, et cetera.
• Publicly reported in painstaking detail online
22

Sensor Data are not Objective
• Sensor measurement ≠ behaviour– Device turned off or not worn– Sensors do not always measure target behavior– Sensors are not completely reliable
• Example: pedometer (fitbit, smartphone)– Research shows high quality devices on
average within 10%, smartphones within 20%– Data depends on device, app, operating
systems, ways of walking
23

The Accuracy of Pedometer• The step counter in your smartphone is not
counting steps– It records movement over time in 3 dimensions– Then an algorithm estimates the # of steps
24
– Accuracy depends on the sensor + algorithm• Different devices, different sensor + algorithm• Different app or upgrade OS may induce differences

Summary So Far
• External validity– Population > Device owners / Twitter users >
Participation > Actual data collection• Operationalisation
– Transform observations into data: what construct are we measuring
• Reliability– If we repeat the measurement, will we get the
same results?
25

Buzzword #2: Analytics
• Aka Predictive analytics, data mining, machine learning…
• White box: regression, clustering, tree methods– White box: models and parameters can be
interpreted• Black box: neural networks, deep learning
– Model in box is unknown
26

Popular Techniques
• Prediction– Regression– Tree methods
• Classification– k-means clustering– k nearest neighbors
• Innovations– Adaptation to large data sets, cluster computing– Ensemble methods
27

Let The Data Speak
• Modeling typically data driven, resampling and hold-out methods to avoid overfitting
• k-fold: divide data randomly in k=10 parts, do 10 times: search for model on 9/10 of data, test (validate) on 1/10 hold-out– Repeat several times (repeated k-fold)– Other methods exist, but k-fold very effective
• Random forest– Many trees with random selection of variables
28

Big Data Analytics
• Origin is applied mathematics in real world– Often developed by computer scientists– Terminology is different
• e.g. “examples”=“cases”, “features”=“IV”– Emphasis strongly on prediction and
classification• Emphasis not on theory or understanding
– e.g. deep learning by training a neural network yields results, but not interpretations
29

Soccer Example
• Do soccer referees give more red cards to dark skin toned players?– Data: player (N=2053) demographics (GB,
DE, FR, ES), referees (N=3147), # of player-referee encounters, # of red cards, skin tone coded from photos, 146028 dyads
– Not BIG data, but data from hell: cross-classified multilevel, very skewed outcome (mean prop. reds 0.004), sparse data
30https://osf.io/gvm2z/

Soccer Example:What Techniques?
• Significance no criterion: r=0.006, p=0.02• Techniques
– Regression 14– Multilevel 11– Other 3– All techniques depend on modeling and
interpreting coefficients• Results mixed, depending on choices for
model and covariates31

Soccer ExampleAnalytics Approach
• Take (almost) all covariates– Some were redundant
• Do 10-fold: run model (all covariates) with and without skin color predictor– Count proportion of correct predictions for
receiving red card, both models, in test subsamples
– Calculate mean proportion across 10 test samples
• Do this 100 times32

Results Analyticson Soccer Data
33
Proportion of correctly predicted red cards
DifferenceModel with skin color Model without skin colorFold 1 0.0353 0.0382 -0.0029
Fold 2 0.0324 0.0353 -0.0029
Fold 3 0.0324 0.0353 -0.0029
Fold 4 0.0294 0.0324 -0.0029
Fold 5 0.0382 0.0441 -0.0059
Fold 6 0.0206 0.0265 -0.0059
Fold 7 0.0382 0.0412 -0.0029
Fold 8 0.0265 0.0353 -0.0088
Fold 9 0.0353 0.0412 -0.0059
Fold 10 0.0440 0.0499 -0.0059
Mean 0.0332 0.0379 -0.0047
Mean 100 repetitions -0.0060
• First 10-fold + mean proportions• Model with skin color is doing worse (p=0.002)
Summary So Far
• Big data analytics have produced analysis methods that are really useful
• Ensemble methods use a large amount of model fitting, including choice of variables and cases, and tuning of model parameters– Overfitting is certainly an issue
34

Buzzword #3:Simulation
• Statistical simulation– Generate flawed data to study analysis method
• Model based simulation– Specify a computer model of a complex system
and study the model• Agent based simulation
– Place virtual agents in a computer generated environment, and study their interactions
35

Model Based Simulation• Based on substantive knowledge
– Each system studies requires their own model• Example: deep dyslexia
– Dyslexia = “unite” read as “untie”– Deep dyslexia = “rose” read as “tulip”
• Suggests two different loci of damage– However, a neural network model assuming
that words are stored not in one location but distributed, can generate both kinds of dyslexia
• fMRI has shown distributed lexicon36
O’Reilly & Munakata, 2000

Agent Based Simulation
• Virtual agents interact in a computer generated environment– Agent behavior is governed by rules– Rules are varied, results observed
• Very old example: ALDOUS– ALDOUS simulates interactions between 2
agents that each have values on 3 attributes– Which leads to surprisingly complex behavior
chains
37
1965Loehlin
Agent Based Modeling
• Current technology allows a multiple agents and multiple attributes
• Example: Axelrod’s evolution of cooperation– How can cooperation evolve with competition
for resources and no central authority?– Simulated agent interactions with agents that
are friendly or greedy in a prisoners’ dilemma– In the long run, friendly interactions bring
greater gains for both agents
38
Axelrod’s Challenge• A simulated tournament where agents
play an repeated prisoners dilemma game– Axelrod’s champion: Tit-For-Tat TFT)
• Start friendly, then do what the other did last time
• Challenge: design strategy to defeat TFT• Each agent faced all others 200 times,
plus a copy of itself and a random agent– This repeated 5×– 14 agents, 120000 moves, 240000 choices
• Original tournament: TFT wins BIG39

Axelrod’s Legacy
• In a second tournament, TFT wins again• Later winner are even more friendly than TFT• Lates simulations are more larger and more
complex– e.g. assuming groups or societies– Winning agents greater chance of replication– Studying social networks by interacting agents
• Phelps (2012) simulates 3.6×10⁵ interactions which replicate real world research results
40

Buzzword #4:Computational Psychology
• “In short, a computational social science is emerging that leverages the capacity to collect and analyze data with an unprecedented breadth and depth and scale.” (Lazer et al., 2009)
• “The increasing integration of technology into our lives has created unprecedented volumes of data on society’s everyday behaviour” (Conte et al., 2012)
41

Computational Social & Behavioral Science
• Combination of social/behavioral science, computer science and statistics– Big data and information extraction– Analytics– Simulation
42
• Interdisciplinary• Old rules still apply: issues with external
validity, construct validity, reliability
What is in it for US?
Adoption of new techniques, especially when developed in applied (e.g., marketing) research has often been slow, for example:• Telephone survey methodology• Computer assisted psychological testing• Web (probability) panels
• Big data / analytics?
43

What is in it for US?• Let the data speak
– Different attitude: more data driven analysis, less model driven estimation
• By training we are all multivariate modelers– Many techniques in ‘data analytics’ are familiar
• Regression, classification, correspondence analysis, lots of resampling methods
• Learning curve less steep than often feared
44
– “NO BODY OF DATA TELLS US ALL we need to know ABOUT ITS OWN ANALYSIS” (Tukey, EDA, p115)
• Translation: Data Don’t Speak

What Can We Contribute
• Remember the ‘veracity’ thing?– There is too much in there!– It is useful to distinguish internal,
external & construct validity,– and reliability of measurement,– statistical conclusion validity,– model approximations,– and many other issues well-known
to social and behavioral scientists (= US)
45

Let’s Go Back to the Black Hole
• Compare the ‘observed’ picture with the simulation, and the simulation + expected error
• After 2 years of data munging, synthesis and aggregation, this is the picture!
46

Thank You!
47

1. Greater reliability than surveys
2. Ability to measure new variables (e.g., emotions)
3. Universal coverage can “zoom in” to subgroups
4. Large samples can approximate scientific experiments
Why is Big Data Transforming Social Science?
From a course by a Harvard economist