Big Data Appliance for Graph Analytics
15
1 Big Data Appliance for Graph Analytics Arvind Parthasarathi
description
Big Data Appliance for Graph Analytics. Arvind Parthasarathi. Many Big Data Business Problems are based on Graphs. Telecom/Mobile. Social Networking. Intelligence/Security. Life Sciences/ Biology. Healthcare/ Medicine. Finance. Supply Chain. Internet/ www. Finance. - PowerPoint PPT Presentation
Transcript of Big Data Appliance for Graph Analytics
1
Big Data Appliancefor Graph Analytics
Arvind Parthasarathi
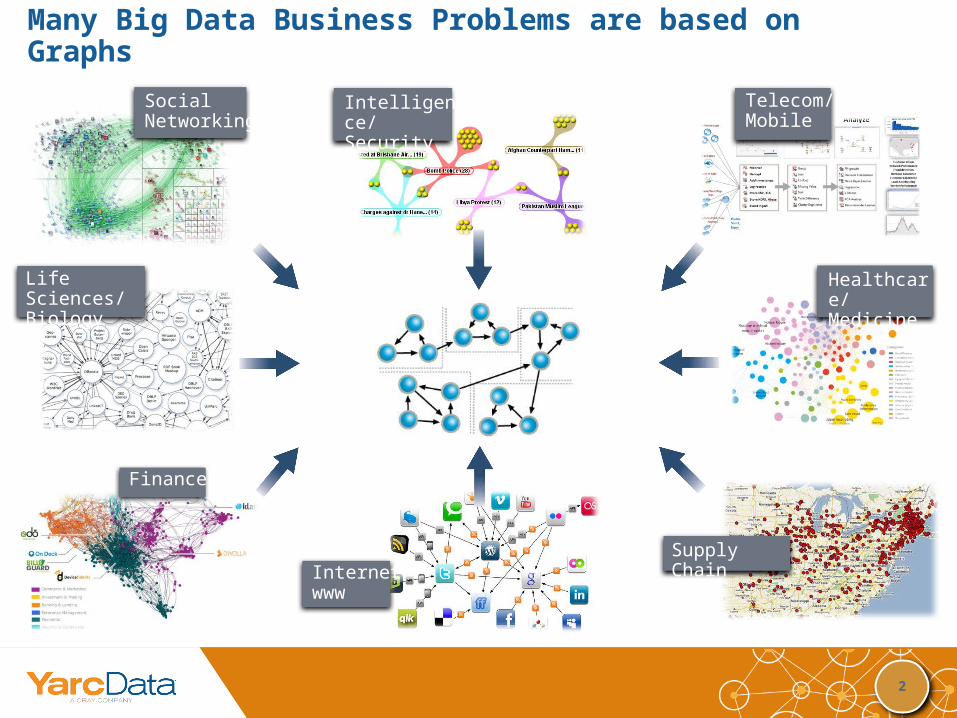
2
Finance
Many Big Data Business Problems are based on Graphs
Intelligence/Security
Social Networking
Telecom/Mobile
Life Sciences/Biology
Supply Chain
Healthcare/Medicine
Internet/www
Finance
3
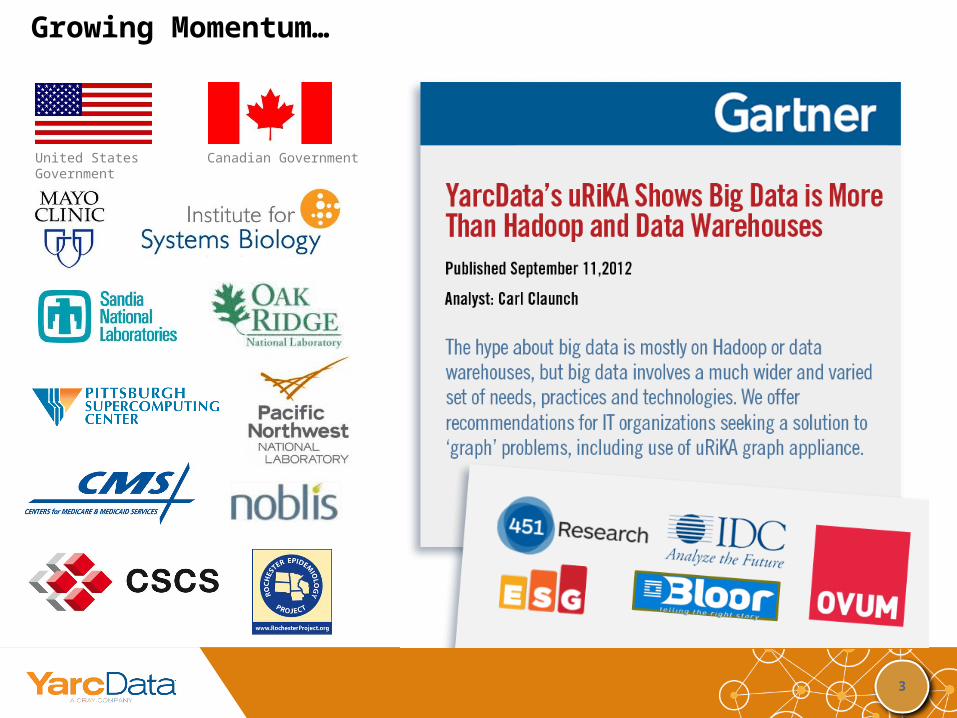
Growing Momentum…
United States Government
Canadian Government
4
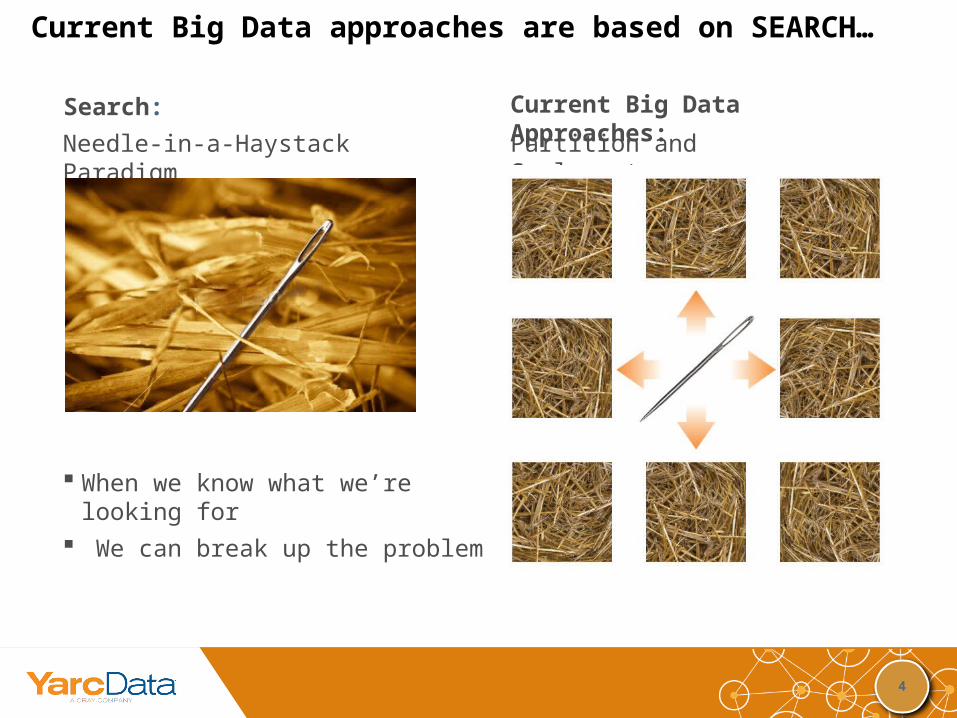
Current Big Data approaches are based on SEARCH…
Needle-in-a-Haystack Paradigm
When we know what we’re looking for We can break up the problem
…
Search:
…Partition and Scale out
Current Big Data Approaches:
5
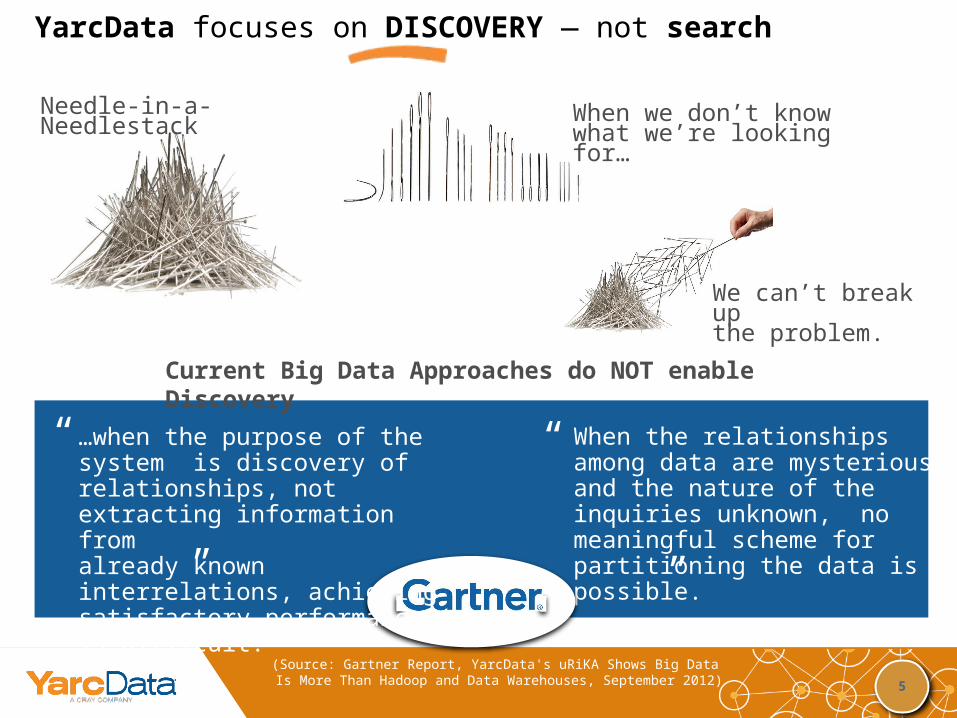
YarcData focuses on DISCOVERY — not search
Needle-in-a-Needlestack When we don’t know what we’re looking for…
We can’t break upthe problem.
When the relationships among data are mysterious, and the nature of the inquiries unknown, no meaningful scheme for partitioning the data is possible.
…when the purpose of the system is discovery of relationships, not extracting information from already known interrelations, achieving satisfactory performance is difficult.
“
“
“
“
Current Big Data Approaches do NOT enable Discovery
(Source: Gartner Report, YarcData's uRiKA Shows Big Data Is More Than Hadoop and Data Warehouses, September 2012)
6
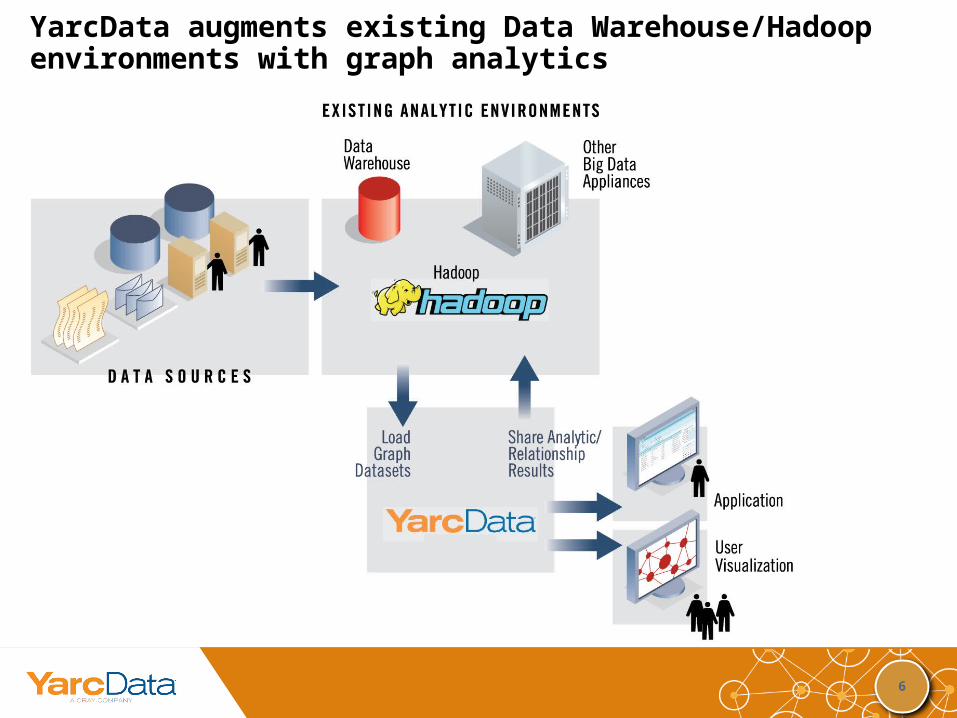
YarcData augments existing Data Warehouse/Hadoop environments with graph analytics
7
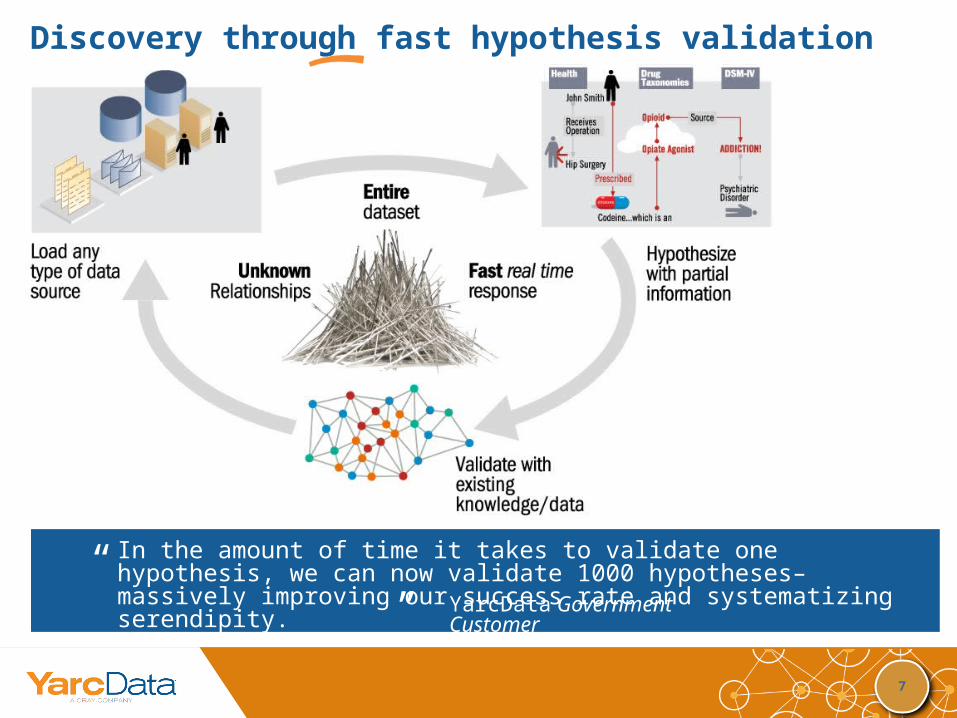
Discovery through fast hypothesis validation
“
In the amount of time it takes to validate one hypothesis, we can now validate 1000 hypotheses– massively improving our success rate and systematizing serendipity.
“ “
YarcData Government Customer
8
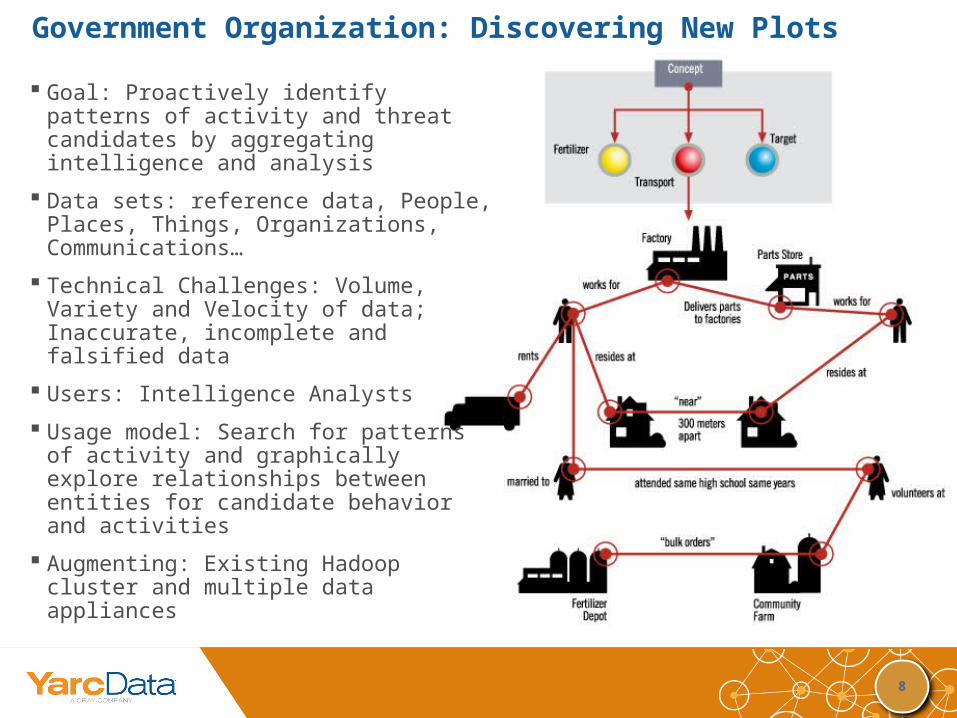
Government Organization: Discovering New Plots
Goal: Proactively identify patterns of activity and threat candidates by aggregating intelligence and analysis
Data sets: reference data, People, Places, Things, Organizations, Communications…
Technical Challenges: Volume, Variety and Velocity of data; Inaccurate, incomplete and falsified data
Users: Intelligence Analysts
Usage model: Search for patterns of activity and graphically explore relationships between entities for candidate behavior and activities
Augmenting: Existing Hadoop cluster and multiple data appliances

9
Healthcare Provider: Discovering New Treatments
Goal: Proactively identify optimal treatments for patients based on treatment results for “similar” patients
Data sets: Longitudinal patient data, Family history, Genetics, Reference data
Technical Challenges: Ad-hoc constantly changing definition of “similarity” across thousands of constantly changing attributes
Users: Doctors
Usage model: Compare results of candidate treatment options for “similar” patients based on ad-hoc physician specified patterns
Augmenting: Existing data warehouse
10
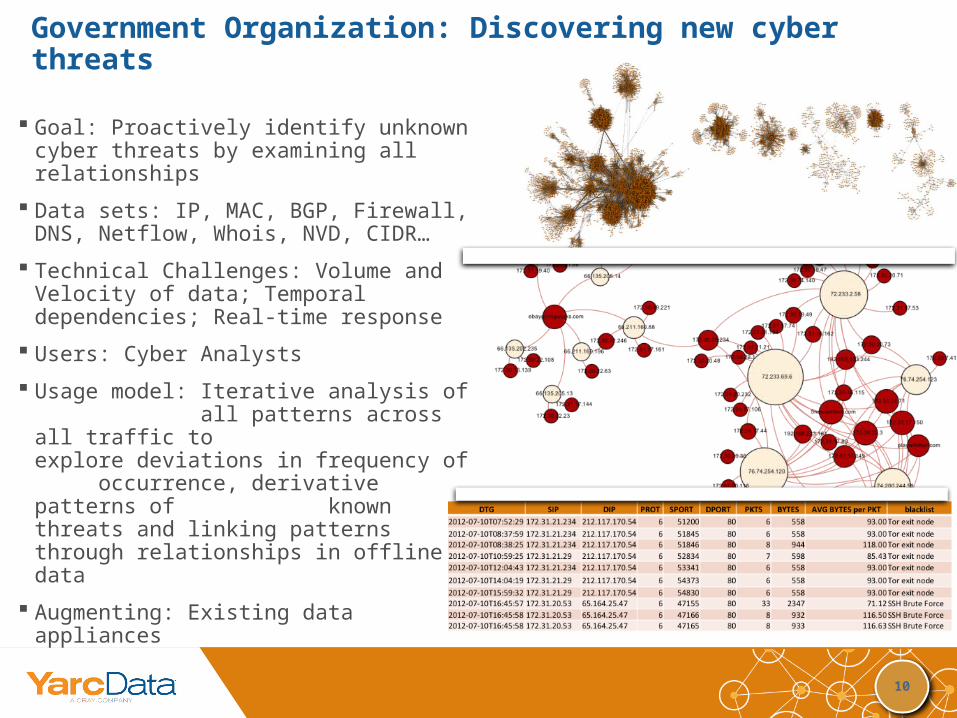
Government Organization: Discovering new cyber threats
Goal: Proactively identify unknown cyber threats by examining all relationships
Data sets: IP, MAC, BGP, Firewall, DNS, Netflow, Whois, NVD, CIDR…
Technical Challenges: Volume and Velocity of data; Temporal dependencies; Real-time response
Users: Cyber Analysts
Usage model: Iterative analysis of all patterns across all traffic to explore deviations in frequency of occurrence, derivative patterns of known threats and linking patterns through relationships in offline data
Augmenting: Existing data appliances
11
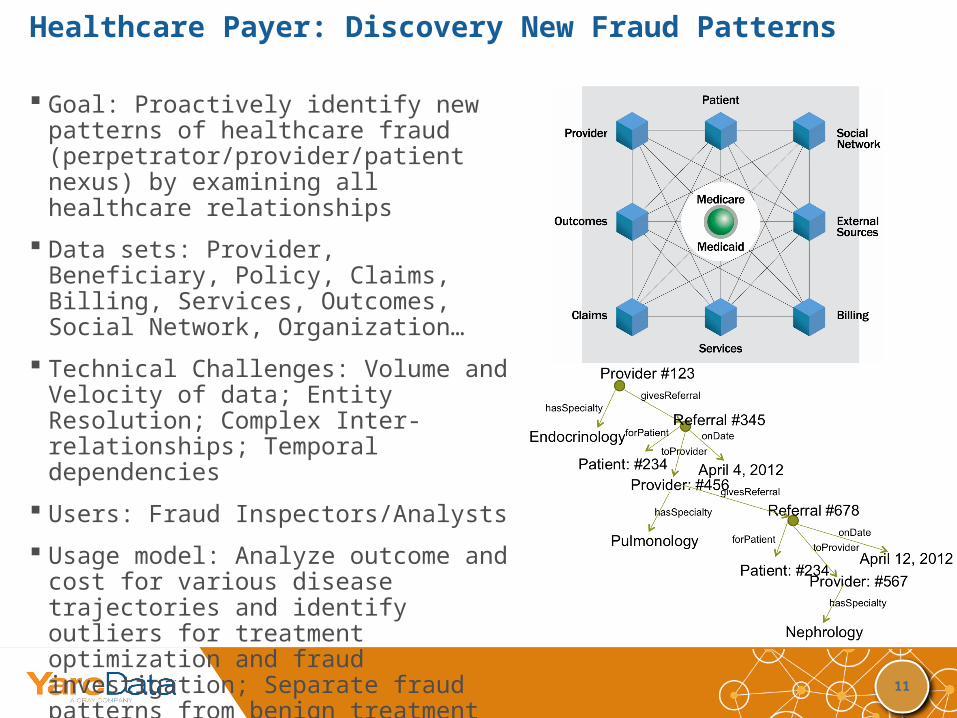
Healthcare Payer: Discovery New Fraud Patterns
Goal: Proactively identify new patterns of healthcare fraud (perpetrator/provider/patient nexus) by examining all healthcare relationships
Data sets: Provider, Beneficiary, Policy, Claims, Billing, Services, Outcomes, Social Network, Organization…
Technical Challenges: Volume and Velocity of data; Entity Resolution; Complex Inter-relationships; Temporal dependencies
Users: Fraud Inspectors/Analysts
Usage model: Analyze outcome and cost for various disease trajectories and identify outliers for treatment optimization and fraud investigation; Separate fraud patterns from benign treatment or legitimate errors
Augmenting: Existing data warehouse, Predictive Analytics
12
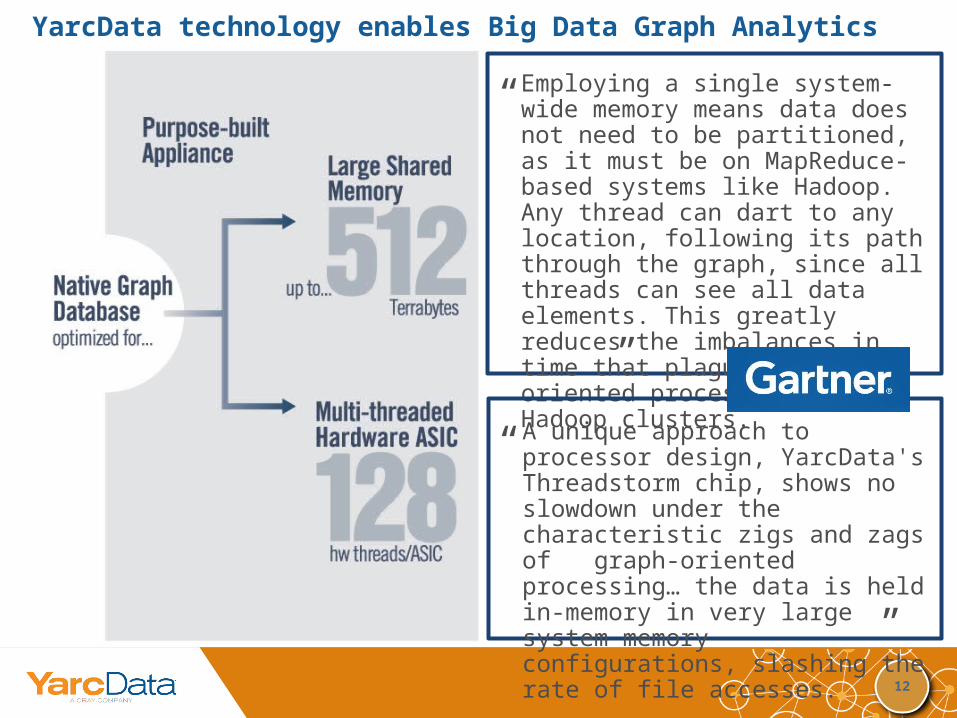
Employing a single system-wide memory means data does not need to be partitioned, as it must be on MapReduce-based systems like Hadoop. Any thread can dart to any location, following its path through the graph, since all threads can see all data elements. This greatly reduces the imbalances in time that plague graph-oriented processing on Hadoop clusters.
A unique approach to processor design, YarcData's Threadstorm chip, shows no slowdown under the characteristic zigs and zags of graph-oriented processing… the data is held in-memory in very large system memory configurations, slashing the rate of file accesses.
YarcData technology enables Big Data Graph Analytics
“
““
“
13
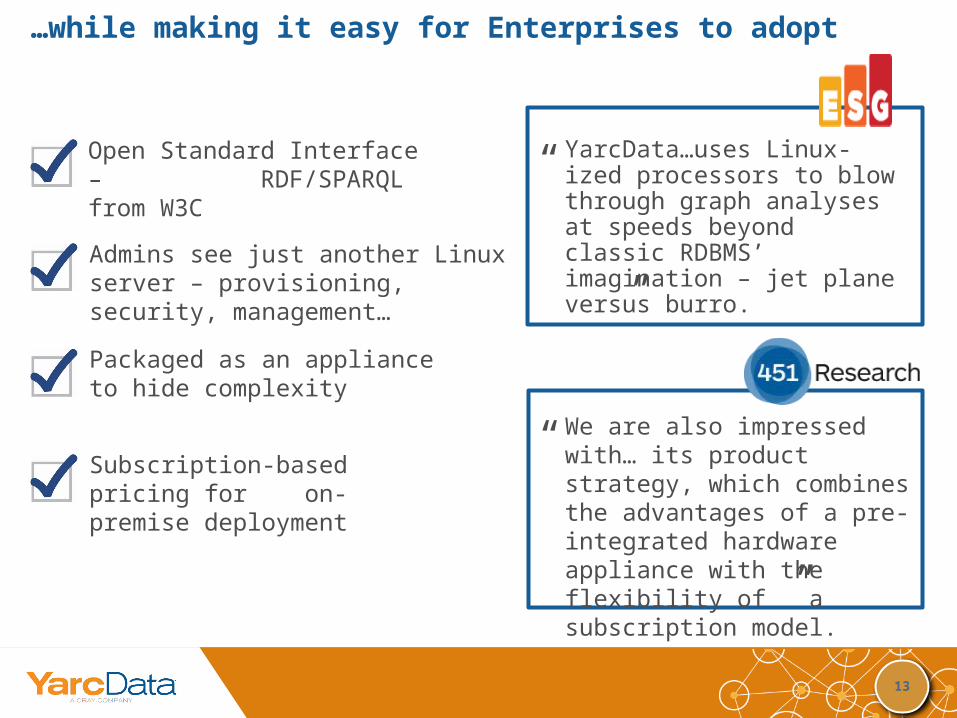
YarcData…uses Linux-ized processors to blow through graph analyses at speeds beyond classic RDBMS’ imagination – jet plane versus burro.
…while making it easy for Enterprises to adopt
Open Standard Interface – RDF/SPARQL from W3C
Admins see just another Linux server – provisioning, security, management…
Packaged as an appliance to hide complexity
Subscription-based pricing for on-premise deployment
“
“
We are also impressed with… its product strategy, which combines the advantages of a pre-integrated hardware appliance with the flexibility of a subscription model.
“
“
14
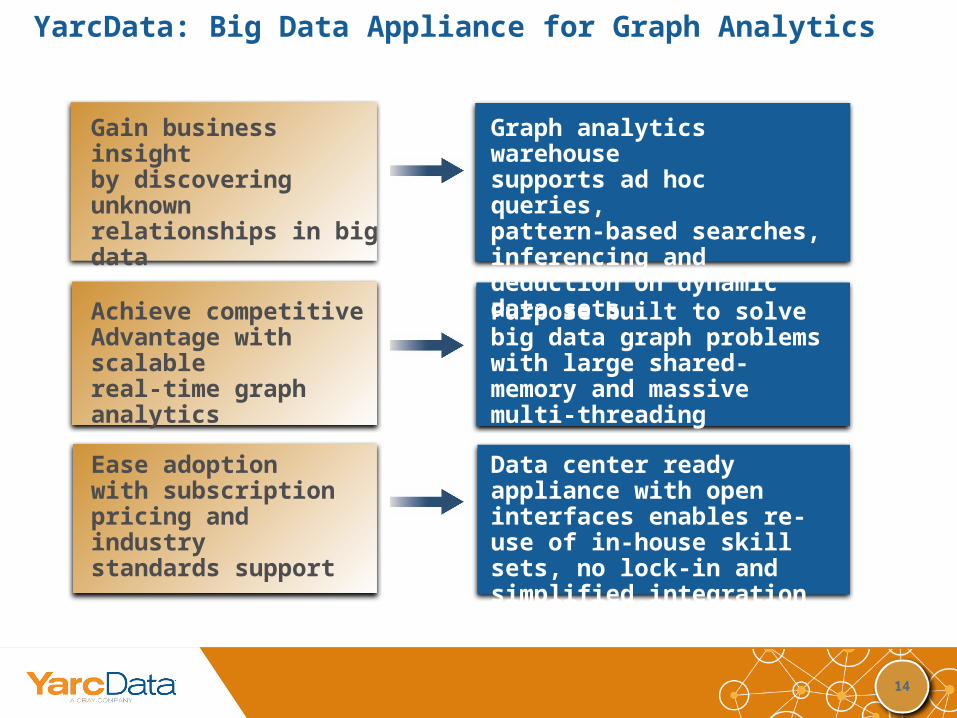
YarcData: Big Data Appliance for Graph Analytics
Ease adoption with subscription pricing and industry standards support
Purpose built to solve big data graph problems with large shared-memory and massive multi-threading
Graph analytics warehouse supports ad hoc queries, pattern-based searches, inferencing and deduction on dynamic data sets
Data center ready appliance with open interfaces enables re-use of in-house skill sets, no lock-in and simplified integration
Gain business insight by discovering unknown relationships in big data
Achieve competitive Advantage with scalable real-time graph analytics
15
Spacer to top left of heading – 9mm x 7mm
Growing Momentum…Titles: Arial Bold – 22 pointscolor: RGB: 72 102 133
Body Copy on typical pages, including bulleted copyBody Copy: Arial – 18 pointsRGB: 77 77 79 = 85% gray
Color Palette