Big-Data Analytics for Materials Science: Concepts ... · Big-Data Analytics for Materials Science:...
28
11/7/2015 1 Matthias Scheffler (*) Fritz-Haber-Institut der Max-Planck-Gesellschaft, Berlin; http://th.fhi-berlin.mpg.de/ (*) Work performed in collaboration with Luca Ghiringhelli, Jan Vybiral, Claudia Draxl, et al. o figure of merit of thermoelectrics (as function of T) o turn-over frequency of catalytic materials (as function of T and p) o efficiency of photovoltaic systems o etc. Big-Data Analytics for Materials Science: Concepts, Challenges, and Hype Dmitri Mendeleev (1834-1907) From the periodic table of the elements to a chart (a map) of mate- rials: Organize materials according to their properties and functions. Matthias Scheffler (*) Fritz-Haber-Institut der Max-Planck-Gesellschaft, Berlin; http://th.fhi-berlin.mpg.de/ (*) Work performed in collaboration with Luca Ghiringhelli, Jan Vybiral, Claudia Draxl, et al. o figure of merit of thermoelectrics (as function of T) o turn-over frequency of catalytic materials (as function of T and p) o efficiency of photovoltaic systems o etc. Big-Data Analytics for Materials Science: Concepts, Challenges, and Hype Dmitri Mendeleev (1834-1907) From the periodic table of the elements to a chart (a map) of mate- rials: Organize materials according to their properties and functions.
Transcript of Big-Data Analytics for Materials Science: Concepts ... · Big-Data Analytics for Materials Science:...
11/7/2015
1
Matthias Scheffler (*)
Fritz-Haber-Institut der Max-Planck-Gesellschaft, Berlin; http://th.fhi-berlin.mpg.de/
(*) Work performed in collaboration with Luca Ghiringhelli,
Jan Vybiral, Claudia Draxl, et al.
o figure of merit of thermoelectrics (as function of T)
o turn-over frequency of catalytic materials (as function of T and p)
o efficiency of photovoltaic systems
o etc.
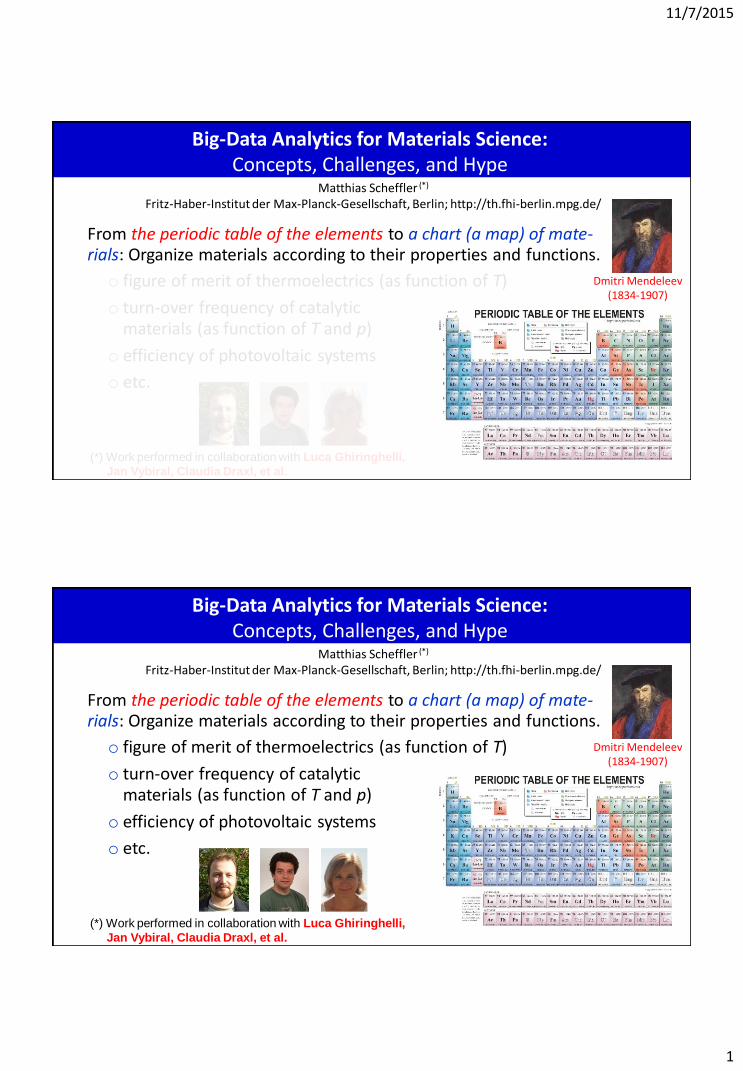
Big-Data Analytics for Materials Science: Concepts, Challenges, and Hype
Dmitri Mendeleev(1834-1907)
From the periodic table of the elements to a chart (a map) of mate-rials: Organize materials according to their properties and functions.
Matthias Scheffler (*)
Fritz-Haber-Institut der Max-Planck-Gesellschaft, Berlin; http://th.fhi-berlin.mpg.de/
(*) Work performed in collaboration with Luca Ghiringhelli,
Jan Vybiral, Claudia Draxl, et al.
o figure of merit of thermoelectrics (as function of T)
o turn-over frequency of catalytic materials (as function of T and p)
o efficiency of photovoltaic systems
o etc.
Big-Data Analytics for Materials Science: Concepts, Challenges, and Hype
Dmitri Mendeleev(1834-1907)
From the periodic table of the elements to a chart (a map) of mate-rials: Organize materials according to their properties and functions.

11/7/2015
2
Materials Genome Initiative for Global Competiveness
To help business discover, develop, and deploy new materials twice as fast, we’re launching what we call the Materials Genome Initiative. The invention of silicon circuits and lithium ion batteries made computers and iPods and iPads possible, but it took years to get those technologies from the drawing boards to the market place. We can do it faster.
President ObamaCarnegie Mellon University, June 2011
“twice as fast, at a fraction of the cost”
Compute or measure the basic properties („genes“) of many (ten thousand) materials and disseminate that information to the materials community to enable rapid searches and design.

11/7/2015
3
What is “Computational Materials Science”
what is meant by “first-principles (ab initio) calculations”
Veracity – Validation and Verification
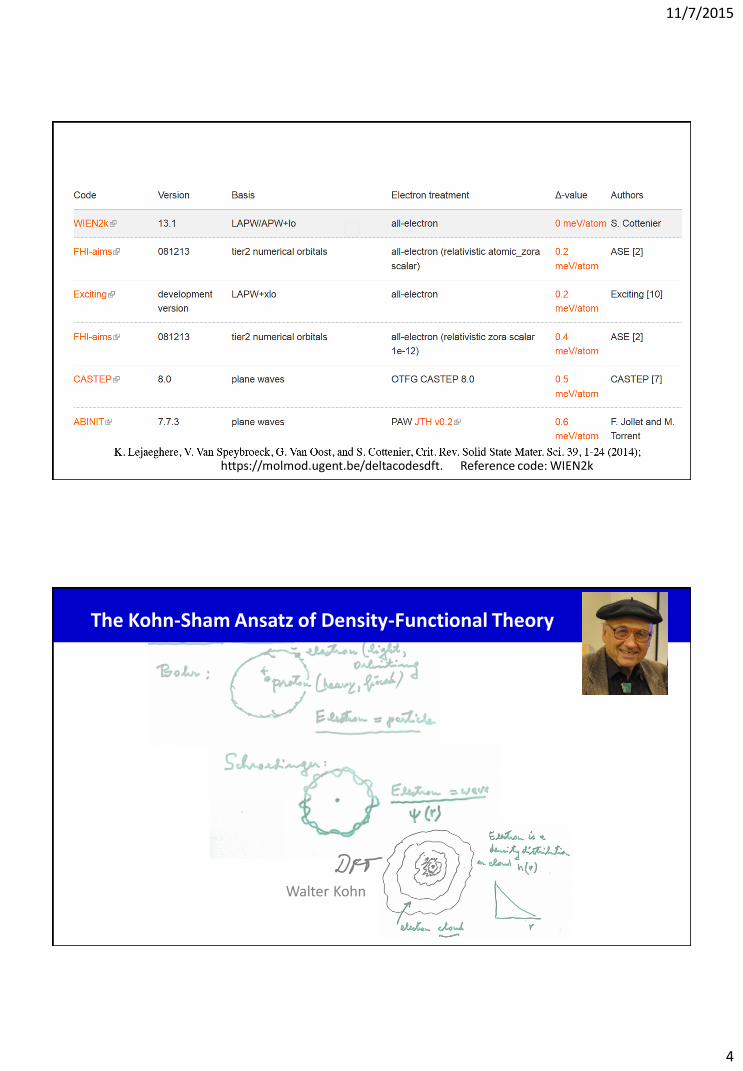
• accuracy of materials-science codes: o basis sets, o relativity, o pseudopotentials, o other numerical approximations (verification)
• accuracy of the exchange-correlation functional (validation)
11/7/2015
4
Veracity – Validation and VerificationComparing Solid State DFT Codes, Basis Sets and Potentials
https://molmod.ugent.be/deltacodesdft. Reference code: WIEN2k
Walter Kohn
The Kohn-Sham Ansatz of Density-Functional Theory

11/7/2015
5
Walter Kohn
Ev[n] = Ts[n] + ∫ v(r) n(r) d3r + EHartree[n] + Exc[n]
• Kohn-Sham (1965): Replace the original many-body problem by an independent electron problem that can be solved!
• With Ts [n] the kinetic energy functional of independent electrons, and Exc[n] the unknown functional.
• The challenge is to find useful, approximate xc functionals.
The Kohn-Sham Ansatz of Density-Functional Theory
but there are problems
• for certain bonding situations (vdW, hydrogen bonding, certain covalent bonds)
• for highly correlated situations, and
• for excited states.
Approximate xc functionals have been very successful
11/7/2015
6
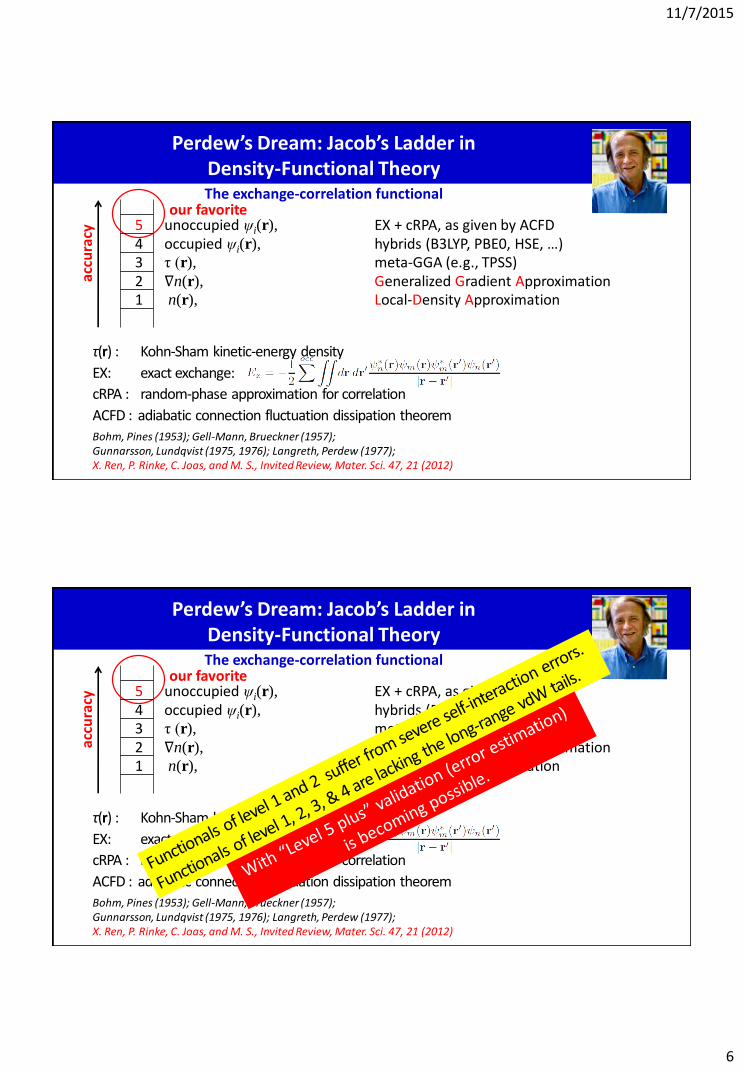
τ(r) : Kohn-Sham kinetic-energy density
EX: exact exchange:
cRPA : random-phase approximation for correlation
ACFD : adiabatic connection fluctuation dissipation theorem
Bohm, Pines (1953); Gell-Mann, Brueckner (1957); Gunnarsson, Lundqvist (1975, 1976); Langreth, Perdew (1977); X. Ren, P. Rinke, C. Joas, and M. S., Invited Review, Mater. Sci. 47, 21 (2012)
5 unoccupied ψi(r), EX + cRPA, as given by ACFD4 occupied ψi(r), hybrids (B3LYP, PBE0, HSE, …)3 τ (r), meta-GGA (e.g., TPSS) 2 ∇n(r), Generalized Gradient Approximation 1 n(r), Local-Density Approximation
accu
racy
Perdew’s Dream: Jacob’s Ladder in Density-Functional Theory
our favoriteThe exchange-correlation functional

11/7/2015
7
Test Sets for Materials Science and Engineering?
Chemists have shown the way. For small and light molecules they developed test sets: G2, NHTBH38, HTBH38, S22, S66 ...
We need a materials test set! We can now do renormalized second-order perturbation theory (similar to CCSD) and even full CI (*) – for certain systems.
Comparison with experiment is very important as well (adsorption energies of molecules, e.g. by microcalometry). However, theory-theory comparison is better defined.
(*) G. H. Booth, A. J. W. Thom, and A. Alavi, J. Chem. Phys. 131, 054106 (2009). G. H. Booth, A. Grüneis, G. Kresse, and A. Alavi, Nature 493, 365 (2013).

11/7/2015
8

11/7/2015
9
http://v.youku.com/v_show/id_XMTM0NDA0NDIxMg==.htmlhttps://www.youtube.com/watch?v=L-nmRSH4NQM
11/7/2015
10
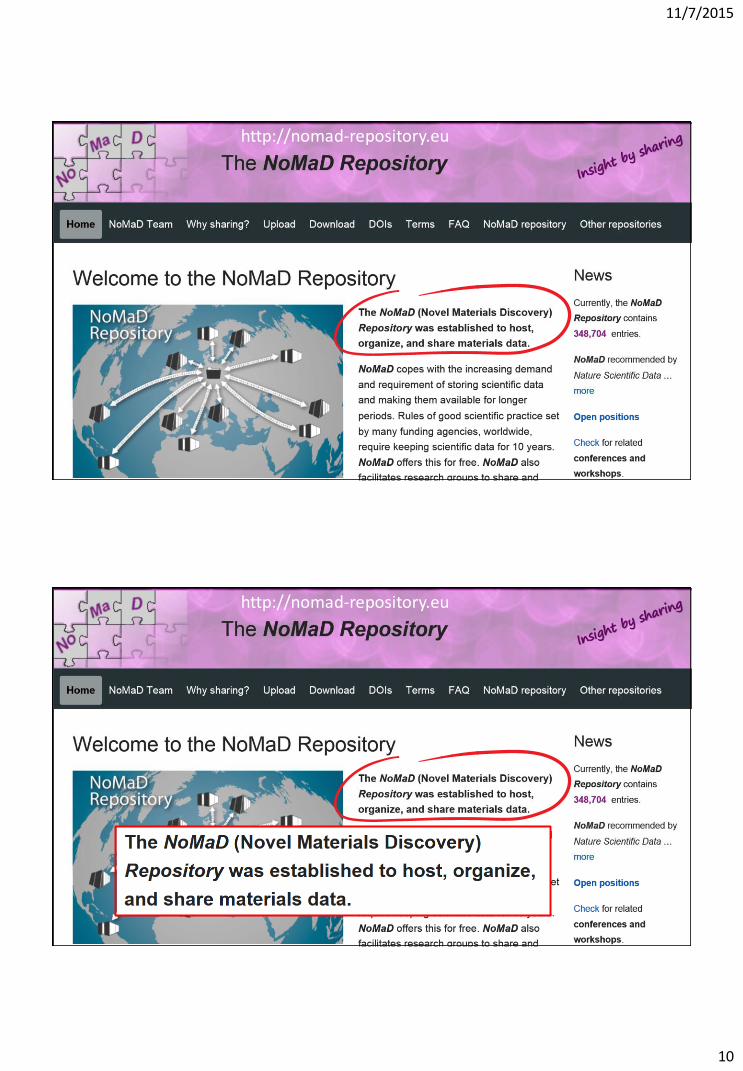
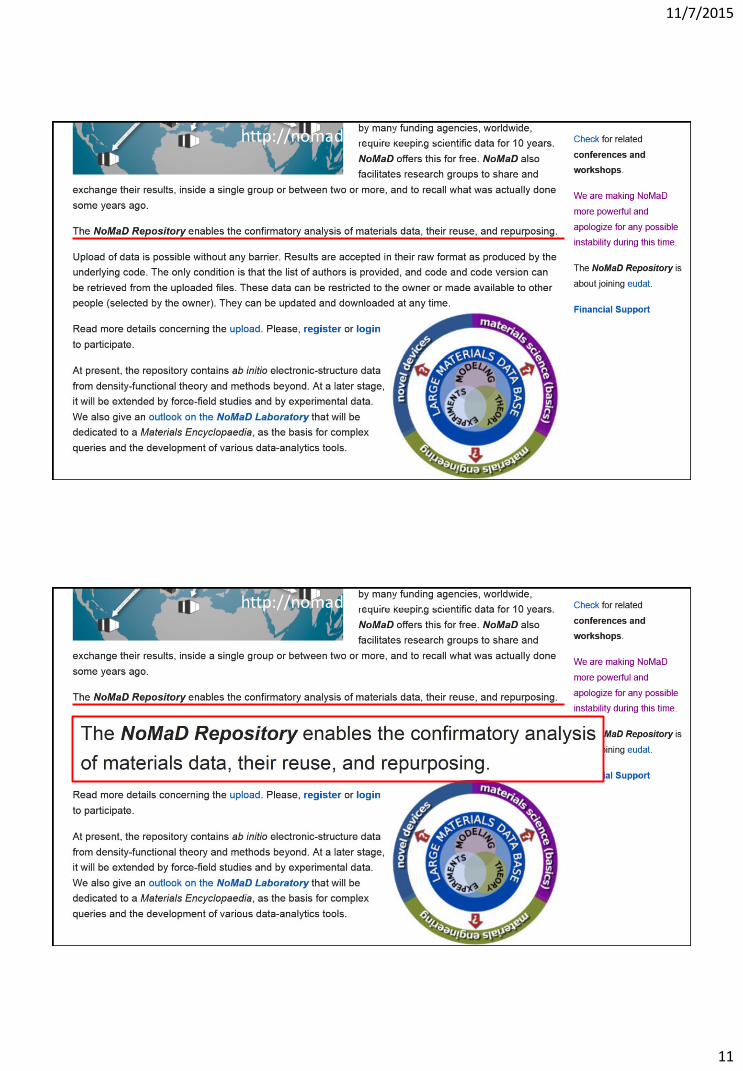
http://nomad-repository.eu
http://nomad-repository.eu
11/7/2015
11
http://nomad-repository.eu
http://nomad-repository.eu

11/7/2015
12
Currently, the NoMaD Repository contains 631,432 entries
http://nomad-repository.eu
What To Do With The Data?
The Four V of Big Data and an A
Data – data – data (analog to Moore’s law) (so far: most data are not used and even thrown away)

11/7/2015
13
The Four V of Big Data and an A
Data – data – data (analog to Moore’s law)
Big-Data Challenge: “four V”: Volume (amount of data), Variety (heterogeneity of form and meaning of data),Velocity at which data may change or new data arrive,Veracity (uncertainty of quality).
(so far: most data are not used and even thrown away)
The four V should be complemented by an “A”, Big-Data Analytics:• identify (so far) hidden trends,• What is the next most promising
candidate that should be studied?• identify anomalies,• identify the mechanisms behind a
certain material property/function.
Query and read out what was stored; high-throughput screening.Shouldn't we do more?!

11/7/2015
14
Training SetCalculate properties and functions, P, for
many materials, i.Density-Functional
Theory
DescriptorFind the appropriate
descriptor di ,
build a “table”:i di Pi
“Learning”Find the function
PSL(d) for the “table”; do cross validation.Statistical Learning
Fast PredictionsCalculate properties
and functions for new d values, i.e. new
materials.
Big-Data Analytics: How to Arrange the DataFinding a Set of Descriptive Parameters
{ZI, NI}, T, {p} de-termine the many-body hamiltonian and statistical mechanics
Statistical mechanics does not tell us what the relevant variables are. This is our choice. If we choose well, the results may be useful, if we chose badly, the results (while formally correct) will probably be useless. (Robert Zwanzig)
Training SetCalculate properties and functions, P, for
many materials, i.Density-Functional
Theory
DescriptorFind the appropriate
descriptor di ,
build a “table”:i di Pi
“Learning”Find the function
PSL(d) for the “table”; do cross validation.Statistical Learning
Fast PredictionsCalculate properties
and functions for new d values, i.e. new
materials.
Big-Data Analytics: How to Arrange the DataFinding a Set of Descriptive Parameters
{ZI, NI}, T, {p} de-termine the many-body hamiltonian and statistical mechanics

11/7/2015
15
Training SetCalculate properties and functions, P, for
many materials, i.Density-Functional
Theory
DescriptorFind the appropriate
descriptor di ,
build a “table”:i di Pi
“Learning”Find the function
PSL(d) for the “table”; do cross validation.Statistical Learning
Fast PredictionsCalculate properties
and functions for new d values, i.e. new
materials.
Big-Data Analytics: How to Arrange the DataFinding a Set of Descriptive Parameters
{ZI, NI}, T, {p} de-termine the many-body hamiltonian and statistical mechanics
d characterizes the relevant mechanisms that govern the observed property/function P. Identifying the descriptor d from known data Pi , is an ill-posed problem (statistical-learning theory): A little error in the data Pi
may suggest a different descriptor d. Thus, knowledge of the accuracy of data Pi is crucial (veracity). The choice of d is not unique.
A) Veracity: Accuracy of state-of-the-art density-functional theory (validation and verification)
B) Descriptor: How to find it, how to understand the causality between dand PSL?

11/7/2015
16
Data Fitting, Statistical Learning, and Machine Learning
x x
x
x
x
x
x
More data means better representation.Think about what may be the best (meaningful) coordinate!
P(x)
x
{ Pi } = data
{ xi } = “coordinate” or “descriptor”
We have data {Pi} at “coordinates” {xi} xi = set of descriptive parameters (descriptor)
Linear regression:
Polynomial kernel
Gaussian kernel
K(xi, xk) = xi . xk PSL(xi) = xi . c*
K(xi, xk) = exp ( Σj ( xi xk )2 / 2σj2 )
Kernel Regression
Pi = PSL(xi) = Σk=1 ck K(xi, xk)N
K(xi, xk) = ( xi . xk + c ) d
For successful learning, we need a “good” descriptor: {xi} {di}
!

11/7/2015
17
Can we predict not yet calculated structures from ZA and ZB? Can we create a map: “The ZB/W community lives here and the RS community there?”
Energy differences between different structures are very small.
For Si: 0.01% of the energy of a Si atom, or 0.1% of the 4 valence electrons.
Complexity: Ts[n] and Exc.
RS ZB
Toy Model: Descriptor for the Classification “Zincblende/Wurtzite or Rocksalt?”
Can we predict not yet calculated structures from ZA and ZB? Can we create a map: “The ZB/W community lives here and the RS community there?”
RS ZB
Energy differences between different structures are very small.
For Si: 0.01% of the energy of a Si atom, or 0.1% of the 4 valence electrons.
Complexity: Ts[n] and Exc.
Toy Model: Descriptor for the Classification “Zincblende/Wurtzite or Rocksalt?”

11/7/2015
18
Only DFT-LDA: Can we predict not yet calculated LDA structures from ZA and ZB?
82 octet AB binary compounds
We need to arrange the data such that statistical learning is efficient. We need a good set of descriptive parameters.
Toy Model: Descriptor for the Classification “Zincblende/Wurtzite or Rocksalt?”
d1
d2
How to find d1, d2?In reality the representation will be higher than 2-dimensional.
RS J. A. van Vechten, Phys. Rev. 182, 891 (1969).J. C. Phillips, Rev. Mod. Phys. 42, 317 (1970).A. Zunger, Phys. Rev. B 22, 5839 (1980).D. G. Pettifor, Solid State Commun. 51, 31 (1984).Y. Saad, D. Gao, T. Ngo, S. Bobbitt, J. R. Chelikowsky, and W. Andreoni, Phys. Rev. B 85, 104104 (2012).
?
Statistical Learning (Machine Learning)
fit and/or interpolation of known data points { Pi } and building a function P(d)
the key scientific challenge: find a reliable, low dimensional descriptor d.
kernel ridge regression linear
+ +minimize

11/7/2015
19
Statistical Learning (Machine Learning)
+ +
least absolute shrinkage and selection operator (LASSO) for feature selection
R. Tibshirani, J. Royal Statist. Soc. B 58, 267 (1996)
minimize
fit and/or interpolation of known data points { Pi } and building a function P(d)
the key scientific challenge: find a reliable, low dimensional descriptor d.
kernel ridge regression linear
Statistical Learning (Machine Learning)
+ +
R. Tibshirani, J. Royal Statist. Soc. B 58, 267 (1996)
minimize
l2 norm: sqrt(x12 + y1
2 )x1
y1
l1 norm: | x1| + | y1| Manhattan (taxi cab) distance
kernel ridge regression linear
least absolute shrinkage and selection operator (LASSO) for feature selection
11/7/2015
20
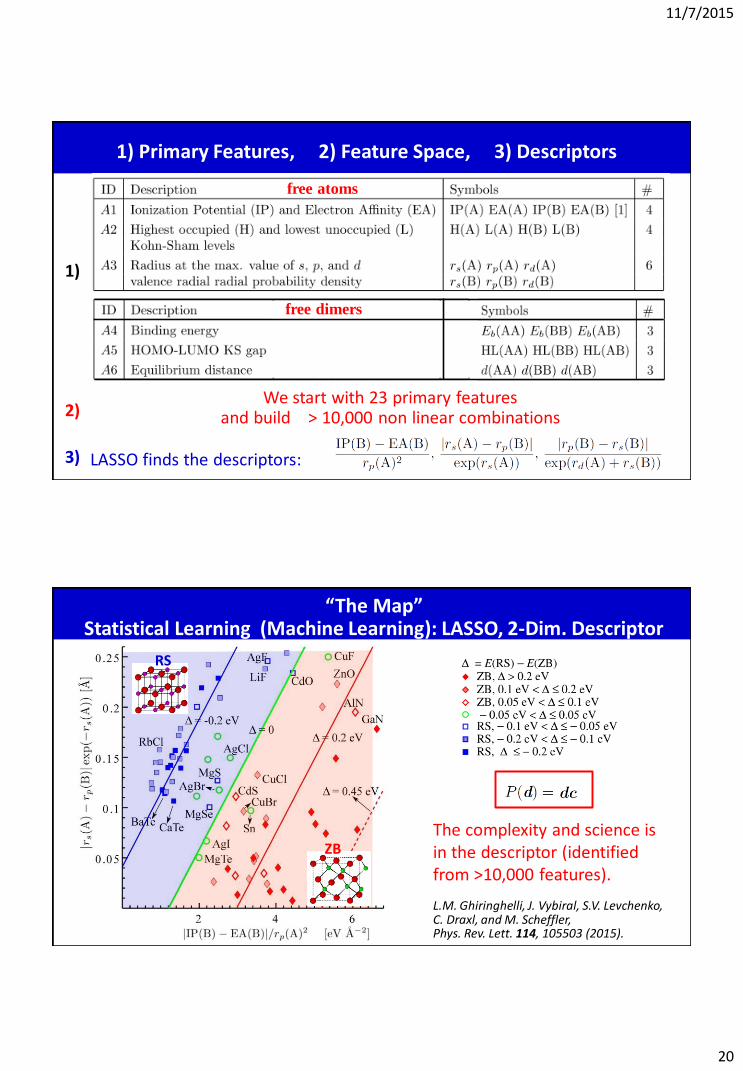
1) Primary Features, 2) Feature Space, 3) Descriptors
free atoms
free dimers
LASSO finds the descriptors:
We start with 23 primary featuresand build > 10,000 non linear combinations
1)
2)
3)
“The Map”Statistical Learning (Machine Learning): LASSO, 2-Dim. Descriptor
The complexity and science is in the descriptor (identified from >10,000 features).
L.M. Ghiringhelli, J. Vybiral, S.V. Levchenko, C. Draxl, and M. Scheffler, Phys. Rev. Lett. 114, 105503 (2015).
RS
ZB
11/7/2015
21
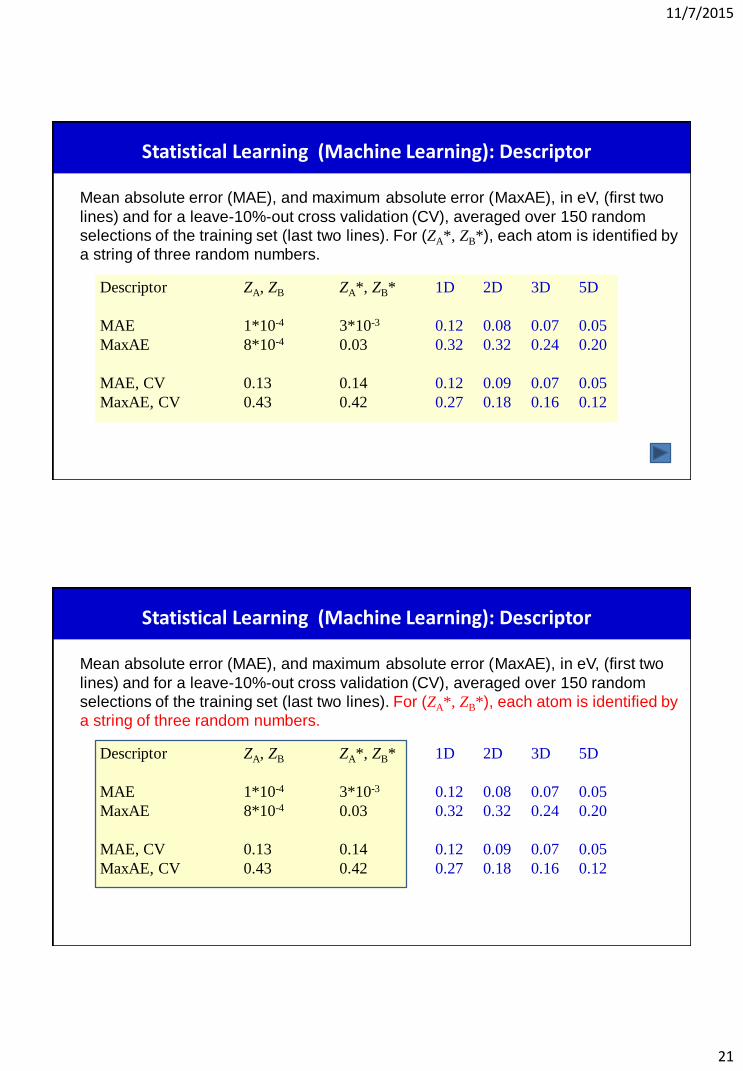
Statistical Learning (Machine Learning): Descriptor
Descriptor ZA, ZB ZA*, ZB* 1D 2D 3D 5D
MAE 1*10-4 3*10-3 0.12 0.08 0.07 0.05
MaxAE 8*10-4 0.03 0.32 0.32 0.24 0.20
MAE, CV 0.13 0.14 0.12 0.09 0.07 0.05
MaxAE, CV 0.43 0.42 0.27 0.18 0.16 0.12
Mean absolute error (MAE), and maximum absolute error (MaxAE), in eV, (first two
lines) and for a leave-10%-out cross validation (CV), averaged over 150 random
selections of the training set (last two lines). For (ZA*, ZB*), each atom is identified by
a string of three random numbers.

11/7/2015
22
Descriptor ZA, ZB ZA*, ZB* 1D 2D 3D 5D
MAE 1*10-4 3*10-3 0.12 0.08 0.07 0.05
MaxAE 8*10-4 0.03 0.32 0.32 0.24 0.20
MAE, CV 0.13 0.14 0.12 0.09 0.07 0.05
MaxAE, CV 0.43 0.42 0.27 0.18 0.16 0.12
Mean absolute error (MAE), and maximum absolute error (MaxAE), in eV, (first two
lines) and for a leave-10%-out cross validation (CV), averaged over 150 random
selections of the training set (last two lines). For (ZA*, ZB*), each atom is identified by
a string of three random numbers.
Statistical Learning (Machine Learning): Descriptor
The complexity and science is in the descriptor (identified from >10,000 features).
L.M. Ghiringhelli, J. Vybiral, S.V. Levchenko, C. Draxl, and M. Scheffler, Phys. Rev. Lett. 114, 105503 (2015).
Statistical Learning (Machine Learning): LASSO, 2-Dim. Descriptor
Using our approach and noinformation on BN and C we wouldhave predicted the existence andunusual stability of these materials.
ZB
Statistical Learning (Machine Learning): LASSO, 2-Dim. Descriptor

11/7/2015
23
Big-Data-Driven Science vs. Model-Driven Science
Traditional approach in the empirical sciences (e.g. physics, chemistry):
• Study a few systems
• Build a model,
• Improve the model when needed
(e.g. strength of transition metals Ti, … Fe, … Cu: d-band occupation, etc.).
• Find structure in big data that is probably invisible for humans.
• Offer many (thousands) of optional models, and
• employ applied math/information theory to find out which model is best (e.g. compressed sensing, statistical learning).
The new option offered by Big-Data Analytics (and big-data-driven science):
Drawing Causal Inference from Big Data (Scientific Insight) -- can we trust a prediction? --
There are four possibilities (types of causality) behind P(d):
1. d → P : P “listens” to d
2. A → d and A → P : There is no direct connection between d and P, butd and P both “listen” to a third “actuator”
3. P → d : d “listens” to P
4. There is no direct connection between d and P, but they have a common effect that listens to both and screams: “I occurred“ (Berksonbias; Judea Pearl)
Correlation between d and P , i.e. P is a function of d, P(d), reflects causal inference
if it is based on sufficient information(*)
(*) Construct d with scientific knowledge (prejudice?), or use “big data” for {Pi }.

11/7/2015
24
LASSO has provided us with an equation for the quantitative energy difference:
Case #2:Nuclear numbers ZA, ZB ↔ our descriptor
Nuclear numbers ZA, ZB → total-energy differences
a mapping exists, even a physical intuition exist, but ΔEdoes not listen directly to the descriptor (intricate causality)
Drawing Causal Inference from Big Data (Scientific Insight) -- can we trust a prediction? --
This is an equation, but not a scientific law:
There are four possibilities (types of causality) behind P(d):
1. d → P : P “listens” to d
2. A → d and A → P : There is no direct connection between d and P, butd and P both “listen” to a third “actuator”
3. P → d : d “listens” to P
4. There is no direct connection between d and P, but they have a common effect that listens to both and screams: “I occurred“ (Berksonbias; Judea Pearl)
Correlation between d and P , i.e. P is a function of d, P(d), reflects causal inference
if it is based on sufficient information(*)
(*) Construct d with scientific knowledge (prejudice?), or use “big data” for {Pi }.
Drawing Causal Inference from Big Data (Scientific Insight) -- can we trust a prediction? --

11/7/2015
25
Conclusion / Suggestion: Accept “larks” (not just scientific laws) to predict materials properties.
ROMEO: “It was the lark, the bird that sings at dawn, not the nightingale. Look, my love, what are those streaks of light in the clouds parting in the east? Night is over, and day is coming. … ”
The singing of the lark is a good descriptor for “the sun will rise soon”.
The singing of the lark is not the actuator of (the mechanism behind) the sunrise.
case # 3
Drawing Causal Inference from Big Data (Scientific Insight) -- can we trust a prediction? --
• Machine learning may find structure in “big data” that is invisible to humans.
• Correlation reflects causal inference (if based on sufficient information).
Summary and Outlook
Rel
evan
ce o
f a
new
tec
hn
olo
gy
Time
Reality
Perception
we are probably here
• The causality may be intricate and complex.
• Causal models, i.e. employing causal descriptors, are able to provide scientific insight and understanding.
big-data analytics in materials science
11/7/2015
26
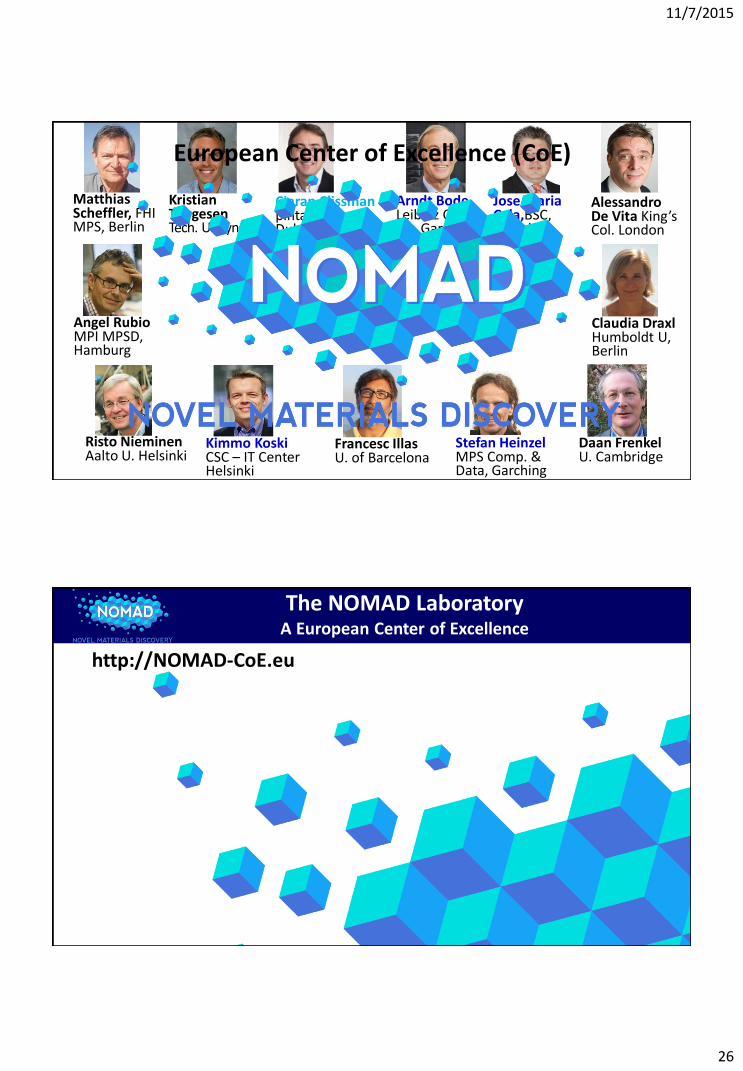
Arndt Bode Leibniz Comp. Ctr, Garching
Alessandro De Vita King’sCol. London
Claudia Draxl Humboldt U, Berlin
Daan Frenkel U. Cambridge
Stefan HeinzelMPS Comp. & Data, Garching
Francesc IllasU. of Barcelona
Kimmo KoskiCSC – IT Center Helsinki
Jose Maria Cela,BSC, Barcelona
Risto Nieminen Aalto U. Helsinki
Ciaran Clissmanpintail Ltd.Dublin
Matthias Scheffler, FHI MPS, Berlin
KristianThygesenTech. U., Lyngby
Angel Rubio MPI MPSD, Hamburg
European Center of Excellence (CoE)
http://NOMAD-CoE.eu
The NOMAD LaboratoryA European Center of Excellence

11/7/2015
27
http://NOMAD-CoE.eu
The NOMAD LaboratoryA European Center of Excellence
http://NOMAD-CoE.eu
The NOMAD LaboratoryA European Center of Excellence
The NOMAD CoE develops a Materials Encyclopedia and Big-Data Analytics tools for materials science and engineering. Eight complementary research groups of highest scientific standing in computational materials science along with four high-performance computer centers form the synergetic core of this CoE.

11/7/2015
28
Existing resources
Conversion layers
NOMAD-Repository.eu
The NOMAD LaboratoryA European Center of Excellence