Bicycle Network Mandatory Helmet Review Opinion of Chris ... · Australia's cycling participation...
20
Making bike riding easy for everyone Level 4, 246 Bourke Street Melbourne VIC 3000 234 Crown Street Darlinghurst NSW 2010 210 Collins Street Hobart TAS 7000 Suite 5, 18-20 Cavenagh Street Darwin NT 0800 Freecall: 1800 639 634 bicyclenetwork.com.au Bicycle Network Mandatory Helmet Review Opinion of Chris Gillham, owner, cycle-helmets.com 1. Do you believe it should be mandatory to wear a helmet when riding a bicycle? (If you believe it should be mandatory at some times but not others please describe when.) Helmet wearing should be voluntary among all ages in all circumstances. 2. What’s your reasons for your answer to question one? Evidence that mandatory helmets discourage cycling participation is abundant both in pre versus post law data comparisons and today on the middle to outer suburban streets of Australia's cities. Pay attention and you might notice that more than a third of cyclists are defying the law and risking punishment by not motoring but instead enjoying some exercise on a bike without a helmet. Twenty years of statistics can be browsed at my website (www.cycle- helmets.com) but if data's not your thing, it's worth considering how abysmal Australia's cycling participation would now be if those bare-head cyclists all stopped riding. Decades after helmet law enforcement, they are willing to risk police apprehension because they don't agree that they should be forced to wear an uncomfortable and inconvenient helmet. Yet Australian authorities continue to claim there is no evidence that mandatory helmets discourage cycling. Participation decline Numerous surveys dating back to 1985 suggest cycling declines around 30- 40% following national helmet law enforcement in 1990-92, and it is broadly accepted that the declines were most significant among children and teenagers. Female participation in particular was discouraged.
Transcript of Bicycle Network Mandatory Helmet Review Opinion of Chris ... · Australia's cycling participation...

Making bike riding easy for everyone
Level 4, 246 Bourke Street Melbourne VIC 3000
234 Crown Street Darlinghurst NSW 2010
210 Collins Street Hobart TAS 7000
Suite 5, 18-20 Cavenagh Street Darwin NT 0800
Freecall: 1800 639 634 bicyclenetwork.com.au
Bicycle Network Mandatory Helmet Review
Opinion of Chris Gillham, owner, cycle-helmets.com
1. Do you believe it should be mandatory to wear a helmet when riding a bicycle? (If you believe it should be mandatory at some times but not others please describe when.)
Helmet wearing should be voluntary among all ages in all circumstances.
2. What’s your reasons for your answer to question one?
Evidence that mandatory helmets discourage cycling participation is abundant both in pre versus post law data comparisons and today on the middle to outer suburban streets of Australia's cities. Pay attention and you might notice that more than a third of cyclists are defying the law and risking punishment by not motoring but instead enjoying some exercise on a bike without a helmet. Twenty years of statistics can be browsed at my website (www.cycle-helmets.com) but if data's not your thing, it's worth considering how abysmal Australia's cycling participation would now be if those bare-head cyclists all stopped riding. Decades after helmet law enforcement, they are willing to risk police apprehension because they don't agree that they should be forced to wear an uncomfortable and inconvenient helmet. Yet Australian authorities continue to claim there is no evidence that mandatory helmets discourage cycling.
Participation decline Numerous surveys dating back to 1985 suggest cycling declines around 30-40% following national helmet law enforcement in 1990-92, and it is broadly accepted that the declines were most significant among children and teenagers. Female participation in particular was discouraged.

Making bike riding easy for everyone
Level 4, 246 Bourke Street Melbourne VIC 3000
234 Crown Street Darlinghurst NSW 2010
210 Collins Street Hobart TAS 7000
Suite 5, 18-20 Cavenagh Street Darwin NT 0800
Freecall: 1800 639 634 bicyclenetwork.com.au
The recovery in cyclist numbers began in the mid to late 1990s, partly because police in several states started to relax enforcement. With petrol prices soaring, numbers grew above pre-law levels from 2000 to 2010, although still lagging on a per capita basis when Australian population growth is considered (1990-2010 : 29.1% / 1990-2016 : 38.5%). Over the past 25 years, the demographic bulge of baby boomers – who as kids grew up learning and loving bikes without helmets – have swelled survey numbers, many wearing lycra and lids regardless of their opinion of the law. However, age is taking its toll and as they retire their bikes they're not being replaced on our roads by younger generations who have been discouraged for decades or since birth if aged less than 25. Academics agree there has been an ageing demographic shift in cycling participation since 1990 and it's the same pattern in other countries where child helmets are mandated either by the state or by parents and schools.
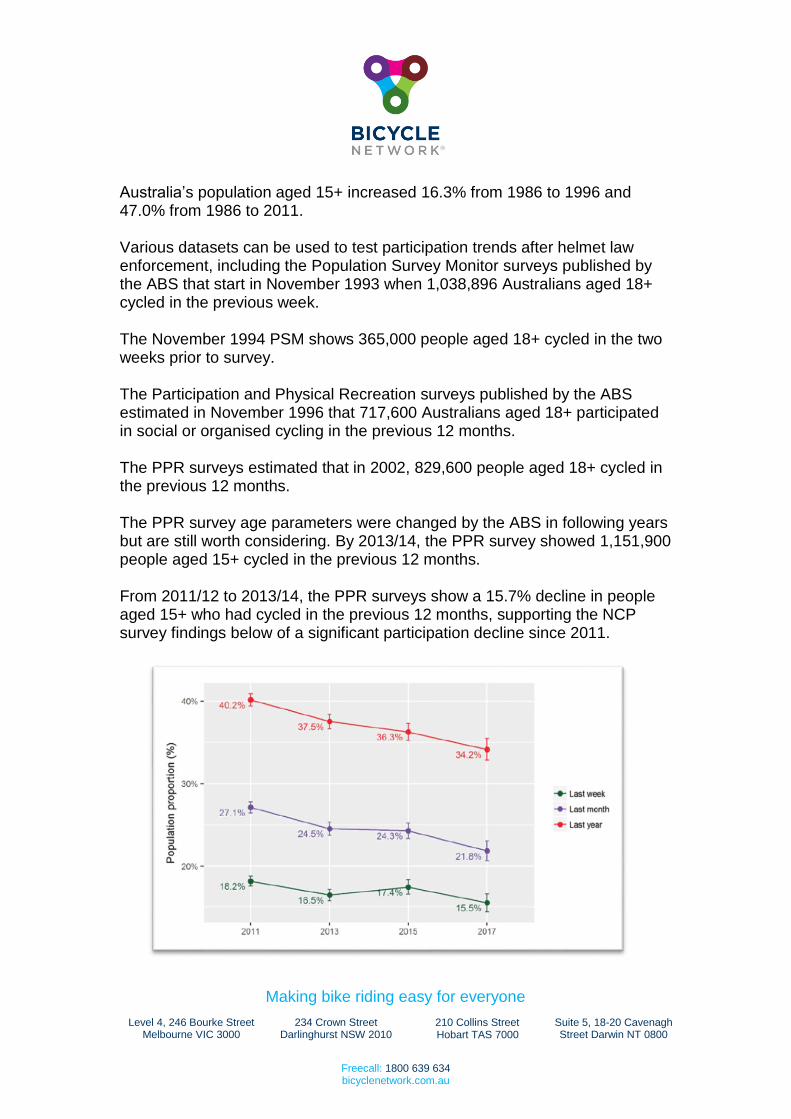
National Cycling Participation The Austroads and Australian Bicycle Council biennial National Cycling Participation (NCP) surveys began in 2011 as part of a failed strategy to double cycling participation by 2016. Instead, the NCP surveys show Australians cycling at least once per week, as a population proportion, declined from 18.2% in 2011 to 15.5% in 2017. Applied to ABS 2010 and 2016 population data (2011 survey based on 2010 population), those percentages suggest there are 242,228 fewer people cycling weekly over the past six years. Applied only to 2016 population, 18.2% is 4,235,266 and 15.5% is 3,606,957 – 628,309 fewer cyclists per week. In the second most overweight country on earth, it's worth noting Ausplay data show 635,627 Australians of all ages played Australian Rules Football in 2016. If every Aussie Rules player stopped kicking the ball, might the media pay attention to a public health crisis? The NCP surveys show average time ridden by cyclists dropped 20.9% from 3.21 hours per week in 2011 to 2.54 hours per week in 2017.

Making bike riding easy for everyone
Level 4, 246 Bourke Street Melbourne VIC 3000
234 Crown Street Darlinghurst NSW 2010
210 Collins Street Hobart TAS 7000
Suite 5, 18-20 Cavenagh Street Darwin NT 0800
Freecall: 1800 639 634 bicyclenetwork.com.au
The NCP national results show that in 2011, 40.2% of Australians pushed the pedals at least once during the year prior to survey. In 2017, the percentage had dropped to 34.1%.
Applied to ABS 2010 and 2016 population data, those percentages suggest there are 566,740 fewer people cycling annually over the past six years. Applied only to 2016 population, 40.2% is 9,354,818 and 34.1% is 7,935,306 – 1,419,512 fewer cyclists per year. In Victoria, the NCP 2017 survey results show the proportion of the population aged 2+ cycling at least once a year was 35.8% (42.6% in 2011), which is 2,154,153 based on 2016 population. The Victorian Bicycling Strategy published by VicRoads in 1990 showed a total of 2,215,000 Victorians of all ages cycling in pre-law October 1989. Participation down 2.7% despite 43.0% population growth in Victoria from 1989 to 2016. The 1990 report estimated 51% of Victorians were bicyclists, compared to NCP data showing 34.6% of Victorians cycling at least once in 2017. In their 2015 and 2017 survey reports, the NCP authors agree that cycling participation is likely to continue its decline because of the ageing of the Australian population.
The NSW experience In early 2016 the NSW government increased helmet penalties from $71 to $319. NCP survey data show people cycling at least once a week in NSW dropped from 16.7% in 2015 to 12.5% in 2017, the lowest rate for any Australian jurisdiction. NSW participation declined 25% from 2015 to 2017 and injuries declined 7% in the first 10 months after the 349% increase in helmet penalty. Many of the bare-head cyclists in NSW decided that at $319 (now $330), the penalty was too high to risk cycling. Many are now probably driving their cars, with injury trends suggesting an increase in the per cyclist accident/injury ratio.
Making bike riding easy for everyone
Level 4, 246 Bourke Street Melbourne VIC 3000
234 Crown Street Darlinghurst NSW 2010
210 Collins Street Hobart TAS 7000
Suite 5, 18-20 Cavenagh Street Darwin NT 0800
Freecall: 1800 639 634 bicyclenetwork.com.au
Back in 1992, research published by the Roads and Traffic Authority NSW showed child cyclist numbers fell by 36% in the 10 months after helmet law enforcement and adult numbers by 14% in the 16 months after enforcement.
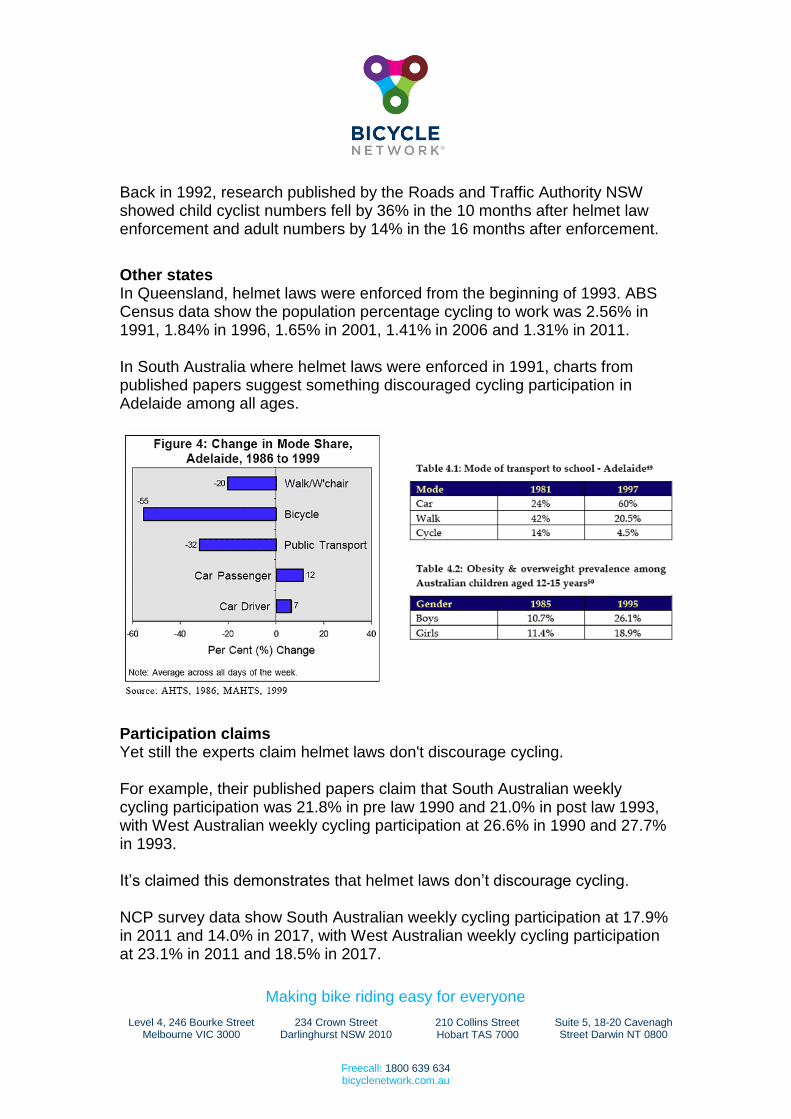
Other states In Queensland, helmet laws were enforced from the beginning of 1993. ABS Census data show the population percentage cycling to work was 2.56% in 1991, 1.84% in 1996, 1.65% in 2001, 1.41% in 2006 and 1.31% in 2011. In South Australia where helmet laws were enforced in 1991, charts from published papers suggest something discouraged cycling participation in Adelaide among all ages.
Participation claims Yet still the experts claim helmet laws don't discourage cycling. For example, their published papers claim that South Australian weekly cycling participation was 21.8% in pre law 1990 and 21.0% in post law 1993, with West Australian weekly cycling participation at 26.6% in 1990 and 27.7% in 1993. It’s claimed this demonstrates that helmet laws don’t discourage cycling. NCP survey data show South Australian weekly cycling participation at 17.9% in 2011 and 14.0% in 2017, with West Australian weekly cycling participation at 23.1% in 2011 and 18.5% in 2017.

Making bike riding easy for everyone
Level 4, 246 Bourke Street Melbourne VIC 3000
234 Crown Street Darlinghurst NSW 2010
210 Collins Street Hobart TAS 7000
Suite 5, 18-20 Cavenagh Street Darwin NT 0800
Freecall: 1800 639 634 bicyclenetwork.com.au
Almost all bicycles in Australia are manufactured overseas and imports fell 17.1% from 2012/13 to 2016, despite 6.5% population growth. Child bicycle imports dropped from 492,000 in 2007/08 to 382,000 in 2016/17, a 22.4% reduction. ABS Census Travel To Work data show the proportion of Australian commuters riding bikes plunged after helmet law enforcement and never recovered. ABS Census data below show the number of Australians aged 15+ riding a bicycle to work decreased 13.7% from pre-law 1986 (86,201) to 1996 (74,423) and increased 20.5% from 1986 (86,201) to 2011 (103,893).
Making bike riding easy for everyone
Level 4, 246 Bourke Street Melbourne VIC 3000
234 Crown Street Darlinghurst NSW 2010
210 Collins Street Hobart TAS 7000
Suite 5, 18-20 Cavenagh Street Darwin NT 0800
Freecall: 1800 639 634 bicyclenetwork.com.au
Australia’s population aged 15+ increased 16.3% from 1986 to 1996 and 47.0% from 1986 to 2011. Various datasets can be used to test participation trends after helmet law enforcement, including the Population Survey Monitor surveys published by the ABS that start in November 1993 when 1,038,896 Australians aged 18+ cycled in the previous week. The November 1994 PSM shows 365,000 people aged 18+ cycled in the two weeks prior to survey. The Participation and Physical Recreation surveys published by the ABS estimated in November 1996 that 717,600 Australians aged 18+ participated in social or organised cycling in the previous 12 months. The PPR surveys estimated that in 2002, 829,600 people aged 18+ cycled in the previous 12 months. The PPR survey age parameters were changed by the ABS in following years but are still worth considering. By 2013/14, the PPR survey showed 1,151,900 people aged 15+ cycled in the previous 12 months. From 2011/12 to 2013/14, the PPR surveys show a 15.7% decline in people aged 15+ who had cycled in the previous 12 months, supporting the NCP survey findings below of a significant participation decline since 2011.

Making bike riding easy for everyone
Level 4, 246 Bourke Street Melbourne VIC 3000
234 Crown Street Darlinghurst NSW 2010
210 Collins Street Hobart TAS 7000
Suite 5, 18-20 Cavenagh Street Darwin NT 0800
Freecall: 1800 639 634 bicyclenetwork.com.au
Northern Territory The Northern Territory has repealed mandatory helmet laws for adult cyclists riding on paths and it’s worth noting the impact on participation and injuries. 2011 Census data show 3.2% of the Northern Territory population cycled to work, compared with the 1.3% average among all Australian jurisdictions. NCP data show 25.6% of the Northern Territory population cycled at least once a week in 2017, compared to the national average of 15.5%. In 2017, an estimated 33.6% of Territorians rode a bike at least once a month, compared to the national average of 21.8%. The Australian Bicycle Council chart below was published in 2004.

Making bike riding easy for everyone
Level 4, 246 Bourke Street Melbourne VIC 3000
234 Crown Street Darlinghurst NSW 2010
210 Collins Street Hobart TAS 7000
Suite 5, 18-20 Cavenagh Street Darwin NT 0800
Freecall: 1800 639 634 bicyclenetwork.com.au
The injury ratio chart below was published in 2008 on behalf of the NSW Premier’s Council for Active Living.
Long-term harm Helmet law alarm bells first rang in 1995 when Main Roads WA surveys of Perth river bridge cycling suggested a 30-40% decline after 1992 helmet law enforcement. Comparing pre-law October 1991 with post-law October 1992 on the two bridges, participation dropped 37% overall and 57% on Sundays. For example, the Main Roads WA bridge chart below suggests an average 10% per annum growth in Perth cycling before helmet law enforcement and an immediate 30% decline.

Making bike riding easy for everyone
Level 4, 246 Bourke Street Melbourne VIC 3000
234 Crown Street Darlinghurst NSW 2010
210 Collins Street Hobart TAS 7000
Suite 5, 18-20 Cavenagh Street Darwin NT 0800
Freecall: 1800 639 634 bicyclenetwork.com.au
WA hospital admission data showed no reduction in cyclist injuries. It appeared that accident/injury risk per cyclist had worsened and the evidence supporting this conclusion has monotonously increased in the 20 years since.
Cyclist injuries With consistent survey results showing a participation decline, along with a notable absence of kids cycling to school and a scarcity of bike riders in casual clothing across suburbia, have cyclist injuries declined? Fewer cyclists should mean fewer injuries, particularly if a majority of riders are wearing protective helmets said to reduce head injury risk.
Federal Office of Road Safety data show 7,520 injured cyclists were admitted to hospitals across Australia in mostly pre-law 1990. Australian Institute of Health and Welfare data show there were 10,098 cyclist hospital admissions in 2012/13, a 34.3% increase since 1990. AIHW research shows the average annual number of cyclists seriously injured in road vehicle traffic crashes nationally increased 53.9% from 605 to 931 between 2001-2005 and 2006-2010. In Victoria, child cycling overall was estimated to have fallen by 33% and 36% in the first and second years of the helmet law. However, child cycling injuries in Victoria fell by only 22% and 25% respectively, suggesting that the risk of injury increased by 16-17%. From 2007 to 2015, the rate of serious road traffic injuries to cyclists in Victoria increased 8% per annum, with no change for motor vehicle occupants, motorcyclists or pedestrians. The number of serious cyclist injuries more than doubled over the nine years despite NCP surveys showing weekly cycling in Victoria dropped from 19.9% in 2011 to 16.7% in 2017. During pre-law 1988-1991, Western Australia had an annual average 665 cyclist injury hospital admissions, which included an annual average 177 head injuries, or 26.6% of the total. WA had an annual average 1,209 cyclist injury hospital admissions from 2013 to 2016, which included an annual average 353 head injuries, or 29.2% of the total.

Making bike riding easy for everyone
Level 4, 246 Bourke Street Melbourne VIC 3000
234 Crown Street Darlinghurst NSW 2010
210 Collins Street Hobart TAS 7000
Suite 5, 18-20 Cavenagh Street Darwin NT 0800
Freecall: 1800 639 634 bicyclenetwork.com.au
How does the head injury proportion increase in a helmet law environment if helmets are said to decrease head injury by 60-70%? Various WA data sources suggest that between 1985 and 2017, the state had a 12.6% increase in daily participation among cyclists aged 9+ despite an 82.7% population increase, with an 81.8% increase in total cyclist injuries and a 99.4% increase in head injuries averaged between 1988-1991 and 2013-2016. Despite these figures suggesting a proportionate increase in head injuries, helmet law sceptics generally agree there was a small decrease in the proportion of head injuries nationally since the early 1990s. However, there was a significant increase in total injuries resulting in a greater actual number of head injuries. For example, the WA hospital admission data show an average 665 injuries in 1988-1991 and 1,209 in 2013-2016, despite the different surveys suggesting a probable decline and at best a small increase in cyclists on WA roads. The chart below from Road Safety Report RR131 published in 2003 shows the WA cyclist hospital admission response to 1992 helmet law enforcement.

Making bike riding easy for everyone
Level 4, 246 Bourke Street Melbourne VIC 3000
234 Crown Street Darlinghurst NSW 2010
210 Collins Street Hobart TAS 7000
Suite 5, 18-20 Cavenagh Street Darwin NT 0800
Freecall: 1800 639 634 bicyclenetwork.com.au
The chart below from RR131 shows how the increased injuries were distributed after 1992. There was no reduction in WA cyclist head injuries but a sharp rise in upper limb fractures, typical of why total injuries increase in mandatory helmet jurisdictions.
WA Health Department data show 64 cyclist skull fractures and 423 intracranial injuries in 1990-1992, compared to 44 skull fractures and 403 intracranial injuries in 1993-1995. That's an average 14 less hospitalised head injuries per year from a total bike ownership of more than 750,000 West Australians, and with surveys showing tens of thousands of people giving up cycling after the law was enforced. In 2017, the State Major Trauma Centre at Royal Perth Hospital repeated its long-standing claim that about 20% of cyclists admitted each year had not been wearing a helmet at the time of their accident. More than 30% of cyclists in WA ride bare head so the proportion of cyclists not wearing helmets who are admitted to the hospital is smaller than the proportion of cyclists not wearing helmets on WA roads. In 2017, newspaper reports expressed alarm that an increasing number of WA cyclists aren't wearing helmets, yet Health Department data show a 14.4% decrease in hospitalised cyclist head injuries from 2013 to 2016.

Making bike riding easy for everyone
Level 4, 246 Bourke Street Melbourne VIC 3000
234 Crown Street Darlinghurst NSW 2010
210 Collins Street Hobart TAS 7000
Suite 5, 18-20 Cavenagh Street Darwin NT 0800
Freecall: 1800 639 634 bicyclenetwork.com.au
These results suggest fewer cyclists wearing helmets results in fewer cyclists in hospital and fewer suffering head injuries. If the duration of hospital stay is used as a gauge of injury severity, it’s notable that Royal Perth Hospital cyclist admissions longer than 24 hours increased 37.7% from 146 in 2012 to 201 in 2016. However, the number of these patients who weren’t wearing a helmet dropped from 33 in 2012 to 32 in 2016.
Life saving claims
Plenty of Bicycle Network members will argue that their helmets have saved their lives on at least one occasion. These claims are made repeatedly by mandatory advocates but essentially reinforce evidence that helmeted cyclists have a disproportionate number of crashes and head impacts compared to bare head cyclists. For example, WA’s average annual cyclist death toll dropped from seven in the decade prior to 1992 helmet law enforcement to five in the following decade. This suggests that most of the life-saving claims are more perception than reality. WA’s fatality reduction was similar to the participation reduction. The average annual cyclist road fatality rate in Australia from 1980 to 1990 was 88 and from 1992 to 2002 it was 45 - a reduction of 49%. Over the same timeframes, annual average motorcyclist road fatalities fell from 382 to 195, also down 49%. The annual average road fatality rate for pedestrians fell by 40% (541 to 324). Vehicle passenger fatalities fell by an average 39% (768 to 470) and vehicle driver fatalities fell by an average 28% (1127 to 816). In the United Kingdom, where helmets are not mandatory for any age, cyclist deaths fell from 256 in 1990 to 114 in 2003 - a 56% reduction. An AIHW study of serious land transport injuries across Australia in 2005-06 found the percentage of head injuries was 31.2% for pedestrians, 25.1% for car occupants, 10.9% for motorcyclists and 25.7% for cyclists.

Making bike riding easy for everyone
Level 4, 246 Bourke Street Melbourne VIC 3000
234 Crown Street Darlinghurst NSW 2010
210 Collins Street Hobart TAS 7000
Suite 5, 18-20 Cavenagh Street Darwin NT 0800
Freecall: 1800 639 634 bicyclenetwork.com.au
Australian roads have become safer in recent years due to tougher drink driving laws, lower speed limits, road modifications, etc. The chart below shows how these safer roads affected the average annual number of fatalities among different road users from 1991 to 2013.
New Zealand Since enactment in 1994, New Zealand is another country with mandatory all-age bicycle helmets that the rest of the world uses to demonstrate why such laws should not be introduced. The Kiwis enforce their helmet law more rigorously than Australia, claiming a consistent wearing rate around 93%. According to the NZ Transport Ministry, cyclists aged 5+ collectively travelled for an average 39 million hours in 1989/90. In 2011-2014, it was 25 million hours, a 35.9% reduction despite 5+ population growth of 31.0% from 1991 to 2014. In pre-law 1989/90, New Zealand youngsters aged 5-17 cycled from home to school an estimated 14.2 million times. In 2010-2014, the average was 3.2 million times. Walking to school slipped from 35.9 million in 1989/90 to 35.2 million in 2010-2014.

Making bike riding easy for everyone
Level 4, 246 Bourke Street Melbourne VIC 3000
234 Crown Street Darlinghurst NSW 2010
210 Collins Street Hobart TAS 7000
Suite 5, 18-20 Cavenagh Street Darwin NT 0800
Freecall: 1800 639 634 bicyclenetwork.com.au
Otago University data show there were 1,117 pedal cyclists aged 5+ discharged from New Zealand public hospitals in 1991 and 1,383 in 2014, a 23.8% increase. Like Australia, cycling participation down despite population growth, and injury numbers up. The number of 5-17yo bike trips to school in New Zealand has progressively declined each year since 1994, signalling the generational discouragement that threatens to make cycling a future rarity in both countries.
Injury causes There are various reasons for the poor injury results. These include risk compensation among cyclists who feel more confident because of their helmet, safety in numbers, a significant increase in head diameter that could impact a hard surface, rotational brain injury risk from angled impacts, and increased vehicle traffic density because of the many discouraged riders who are driving cars instead of cycling. Australian Transport Safety Bureau and AIHW data show the total number of people seriously injured (hospitalised) in all road accidents across Australia dropped from 1980 (32,054) to its lowest level in 1992 (21,512), the final year of bike helmet enforcement, and has been increasing since (2011/12 – 34,550).
Helmet law consequences Australia's helmet laws were introduced without prior research and because of a Federal threat to Black Spot road funding for the states and territories. The result has been hundreds of thousands and probably well over a million fewer people enjoying what used to be one of the most common ways to go somewhere, have some fun and coincidentally get a lot of regular exercise. The public health consequences are profound as Australia tackles its worsening obesity crisis, while injuries per cyclist have increased substantially. More than two thirds of Australians don’t get enough exercise, with children needing just an hour and adults 30 minutes per day to reduce their risk of heart disease, cancer, depression and type 2 diabetes.

Making bike riding easy for everyone
Level 4, 246 Bourke Street Melbourne VIC 3000
234 Crown Street Darlinghurst NSW 2010
210 Collins Street Hobart TAS 7000
Suite 5, 18-20 Cavenagh Street Darwin NT 0800
Freecall: 1800 639 634 bicyclenetwork.com.au
Some of the 242,228 fewer people cycling weekly since 2011 (628,309 based only on 2016 population) have undoubtedly found alternative forms of exercise, as suggested by the academics. However, many more are instead watching TV and most are driving their cars, increasing traffic density and accident risk to all road users including other motorists, pedestrians and cyclists. Their cars are trapped in freeway traffic jams, spewing CO2 as Australia argues about climate change, transport infrastructure, worsening obesity rates, a sugar tax, etc. Helmet law repeal would cost nothing but is never discussed when considering solutions to these problems.
Infrastructure Pro law arguments continue to dismiss helmets as the cause of the cycling decline and instead insist it's due to a lack of bike path infrastructure. From 2010 to 2014, state governments spent $412 million to build hundreds of kilometres of new cycle paths across Australia each year, and the infrastructure spending has since accelerated. The result? Hundreds of thousands fewer Australians cycling weekly from 2011 to 2017 and well over a million fewer hopping on a bike at least once during the year (based on 2016 population percentages). Where is the evidence that lack of infrastructure is discouraging cycling or, in light of the NCP survey findings, that more cycle paths haven't actually discouraged cycling since 2010?
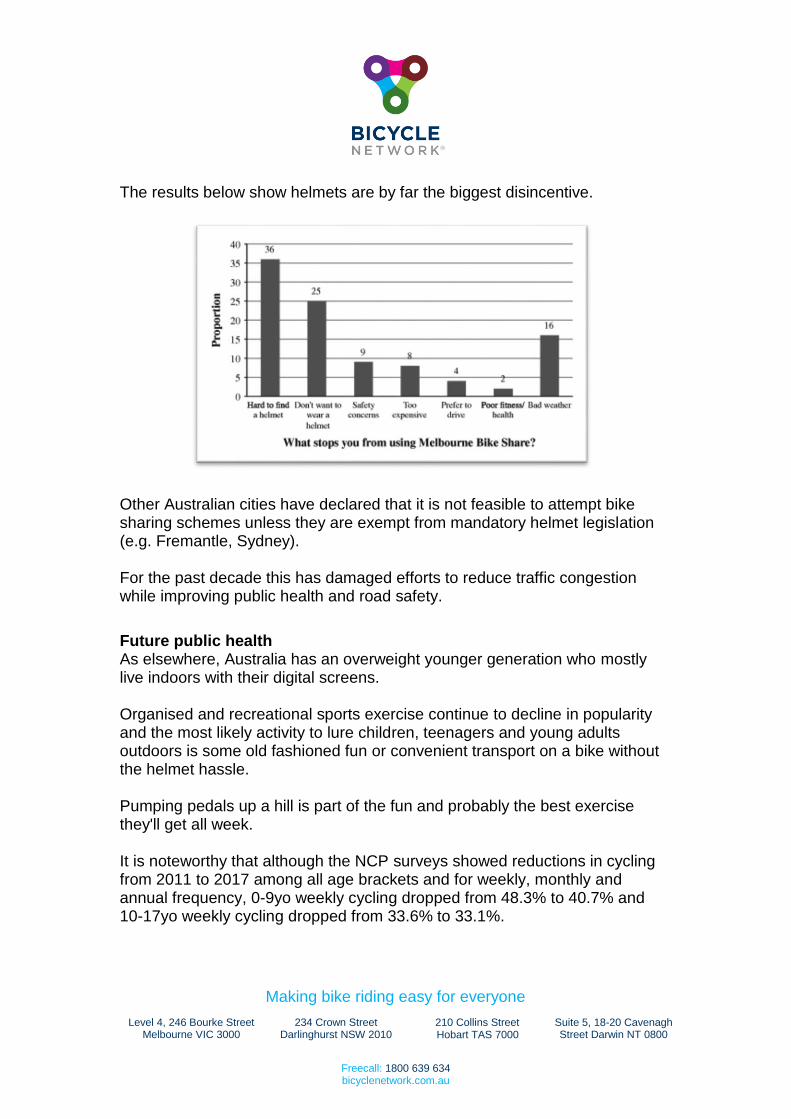
Bike share Despite numerous web polls showing 60-70% of respondents want helmet laws repealed, the experts still insist they don't discourage cycling. Attempts to create public bike hire schemes in Brisbane and Melbourne are recognised internationally as failures because of the discouraging requirement that all users wear helmets. A 2012 study used online and on-street surveys six months after the launch of Melbourne’s bike share scheme to determine why usage rates were so low.
Making bike riding easy for everyone
Level 4, 246 Bourke Street Melbourne VIC 3000
234 Crown Street Darlinghurst NSW 2010
210 Collins Street Hobart TAS 7000
Suite 5, 18-20 Cavenagh Street Darwin NT 0800
Freecall: 1800 639 634 bicyclenetwork.com.au
The results below show helmets are by far the biggest disincentive. Other Australian cities have declared that it is not feasible to attempt bike sharing schemes unless they are exempt from mandatory helmet legislation (e.g. Fremantle, Sydney). For the past decade this has damaged efforts to reduce traffic congestion while improving public health and road safety.
Future public health As elsewhere, Australia has an overweight younger generation who mostly live indoors with their digital screens. Organised and recreational sports exercise continue to decline in popularity and the most likely activity to lure children, teenagers and young adults outdoors is some old fashioned fun or convenient transport on a bike without the helmet hassle. Pumping pedals up a hill is part of the fun and probably the best exercise they'll get all week. It is noteworthy that although the NCP surveys showed reductions in cycling from 2011 to 2017 among all age brackets and for weekly, monthly and annual frequency, 0-9yo weekly cycling dropped from 48.3% to 40.7% and 10-17yo weekly cycling dropped from 33.6% to 33.1%.
Making bike riding easy for everyone
Level 4, 246 Bourke Street Melbourne VIC 3000
234 Crown Street Darlinghurst NSW 2010
210 Collins Street Hobart TAS 7000
Suite 5, 18-20 Cavenagh Street Darwin NT 0800
Freecall: 1800 639 634 bicyclenetwork.com.au
By comparison, the CR69 Day-to-Day Travel in Australia 1985-86 report published in 1988 by the Federal Office of Road Safety estimated Australians aged 9-17yo had a total of 1,141,800 bicycle trips per day. The CR69 report estimated Australia's 9-17yo population in 1985 was 2,449,000, suggesting 46.6% cycled every day. I've lived for the past three years in Perth's mid northern suburbs, within two kilometres of half a dozen primary and other schools, and during that time I've seen three children ride a bike in my quiet backstreet. When I spot the occasional cyclist in my low income district, it's invariably an adult and at least 50% don't wear helmets. The data generally suggest they've made the right choice and should be rewarded rather than punished for getting some exercise while lowering their accident/injury risk.
Bicycle Network helmet law policy Media silence since 1992 has contributed to a public misunderstanding of the detrimental public health and road safety impact of mandatory helmets. It's likely there will be ongoing media and political opposition to any repeal or softening of the laws. It would be politically expedient for the Bicycle Network to find a compromise such as support for either adult repeal only or repeal for adults in certain areas or road speeds. Compromises such as helmets on roads and voluntary elsewhere would make it difficult to be consistently legal over distance and would do little to encourage a cycling recovery. Helmet law repeal for adults only would be more likely to attract political support. However and although parental concern for child safety is understandable, it would simply maintain the generational participation decline and condemn an unknown number of kids to future weight and health problems caused by inadequate exercise during their formative years.
Making bike riding easy for everyone
Level 4, 246 Bourke Street Melbourne VIC 3000
234 Crown Street Darlinghurst NSW 2010
210 Collins Street Hobart TAS 7000
Suite 5, 18-20 Cavenagh Street Darwin NT 0800
Freecall: 1800 639 634 bicyclenetwork.com.au
Another alternative might be for the Bicycle Network to lobby for a repeal of helmet laws trialled over several years to allow enough time for participation and injury trends to be adequately measured. Again, an adult only repeal trial would be more palatable for helmet law advocates, as long as the long-term generational decline in healthy cycling participation is considered acceptable. The number of Australian children walking or cycling to school has fallen from about 80% in 1977 to current levels around 5%. Studies suggested reductions of about 45% in cycling by Melbourne teenagers in the two years following Victoria’s 1990 helmet law introduction. In WA, the government agency Bikewest estimated that the number of children cycling to school more than halved between 1991 (when the helmet law was enacted) and 1996.
Legislative failure Mandatory bicycle helmet laws are one of Australia's worst public policy failures. Over the past 25 years, almost all other jurisdictions in the world have noticed and have not repeated our mistake. Several have enacted and then repealed adult helmet laws after recognising their failure (Israel, Mexico City, Dallas, Bosnia and Herzegovina). Australia is cited globally as the reason why helmet laws should not be introduced (e.g. Portugal in 2017). It has been argued since 1990-92 that the loss of an individual liberty is justified by the reduced risk of cyclist head injuries. Twenty five years of evidence suggests the liberty sacrifice has resulted in increased crash/injury risk, reduced public health, increased vehicle traffic density and more cyclist head injuries. The Bicycle Network should recognise that Australia's helmet laws are increasing the accident and injury risk for cyclists, at the same time discouraging participation with significant negative consequences for national public health.

Making bike riding easy for everyone
Level 4, 246 Bourke Street Melbourne VIC 3000
234 Crown Street Darlinghurst NSW 2010
210 Collins Street Hobart TAS 7000
Suite 5, 18-20 Cavenagh Street Darwin NT 0800
Freecall: 1800 639 634 bicyclenetwork.com.au
The ratio of life years gained versus life years lost from cycling is estimated at 20 to 1. Unlike other forms of exercise such as gymnasiums (to which people can cycle or drive), the enjoyment and frequency of bike riding for all ages and both genders make it a key pathway to better health in modern, sedentary societies where most regular tasks have been automated. Many people consider bike riding to be leisurely fun and/or a free way to travel somewhere a bit quicker, and exercise is a coincidental health benefit which isn’t their motivation. How many recreation activities remain in our digital world that can attract huge numbers of both genders with improved health as a by-product? And why do we punish people who want to enjoy it in a way that cannot in any way harm others?
Time for repeal If the helmet law was repealed, Bicycle Network members would be free to continue wearing a helmet and would probably enjoy sharing the roads and paths with many more cyclists who won't be driving a car. In light of the injury data and to counter a long-standing argument of helmet law supporters, Medicare taxes will continue to pay for the hospital treatment of helmeted cyclists who tend to take more risks. If helmet laws are repealed, network members and their children are more likely to enjoy the health benefits of riding bikes in an otherwise online world, and do so in a safer and more enjoyable cycling environment. The Bicycle Network should question why, as an organisation that aims to encourage people to ride a bike, it supports a law that punishes people who ride a bike. Like the NCP 2011-2016 Strategy, the network’s 2022 Strategy to build a nation of bike riders is doomed while the helmet obstacle remains. It has been clear for decades that Australian cycling is in decline, despite authorities claiming there's no evidence that helmets discourage participation. The researchers behind Australia’s National Cycling Participation strategy predict that the decline will continue.

Making bike riding easy for everyone
Level 4, 246 Bourke Street Melbourne VIC 3000
234 Crown Street Darlinghurst NSW 2010
210 Collins Street Hobart TAS 7000
Suite 5, 18-20 Cavenagh Street Darwin NT 0800
Freecall: 1800 639 634 bicyclenetwork.com.au
Helmet law discouragement of cycling was evident in the early 1990s but a more damaging long-term influence on participation has been masked by large numbers of baby boomer inflating cyclist survey results. They have been partly motivated by soaring petrol prices (1990 – 68c / 2017 – $1.26 p/l). Although every extra bike path is welcomed, more cycling infrastructure has so far not been a solution. The precision of all this data showing a per capita cycling decline will inevitably be argued, but the weight of evidence suggests that something has discouraged participation for the past 25 years. As the debate rolls on, tens and probably hundreds of thousands of Australians are today riding bikes without a helmet in defiance of a law with which they disagree. An unknown number would join them if they also were willing to risk being punished or if our states removed the threat of punishment. When the data agrees with what you actually see or don’t see on the streets, and with what the rest of the world has recognised, it’s time to reconsider the assumptions about helmet law success as claimed by the experts. It's time to stop denying that mandatory helmets discourage Australian participation. It’s time to repeal the law and enjoy the benefits of safer cycling, safer roads and a healthier community.
1. Do you provide consent for your opinion to be made public?
Yes
Signed:
Date: 12 October 2017