Bibb County Civic Health Report fileThis report summarizes findings from the Bibb County Civic...
26
Bibb County Civic Health Report 2019
Transcript of Bibb County Civic Health Report fileThis report summarizes findings from the Bibb County Civic...
Bibb County
Civic Health Report 2019
1
Introduction Civic health is a measure of the ways that people interact with their friends and families, with their larger communities, with political processes, and with institutions. Overall, stronger measures of civic health are correlated with better public health outcomes, lower crime rates, and stronger economic resiliency and workforce development. Essentially, communities where more people are engaged and participating with each other and with civic life do better than communities where fewer people participate. In 2013, Georgia Family Connection Partnership (GaFCP) helped publish the first-ever Georgia Civic Health Index (CHI), and it found many measures of civic health Georgia’s numbers lagged national averages. After publication of the report several Family Connection Collaboratives, including Bibb County, requested county-level reports. The dataset that generated the Georgia CHI, however, was too small to produce county estimates and in response to this limitation Bibb County began local data collection using the same survey instrument used to generate the state report, with the addition of a few locally-developed questions. The survey instrument (included in Appendix A) was administered through a random digit dialing method by A.L. Burruss Institute of Public Service and Research at Kennesaw State University between 7/18/18 and 8/20/18 and resulted in 402 respondents. These represent approximately 0.26 percent of the population of Bibb County and constitute a statistically viable dataset. The Civic Health survey contains questions to measure four domains:
• Social Connectedness – interaction with friends, family, and neighbors;
• Community Involvement – the ways in which people interact with residents and groups in their community;
• Political Action – voter registration and turnout, contacting elected officials, and expressing political opinions; and
• Confidence in Institutions – the degree to which residents believe that various institutions, including public schools, media and corporations will do what is right.
This report summarizes findings from the Bibb County Civic Health survey and provides comparisons to state and national findings as available.1 This summary is intended to inform stakeholders in Bibb County and assist with engagement efforts with populations and places that are disengaged, as well as to build on strengths revealed by the data.
Description of Respondents
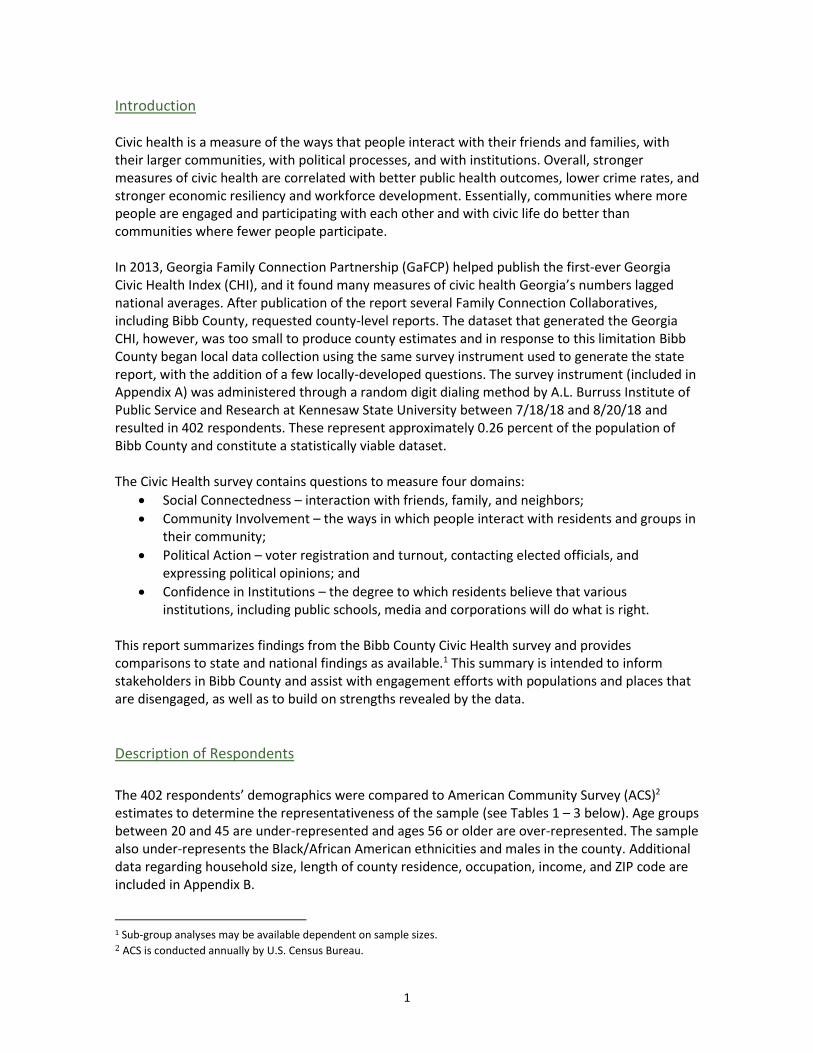
The 402 respondents’ demographics were compared to American Community Survey (ACS)2 estimates to determine the representativeness of the sample (see Tables 1 – 3 below). Age groups between 20 and 45 are under-represented and ages 56 or older are over-represented. The sample also under-represents the Black/African American ethnicities and males in the county. Additional data regarding household size, length of county residence, occupation, income, and ZIP code are included in Appendix B.
1 Sub-group analyses may be available dependent on sample sizes. 2 ACS is conducted annually by U.S. Census Bureau.
2
Table 1: Age Distribution of Respondents Compared to ACS
Age Respondents ACS Estimates
15-19 8 (2.1%) 8.8% ± 0.4%
20-25 24 (6.3%) 9.5% ± 0.5%
26-35 26 (6.8%) 16.9% ± 0.8%
36-45 30 (7.8%) 11.8% ± 0.7%
46-55 58 (15.1%) 16.1% ± 0.8%
56 or older 237 (61.9%) 33.8% ± 1.7%
Total 383 (100%)
Table 2: Race/Ethnicity Distribution of Respondents Compared to ACS
Race/Ethnicity Respondents ACS Estimates
Hispanic or Latino 3 (0.8%) 3.1% ± 0.2%
Native American or Alaskan Native
7 (1.9%) 0.1% ± 0.0%
Native Hawaiian or Pacific Islander
0 0.0% ± 0.0%
Asian 2 (0.5%) 1.8% ± 0.1%
Black or African American 173 (45.8%) 53.6% ± 2.7%
White 190 (50.3%) 39.9% ± 2.0%
Two or more races 3 (0.8%) 1.4% ± 0.1%
Total 378 (100%)
Table 3: Gender Distribution of Respondents Compared to ACS
Gender Respondents ACS Estimates
Male 153 (38.3%) 47.2% ± 2.4%
Female 244 (61.2%) 52.8% ± 2.6%
Total 399 (100%)
3
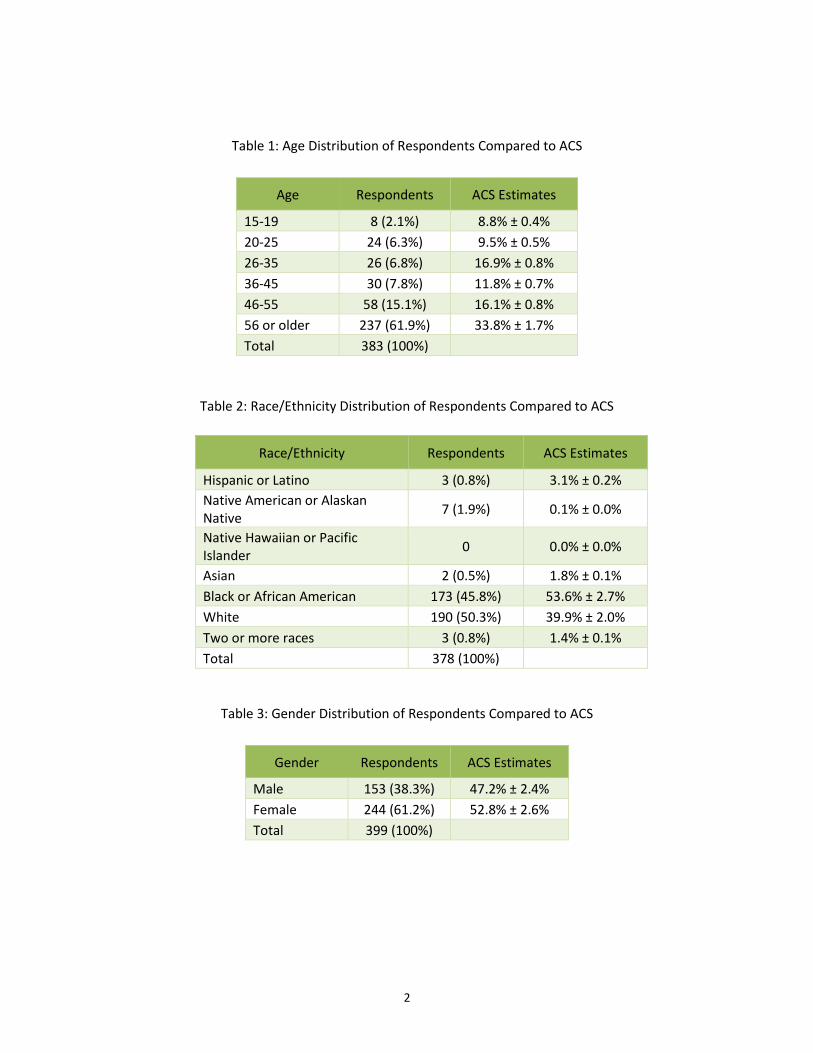
Social Connectedness When compared to all Georgia residents, Bibb County respondents reported higher levels of social connectedness and trust with family and neighbors on several indicators (see Figure 1 and Table 4).
• Across the state 81.1% of Georgians reported “seeing or hearing from family” frequently, compared to 91.3% of Bibb County residents.
• Only 24.2% of Georgians reported “talking to neighbors” compared to 50.7% in Bibb.
• 20.7% of Bibb County respondents reported they “do favors for neighbors” frequently, compared to only 7.4% of all Georgians.
• 33.8% of Bibb County residents reported they have worked with people from their neighborhood to fix a problem or improve a condition in their community or elsewhere.
Figure 1: Distribution of Social Connectedness Indicators
25.9%
68.3%
73.4%
55.9%
18.8%
9.3%
27.3%
14.4%
57.4%
46.8%
30.7%
19.0%
17.9%
22.1%
31.9%
11.4%
28.4%
16.5%
17.5%
20.5%
21.7%
6.6%
5.5%
6.6%
24.3%
23.4%
17.6%
17.9%
11.3%
13.7%
11.0%
3.4%
14.2%
15.2%
9.7%
12.0%
5.2%
5.5%
10.7%
12.1%
10.8%
40.7%
17.0%
39.2%
8.6%
13.7%
0% 10% 20% 30% 40% 50% 60% 70% 80% 90% 100%
Discuss politics
Eat dinner with family
See or hear from family
Email family
Talk to neighbors
Do favors for neighbors
Read newspaper
Read news magazine
Watch news on TV
Get news from internet
Basically everyday A few times a week A few times a month Once a month Not at all
4
Table 4: Trust People in Your Neighborhood
Frequency Respondents
All of the time 32.1%
Often 26.6%
Sometimes 19.6%
Rarely 12.0%
Never 9.7%
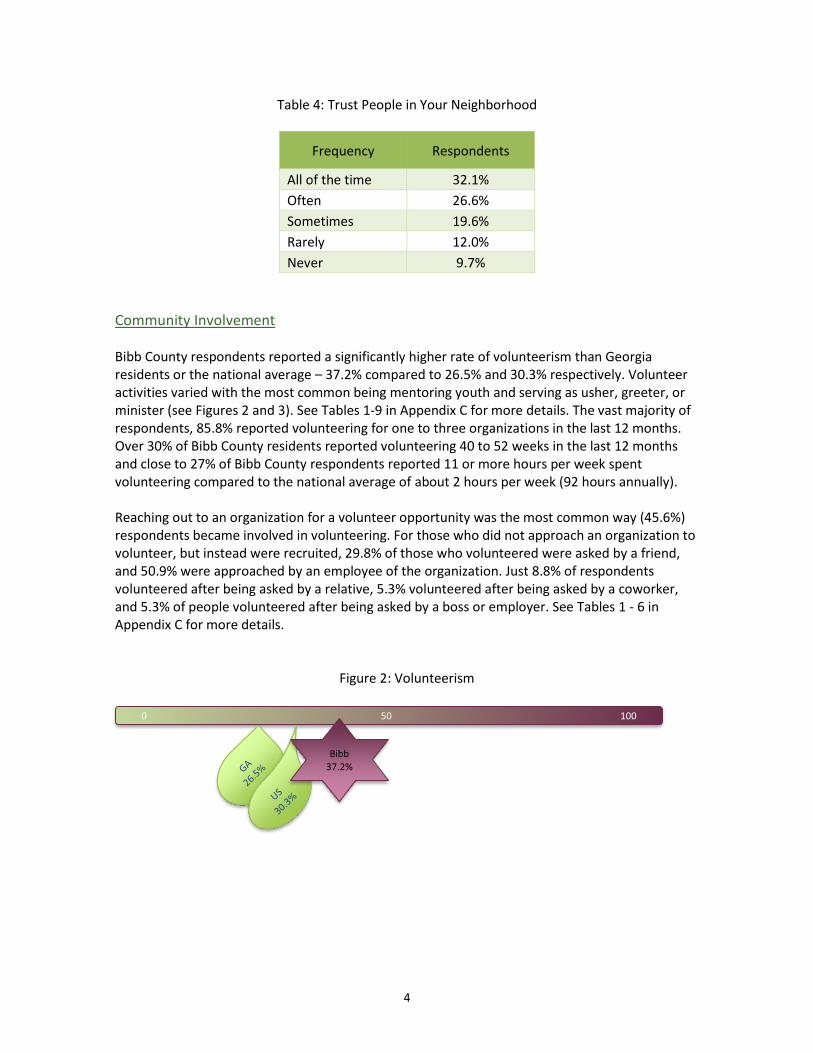
Community Involvement Bibb County respondents reported a significantly higher rate of volunteerism than Georgia residents or the national average – 37.2% compared to 26.5% and 30.3% respectively. Volunteer activities varied with the most common being mentoring youth and serving as usher, greeter, or minister (see Figures 2 and 3). See Tables 1-9 in Appendix C for more details. The vast majority of respondents, 85.8% reported volunteering for one to three organizations in the last 12 months. Over 30% of Bibb County residents reported volunteering 40 to 52 weeks in the last 12 months and close to 27% of Bibb County respondents reported 11 or more hours per week spent volunteering compared to the national average of about 2 hours per week (92 hours annually). Reaching out to an organization for a volunteer opportunity was the most common way (45.6%) respondents became involved in volunteering. For those who did not approach an organization to volunteer, but instead were recruited, 29.8% of those who volunteered were asked by a friend, and 50.9% were approached by an employee of the organization. Just 8.8% of respondents volunteered after being asked by a relative, 5.3% volunteered after being asked by a coworker, and 5.3% of people volunteered after being asked by a boss or employer. See Tables 1 - 6 in Appendix C for more details.
Figure 2: Volunteerism
0 50 100
Bibb 37.2%
5
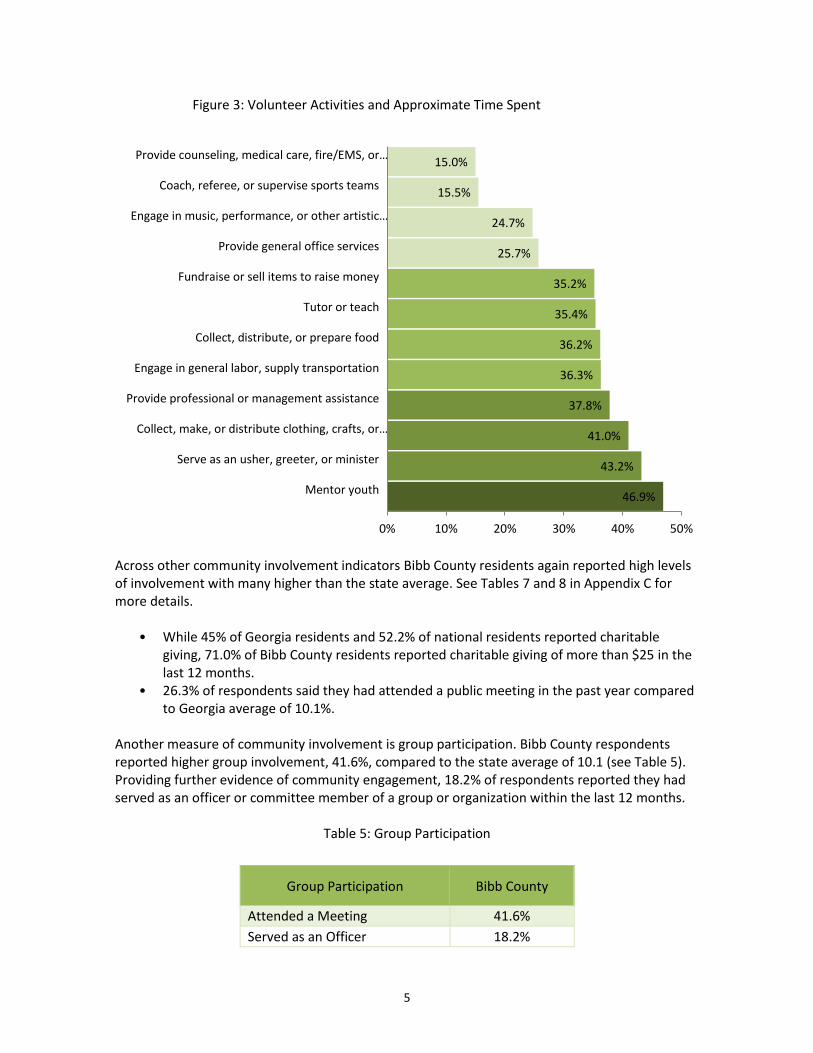
Figure 3: Volunteer Activities and Approximate Time Spent
Across other community involvement indicators Bibb County residents again reported high levels of involvement with many higher than the state average. See Tables 7 and 8 in Appendix C for more details.
• While 45% of Georgia residents and 52.2% of national residents reported charitable giving, 71.0% of Bibb County residents reported charitable giving of more than $25 in the last 12 months.
• 26.3% of respondents said they had attended a public meeting in the past year compared to Georgia average of 10.1%.
Another measure of community involvement is group participation. Bibb County respondents reported higher group involvement, 41.6%, compared to the state average of 10.1 (see Table 5). Providing further evidence of community engagement, 18.2% of respondents reported they had served as an officer or committee member of a group or organization within the last 12 months.
Table 5: Group Participation
Group Participation Bibb County
Attended a Meeting 41.6%
Served as an Officer 18.2%
46.9%
43.2%
41.0%
37.8%
36.3%
36.2%
35.4%
35.2%
25.7%
24.7%
15.5%
15.0%
0% 10% 20% 30% 40% 50%
Mentor youth
Serve as an usher, greeter, or minister
Collect, make, or distribute clothing, crafts, or…
Provide professional or management assistance
Engage in general labor, supply transportation
Collect, distribute, or prepare food
Tutor or teach
Fundraise or sell items to raise money
Provide general office services
Engage in music, performance, or other artistic…
Coach, referee, or supervise sports teams
Provide counseling, medical care, fire/EMS, or…
6
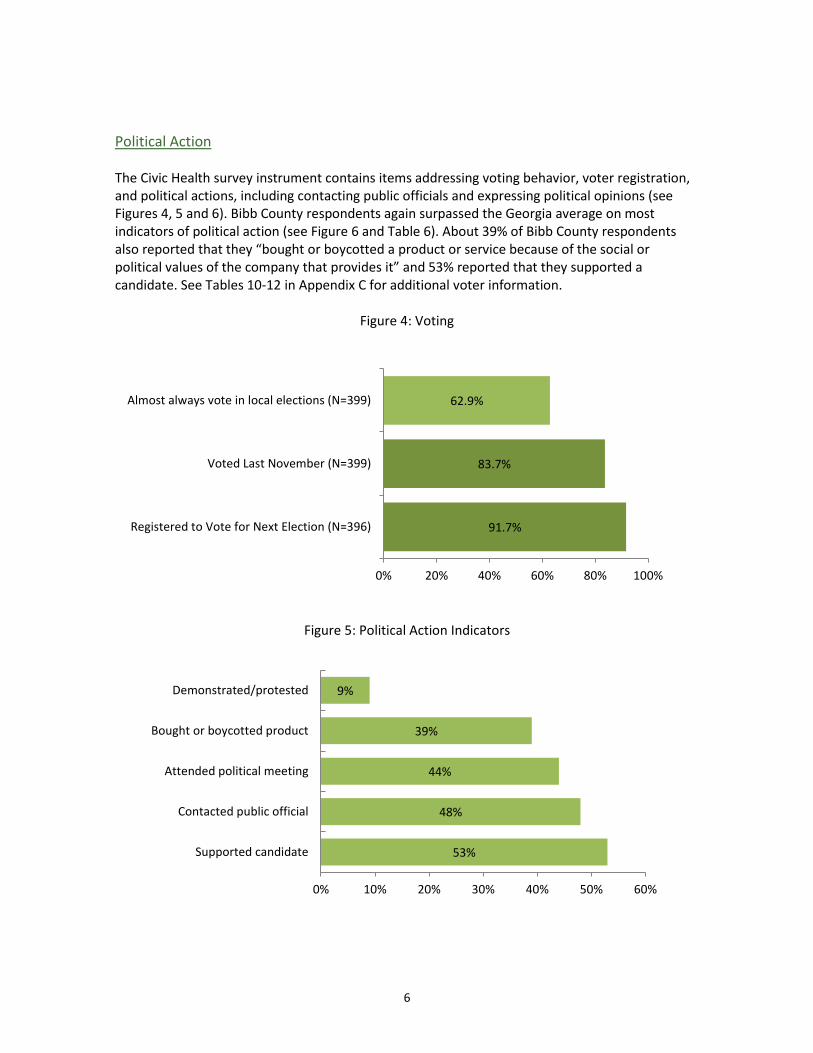
Political Action The Civic Health survey instrument contains items addressing voting behavior, voter registration, and political actions, including contacting public officials and expressing political opinions (see Figures 4, 5 and 6). Bibb County respondents again surpassed the Georgia average on most indicators of political action (see Figure 6 and Table 6). About 39% of Bibb County respondents also reported that they “bought or boycotted a product or service because of the social or political values of the company that provides it” and 53% reported that they supported a candidate. See Tables 10-12 in Appendix C for additional voter information.
Figure 4: Voting
Figure 5: Political Action Indicators
91.7%
83.7%
62.9%
0% 20% 40% 60% 80% 100%
Registered to Vote for Next Election (N=396)
Voted Last November (N=399)
Almost always vote in local elections (N=399)
53%
48%
44%
39%
9%
0% 10% 20% 30% 40% 50% 60%
Supported candidate
Contacted public official
Attended political meeting
Bought or boycotted product
Demonstrated/protested
7
Table 6: Political Action Indicators Compared to GA
Indicator Bibb County GA
Voted in most recent November election 83.7% 60.2%
Vote in local elections (almost always/sometimes)
84.5% 59.3%
Registered to vote 91.7% 69.4%
Contacted public official 48.4% 12.0%
Discuss politics (frequently) 44.0% 32.5%
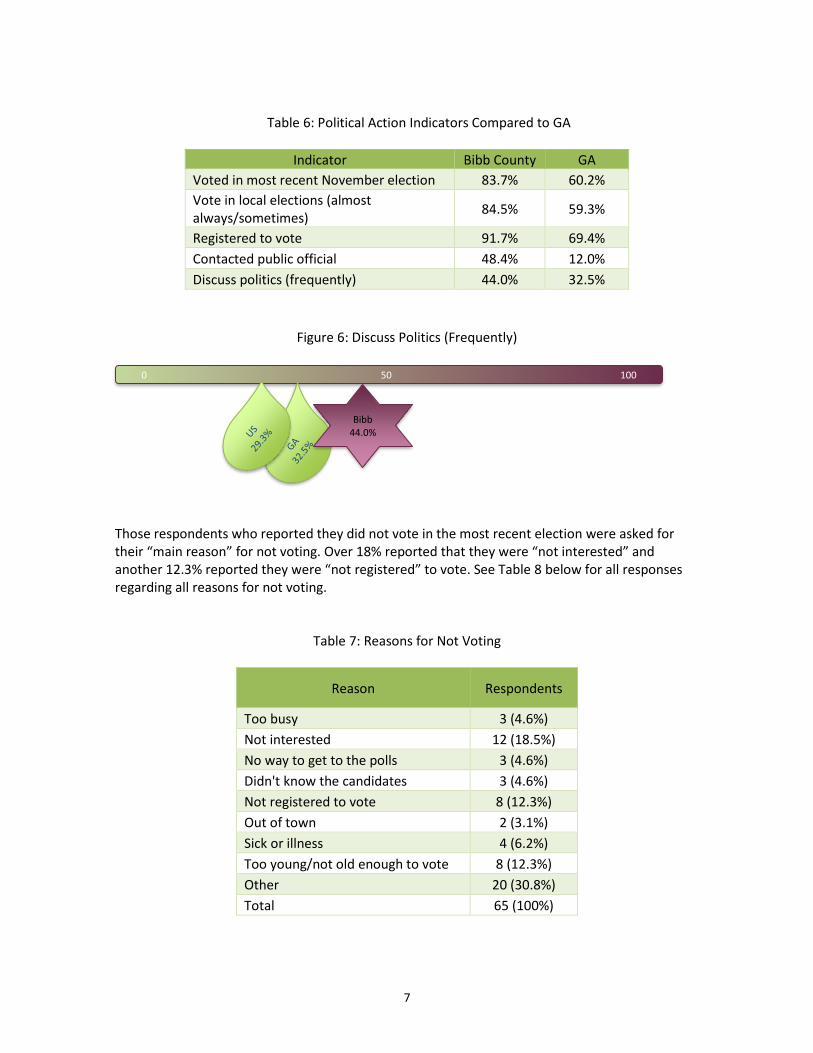
Figure 6: Discuss Politics (Frequently)
Those respondents who reported they did not vote in the most recent election were asked for their “main reason” for not voting. Over 18% reported that they were “not interested” and another 12.3% reported they were “not registered” to vote. See Table 8 below for all responses regarding all reasons for not voting.
Table 7: Reasons for Not Voting
Reason Respondents
Too busy 3 (4.6%)
Not interested 12 (18.5%)
No way to get to the polls 3 (4.6%)
Didn't know the candidates 3 (4.6%)
Not registered to vote 8 (12.3%)
Out of town 2 (3.1%)
Sick or illness 4 (6.2%)
Too young/not old enough to vote 8 (12.3%)
Other 20 (30.8%)
Total 65 (100%)
0 50 100
Bibb 44.0%
8
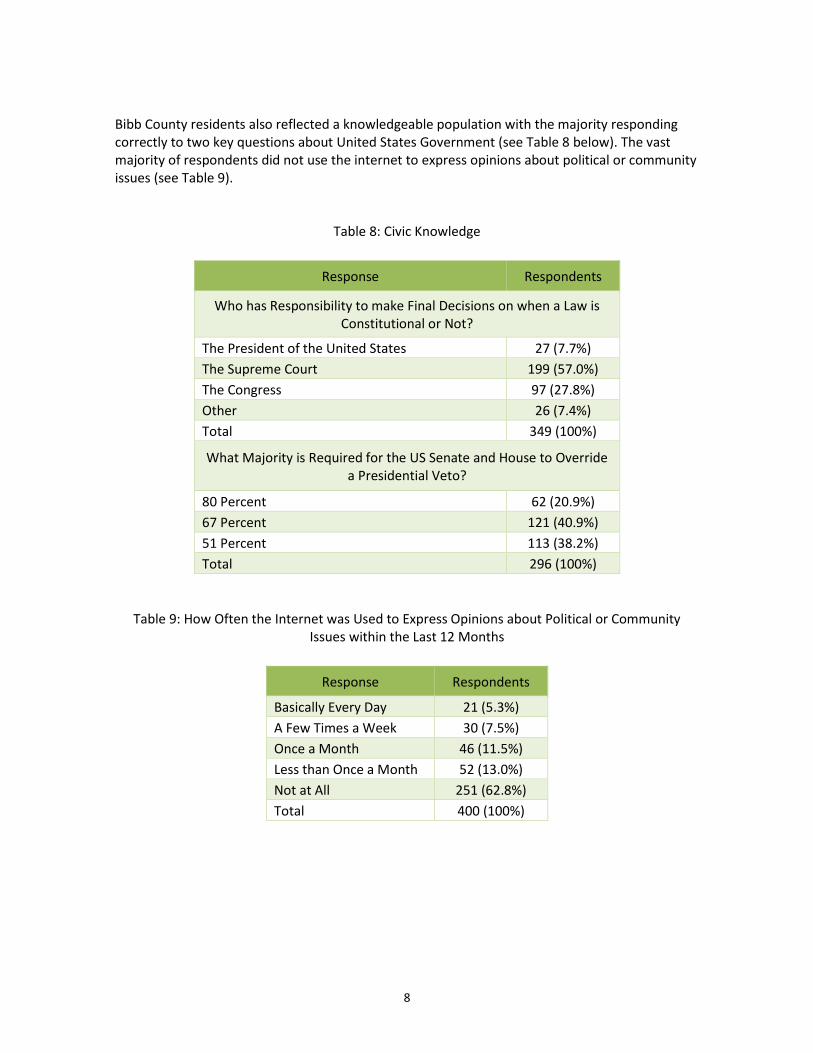
Bibb County residents also reflected a knowledgeable population with the majority responding correctly to two key questions about United States Government (see Table 8 below). The vast majority of respondents did not use the internet to express opinions about political or community issues (see Table 9).
Table 8: Civic Knowledge
Response Respondents
Who has Responsibility to make Final Decisions on when a Law is Constitutional or Not?
The President of the United States 27 (7.7%)
The Supreme Court 199 (57.0%)
The Congress 97 (27.8%)
Other 26 (7.4%)
Total 349 (100%)
What Majority is Required for the US Senate and House to Override a Presidential Veto?
80 Percent 62 (20.9%)
67 Percent 121 (40.9%)
51 Percent 113 (38.2%)
Total 296 (100%)
Table 9: How Often the Internet was Used to Express Opinions about Political or Community Issues within the Last 12 Months
Response Respondents
Basically Every Day 21 (5.3%)
A Few Times a Week 30 (7.5%)
Once a Month 46 (11.5%)
Less than Once a Month 52 (13.0%)
Not at All 251 (62.8%)
Total 400 (100%)
9
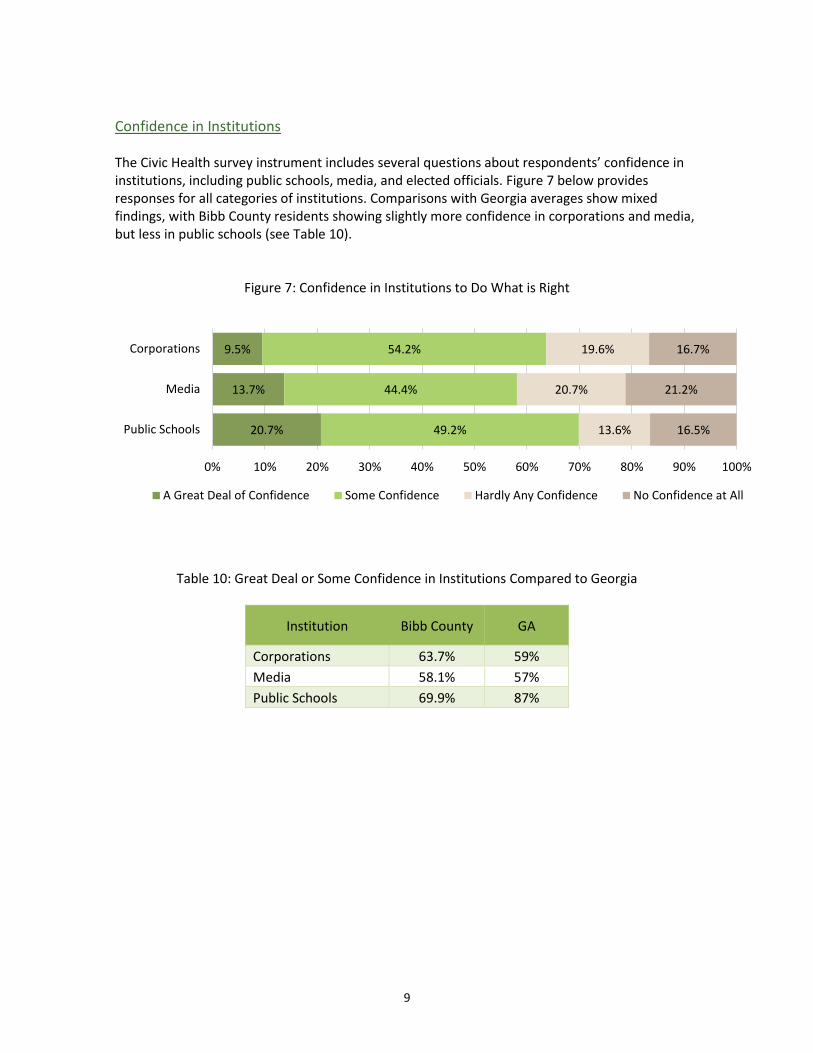
Confidence in Institutions The Civic Health survey instrument includes several questions about respondents’ confidence in institutions, including public schools, media, and elected officials. Figure 7 below provides responses for all categories of institutions. Comparisons with Georgia averages show mixed findings, with Bibb County residents showing slightly more confidence in corporations and media, but less in public schools (see Table 10).
Figure 7: Confidence in Institutions to Do What is Right
Table 10: Great Deal or Some Confidence in Institutions Compared to Georgia
Institution Bibb County GA
Corporations 63.7% 59%
Media 58.1% 57%
Public Schools 69.9% 87%
9.5%
13.7%
20.7%
54.2%
44.4%
49.2%
19.6%
20.7%
13.6%
16.7%
21.2%
16.5%
0% 10% 20% 30% 40% 50% 60% 70% 80% 90% 100%
Corporations
Media
Public Schools
A Great Deal of Confidence Some Confidence Hardly Any Confidence No Confidence at All
10
Summary Across each of the four areas of civic health – social connectedness, community involvement, political action and confidence in institutions – Bibb County residents reported higher involvement compared to the state average. More provided charitable donations, voted in the most recent election, volunteered in their community and were frequently connected with family and friends. Confidence in public schools was the primary key indicator rated lower than the state average. Although higher than state averages in most indicators, there is still room for improvement. Related to political action, only 63% reported they “always” vote in local elections, 48% reached out to an elected official and only 44% reported they frequently discuss politics. There is also room for improvement in community involvement with only 37.2% reporting volunteering in the last 12 months and 41.6% reporting attending a meeting of any group or organization. Overall, Bibb County residents reported strong relationships with family and friends and the vast majority reported having one or more close friends they can call on in times of need. A number of indicators reflect a community engaged in political action and volunteerism, while others show there is room for improvement. This report elucidates the existing strengths of civic engagement in Bibb County and can serve to launch conversations among Bibb County agencies, organizations, and community members on how best to develop specific civic engagement strategies to fit local needs and build stronger communities.
Prepared by: Rebecca Rice, Georgia Family Connection Partnership; Michael Scuello, Metis Associates, and Rebekah Hudgins, AnthroEval Consulting, LLC. For more information on the Civic Health Initiative, go to
gafcp.org or contact Rebecca Rice at [email protected].

11
12
Appendix A
Bibb County Civic Health Questionnaire
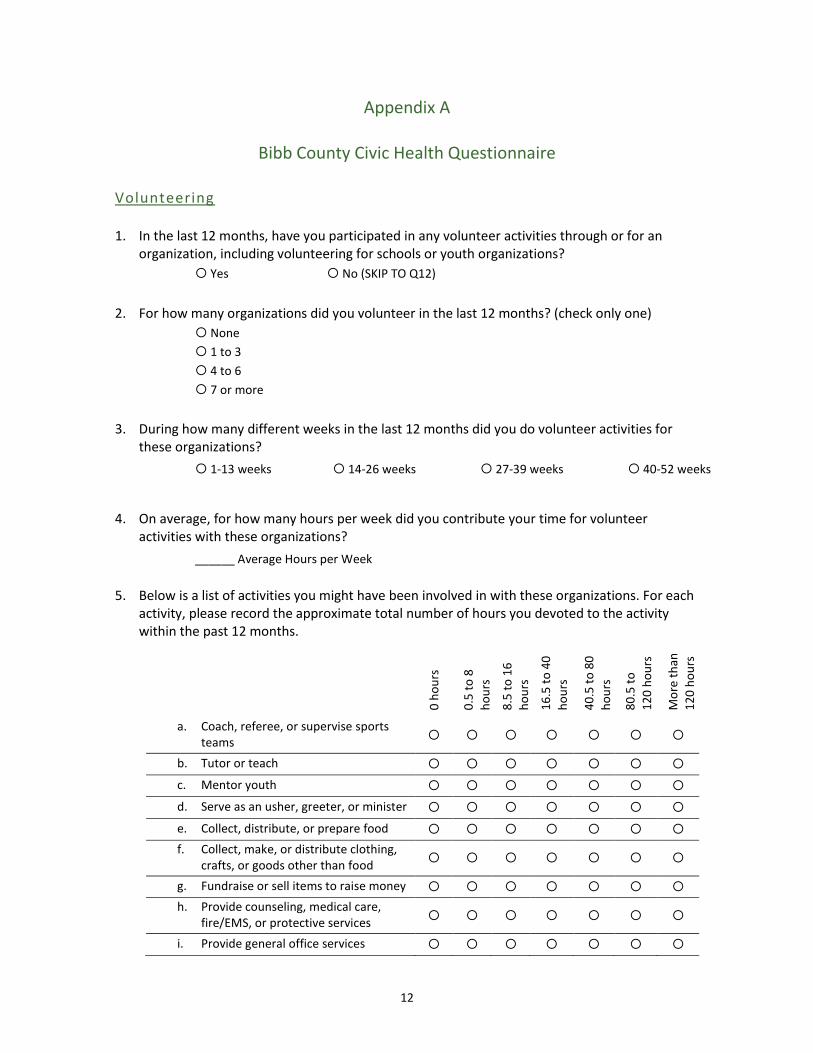
Volunteering 1. In the last 12 months, have you participated in any volunteer activities through or for an
organization, including volunteering for schools or youth organizations?
Yes No (SKIP TO Q12)
2. For how many organizations did you volunteer in the last 12 months? (check only one)
None
1 to 3
4 to 6
7 or more
3. During how many different weeks in the last 12 months did you do volunteer activities for these organizations?
1-13 weeks 14-26 weeks 27-39 weeks 40-52 weeks
4. On average, for how many hours per week did you contribute your time for volunteer activities with these organizations?
______ Average Hours per Week
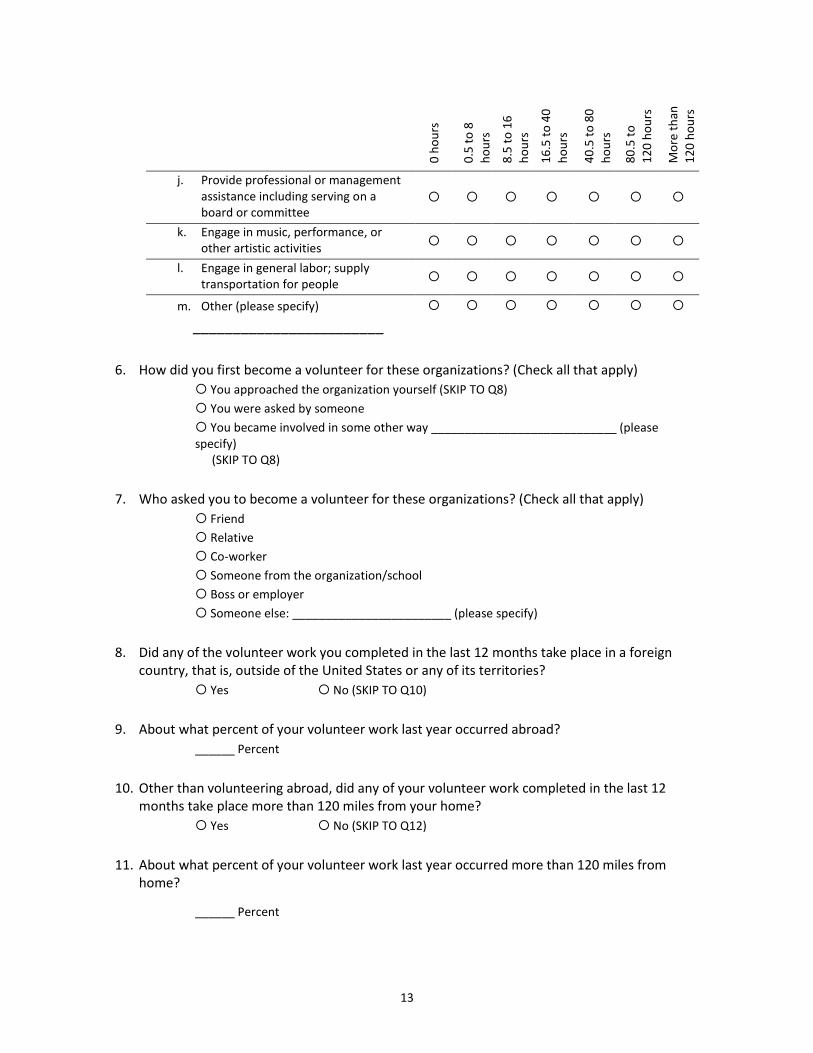
5. Below is a list of activities you might have been involved in with these organizations. For each
activity, please record the approximate total number of hours you devoted to the activity within the past 12 months.
0 h
ou
rs
0.5
to
8
ho
urs
8.5
to
16
ho
urs
16
.5 t
o 4
0
ho
urs
40
.5 t
o 8
0
ho
urs
80
.5 t
o
12
0 h
ou
rs
Mo
re t
han
12
0 h
ou
rs
a. Coach, referee, or supervise sports teams
b. Tutor or teach
c. Mentor youth
d. Serve as an usher, greeter, or minister
e. Collect, distribute, or prepare food
f. Collect, make, or distribute clothing, crafts, or goods other than food
g. Fundraise or sell items to raise money
h. Provide counseling, medical care, fire/EMS, or protective services
i. Provide general office services
13
0 h
ou
rs
0.5
to
8
ho
urs
8.5
to
16
ho
urs
16
.5 t
o 4
0
ho
urs
40
.5 t
o 8
0
ho
urs
80
.5 t
o
12
0 h
ou
rs
Mo
re t
han
12
0 h
ou
rs
j. Provide professional or management assistance including serving on a board or committee
k. Engage in music, performance, or other artistic activities
l. Engage in general labor; supply transportation for people
m. Other (please specify)
________________________
6. How did you first become a volunteer for these organizations? (Check all that apply)
You approached the organization yourself (SKIP TO Q8)
You were asked by someone
You became involved in some other way ____________________________ (please specify)
(SKIP TO Q8)
7. Who asked you to become a volunteer for these organizations? (Check all that apply)
Friend
Relative
Co-worker
Someone from the organization/school
Boss or employer
Someone else: ________________________ (please specify)
8. Did any of the volunteer work you completed in the last 12 months take place in a foreign country, that is, outside of the United States or any of its territories?
Yes No (SKIP TO Q10)
9. About what percent of your volunteer work last year occurred abroad?
______ Percent
10. Other than volunteering abroad, did any of your volunteer work completed in the last 12 months take place more than 120 miles from your home?
Yes No (SKIP TO Q12)
11. About what percent of your volunteer work last year occurred more than 120 miles from home?
______ Percent
14
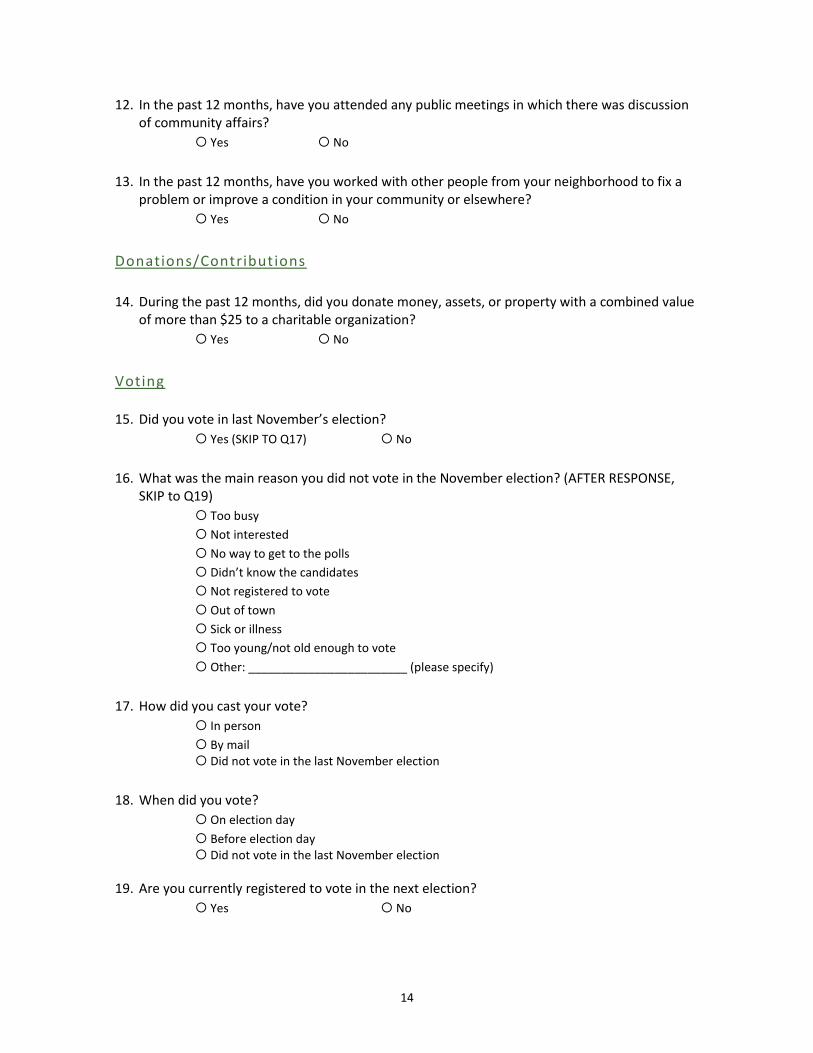
12. In the past 12 months, have you attended any public meetings in which there was discussion of community affairs?
Yes No
13. In the past 12 months, have you worked with other people from your neighborhood to fix a problem or improve a condition in your community or elsewhere?
Yes No
Donations/Contributions
14. During the past 12 months, did you donate money, assets, or property with a combined value of more than $25 to a charitable organization?
Yes No
Voting 15. Did you vote in last November’s election?
Yes (SKIP TO Q17) No
16. What was the main reason you did not vote in the November election? (AFTER RESPONSE, SKIP to Q19)
Too busy
Not interested
No way to get to the polls
Didn’t know the candidates
Not registered to vote
Out of town
Sick or illness
Too young/not old enough to vote
Other: ________________________ (please specify)
17. How did you cast your vote?
In person
By mail Did not vote in the last November election
18. When did you vote?
On election day
Before election day Did not vote in the last November election
19. Are you currently registered to vote in the next election?
Yes No
15
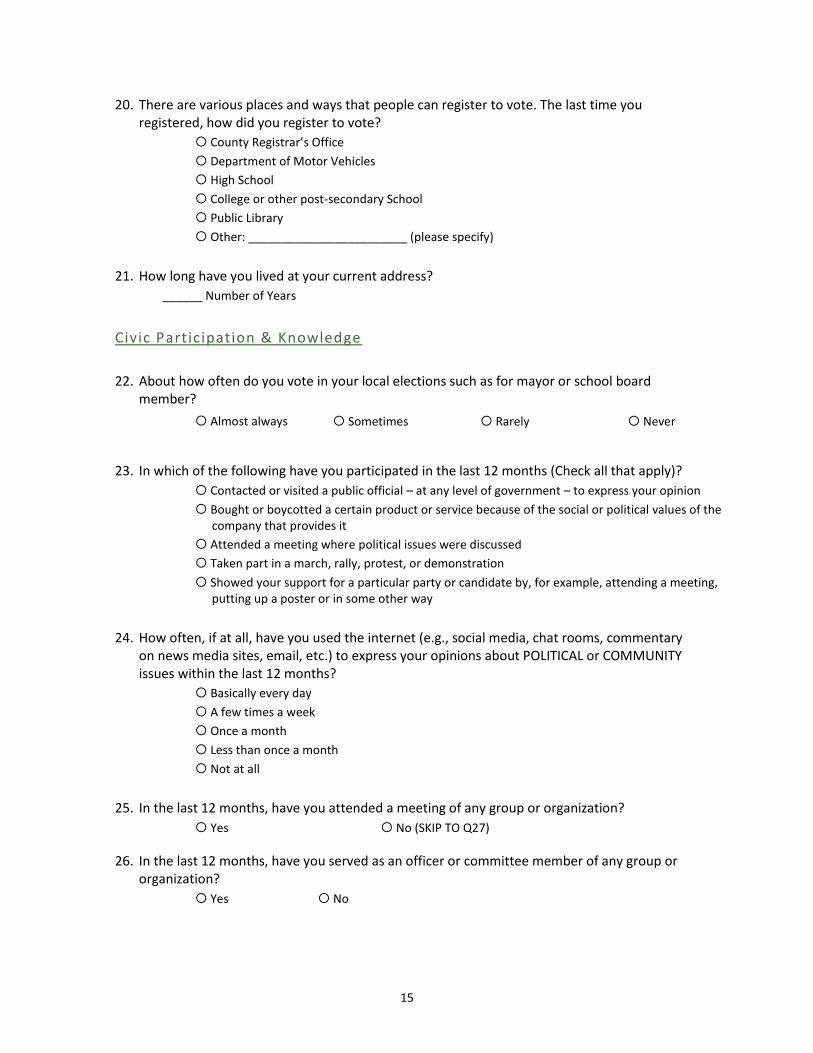
20. There are various places and ways that people can register to vote. The last time you registered, how did you register to vote?
County Registrar’s Office
Department of Motor Vehicles
High School
College or other post-secondary School
Public Library
Other: ________________________ (please specify)
21. How long have you lived at your current address?
______ Number of Years
Civic Participation & Knowledge
22. About how often do you vote in your local elections such as for mayor or school board member?
Almost always Sometimes Rarely Never
23. In which of the following have you participated in the last 12 months (Check all that apply)?
Contacted or visited a public official – at any level of government – to express your opinion
Bought or boycotted a certain product or service because of the social or political values of the company that provides it
Attended a meeting where political issues were discussed
Taken part in a march, rally, protest, or demonstration
Showed your support for a particular party or candidate by, for example, attending a meeting, putting up a poster or in some other way
24. How often, if at all, have you used the internet (e.g., social media, chat rooms, commentary on news media sites, email, etc.) to express your opinions about POLITICAL or COMMUNITY issues within the last 12 months?
Basically every day
A few times a week
Once a month
Less than once a month
Not at all
25. In the last 12 months, have you attended a meeting of any group or organization?
Yes No (SKIP TO Q27)
26. In the last 12 months, have you served as an officer or committee member of any group or organization?
Yes No

16
27. During a TYPICAL MONTH in the past year, about how often did you do each of the following? Check ONE response for each activity.
Basically ever day
A few times
a week
A few times a month
Once a month Not at all
Discuss politics with family or friends Eat dinner with members of your household
See or hear from friends or family Communicate with friends and family by email or on the
Internet
Talk with any of your neighbors Do favors with neighbors, such as watching each other’s
children, helping with shopping, house sitting, lending garden or house tools, and other small acts of kindness
Read a newspaper in print or on the Internet Read news magazines such as Newsweek or Time, in print
or on the Internet
Watch the news on television or get news from television Internet sites
Obtain news from any other Internet sources such as radio, blogs, chat rooms, or independent news services
28. In general, how much do you trust the people in your neighborhood?
All of the time
Often
Sometimes
Rarely
Never
29. How much confidence do you have in each of the following institutions to do what is right? Check ONE response for each institution.
A Great Deal of
Confidence Some
Confidence Hardly Any Confidence
No Confidence at All
Corporations The Media
Public Schools
30. NOT counting family members, about how many CLOSE FRIENDS do you currently have, if any? Close friends are people you feel at ease with, can talk to about private matters, or call on for help?
______ Number of Close Friends
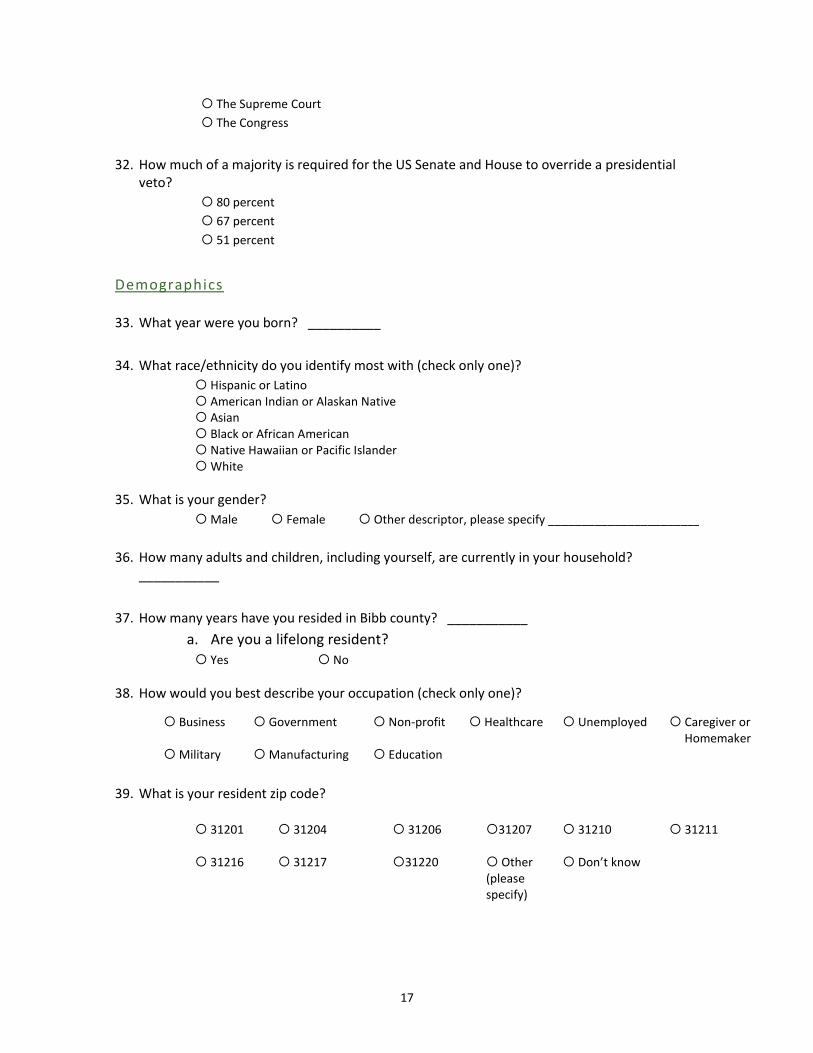
31. What individual or group of individuals has the responsibility to make the final decisions on the when a law is constitutional or not?
The President of the United States
17
The Supreme Court
The Congress
32. How much of a majority is required for the US Senate and House to override a presidential veto?
80 percent
67 percent
51 percent
Demographics 33. What year were you born? __________
34. What race/ethnicity do you identify most with (check only one)?
Hispanic or Latino American Indian or Alaskan Native Asian Black or African American Native Hawaiian or Pacific Islander White
35. What is your gender?
Male Female Other descriptor, please specify _______________________
36. How many adults and children, including yourself, are currently in your household? ___________
37. How many years have you resided in Bibb county? ___________
a. Are you a lifelong resident? Yes No
38. How would you best describe your occupation (check only one)?
Business Military
Government Manufacturing
Non-profit Education
Healthcare Unemployed Caregiver or Homemaker
39. What is your resident zip code?
31201 31216
31204 31217
31206 31220
31207 Other (please specify)
31210 Don’t know
31211
18
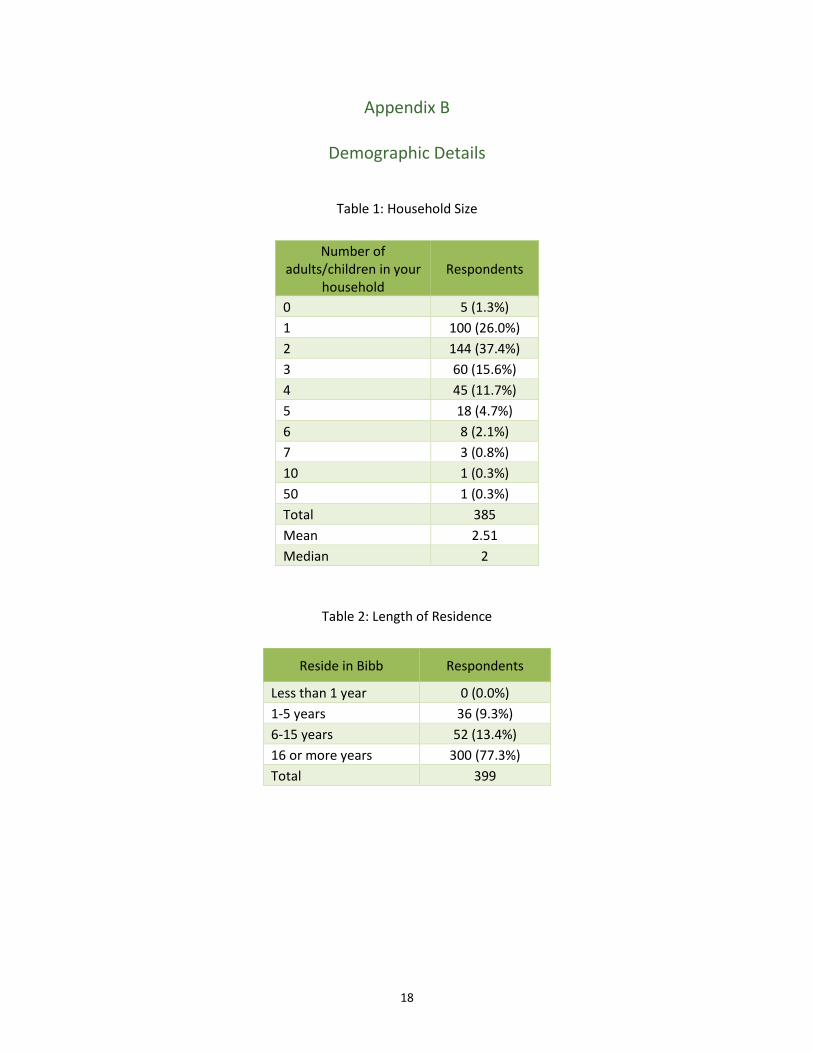
Appendix B
Demographic Details
Table 1: Household Size
Number of adults/children in your
household Respondents
0 5 (1.3%)
1 100 (26.0%)
2 144 (37.4%)
3 60 (15.6%)
4 45 (11.7%)
5 18 (4.7%)
6 8 (2.1%)
7 3 (0.8%)
10 1 (0.3%)
50 1 (0.3%)
Total 385
Mean 2.51
Median 2
Table 2: Length of Residence
Reside in Bibb Respondents
Less than 1 year 0 (0.0%)
1-5 years 36 (9.3%)
6-15 years 52 (13.4%)
16 or more years 300 (77.3%)
Total 399

19
Table 3: Occupation
Occupation Respondents
Business 67 (43.8%)
Government 12 (7.8%)
Non-profit 6 (3.9%)
Healthcare 30 (19.6%)
Unemployed 0 (0.0%)
Caregiver or Homemaker 0 (0.0%)
Military 3 (2.0%)
Manufacturing 15 (9.8%)
Education 20 (13.1%)
Total 153
Table 4: Zip Codes
Zip Code Respondents
31201 25 (6.6%)
31204 61 (16.1%)
31206 38 (10.0%)
31207 8 (2.1%)
31210 65 (17.1%)
31211 26 (6.8%)
31216 44 (11.6%)
31217 28 (7.4%)
31220 48 (12.6%)
Other 37 (9.7%)
Total 380 (100%)
20
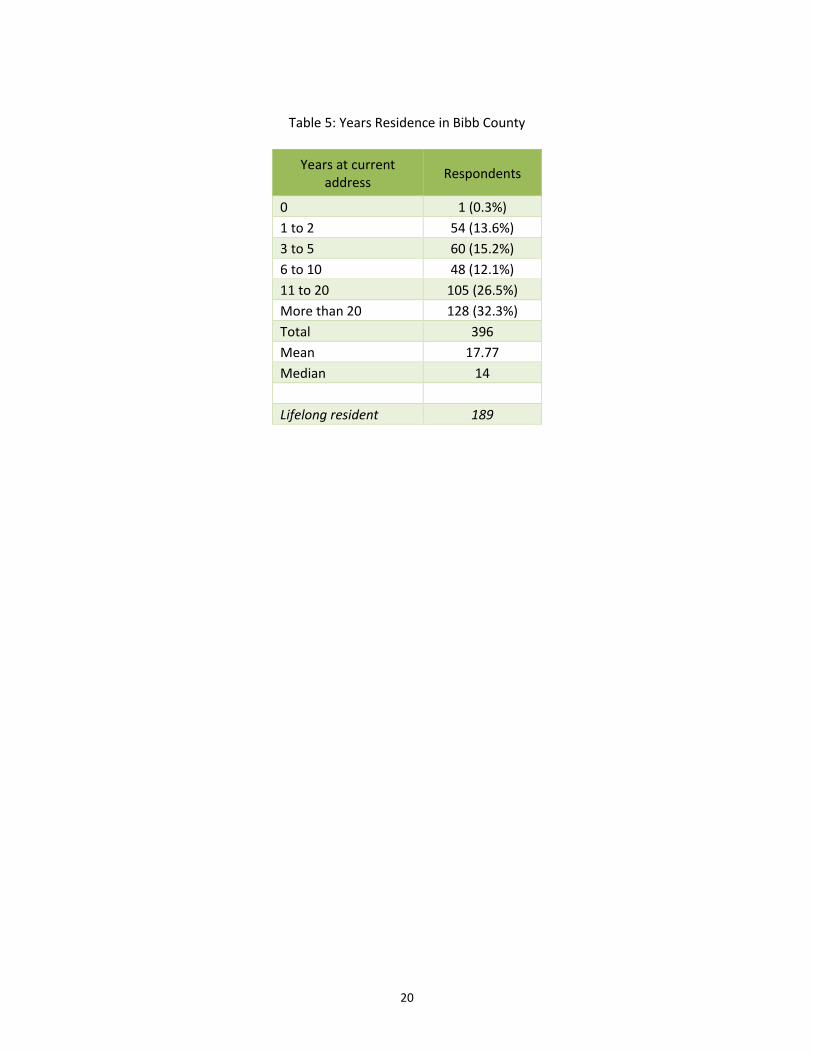
Table 5: Years Residence in Bibb County
Years at current address
Respondents
0 1 (0.3%)
1 to 2 54 (13.6%)
3 to 5 60 (15.2%)
6 to 10 48 (12.1%)
11 to 20 105 (26.5%)
More than 20 128 (32.3%)
Total 396
Mean 17.77
Median 14
Lifelong resident 189
21
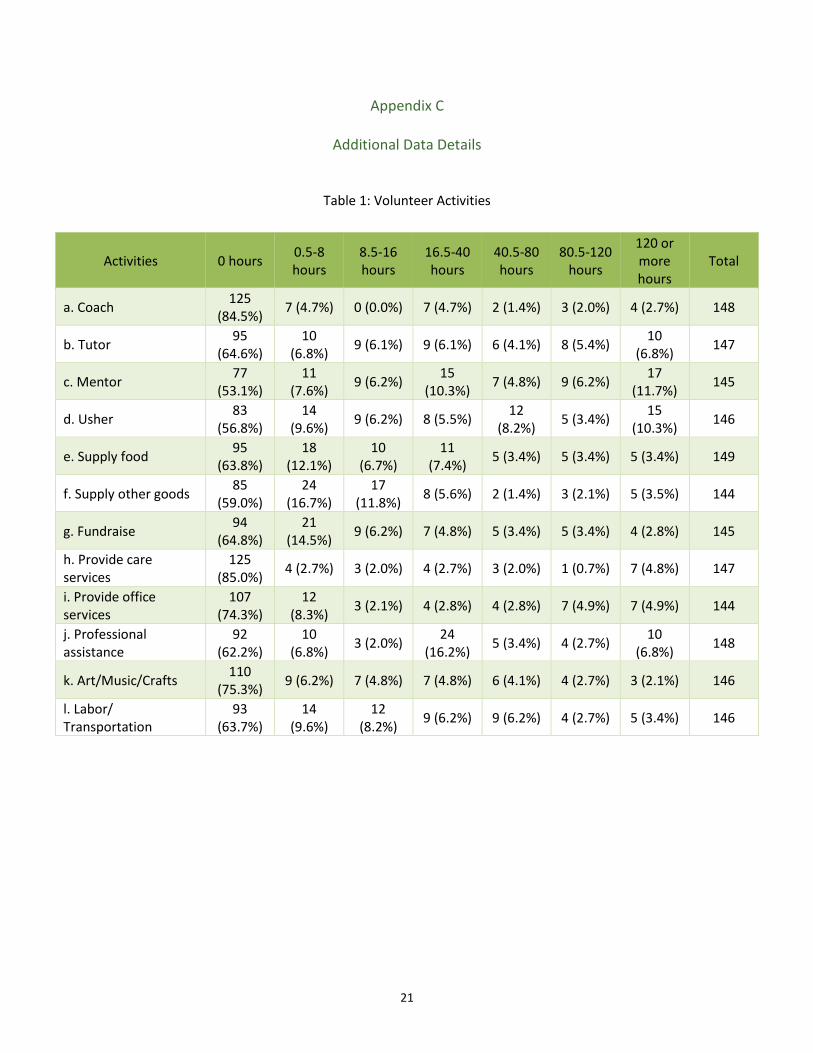
Appendix C
Additional Data Details
Table 1: Volunteer Activities
Activities 0 hours 0.5-8 hours
8.5-16 hours
16.5-40 hours
40.5-80 hours
80.5-120 hours
120 or more hours
Total
a. Coach 125
(84.5%) 7 (4.7%) 0 (0.0%) 7 (4.7%) 2 (1.4%) 3 (2.0%) 4 (2.7%) 148
b. Tutor 95
(64.6%) 10
(6.8%) 9 (6.1%) 9 (6.1%) 6 (4.1%) 8 (5.4%)
10 (6.8%)
147
c. Mentor 77
(53.1%) 11
(7.6%) 9 (6.2%)
15 (10.3%)
7 (4.8%) 9 (6.2%) 17
(11.7%) 145
d. Usher 83
(56.8%) 14
(9.6%) 9 (6.2%) 8 (5.5%)
12 (8.2%)
5 (3.4%) 15
(10.3%) 146
e. Supply food 95
(63.8%) 18
(12.1%) 10
(6.7%) 11
(7.4%) 5 (3.4%) 5 (3.4%) 5 (3.4%) 149
f. Supply other goods 85
(59.0%) 24
(16.7%) 17
(11.8%) 8 (5.6%) 2 (1.4%) 3 (2.1%) 5 (3.5%) 144
g. Fundraise 94
(64.8%) 21
(14.5%) 9 (6.2%) 7 (4.8%) 5 (3.4%) 5 (3.4%) 4 (2.8%) 145
h. Provide care services
125 (85.0%)
4 (2.7%) 3 (2.0%) 4 (2.7%) 3 (2.0%) 1 (0.7%) 7 (4.8%) 147
i. Provide office services
107 (74.3%)
12 (8.3%)
3 (2.1%) 4 (2.8%) 4 (2.8%) 7 (4.9%) 7 (4.9%) 144
j. Professional assistance
92 (62.2%)
10 (6.8%)
3 (2.0%) 24
(16.2%) 5 (3.4%) 4 (2.7%)
10 (6.8%)
148
k. Art/Music/Crafts 110
(75.3%) 9 (6.2%) 7 (4.8%) 7 (4.8%) 6 (4.1%) 4 (2.7%) 3 (2.1%) 146
l. Labor/ Transportation
93 (63.7%)
14 (9.6%)
12 (8.2%)
9 (6.2%) 9 (6.2%) 4 (2.7%) 5 (3.4%) 146
22
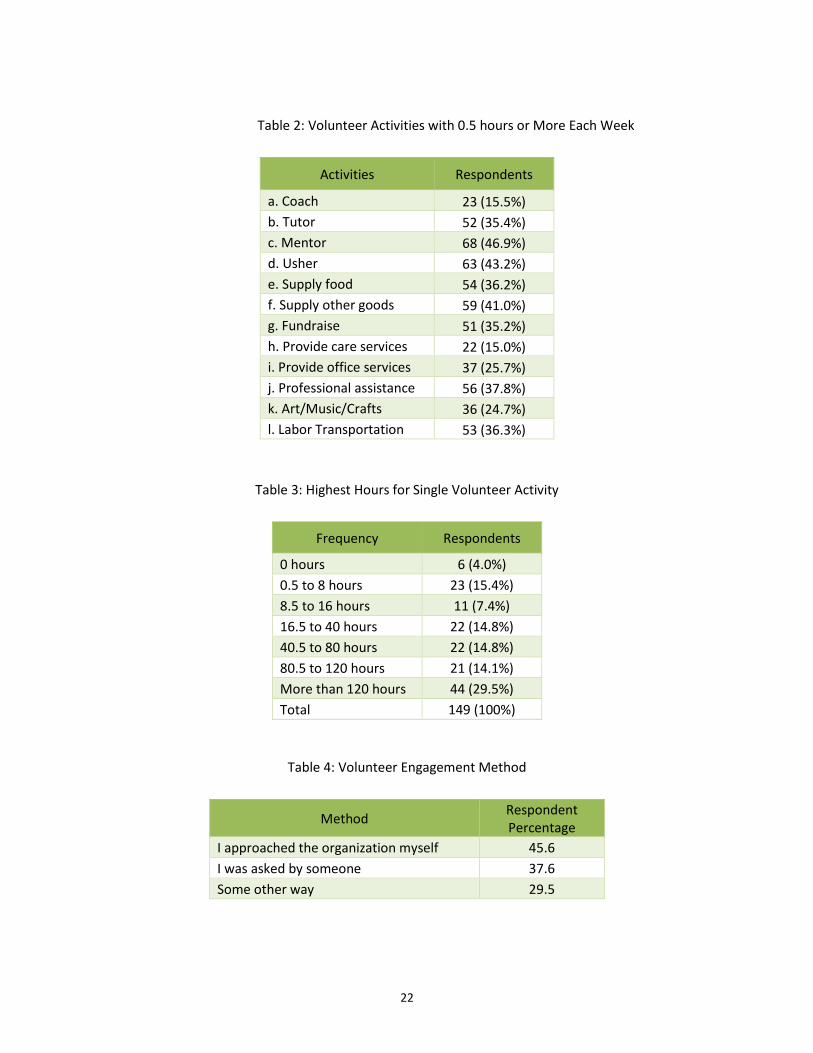
Table 2: Volunteer Activities with 0.5 hours or More Each Week
Activities Respondents
a. Coach 23 (15.5%)
b. Tutor 52 (35.4%)
c. Mentor 68 (46.9%)
d. Usher 63 (43.2%)
e. Supply food 54 (36.2%)
f. Supply other goods 59 (41.0%)
g. Fundraise 51 (35.2%)
h. Provide care services 22 (15.0%)
i. Provide office services 37 (25.7%)
j. Professional assistance 56 (37.8%)
k. Art/Music/Crafts 36 (24.7%)
l. Labor Transportation 53 (36.3%)
Table 3: Highest Hours for Single Volunteer Activity
Frequency Respondents
0 hours 6 (4.0%)
0.5 to 8 hours 23 (15.4%)
8.5 to 16 hours 11 (7.4%)
16.5 to 40 hours 22 (14.8%)
40.5 to 80 hours 22 (14.8%)
80.5 to 120 hours 21 (14.1%)
More than 120 hours 44 (29.5%)
Total 149 (100%)
Table 4: Volunteer Engagement Method
Method Respondent Percentage
I approached the organization myself 45.6
I was asked by someone 37.6
Some other way 29.5
23
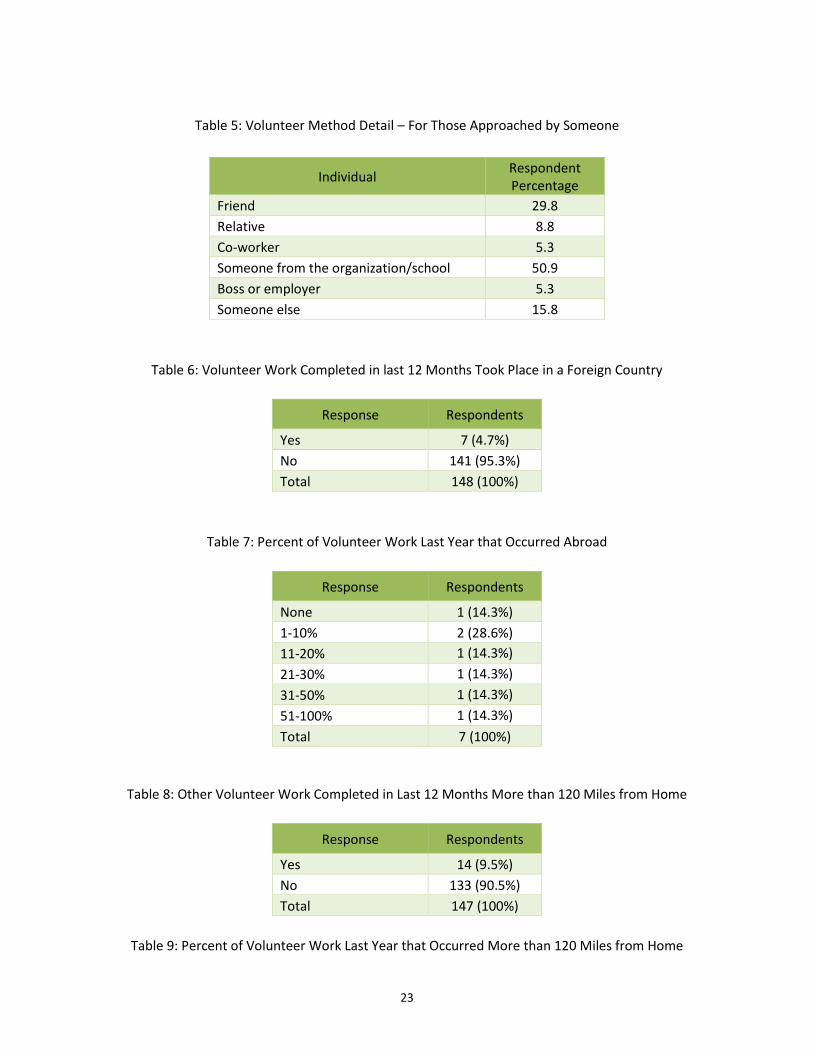
Table 5: Volunteer Method Detail – For Those Approached by Someone
Individual Respondent Percentage
Friend 29.8
Relative 8.8
Co-worker 5.3
Someone from the organization/school 50.9
Boss or employer 5.3
Someone else 15.8
Table 6: Volunteer Work Completed in last 12 Months Took Place in a Foreign Country
Response Respondents
Yes 7 (4.7%)
No 141 (95.3%)
Total 148 (100%)
Table 7: Percent of Volunteer Work Last Year that Occurred Abroad
Response Respondents
None 1 (14.3%)
1-10% 2 (28.6%)
11-20% 1 (14.3%)
21-30% 1 (14.3%)
31-50% 1 (14.3%)
51-100% 1 (14.3%)
Total 7 (100%)
Table 8: Other Volunteer Work Completed in Last 12 Months More than 120 Miles from Home
Response Respondents
Yes 14 (9.5%)
No 133 (90.5%)
Total 147 (100%)
Table 9: Percent of Volunteer Work Last Year that Occurred More than 120 Miles from Home

24
Response Respondents
1-5% 4 (28.6%)
6-10% 4 (28.6%)
11-20% 1 (7.1%)
21-30% 1 (7.1%)
31-50% 0 (0.0%)
51-100% 1 (7.1%)
Not Specified 3 (21.4%)
Total 14 (100%)
Table 10: Voter Registration Locations
Location Respondents
County Registrar's Office 83 (29.4%)
Department of Motor Vehicles 84 (29.8%)
High School 24 (8.5%)
College or other post-secondary school 7 (2.5%)
Public Library 7 (2.5%)
Never Registered 9 (3.2%)
Other 68 (24.1%)
Total 267 (100%)
25
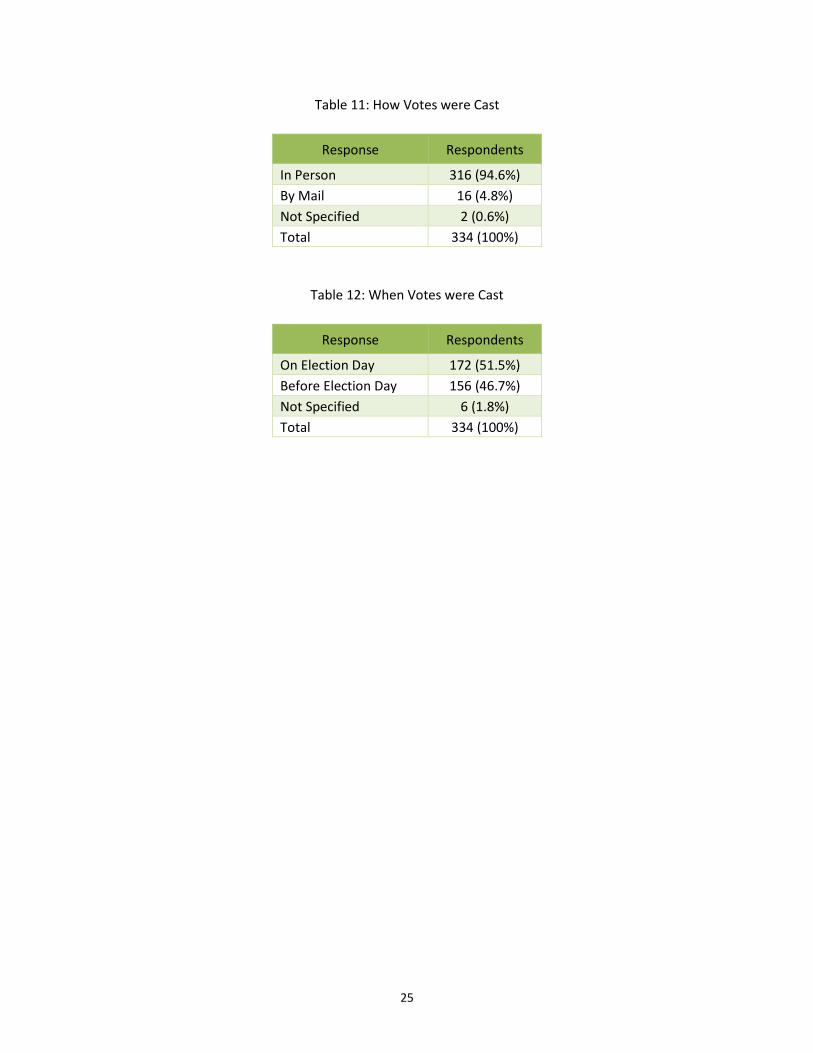
Table 11: How Votes were Cast
Response Respondents
In Person 316 (94.6%)
By Mail 16 (4.8%)
Not Specified 2 (0.6%)
Total 334 (100%)
Table 12: When Votes were Cast
Response Respondents
On Election Day 172 (51.5%)
Before Election Day 156 (46.7%)
Not Specified 6 (1.8%)
Total 334 (100%)