2007 biased reflectometry_international_zurich_congress_on_emc_september_2007
Biased transcription and selectivedegradation of small RNAs shapethe pattern of DNA eliminationin Tetrahymena
Ursula E. Schoeberl,1 Henriette M. Kurth,1,2 Tomoko Noto, and Kazufumi Mochizuki3
Institute of Molecular Biotechnology of the Austrian Academy of Sciences (IMBA), A-1030 Vienna, Austria
The ciliated protozoan Tetrahymena undergoes extensive programmed DNA elimination when the germlinemicronucleus produces the new macronucleus during sexual reproduction. DNA elimination is epigeneticallycontrolled by DNA sequences of the parental macronuclear genome, and this epigenetic regulation is mediated bysmall RNAs (scan RNAs [scnRNAs]) of ~28–30 nucleotides that are produced and function by an RNAi-relatedmechanism. Here, we examine scnRNA production and turnover by deep sequencing. scnRNAs are producedexclusively from the micronucleus and nonhomogeneously from a variety of chromosomal locations. scnRNAs arepreferentially derived from the eliminated sequences, and this preference is mainly determined at the level oftranscription. Despite this bias, a significant fraction of scnRNAs is also derived from the macronuclear-destinedsequences, and these scnRNAs are degraded during the course of sexual reproduction. These results indicate thatthe pattern of DNA elimination in the new macronucleus is shaped by the biased transcription in themicronucleus and the selective degradation of scnRNAs in the parental macronucleus.
[Keywords: DNA elimination; Tetrahymena; epigenetics; small RNA]
Supplemental material is available for this article.
Received May 16, 2012; revised version accepted June 21, 2012.
The phenotypes of a parent can be epigenetically trans-mitted to offspring through the germline in many differ-ent eukaryotes. Epigenetic information can be inheritedas chromatin modifications that are incompletely repro-grammed in gametes and thereby transmitted to descen-dants. For example, flower shape in plants and coat colorin mice can be transmitted transgenerationally by varia-tions in DNA methylation patterns (Cubas et al. 1999;Morgan et al. 1999). Alternatively, some diffusible factorscan transmit epigenetic information from parents toprogeny through the germline, such as the inheritance oftransposon silencing states by maternally supplied Piwi-associated small RNAs in fruit flies (Brennecke et al.2008). Transgenerational epigenetic inheritance poten-tially allows organisms to transmit acquired characteris-tics to the next generation and thus could increase thefitness of progeny in rapidly changing environments. How-ever, the detailed molecular mechanism of transgenera-tional epigenetic inheritance is largely unclear. Several lines
of evidence suggest that the patterns of programmedDNA elimination in ciliated protozoans are epigeneticallyand transgenerationally inherited (for review, see Mochizuki2010). Therefore, DNA elimination in ciliated protozoansserves as a model to understand how transgenerationalepigenetic inheritance can be achieved at a molecularlevel.
Like most ciliated protozoans, Tetrahymena thermophilaexhibits nuclear dimorphism. Each cell contains a germ-line micronucleus (Mic) and a somatic macronucleus (Mac)(Fig. 1). Most, if not all, gene expression occurs in the Mac.In the sexual process of conjugation (Fig. 1A–G), the Micundergoes meiosis (Fig. 1A), and one of the four meioticproducts is selected and mitotically divides to form twohaploid pronuclei (Fig. 1B). One of the pronuclei is recip-rocally exchanged between the two conjugating cells (Fig.1C). The migratory and stationary pronuclei then fuseto create a zygotic diploid nucleus (Fig. 1D) that dividestwice mitotically (Fig. 1E) to produce the next generationof new Macs and Mics (Fig. 1F). The parental Mac is thendestroyed (Fig. 1G).
Programmed DNA elimination occurs during the de-velopment of the new Mac. Previous studies have esti-mated that ;6000 internal eliminated sequences (IESs)are removed from the new Mac (for review, see Yao et al.
1These authors contributed equally to this work.2Present address: Viollier AG, Spalenring 145/147, 4002 Basel, Switzerland.3Corresponding authorE-mail [email protected] is online at http://www.genesdev.org/cgi/doi/10.1101/gad.196493.112.
GENES & DEVELOPMENT 26:1729–1742 � 2012 by Cold Spring Harbor Laboratory Press ISSN 0890-9369/12; www.genesdev.org 1729
Cold Spring Harbor Laboratory Press on November 15, 2021 - Published by genesdev.cshlp.orgDownloaded from

2002). The Mic sequences that remain in the future Macare called Mac-destined sequences (MDSs). IESs in Tetra-hymena vary in size (;0.5–20 kb) and sequence, and re-cent Mic genome sequencing indicates that they accountfor about one-third of the Mic genome (TetrahymenaComparative Sequencing Project, Broad Institute of Har-verd and Massachussetts Institute of Technology [http://www.broadinstutute.org]). Some IESs are moderately re-peated in the Mic genome (Yao and Gorovsky 1974) andare related to transposable elements (Wuitschick et al.2002; Fillingham et al. 2004). IESs are primarily located innongenic regions, although some are located in genicregions (Fass et al. 2011). The excision of IESs can occurreproducibly at a specific site or with a limited number ofalternative boundaries (Austerberry et al. 1989; Fass et al.2011). However, despite this precision, the sites of DNAelimination do not seem to be specified by the primaryDNA sequences of the Mic genome because no obviousconsensus sequence has been identified in or around IESs,and the in vitro DNA specificity of the enzyme respon-sible for the DNA excision process is ambiguous (Chenget al. 2010). Instead, DNA elimination in Tetrahymenaand some other ciliates is epigenetically regulated by the
DNA sequence of the parental Mac such that the elim-ination of a new Mac DNA is inhibited by the presence ofthe same sequence in the parental Mac (Koizumi andKobayashi 1989; You et al. 1991; Duharcourt et al. 1995;Chalker and Yao 1996). Because the chromosomes of theparental and the new Macs do not directly interact, somesequence-specific diffusible signal must be transmittedfrom the parental to the new Macs through the cytoplasmto mediate the epigenetic effect (Chalker et al. 2005).
The injection of dsRNAs complementary to a MDSlocus into an early conjugating cell induces ectopic DNAelimination at the MDS locus (Yao et al. 2003), indicatingthat an RNAi-related mechanism plays a role in DNAelimination. Indeed, the Dicer homolog Dcl1p and theArgonaute protein Twi1p are essential for DNA elimina-tion (Mochizuki et al. 2002; Malone et al. 2005). Bidirec-tional Mic noncoding transcripts (Chalker and Yao 2001),which are probably transcribed by RNA polymerase II(Mochizuki and Gorovsky 2004b), are processed by Dcl1p(Malone et al. 2005; Mochizuki and Gorovsky 2005) tosmall (;28- to 30-nucleotide [nt]) RNAs, named scanRNAs (scnRNAs). scnRNAs are then complexed withTwi1p (Mochizuki and Gorovsky 2004a). The fact that
Figure 1. Life cycle of Tetrahymena and a model for scnRNA-directed DNA elimination. A single cell of T. thermophila contains twodifferent types of nuclei: a Mac and a Mic. When sufficient nutrients are available, Tetrahymena grows by binary fission, and the Macand the Mic are divided independently (vegetative growth, green background). After prolonged starvation (blue background), two cells ofcomplementary mating types fuse to begin the sexual reproduction process (conjugation, pink background). Their Mics undergomeiosis (A), and one of the meiotic products survives and divides mitotically, giving rise to two pronuclei, one stationary and onemigratory (B). The migratory gametic nucleus crosses the conjugation bridge (C) and fuses with the stationary nucleus to produce thezygotic nucleus (D). The zygotic nucleus divides twice (E), and two of the products differentiate as Macs, while the other twodifferentiate as Mics (F). The parental Mac is degraded, and the pair is dissolved (G). (Bottom left) In the early conjugation stages, theMic genome, including IESs (red boxes) and MDSs (blue bars), is transcribed bidirectionally, and these transcripts (wavy arrows) formdsRNA (H). The dsRNAs are processed into small RNAs (scnRNAs) (I), and the scnRNAs are transferred to the parental Mac (J). (Bottommiddle) In the mid-conjugation stages, all scnRNAs complementary to DNA in the parental Mac are degraded (K). (Bottom right) In thelate conjugation stages, the scnRNAs that are not degraded in the parental Mac (those complementary to IESs) are transferred to thedeveloping new Mac (L), where they target IESs for elimination by base pairing (M).
Schoeberl et al.
1730 GENES & DEVELOPMENT
Cold Spring Harbor Laboratory Press on November 15, 2021 - Published by genesdev.cshlp.orgDownloaded from
the Twi1p–scnRNA complex first localizes to the paren-tal Mac and then to the new Mac (Mochizuki et al. 2002;Noto et al. 2010) makes scnRNA a strong candidate to bethe mediator of the epigenetic signal.
Consistent with the production of scnRNAs from theMic, scnRNAs complementary to MDSs and those com-plementary to IESs have been detected in the early stagesof conjugation. However, scnRNAs complementary toIESs become enriched as conjugation proceeds (Mochizukiand Gorovsky 2004a; Aronica et al. 2008). Moreover,most of the scnRNAs cloned from the late stage of con-jugation are complementary to IESs (Lee and Collins2006). Thus, scnRNAs are selected for IES specificityafter they are diced. Based on these and other observa-tions, a model has been proposed to explain how scnRNAsmediate the epigenetic regulation of DNA elimination(Fig. 1H–M). In the model, scnRNAs are produced fromthe entire Mic genome, including both IESs and MDSs,in the early stages of conjugation (Fig. 1H,I), and scnRNAsthat share homology with any Mac genome sequences(MDSs) are degraded in the parental Mac in the middlestages of conjugation (Fig. 1J,K). This process is calledscnRNA selection. It has been further proposed thatthese IES-specific scnRNAs move to the developing Macin the late stages of conjugation (Fig. 1L), where theyidentify homologous sequences as IESs and target them forheterochromatin formation (Coyne et al. 1999; Tavernaet al. 2002; Liu et al. 2007), followed by DNA elimination(Fig. 1M).
Three issues with this proposed model have not beenresolved: (1) Are scnRNAs produced exclusively from theMic? (2) Are scnRNAs produced homogeneously fromboth IESs and MDSs at a local level and from the entireMic genome at a global level? (3) Does scnRNA selectionoccur at a genome-wide level? To address these points, weanalyzed the production and turnover of scnRNAs bydeep sequencing.
Results
scnRNAs are predominantly produced from the Mic
It has been proposed that scnRNAs are produced exclu-sively from the Mic because some fraction of scnRNAs iscomplementary to the Mic-limited sequences (Mochizukiet al. 2002; Mochizuki and Gorovsky 2004a; Aronicaet al. 2008), and the Dicer homolog Dcl1p, which is re-sponsible for the production of scnRNAs, is detected onlyin the Mic (Malone et al. 2005; Mochizuki and Gorovsky2005). However, another fraction of scnRNAs is comple-mentary to MDSs (Mochizuki et al. 2002; Mochizuki andGorovsky 2004a; Aronica et al. 2008), which are shared inthe Mic and the Mac; therefore, the production of scnRNAsfrom the Mac has not been completely excluded. To de-termine whether the Mac produces scnRNAs, we com-pared scnRNAs from wild-type cells with those fromchromosome 4 (Chr4)–nullisomic (Nulli4) strains. In Nulli4strains, Chr4 is completely missing in the Mic, while theMac chromosomes derived from Chr4 are maintained(Bruns et al. 1983). Therefore, if any Chr4-derived scnRNA
is detected in Nulli4 strains, it must be transcribed fromthe Mac genome.
Total RNA was extracted from wild-type and Nulli4strains at 3 h post-mixing, when the production ofscnRNAs is expected to be almost complete but scnRNAselection is expected to have just initiated (see below).The RNA was gel-fractionated, and a small RNA popula-tion, including scnRNAs (26–32 nt), was used to constructthe cDNA library for deep sequencing. To determine fromwhich Mic chromosome each scnRNA was derived, wechose two ;100-kb Mic genome loci for which chromo-somal origins have been identified. One, named the Callocus, contains the calmodulin gene and 12 IESs, includ-ing the well-studied Cal-IES element (Katoh et al. 1993);the other, named the LMR locus, contains 13 IESs, in-cluding the well-studied L-IES, M-IES, and R-IES elements(Austerberry et al. 1984). The Cal and LMR loci are onChr2 and Chr4, respectively (E Hamilton and E Orias, pers.comm.).
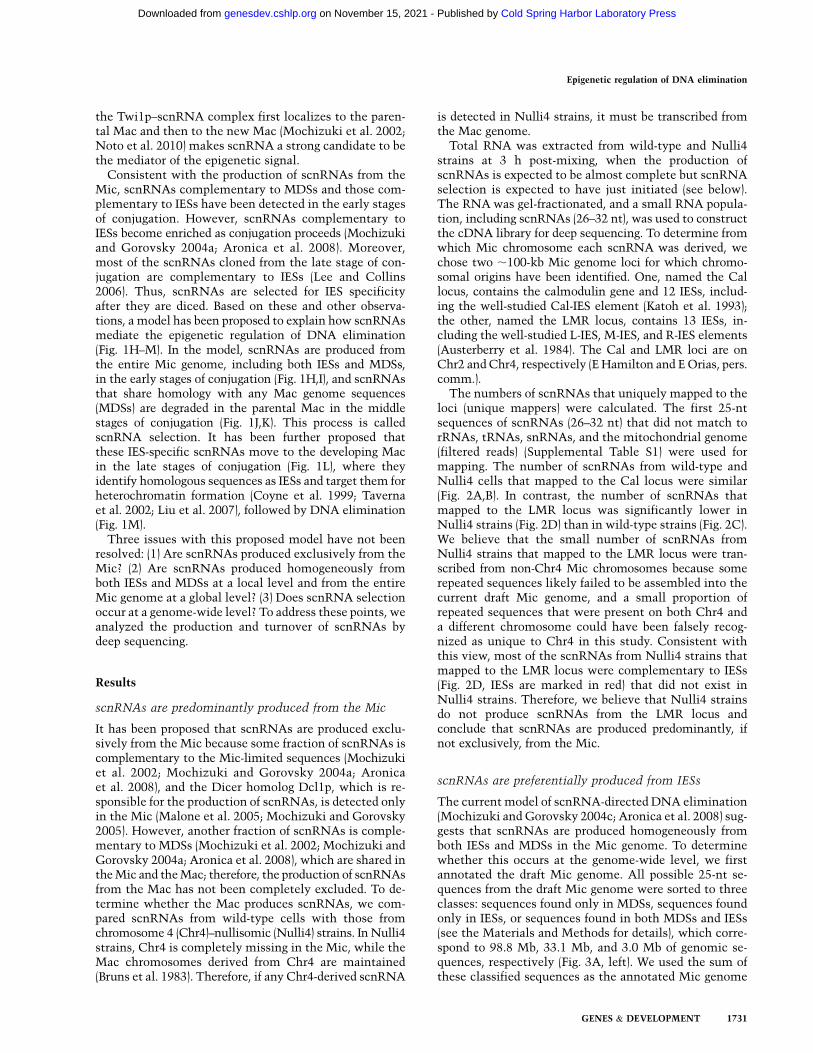
The numbers of scnRNAs that uniquely mapped to theloci (unique mappers) were calculated. The first 25-ntsequences of scnRNAs (26–32 nt) that did not match torRNAs, tRNAs, snRNAs, and the mitochondrial genome(filtered reads) (Supplemental Table S1) were used formapping. The number of scnRNAs from wild-type andNulli4 cells that mapped to the Cal locus were similar(Fig. 2A,B). In contrast, the number of scnRNAs thatmapped to the LMR locus was significantly lower inNulli4 strains (Fig. 2D) than in wild-type strains (Fig. 2C).We believe that the small number of scnRNAs fromNulli4 strains that mapped to the LMR locus were tran-scribed from non-Chr4 Mic chromosomes because somerepeated sequences likely failed to be assembled into thecurrent draft Mic genome, and a small proportion ofrepeated sequences that were present on both Chr4 anda different chromosome could have been falsely recog-nized as unique to Chr4 in this study. Consistent withthis view, most of the scnRNAs from Nulli4 strains thatmapped to the LMR locus were complementary to IESs(Fig. 2D, IESs are marked in red) that did not exist inNulli4 strains. Therefore, we believe that Nulli4 strainsdo not produce scnRNAs from the LMR locus andconclude that scnRNAs are produced predominantly, ifnot exclusively, from the Mic.
scnRNAs are preferentially produced from IESs
The current model of scnRNA-directed DNA elimination(Mochizuki and Gorovsky 2004c; Aronica et al. 2008) sug-gests that scnRNAs are produced homogeneously fromboth IESs and MDSs in the Mic genome. To determinewhether this occurs at the genome-wide level, we firstannotated the draft Mic genome. All possible 25-nt se-quences from the draft Mic genome were sorted to threeclasses: sequences found only in MDSs, sequences foundonly in IESs, or sequences found in both MDSs and IESs(see the Materials and Methods for details), which corre-spond to 98.8 Mb, 33.1 Mb, and 3.0 Mb of genomic se-quences, respectively (Fig. 3A, left). We used the sum ofthese classified sequences as the annotated Mic genome
Epigenetic regulation of DNA elimination
GENES & DEVELOPMENT 1731
Cold Spring Harbor Laboratory Press on November 15, 2021 - Published by genesdev.cshlp.orgDownloaded from
in this study. To analyze the original scnRNA populationproduced by Dcl1p in the Mic, we used TWI1 knockoutcells because the scnRNA selection process (Fig. 1K; seealso below) that occurs after binding of scnRNAs to Twi1pshould not occur in the absence of Twi1p.
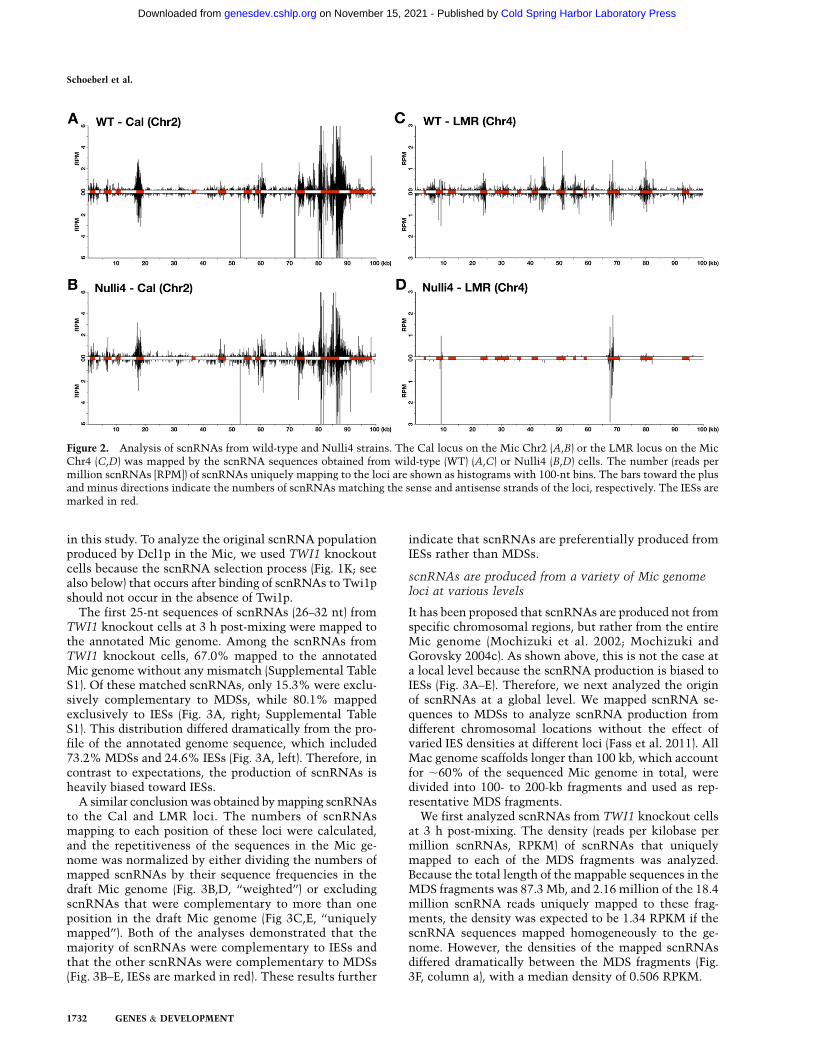
The first 25-nt sequences of scnRNAs (26–32 nt) fromTWI1 knockout cells at 3 h post-mixing were mapped tothe annotated Mic genome. Among the scnRNAs fromTWI1 knockout cells, 67.0% mapped to the annotatedMic genome without any mismatch (Supplemental TableS1). Of these matched scnRNAs, only 15.3% were exclu-sively complementary to MDSs, while 80.1% mappedexclusively to IESs (Fig. 3A, right; Supplemental TableS1). This distribution differed dramatically from the pro-file of the annotated genome sequence, which included73.2% MDSs and 24.6% IESs (Fig. 3A, left). Therefore, incontrast to expectations, the production of scnRNAs isheavily biased toward IESs.
A similar conclusion was obtained by mapping scnRNAsto the Cal and LMR loci. The numbers of scnRNAsmapping to each position of these loci were calculated,and the repetitiveness of the sequences in the Mic ge-nome was normalized by either dividing the numbers ofmapped scnRNAs by their sequence frequencies in thedraft Mic genome (Fig. 3B,D, ‘‘weighted’’) or excludingscnRNAs that were complementary to more than oneposition in the draft Mic genome (Fig 3C,E, ‘‘uniquelymapped’’). Both of the analyses demonstrated that themajority of scnRNAs were complementary to IESs andthat the other scnRNAs were complementary to MDSs(Fig. 3B–E, IESs are marked in red). These results further
indicate that scnRNAs are preferentially produced fromIESs rather than MDSs.
scnRNAs are produced from a variety of Mic genomeloci at various levels
It has been proposed that scnRNAs are produced not fromspecific chromosomal regions, but rather from the entireMic genome (Mochizuki et al. 2002; Mochizuki andGorovsky 2004c). As shown above, this is not the case ata local level because the scnRNA production is biased toIESs (Fig. 3A–E). Therefore, we next analyzed the originof scnRNAs at a global level. We mapped scnRNA se-quences to MDSs to analyze scnRNA production fromdifferent chromosomal locations without the effect ofvaried IES densities at different loci (Fass et al. 2011). AllMac genome scaffolds longer than 100 kb, which accountfor ;60% of the sequenced Mic genome in total, weredivided into 100- to 200-kb fragments and used as rep-resentative MDS fragments.
We first analyzed scnRNAs from TWI1 knockout cellsat 3 h post-mixing. The density (reads per kilobase permillion scnRNAs, RPKM) of scnRNAs that uniquelymapped to each of the MDS fragments was analyzed.Because the total length of the mappable sequences in theMDS fragments was 87.3 Mb, and 2.16 million of the 18.4million scnRNA reads uniquely mapped to these frag-ments, the density was expected to be 1.34 RPKM if thescnRNA sequences mapped homogeneously to the ge-nome. However, the densities of the mapped scnRNAsdiffered dramatically between the MDS fragments (Fig.3F, column a), with a median density of 0.506 RPKM.
Figure 2. Analysis of scnRNAs from wild-type and Nulli4 strains. The Cal locus on the Mic Chr2 (A,B) or the LMR locus on the MicChr4 (C,D) was mapped by the scnRNA sequences obtained from wild-type (WT) (A,C) or Nulli4 (B,D) cells. The number (reads permillion scnRNAs [RPM]) of scnRNAs uniquely mapping to the loci are shown as histograms with 100-nt bins. The bars toward the plusand minus directions indicate the numbers of scnRNAs matching the sense and antisense strands of the loci, respectively. The IESs aremarked in red.
Schoeberl et al.
1732 GENES & DEVELOPMENT
Cold Spring Harbor Laboratory Press on November 15, 2021 - Published by genesdev.cshlp.orgDownloaded from
We hypothesized that the observed variability in thescnRNAs from TWI1 knockout cells that mapped to theMDS fragments could account for the timing but notthe levels of scnRNA production from different chromo-somal locations. This is because scnRNAs are unstable inthe absence of Twi1p (Mochizuki and Gorovsky 2004a),and thus only scnRNAs produced immediately beforeharvesting the cells were likely sequenced from TWI1knockout cells. In wild-type cells, scnRNAs are stabilizedin a complex with Twi1p (Mochizuki and Gorovsky 2004a).On the other hand, in wild-type cells, Twi1p transportsscnRNAs to the parental Mac, where scnRNAs com-plementary to the Mac genome are degraded (Fig. 1K;Aronica et al. 2008). The Twi1p-associated RNA helicaseEma1p is required for this degradation in the parentalMac but not for the formation of Twi1p–scnRNA com-plexes, which stabilize scnRNAs (Supplemental Fig. S3;Aronica et al. 2008).
Therefore, to circumvent scnRNA degradation and de-termine the level of scnRNA production from each locusmore precisely, scnRNA sequences obtained from EMA1knockout cells at early to late stages of conjugation weremapped to the MDS fragments (Fig. 3F, colums b–e).Although many of the MDS fragments were sparsely (<1RPKM) mapped by scnRNA sequences from TWI1 knock-out cells (Fig. 3F, column a), this fraction was greatly
Figure 3. Production of scnRNAs from the Mic genome. (A)The draft Mic genome was annotated as three sequence classes:sequences that appear only in MDSs (blue), sequences thatappear in both MDSs and IESs (green), and sequences thatappear only in IESs (red). The percent occupancy of genomicsequences in each class is shown in the left column (Genome).The fraction of the sequenced scnRNAs from TWI1 knockoutcells at 3 h post-mixing that is complementary to each of theclasses of the annotated Mic genome is shown in the right
column (scnRNA). (B–E) The Cal (B,C) and LMR (D,E) loci aremapped by the sequenced scnRNAs from TWI1 knockout cellsat 3 h post-mixing. For B and D, the number (reads per millionscnRNAs [RPM]) of scnRNAs mapping to each position of theloci was divided by its sequence frequency in the draft Micgenome (‘‘weighted’’). For C and E, only the number of scnRNAsthat mapped to a single location of the draft Mic genome isshown (‘‘uniquely mapped’’). In both cases, the numbers ofscnRNAs matching the sense and antisense strands are shownin the plus and minus directions, respectively, as histogramswith 100-nt bins. (C,E, bottom) The fraction of unique se-quences that can be mapped by scnRNAs by the latter methodin each 100-nt bin is shown as ‘‘Mappability’’. The positions ofIESs are marked in red. (F) The number of scnRNA sequencesthat uniquely matched each of the 100- to 200-kb MDS frag-ments was divided by the total length of the unique sequencesof the MDS fragments (scnRNA density, RPKM [reads perkilobase of unique sequences per million] scnRNAs) and isshown as box plots. scnRNAs from TWI1 knockout cells at3 h post-mixing and from EMA1 knockout cells at 3, 4.5, 6, or 8 hpost-mixing were analyzed. The box indicates the interquartilerange (IQR). The horizontal bar in the box indicates the medianvalue. The bars on the top and bottom of the box indicate theminimum and maximum values, respectively, within 1.5 3
IQR. Circles indicate outliers. P-values were calculated usingthe Wilcoxon rank-sum test.
GENES & DEVELOPMENT 1733
Epigenetic regulation of DNA elimination
Cold Spring Harbor Laboratory Press on November 15, 2021 - Published by genesdev.cshlp.orgDownloaded from

reduced when the MDS fragments were mapped byscnRNA sequences from EMA1 knockout cells at 3 hpost-mixing (Fig. 3F, column b). This result indicates thatsome population of scnRNAs that was derived fromspecific chromosomal locations existed in EMA1 knock-out cells but was missing in TWI1 knockout cells. Thevariability of the mapped scnRNA density on differentMDS fragments was smaller at 4.5 h post-mixing (Fig. 3F,column c) than at 3 h post-mixing (Fig. 3F, column b) inEMA1 knockout cells but did not significantly changefurther at later stages (Fig. 3F, columns d,e). These resultsindicate that scnRNA production from different chromo-somal locations indeed occurs at distinct conjugationstages before 3 h post-mixing and between 3 and 4.5 hpost-mixing.
This different timing of scnRNA production fromdistinct chromosomal locations partially explains the var-iable densities of TWI1 knockout scnRNAs mapped todifferent MDS fragments (Fig. 3F, column a). However,different MDS fragments were variably mapped even bythe scnRNAs from the EMA1 knockout cells at late stagesof conjugation (Fig. 3F, columns d,e), when scnRNA pro-duction was expected to be completed, indicating that,although scnRNA production occurs from a variety ofchromosomal locations in the Mic, it is not homogeneousat either the local (i.e., IES-biased) (Fig. 3A–E) or global (Fig.3F) level.
Sequence repetitiveness in the genome does not fullyexplain IES-biased scnRNA production
The IES-biased production of scnRNAs may be caused bypreferential production of scnRNAs from repeated se-quences in the genome because some IESs are related totransposon-derived sequences and are repeated in the Micgenome (Yao and Gorovsky 1974; Wuitschick et al. 2002;Fillingham et al. 2004), and scnRNAs are processed fromdsRNA precursors (Malone et al. 2005; Mochizuki andGorovsky 2005; Noto et al. 2010), which can be morefrequently formed by hybridization of transcripts fromrepeated sequences. To evaluate this possibility, weclassified the annotated Mic genome sequences into threeclasses according to their repetitiveness. All possible 25-ntsequences from the draft Mic genome were sorted tothree classes: unique (‘‘Unique’’ in Fig. 4A), moderatelyrepeated (two to 10 times in the genome) (‘‘Mid-Rep’’ inFig. 4A), and highly repeated (>10 times, in the genome)(‘‘High-Rep’’ in Fig. 4A), which comprise 86.9%, 10.0%,and 3.1% of the annotated Mic genome, respectively(Fig. 4A). The first 25-nt sequences of scnRNAs werethen mapped to the sequences in each class.
Among the scnRNAs from TWI1 knockout cells at 3 hpost-mixing, 52.2%, 29.1%, and 18.6% were complemen-tary to Unique, Mid-Rep, and High-Rep sequences, re-spectively (Fig. 4E), indicating that scnRNAs are indeedproduced from repeated sequences more frequently(Fig. 4, cf. A and E). However, because half of the scnRNAswere derived from unique sequences, repetitiveness in thegenome seemed not necessary for scnRNA production. Todetermine whether the repeat bias explains the IES-biased
production of scnRNAs, we separately analyzed the IESand MDS biases of scnRNA production from the threerepetitiveness classes (Unique, Mid-Rep, and High-Rep)(Fig. 4B–H). scnRNAs complementary to all three repeti-tiveness classes were strongly biased for IESs (Fig. 4F–H).Importantly, even scnRNAs complementary to Uniquesequences were biased for IESs (Fig. 4, cf. D and H).Therefore, the IES-biased production of scnRNAs cannotbe explained by the repeated nature of IESs.
Figure 4. Production of scnRNAs from unique and repetitivesequences. (A) The draft Mic genome sequences were classi-fied among three categories: unique sequences (Unique [lightgreen]), moderately repeated sequences (repeated two to ninetimes in the draft genome, Mid-Rep [yellow]), and highlyrepeated sequences (repeated >10 times in the draft genome,High-Rep [orange]). The percent occupancy of the sequencesin each category is shown. (B–D) The sequences in each categoryin A were subdivided into the sequences annotated as MDSs(blue), IESs (red), and both MDSs and IESs (dark green). (E–H)The fraction of scnRNA sequences from TWI1 knockout cellsat 3 h post-mixing that belongs to each sequence category isshown.
1734 GENES & DEVELOPMENT
Schoeberl et al.
Cold Spring Harbor Laboratory Press on November 15, 2021 - Published by genesdev.cshlp.orgDownloaded from

IES-biased scnRNA production is attributed to biasedtranscription in the Mic
If the repetitiveness of the sequences in the genome is notthe main contributor to IES-biased scnRNA production,what mechanism is then responsible for the bias? Oneobvious possibility is that Mic transcription, which pro-duces the precursors of scnRNAs, preferentially occursat IESs. To investigate this possibility, we analyzed Mictranscription by global run-on sequencing (GRO-seq),which provides a genome-wide profile of the positionand orientation of all transcription-engaged RNA poly-merases (Core et al. 2008).
A Mic-enriched (>99.5%) nuclear fraction was preparedby a stepwise differential centrifugation method (Sweetand Allis 2006) from wild-type cells at 2 h post-mixing foruse in the GRO-seq assay. We used the cells at 2 h post-mixing because the Mic extensively elongates at meioticprophase (;3–4 h post-mixing) (Sugai and Hiwatashi1974), making it technically difficult to prepare an intactMic at these later stages. Although scnRNA accumula-tion peaks at ;4 h post-mixing, scnRNA production hasalready initiated at 2 h post-mixing (see Fig. 7, below;Mochizuki et al. 2002). Therefore, Mic transcriptionshould have started at this stage.
Nuclear run-on transcripts were purified and shearedto ;30- to 250-nt fragments, a cDNA library was con-structed, single-read sequences were produced, and thefirst 25-nt sequences were used for mapping (see theMaterials and Methods for details). Although we used aMic-enriched nuclear fraction, ;9% of the reads matchedrRNAs (Supplemental Table S2). Because rDNA is ampli-fied to ;10,000 copies only in the Mac and exists as asingle copy in the Mic genome, most of the reads matchingrRNAs were likely derived from Mac contamination of theMic-concentrated nuclear fraction.
The filtered GRO-seq reads were mapped to the Callocus (Fig. 5A). Most of the transcripts occurred bidirec-tionally, and a large fraction was complementary to IESs.The pattern of these transcripts was highly similar to thatof scnRNAs from TWI1 knockout cells at 3 h post-mixing(Fig. 5B). Transcripts exhibiting mapping patterns thatwere highly similar to the scnRNA profiles were alsodetected from other loci (Supplemental Fig. S1). There-fore, we conclude that the bias of scnRNAs toward IESs ismainly attributed to the IES-biased transcription of theprecursor RNAs in the Mic.
When the GRO-seq reads were mapped to the LMRlocus, most of the transcripts were complemantary toIESs, and their pattern was highly similar to the scnRNA
Figure 5. Nuclear run-on assay of the Mic-enriched nuclear fraction. (A,C) The sequences of nascent transcripts obtained by the globalnuclear run-on assay using a Mic-enriched nuclear fraction of wild-type cells at 2 h post-mixing were mapped to the Cal (A) or LMR (C)locus. Numbers (reads per million RNAs [RPM]) of the sequences that uniquely mapped to the sense and antisense strands of the lociare shown in the plus and minus directions, respectively, as histograms with 100-nt bins. The IESs are marked in red. The regions ofgenes (including exons and introns) that are predicted to be transcribed from left to right and from right to left are labeled as purple andblue boxes, respectively. The reads that are predicted to be derived from unidirectional mRNA transcripts are marked with asterisks.(B,D) The profile of scnRNAs (TWI1 knockout cells, 3 h post-mixing) mapped to the Cal (B) or LMR (D) locus. The same results are alsoshown in Figure 3, C and E, respectively. (B,D, bottom) The fraction of unique sequences that can be mapped by scnRNAs or GRO-seqreads in each 100-nt bin is shown as ‘‘Mappability’’.
GENES & DEVELOPMENT 1735
Epigenetic regulation of DNA elimination
Cold Spring Harbor Laboratory Press on November 15, 2021 - Published by genesdev.cshlp.orgDownloaded from

profiles at the same locus (Fig. 5C). However, overalllevels of transcription from this locus were very low. TheMic LMR locus may not be highly transcribed at the stageat which the nuclei were prepared (at 2 h post-mixing)because different chromosomal locations probably pro-duce scnRNAs at distinct times (Fig. 3F).
Some of the transcripts detected by GRO-seq occurredunidirectionally, and the number of these transcriptsincreased steeply at the 59 ends of predicted ORFs (signalsmarked with asterisks in Fig. 5A,C; Supplemental Fig.S1A). These likely represent mRNAs derived from con-taminating polyploid Mac because although the Mic-enriched fraction contained <0.5% Macs, the Mac con-tains ;20 times more DNA than the Mic, and thus sometranscripts from Mac DNA were expected to be detectedin this study. Consistently, the number of reads mappedto the coding regions was correlated to the RNA expres-sion levels of the corresponding genes detected by micro-array hybridization with total RNA extracted from wholecells at the same stage (Miao et al. 2009). However, wecannot exclude the possibility that these mRNA-typetranscripts were derived from the Mic. Nonetheless, theywere transcribed unidirectionally and thus should not beprocessed to scnRNAs.
scnRNAs complementary to IESs are selectivelyenriched during conjugation
Despite the strong bias of scnRNA production for IESs,a significant fraction of scnRNAs at 3 h post-mixing wascomplementary to MDSs (Fig. 3A–E), including manyprotein-coding regions (see Fig. 5B,D; Supplemental Fig.S1B,D). Because scnRNAs are involved in the targetingof heterochromatin formation, which in turn inducesDNA elimination (Liu et al. 2004, 2007), the presence ofscnRNAs complementary to MDSs could cause theelimination of many essential genes. It has been proposedthat this mistargeting of DNA elimination is preventedby the enrichment of scnRNAs complementary to IESsand that this enrichment is mediated by the interactionsbetween scnRNAs and the Mac genome (Fig. 1K; Mochizukiet al. 2002; Mochizuki and Gorovsky 2004c; Aronica et al.2008). This proposed process is called scnRNA selection.
To determine whether scnRNA selection occurs at agenome-wide level, we compared scnRNAs from wild-typecells at 3, 4.5, 6, and 8 h post-mixing. In this analysis,scnRNAs were oxidized prior to cDNA library construc-tion. The oxidation inhibits linker ligation at the first stepof cDNA library construction, and thus any oxidation-sensitive RNAs were excluded from the sequencing. Be-cause scnRNAs loaded onto Twi1p are 29-O-methylated(Kurth and Mochizuki 2009), which prevents the periodateoxidation reaction, studying oxidation-resistant scnRNAsallowed us to specifically analyze scnRNAs that wereloaded onto Twi1p (HM Kurth and K Mochizuki, in prep.)and committed to the DNA elimination pathway.
First, the sequenced scnRNAs were mapped to the an-notated Mic genome sequence described above. Among thescnRNAs from wild-type cells at 3 h post-mixing, when theselective degradation process should have just begun,
13.0% and 84.0% of scnRNAs mapped to the MDSs andIESs of the annotated genome, respectively (Fig. 6A; Sup-plemental Table S1). This ratio was similar to the oneobtained from nonoxidized scnRNAs of TWI1 knockoutcells (15.3% to MDSs and 80.1% to IESs) (Fig 3B; Supple-mental Table S1), supporting our expectation that scnRNAselection had largely not begun at 3 h post-mixing.
The fraction of scnRNAs that was complementary toIESs was gradually enriched through conjugation (Fig. 6A;Supplemental Table S1). At 8 h post-mixing, when theheterochromatin formation that preceded DNA eliminationhad begun and thus the scnRNA selection was expected tobe completed, only 5.6% of the scnRNAs were comple-mentary to MDSs, while 93.1% were complementary toIESs (Fig. 6A, ‘‘WT_8 h’’; Supplemental Table S1). Theseresults are consistent with our previous Southern blot-based observations that total scnRNAs extracted fromwild-type cells at 2 h post-mixing hybridized aboutthree times more to Mic DNA than to Mac DNA, whilescnRNAs at 8 h post-mixing hybridized ;22 times moreto Mic DNA than to Mac DNA (Mochizuki and Gorovsky2004a). Therefore, we conclude that scnRNAs complemen-tary to IESs are enriched during conjugation at a genome-wide level.
Enrichment of IES-complementary scnRNAs was alsodetected by analyzing scnRNAs from wild-type cellswithout oxidation (Supplemental Fig. S2). This is notsurprising because almost all scnRNAs in cells at themid to late stages of conjugation (after ;6 h post-mixing)are loaded onto Twi1p (HM Kurth and K Mochizuki, inprep.). Therefore, oxidization-resistant scnRNAs and to-tal scnRNAs during the later stages of conjugation shouldmostly overlap. This result also indicates that the periodateoxidation reaction does not perturb the IES/MDS ratio ofthe cDNA libraries.
A similar scnRNA selection process was detected bymapping scnRNAs to the Cal and LMR loci (Fig. 6B,C).Like the scnRNAs from TWI1 knockout cells (Fig. 3B–E),the majority of oxidation-resistant scnRNAs from wild-type cells at 3 h post-mixing were complementary to IESs,and only a smaller fraction of scnRNAs mapped to MDSs(Fig. 6B,C, ‘‘3h’’). While scnRNAs complementary to IESspersisted through conjugation, those complementary toMDSs were gradually diminished (Fig. 6B,C, peaks markedby pink arrows), and at 8 h post-mixing, most scnRNAswere complementary to IESs (Fig. 6B,C, ‘‘8h’’). Therefore,scnRNA selection occurs at both the genome-wide andlocal levels.
We previously demonstrated that Ema1p, the Twi1p-associated RNA helicase, is required for the degradationof scnRNAs complementary to some MDSs and forproper DNA elimination (Aronica et al. 2008). Therefore,we next analyzed scnRNAs from EMA1 knockout cells.Although scnRNAs complementary to MDSs were re-duced in wild-type cells during conjugation, as describedabove (Fig. 6A–C), scnRNAs complementary to MDSsremained at high levels throughout conjugation in EMA1knockout cells (Supplemental Fig. S3A–C). Therefore, weconclude that EMA1 is required for the genome-wideprocess of scnRNA selection.
Schoeberl et al.
1736 GENES & DEVELOPMENT
Cold Spring Harbor Laboratory Press on November 15, 2021 - Published by genesdev.cshlp.orgDownloaded from
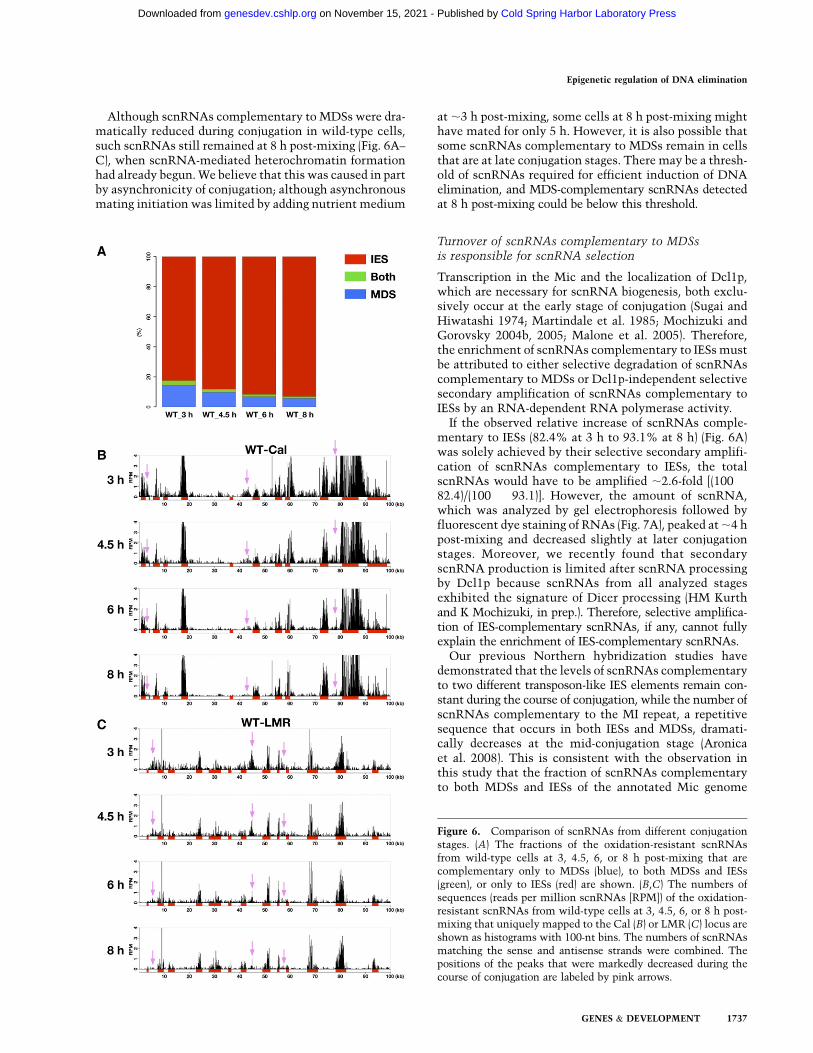
Although scnRNAs complementary to MDSs were dra-matically reduced during conjugation in wild-type cells,such scnRNAs still remained at 8 h post-mixing (Fig. 6A–C), when scnRNA-mediated heterochromatin formationhad already begun. We believe that this was caused in partby asynchronicity of conjugation; although asynchronousmating initiation was limited by adding nutrient medium
at ;3 h post-mixing, some cells at 8 h post-mixing mighthave mated for only 5 h. However, it is also possible thatsome scnRNAs complementary to MDSs remain in cellsthat are at late conjugation stages. There may be a thresh-old of scnRNAs required for efficient induction of DNAelimination, and MDS-complementary scnRNAs detectedat 8 h post-mixing could be below this threshold.
Turnover of scnRNAs complementary to MDSsis responsible for scnRNA selection
Transcription in the Mic and the localization of Dcl1p,which are necessary for scnRNA biogenesis, both exclu-sively occur at the early stage of conjugation (Sugai andHiwatashi 1974; Martindale et al. 1985; Mochizuki andGorovsky 2004b, 2005; Malone et al. 2005). Therefore,the enrichment of scnRNAs complementary to IESs mustbe attributed to either selective degradation of scnRNAscomplementary to MDSs or Dcl1p-independent selectivesecondary amplification of scnRNAs complementary toIESs by an RNA-dependent RNA polymerase activity.
If the observed relative increase of scnRNAs comple-mentary to IESs (82.4% at 3 h to 93.1% at 8 h) (Fig. 6A)was solely achieved by their selective secondary amplifi-cation of scnRNAs complementary to IESs, the totalscnRNAs would have to be amplified ;2.6-fold [(100 �82.4)/(100 � 93.1)]. However, the amount of scnRNA,which was analyzed by gel electrophoresis followed byfluorescent dye staining of RNAs (Fig. 7A), peaked at ;4 hpost-mixing and decreased slightly at later conjugationstages. Moreover, we recently found that secondaryscnRNA production is limited after scnRNA processingby Dcl1p because scnRNAs from all analyzed stagesexhibited the signature of Dicer processing (HM Kurthand K Mochizuki, in prep.). Therefore, selective amplifica-tion of IES-complementary scnRNAs, if any, cannot fullyexplain the enrichment of IES-complementary scnRNAs.
Our previous Northern hybridization studies havedemonstrated that the levels of scnRNAs complementaryto two different transposon-like IES elements remain con-stant during the course of conjugation, while the number ofscnRNAs complementary to the MI repeat, a repetitivesequence that occurs in both IESs and MDSs, dramati-cally decreases at the mid-conjugation stage (Aronicaet al. 2008). This is consistent with the observation inthis study that the fraction of scnRNAs complementaryto both MDSs and IESs of the annotated Mic genome
Figure 6. Comparison of scnRNAs from different conjugationstages. (A) The fractions of the oxidation-resistant scnRNAsfrom wild-type cells at 3, 4.5, 6, or 8 h post-mixing that arecomplementary only to MDSs (blue), to both MDSs and IESs(green), or only to IESs (red) are shown. (B,C) The numbers ofsequences (reads per million scnRNAs [RPM]) of the oxidation-resistant scnRNAs from wild-type cells at 3, 4.5, 6, or 8 h post-mixing that uniquely mapped to the Cal (B) or LMR (C) locus areshown as histograms with 100-nt bins. The numbers of scnRNAsmatching the sense and antisense strands were combined. Thepositions of the peaks that were markedly decreased during thecourse of conjugation are labeled by pink arrows.
GENES & DEVELOPMENT 1737
Epigenetic regulation of DNA elimination
Cold Spring Harbor Laboratory Press on November 15, 2021 - Published by genesdev.cshlp.orgDownloaded from
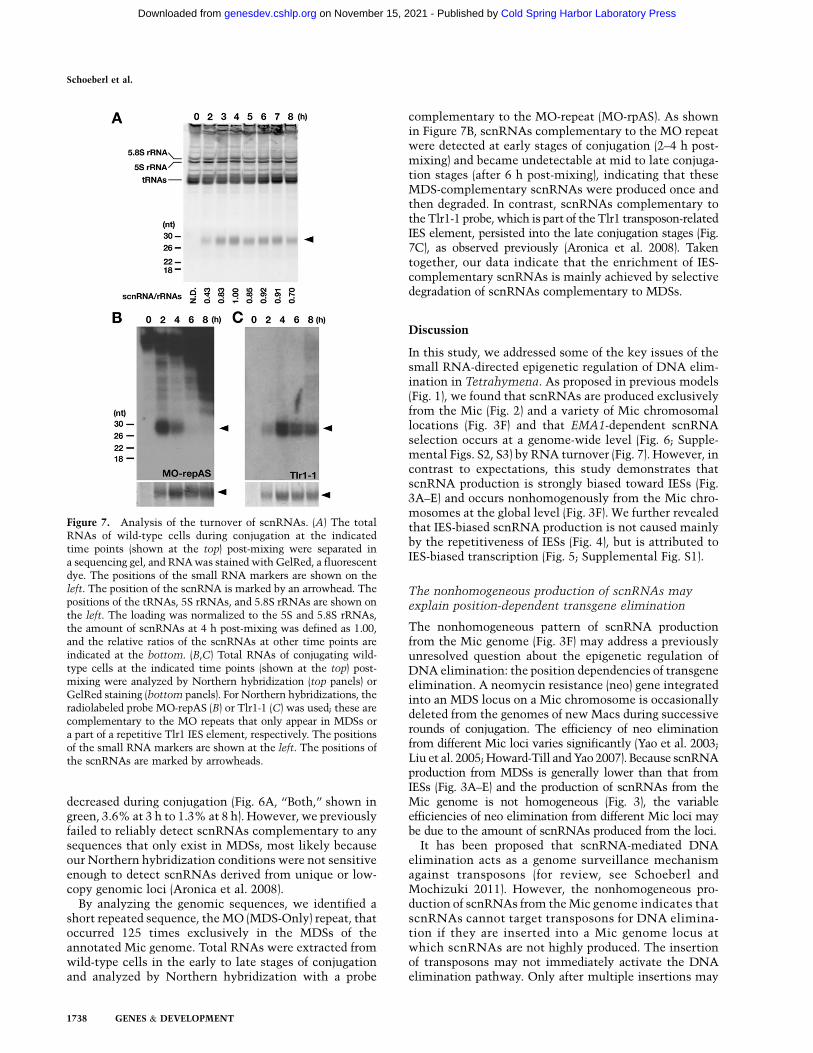
decreased during conjugation (Fig. 6A, ‘‘Both,’’ shown ingreen, 3.6% at 3 h to 1.3% at 8 h). However, we previouslyfailed to reliably detect scnRNAs complementary to anysequences that only exist in MDSs, most likely becauseour Northern hybridization conditions were not sensitiveenough to detect scnRNAs derived from unique or low-copy genomic loci (Aronica et al. 2008).
By analyzing the genomic sequences, we identified ashort repeated sequence, the MO (MDS-Only) repeat, thatoccurred 125 times exclusively in the MDSs of theannotated Mic genome. Total RNAs were extracted fromwild-type cells in the early to late stages of conjugationand analyzed by Northern hybridization with a probe
complementary to the MO-repeat (MO-rpAS). As shownin Figure 7B, scnRNAs complementary to the MO repeatwere detected at early stages of conjugation (2–4 h post-mixing) and became undetectable at mid to late conjuga-tion stages (after 6 h post-mixing), indicating that theseMDS-complementary scnRNAs were produced once andthen degraded. In contrast, scnRNAs complementary tothe Tlr1-1 probe, which is part of the Tlr1 transposon-relatedIES element, persisted into the late conjugation stages (Fig.7C), as observed previously (Aronica et al. 2008). Takentogether, our data indicate that the enrichment of IES-complementary scnRNAs is mainly achieved by selectivedegradation of scnRNAs complementary to MDSs.
Discussion
In this study, we addressed some of the key issues of thesmall RNA-directed epigenetic regulation of DNA elim-ination in Tetrahymena. As proposed in previous models(Fig. 1), we found that scnRNAs are produced exclusivelyfrom the Mic (Fig. 2) and a variety of Mic chromosomallocations (Fig. 3F) and that EMA1-dependent scnRNAselection occurs at a genome-wide level (Fig. 6; Supple-mental Figs. S2, S3) by RNA turnover (Fig. 7). However, incontrast to expectations, this study demonstrates thatscnRNA production is strongly biased toward IESs (Fig.3A–E) and occurs nonhomogenously from the Mic chro-mosomes at the global level (Fig. 3F). We further revealedthat IES-biased scnRNA production is not caused mainlyby the repetitiveness of IESs (Fig. 4), but is attributed toIES-biased transcription (Fig. 5; Supplemental Fig. S1).
The nonhomogeneous production of scnRNAs mayexplain position-dependent transgene elimination
The nonhomogeneous pattern of scnRNA productionfrom the Mic genome (Fig. 3F) may address a previouslyunresolved question about the epigenetic regulation ofDNA elimination: the position dependencies of transgeneelimination. A neomycin resistance (neo) gene integratedinto an MDS locus on a Mic chromosome is occasionallydeleted from the genomes of new Macs during successiverounds of conjugation. The efficiency of neo eliminationfrom different Mic loci varies significantly (Yao et al. 2003;Liu et al. 2005; Howard-Till and Yao 2007). Because scnRNAproduction from MDSs is generally lower than that fromIESs (Fig. 3A–E) and the production of scnRNAs from theMic genome is not homogeneous (Fig. 3), the variableefficiencies of neo elimination from different Mic loci maybe due to the amount of scnRNAs produced from the loci.
It has been proposed that scnRNA-mediated DNAelimination acts as a genome surveillance mechanismagainst transposons (for review, see Schoeberl andMochizuki 2011). However, the nonhomogeneous pro-duction of scnRNAs from the Mic genome indicates thatscnRNAs cannot target transposons for DNA elimina-tion if they are inserted into a Mic genome locus atwhich scnRNAs are not highly produced. The insertionof transposons may not immediately activate the DNAelimination pathway. Only after multiple insertions may
Figure 7. Analysis of the turnover of scnRNAs. (A) The totalRNAs of wild-type cells during conjugation at the indicatedtime points (shown at the top) post-mixing were separated ina sequencing gel, and RNA was stained with GelRed, a fluorescentdye. The positions of the small RNA markers are shown on theleft. The position of the scnRNA is marked by an arrowhead. Thepositions of the tRNAs, 5S rRNAs, and 5.8S rRNAs are shown onthe left. The loading was normalized to the 5S and 5.8S rRNAs,the amount of scnRNAs at 4 h post-mixing was defined as 1.00,and the relative ratios of the scnRNAs at other time points areindicated at the bottom. (B,C) Total RNAs of conjugating wild-type cells at the indicated time points (shown at the top) post-mixing were analyzed by Northern hybridization (top panels) orGelRed staining (bottom panels). For Northern hybridizations, theradiolabeled probe MO-repAS (B) or Tlr1-1 (C) was used; these arecomplementary to the MO repeats that only appear in MDSs ora part of a repetitive Tlr1 IES element, respectively. The positionsof the small RNA markers are shown at the left. The positions ofthe scnRNAs are marked by arrowheads.
1738 GENES & DEVELOPMENT
Schoeberl et al.
Cold Spring Harbor Laboratory Press on November 15, 2021 - Published by genesdev.cshlp.orgDownloaded from

some of the transposons integrate into scnRNA-producingloci, enabling the cells to produce scnRNAs complemen-tary to the transposon to eliminate it. In this way, thenonhomogeneous production of scnRNAs may set a thresh-old for DNA elimination such that only transposons thatcan efficiently multiply in the Mic genome are targeted forDNA elimination.
How does IES-biased scnRNA production occur?
Our unexpected observation that scnRNA production isheavily biased for IESs at the transcriptional level hasraised a new question: How is the IES-biased transcrip-tion of scnRNA precursors achieved? Theoretically,the biased transcription could be mediated by specificDNA sequences that reside in or around all >6000 IESs.However, we believe this is unlikely for two reasons.First, different IESs share no obvious consensus se-quences. Second, the transcriptional start sites of theMic transcripts seem to be distributed across broadregions of the genome (Fig. 5; Supplemental Fig. S1;Chalker and Yao 1996). An alternative mechanism forthe biased transcription is that scnRNAs are transportednot only to the developing new Mac to target IESs forDNA elimination, but also to the new Mic to markIES sites for future transcription. In this way, DNAelimination in the new Mac may be epigenetically andtransgenerationally controlled not only by the genomecontents of the parental Mac through the selectivedegradation of scnRNAs, but also by those of the grandpa-rental Mac through transcriptional regulation of the Mic.
If the latter hypothesis is true, we predict that (1) aprotein other than Twi1p transports scnRNAs to the newMic because Twi1p does not localize to the Mic at anystage (Mochizuki et al. 2002); (2) IESs and MDSs in the Micare differently marked by some chromatin modificationsor chromatin-associated proteins, and this difference ismaintained during vegetative growth (one such candidateis histone H3 Lys 27 methylation, which is maintained inthe Mic during vegetative growth) (Liu et al. 2007); (3) anepigenetic ‘‘block’’ of DNA elimination through the ec-topic introduction of an IES to the parental Mac (Chalkerand Yao 1996) not only inhibits the elimination of the IESin the new Mac, but also inhibits Mic transcription, andthus scnRNA production, from the IES during the conju-gation of the progeny. We await future research that wouldconfirm or reject these predictions and reveal how ances-tral genomes can epigenetically regulate the behavior ofgenomes of successive generations.
Materials and methods
Small RNA cDNA library preparation and sequencing
Wild-type T. thermophila strains B2086 and CU428, Chr4nullisomic strains CU357 and CU367 (Bruns et al. 1983), TWI1
complete (germ plus soma) knockout (Mochizuki and Gorovsky2004a) strains 20-1 and 20-4, and EMA1 knockout (Aronica et al.2008) strains 7-17-1 and 8-6-1 were used for total RNA prepara-tion. B2086, CU428, CU357, and CU367 were obtained from theTetrahymena Stock Center at Cornell University. Cell mating
was induced by mixing equal numbers of prestarved cells of twostrains possessing complementary mating types, and asynchro-nous mating initiation was limited by adding 1/3 vol of 43 SPPat ;3 h post-mixing. RNA was isolated from 2.5 3 106 matingcells at the indicated time points post-mixing with the mirVanamiRNA isolation kit (Ambion) or TRIzol reagent (Invitrogen).For periodate oxidation of small RNAs (Akbergenov et al. 2006),the RNA pellet was dried and resuspended in 17.5 mL of boraxbuffer (4.375 mM borax, 50 mM boric acid at pH 8.6). Then, 2.5mL of 0.2 M sodium periodate was added, and the reactionwas incubated for 10 min at room temperature in the dark. Twomicroliters of glycerol was added, the solution was incubated foranother 10 min at room temperature in the dark, and RNAs werepurified by ethanol precipitation.
cDNA libraries of small RNAs were constructed as de-scribed (Hafner et al. 2008) with some modifications. Inbrief, RNA (with or without periodate oxidation) was mixedwith radiolabeled 26- and 32-nt oligoribonucleotides (59-GUCGUACGCGGAAUAGUUUAAACUGU-39; 59-AUCUUGGUCGUACGCGGAAUAGUUUAAACUGU-39; PmeI restriction sitesare underlined) and fractionated in a sequencing gel, and thegel regions containing the two radiolabeled markers (plus afew bases on both sides) were excised. RNA was recovered fromthe gel and ligated to a 59-adenylated 39 adapter oligonucleotide(59-App-TCGTATGCCGTCTTCTGCTTG-L-39, where L is the 39
OH-blocking group; IDT) by T4 RNA ligase 2-truncated or T4 RNAligase 2-truncated K227Q (New England Biolabs). After gel frac-tionation and purification as above, the product was ligated tothe 59 adapter oligoribonucleotide (59-GUUCAGAGUUCUACAGUCCGACGAUC-39) by T4 RNA ligase (Ambion). The gel-purifiedfinal ligation product was then reverse-transcribed with the Sol-rvprimer (59-CAAGCAGAAGACGGCATACGA-39) and PCR-ampli-fied with the Sol-rv primer and Sol-fw primer (59-AATGATACGGCGACCACCGACAGGTTCAGAGTTCTACAGTCCGA-39). Afterphenol–chloroform extraction followed by ethanol precipitation,the PCR product was digested with PmeI (to cut the size markers)and fractionated by agarose gel electrophoresis, and the undi-gested PCR product was purified from the gel. The amplifiedcDNA libraries were mixed with 1/10 (by mass) of fX174 phageDNA, and single-read 36-base sequences were generated on theIllumina GAII platform, resulting in ;17 million–27 million reads.The fX174 phage DNAwas included because most scnRNAs beginwith 59U (HM Kurth and K Mochizuki, in prep.); therefore,sequencing only scnRNAs disturbs the cluster recognition processduring sequencing reactions. Raw sequencing data and processeddata sets have been deposited at the NCBI Gene ExpressionOmnibus (http://www.ncbi.nih.gov/geo) as GSE38768.
Following the removal of the adapter sequences from thesequence reads, we removed reads containing any non-A/C/G/Tbases; reads from rRNAs, tRNA, snRNAs, and the mitochondrialgenome; and reads from mixed fX174 phage DNA. Then, se-quences from 26- to 32-nt RNAs were used as scnRNA sequences.The first 25 nt of each scnRNA sequence was mapped to theannotated Mic genome, the Cal locus, the LMR locus, or theselected 218 Mac genome scaffolds. After mapping scnRNAs to theCal or LMR locus, the repetitiveness of the genome was normalizedby either dividing the numbers of mapped scnRNAs by theirsequence frequencies in the draft Mic genome (‘‘weighted’’) orexcluding scnRNAs that were complementary to more than twopositions in the Mic genome (‘‘uniquely mapped’’).
Annotation of the draft Mic genome
The draft Mic genome sequence (version 2, supercontigs) wasobtained from the Tetrahymena Comparative Sequencing Pro-ject (Broad Institute of Harvard and Massachussetts Institute of
Epigenetic regulation of DNA elimination
GENES & DEVELOPMENT 1739
Cold Spring Harbor Laboratory Press on November 15, 2021 - Published by genesdev.cshlp.orgDownloaded from

Technology) Web site (http://www.broadinstitute.org). The Macgenome sequence (the version released in October 2008 from theJ. Craig Venter Institute) was obtained from the Tetrahymena
Genome Database (http://ciliate.org). To predict IESs, all scaffoldsof Mac genome sequences were concatenated. The concatenatedsequence was then split into 100-nt sequences, each possessing50-nt overlaps with the neighboring sequences. When a sequencedid not map to the Mic draft genome sequence, the 100-ntsequence was further split into all possible pairs of pieces, both ofwhich contained at least 24 nt. If both pieces mapped to the Micdraft genome sequence with a gap longer than 100 nt and shorterthan 100,000 nt (because all known IESs are ;0.2–20 kb), the gapsequence was stored as an IES candidate. The prediction wasfurther tested by comparing 200-nt sequences upstream of anddownstream from the IES sites in the draft Mic genome and theMac genome. Only when these 200-nt sequences were identicalbetween the Mac and the Mic did we use the gap sequences asIESs. By this method, we predicted 8721 IESs (28.0 Mb in total).The positions of predicted IESs are listed in Supplemental TableS3. We likely underestimated the number of IESs in this pre-diction because we defined an IES only when it was assembled inthe draft Mic genome with at least 200-bp flanking MDSs at bothends, while the median size of the supercontigs of the draft Micgenome was 2.3 kb and the median size of the predicted IESs was2.7 kb. Moreover, many repetitive sequences, which were ex-pected to be enriched in the IESs, may have failed to be assem-bled in the current Mic draft genome obtained by short-readpyrosequencing. Therefore, we also included unassembled DNAsequences that were obtained by an independent Mic genomeSanger sequencing and that did not map to the Mac genomesequence (Fass et al. 2011) as IESs. As MDSs, we used the Macgenome scaffolds that were confirmed to be enriched in the Macby a microarray study (102.8 Mb in total) (Coyne et al. 2008).Then, all possible 25-nt sequences were extracted from the draftMic genome, and any sequences containing non-A/C/G/T baseswere removed and mapped to the IESs and MDSs described aboveto prepare the ‘‘annotated’’ Mic draft genome. Among the 147.3Mb of the draft Mic genome, 25-nt sequences correspondingto 98.8 Mb, 33.1 Mb, and 3.0 Mb of genome were found only inMDSs, only in IESs, and in both MDSs and IESs, respectively.The remaining 12.8 Mb could not be annotated. The annotatedMic genome sequence was used for mapping scnRNAs (Figs. 3, 4,6; Supplemental Figs. S2, S3; Supplemental Table S1). To analyzethe repeat bias of the scnRNA origin (Fig. 4), all possible 25-ntsequences of the draft Mic genome were classified among threeclasses: Unique (25-nt sequences that appeared only once in thedraft genome), Mid-Rep (appeared two to nine times), and High-Rep (appeared >10 times). Four 100-kb Mic regions containing,respectively, (1) the calmodulin gene and Cal-IES (Cal locus,corresponding to 127,977–277,725 bases of supercontig 2.218 inthe second assembly of the draft Mic genome sequence); (2) theL-IES, M-IES, and R-IES (LMR locus, corresponding to 64,932–165,807 bases of supercontig 2.231); (3) the NgoA gene (NgoAlocus, corresponding to 159,772–259,771 bases of supercontig2.97); and (4) the TTHERM_01062860 gene (TTHERM_01062860locus, corresponding to 120,184–220,187 bases of supercontig2.116) were selected to locally map scnRNAs or GRO-seq reads(Figs. 2, 3, 5, 6; Supplemental Figs. S1, S3). By manually comparingthem with the corresponding Mac genome regions, the positionsof IESs in these loci were annotated, some gaps were filled, andpotential misassemblies were corrected.
GRO-seq
Nuclear fractions were isolated from wild-type strains B2086and CU428 at 2 h post-mixing as described previously (Sweet
and Allis 2006) with some modifications. All fractionationsteps were performed at 4°C or on ice. Cells (1.2 3 108) weresuspended in 100 mL of medium B and blended for 30 sec at thehighest speed (Waring 7009G commercial blender). Sampleswere divided among two 50-mL conical tubes and centrifugedwith a swing rotor at 1750g, 2750g, 3300g, and 4200g for 5 mineach and twice at 4500g for 10 min. The supernatants of each stepwere blended as above for 20 sec and then centrifuged at thesubsequent speed. Each pellet was washed once in modified nucleiresuspension buffer (NRB; 50 mM Tris-Cl at pH 8.0, 30% glycerol,5 mM MgCl2, 0.1 mM EDTA), resuspended in 200 mL of NRB (per50-mL tube), and stored at �80°C. A portion of the pellet wasremoved for DAPI staining, and the ratios between the Mac andMic and the concentrations of nuclei were examined on a hemo-cytometer. The Mic-enriched nuclear fraction used for the exper-iments shown in Figure 5 and Supplemental Figure S1 consisted of;99.5% Mic and ;0.5% Mac, as judged by the sizes of the nuclei.
Mic-enriched nuclear fractions were used to identify nascenttranscription by applying the GRO-seq technique (Core et al.2008) with some modifications. Briefly, ;1.3 3 107 nuclei of theMic-enriched fraction were used for the run-on reaction, whichcontained 500 mM ATP, 500 mM GTP, 500 mM BrUTP, and 0.33mM a-32PCTP. After DNase I treatment, the total RNA wasisolated with TRIzol LS reagent (Invitrogen) and resuspended in20 mL of water. Base hydrolysis was performed for 20 min on iceto digest RNA products to ;30–250 nt. The RNAs were treatedwith DNase I again, and RNA was purified twice through P30spin columns (Bio-Rad). BrdU-incorporated RNA was enrichedon anti-BrdU beads (Santa Cruz Biotechnology) for 2 h at 4°C andresuspended in 21 mL of water. A 20-mL aliquot of the RNA wasend-repaired and resuspended in 10.5 mL of water.
cDNA was synthesized as described above in the section‘‘Small RNA cDNA Library Preparation and Sequencing’’ withsome modifications. For 39 adapter ligation, 10 mL of the end-repaired RNAs was incubated with 1 mL of 50 mM 39 adapter, 0.5mL of Ribolock (Fermentas), 2.15 mL of ATP-free T4 RNA ligasebuffer, 6 mL of 50% PEG-8000, and 2 mL of T4 RNA ligase2-truncated K227Q (New England Biolabs) overnight at 16°C.The RNAs were enriched on anti-BrdU beads as above andresuspended in 10 mL of water. For 59 adapter ligation, 10 mL of39 adapter-ligated RNAs was incubated with 1 mL of 50 mM59 adapter, 0.5 mL of Ribolock, 2.2 mL of T4 RNA ligase buffer, 1mL of 10 mM ATP, 6 mL of 50% PEG-8000, and 2 mL of T4 RNAligase (Ambion) overnight at 16°C. The RNAs were purifiedagain with anti-BrdU beads and resuspended in 10 mL of water.The adapter-ligated RNA was incubated with 2 mL of 10 mM Sol-rv primer and 1 mL of 10 mM dNTP mix for 5 min at 65°C and for2 min on ice. Then, 4 mL of 53 first strand buffer, 1 mL of 0.1 MDTT, 1 mL of Ribolock, and 1 mL of SuperScript III reverse tran-scriptase (Invitrogen) were added. The mixture was incubated for30 min at 50°C, for 30 min at 55°C, and for 15 min at 70°C. Then,5 U of RNase H (Ambion) was added, followed by incubation for10 min at 37°C. The cDNA was amplified by subjecting 9.5 mL ofthe reaction to 17 cycles of PCR with KAPA Hifi Hot Start DNApolymerase (Kapa Biosystems) and Sol-fw and Sol-rv primers.The amplified cDNA library was fractionated in a 2% agarosegel; ;100- to 200-base pair (bp) products were extracted, andsingle-read 50-base sequences were generated on a HiSeq 2000platform (Illumina) to obtain ;200 million reads. Raw sequenc-ing data and processed data sets have been deposited at the NCBIGene Expression Omnibus (http://www.ncbi.nih.gov/geo) asGSE38768. Reads containing any non-A/C/G/T bases and readsderived from rRNAs, tRNAs, snRNAs, and the mitochondrialgenome were removed. The first 25 nt of each GRO-seq read wasused to uniquely map the representative Mic loci.
Schoeberl et al.
1740 GENES & DEVELOPMENT
Cold Spring Harbor Laboratory Press on November 15, 2021 - Published by genesdev.cshlp.orgDownloaded from

RNA staining and Northern hybridization
Total RNA was isolated with TRIzol (Invitrogen). The total RNAfrom 1 3 105 cells was separated in a 15% sequencing gel, andRNAs were stained with GelRed (Gentaur). RNA was then blot-ted onto a nitrocellulose membrane and probed with 32P-labeledoligo DNA probes as described previously (Aronica et al. 2008).The probes used in this study were Tlr1-1 (Aronica et al. 2008),which is complementary to the Tlr1 transposon-like IES, andMO-repAS (59-TTTTACCCAAGATAAAGTGTCAAATTTGAGAGATTAGTGCAATTTGCTAA-39; the MO repeat is under-lined), which is complementary to the MDS-limited MO repeat.The MO repeat (59-ACTAATCTCTCAAATTTGACACTTT-39)was identified as the most repetitive 25-nt sequence that onlyexisted in the annotated MDSs.
Acknowledgments
We thank Kathleen Collins for sharing Mic genome Sanger se-quencing data, Eileen Hamilton and Ed Orias for sharing Micchromosomal location data, Grzegorz Sienski for technical ad-vice on GRO-seq, and Julius Brennecke and Josef Loidl and theirlaboratories for discussions and technical advice. The researchleading to these results was supported by an ERC Starting Grant(204986) under the European Community’s Seventh FrameworkProgramme, by the Doktoratskolleg RNA Biology (W1207-B09)and the Special Research Program (SFB) ‘‘RNA Regulation of theTranscriptome’’ (F4307-B09) from the Austrian Science Fund(FWF), and by core funding from the Austrian Academy ofSciences to K.M.
References
Akbergenov R, Si-Ammour A, Blevins T, Amin I, Kutter C,Vanderschuren H, Zhang P, Gruissem W, Meins Jr F, Hohn T,
et al. 2006. Molecular characterization of geminivirus-
derived small RNAs in different plant species. Nucleic Acids
Res 34: 462–471.Aronica L, Bednenko J, Noto T, Desouza LV, Siu KW, Loidl J,
Pearlman RE, Gorovsky MA, Mochizuki K. 2008. Study of an
RNA helicase implicates small RNA-noncoding RNA inter-actions in programmed DNA elimination in Tetrahymena.
Genes Dev 22: 2228–2241.Austerberry CF, Allis CD, Yao MC. 1984. Specific DNA rear-
rangements in synchronously developing nuclei of Tetrahy-
mena. Proc Natl Acad Sci 81: 7383–7387.Austerberry CF, Snyder RO, Yao MC. 1989. Sequence micro-
heterogeneity is generated at junctions of programmed DNA
deletions in Tetrahymena thermophila. Nucleic Acids Res
17: 7263–7272.Brennecke J, Malone CD, Aravin AA, Sachidanandam R, Stark
A, Hannon GJ. 2008. An epigenetic role for maternally in-
herited piRNAs in transposon silencing. Science 322: 1387–
1392.Bruns PJ, Brussard TB, Merriam EV. 1983. Nullisomic Tetrahy-
mena. II. A set of nullisomics define the germinal chromo-
somes. Genetics 104: 257–270.Chalker DL, Yao MC. 1996. Non-Mendelian, heritable blocks to
DNA rearrangement are induced by loading the somatic
nucleus of Tetrahymena thermophila with germ line-limitedDNA. Mol Cell Biol 16: 3658–3667.
Chalker DL, Yao MC. 2001. Nongenic, bidirectional transcrip-
tion precedes and may promote developmental DNA dele-
tion in Tetrahymena thermophila. Genes Dev 15: 1287–1298.
Chalker DL, Fuller P, Yao MC. 2005. Communication betweenparental and developing genomes during Tetrahymena nu-clear differentiation is likely mediated by homologousRNAs. Genetics 169: 149–160.
Cheng CY, Vogt A, Mochizuki K, Yao MC. 2010. A domesti-cated piggyBac transposase plays a key role in heterochro-matin dynamics and DNA cleavage during programmedDNA deletion in Tetrahymena thermophila. Mol Biol Cell
21: 1753–1762.Core LJ, Waterfall JJ, Lis JT. 2008. Nascent RNA sequencing
reveals widespread pausing and divergent initiation at hu-man promoters. Science 322: 1845–1848.
Coyne RS, Nikiforov MA, Smothers JF, Allis CD, Yao MC. 1999.Parental expression of the chromodomain protein Pdd1p isrequired for completion of programmed DNA eliminationand nuclear differentiation. Mol Cell 4: 865–872.
Coyne RS, Thiagarajan M, Jones KM, Wortman JR, Tallon LJ, HaasBJ, Cassidy-Hanley DM, Wiley EA, Smith JJ, Collins K, et al.2008. Refined annotation and assembly of the Tetrahymena
thermophila genome sequence through EST analysis, compar-ative genomic hybridization, and targeted gap closure. BMCGenomics 9: 562. doi: 10.1186/1471-2164-9-562.
Cubas P, Vincent C, Coen E. 1999. An epigenetic mutationresponsible for natural variation in floral symmetry. Nature
401: 157–161.Duharcourt S, Butler A, Meyer E. 1995. Epigenetic self-regulation
of developmental excision of an internal eliminated sequenceon Paramecium tetraurelia. Genes Dev 9: 2065–2077.
Fass JN, Joshi NA, Couvillion MT, Bowen J, Gorovsky MA,Hamilton EP, Orias E, Hong K, Coyne RS, Eisen JA, et al.2011. Genome-scale analysis of programmed DNA elimina-tion sites in Tetrahymena thermophila. G3 (Bethesda) 1:515–522.
Fillingham JS, Thing TA, Vythilingum N, Keuroghlian A, BrunoD, Golding GB, Pearlman RE. 2004. A non-long terminalrepeat retrotransposon family is restricted to the germ linemicronucleus of the ciliated protozoan Tetrahymena ther-mophila. Eukaryot Cell 3: 157–169.
Hafner M, Landgraf P, Ludwig J, Rice A, Ojo T, Lin C, Holoch D,Lim C, Tuschl T. 2008. Identification of microRNAs andother small regulatory RNAs using cDNA library sequenc-ing. Methods 44: 3–12.
Howard-Till RA, Yao MC. 2007. Tudor nuclease genes andprogrammed DNA rearrangements in Tetrahymena thermo-
phila. Eukaryot Cell 6: 1795–1804.Katoh M, Hirono M, Takemasa T, Kimura M, Watanabe Y. 1993.
A micronucleus-specific sequence exists in the 59-upstreamregion of calmodulin gene in Tetrahymena thermophila.
Nucleic Acids Res 21: 2409–2414.Koizumi S, Kobayashi S. 1989. Microinjection of plasmid DNA
encoding the A surface antigen of Paramecium tetraurelia
restores the ability to regenerate a wild-type macronucleus.Mol Cell Biol 9: 4398–4401.
Kurth HM, Mochizuki K. 2009. 29-O-methylation stabilizesPiwi-associated small RNAs and ensures DNA eliminationin Tetrahymena. RNA 15: 675–685.
Lee SR, Collins K. 2006. Two classes of endogenous small RNAsin Tetrahymena thermophila. Genes Dev 20: 28–33.
Liu Y, Mochizuki K, Gorovsky MA. 2004. Histone H3 lysine 9methylation is required for DNA elimination in developingmacronuclei in Tetrahymena. Proc Natl Acad Sci 101: 1679–1684.
Liu Y, Song X, Gorovsky MA, Karrer KM. 2005. Elimination offoreign DNA during somatic differentiation in Tetrahymenathermophila shows position effect and is dosage dependent.Eukaryot Cell 4: 421–431.
Epigenetic regulation of DNA elimination
GENES & DEVELOPMENT 1741
Cold Spring Harbor Laboratory Press on November 15, 2021 - Published by genesdev.cshlp.orgDownloaded from
Liu Y, Taverna SD, Muratore TL, Shabanowitz J, Hunt DF, AllisCD. 2007. RNAi-dependent H3K27 methylation is requiredfor heterochromatin formation and DNA elimination inTetrahymena. Genes Dev 21: 1530–1545.
Malone CD, Anderson AM, Motl JA, Rexer CH, Chalker DL.2005. Germ line transcripts are processed by a Dicer-likeprotein that is essential for developmentally programmedgenome rearrangements of Tetrahymena thermophila. Mol
Cell Biol 25: 9151–9164.Martindale DW, Allis CD, Bruns PJ. 1985. RNA and protein
synthesis during meiotic prophase in Tetrahymena thermo-
phila. J Protozool 32: 644–649.Miao W, Xiong J, Bowen J, Wang W, Liu Y, Braguinets O, Grigull
J, Pearlman RE, Orias E, Gorovsky MA. 2009. Microarrayanalyses of gene expression during the Tetrahymena thermo-
phila life cycle. PLoS ONE 4: e4429. doi: 10.1371/journal.pone.0004429.
Mochizuki K. 2010. RNA-directed epigenetic regulation of DNArearrangements. Essays Biochem 48: 89–100.
Mochizuki K, Gorovsky MA. 2004a. Conjugation-specific smallRNAs in Tetrahymena have predicted properties of scan(scn) RNAs involved in genome rearrangement. Genes Dev
18: 2068–2073.Mochizuki K, Gorovsky MA. 2004b. RNA polymerase II local-
izes in Tetrahymena thermophila meiotic micronuclei whenmicronuclear transcription associated with genome rear-rangement occurs. Eukaryot Cell 3: 1233–1240.
Mochizuki K, Gorovsky MA. 2004c. Small RNAs in genomerearrangement in Tetrahymena. Curr Opin Genet Dev 14:181–187.
Mochizuki K, Gorovsky MA. 2005. A Dicer-like protein inTetrahymena has distinct functions in genome rearrange-ment, chromosome segregation, and meiotic prophase. GenesDev 19: 77–89.
Mochizuki K, Fine NA, Fujisawa T, Gorovsky MA. 2002.Analysis of a piwi-related gene implicates small RNAs ingenome rearrangement in Tetrahymena. Cell 110: 689–699.
Morgan HD, Sutherland HG, Martin DI, Whitelaw E. 1999.Epigenetic inheritance at the agouti locus in the mouse. Nat
Genet 23: 314–318.Noto T, Kurth HM, Kataoka K, Aronica L, Desouza LV, Siu KW,
Pearlman RE, Gorovsky MA, Mochizuki K. 2010. The Tetra-
hymena Argonaute-binding protein Giw1p directs a matureArgonaute–siRNA complex to the nucleus. Cell 140: 692–703.
Schoeberl UE, Mochizuki K. 2011. Keeping the soma free oftransposons: Programmed DNA elimination in ciliates. J Biol
Chem 286: 37045–37052.Sugai T, Hiwatashi K. 1974. Cytologic and autoradiographic
studies of the micronucleus at meiotic prophase in Tetrahy-mena pyriformis. J Protozool 21: 542–548.
Sweet MT, Allis CD. 2006. Isolation and purification of Tetra-
hymena nuclei. Cold Spring Harb Protoc 2006: doi: 10.1101/pdb.prot4500.
Taverna SD, Coyne RS, Allis CD. 2002. Methylation of histoneh3 at lysine 9 targets programmed DNA elimination inTetrahymena. Cell 110: 701–711.
Wuitschick JD, Gershan JA, Lochowicz AJ, Li S, Karrer KM.2002. A novel family of mobile genetic elements is limited tothe germline genome in Tetrahymena thermophila. Nucleic
Acids Res 30: 2524–2537.Yao MC, Gorovsky MA. 1974. Comparison of the sequences of
macro- and micronuclear DNA of Tetrahymena pyriformis.
Chromosoma 48: 1–18.Yao MC, Duharcourt S, Chalker DL. 2002. Genome-wide
rearrangements of DNA in ciliates. In Mobile DNA II (ed.N Craig et al.), pp. 730–758. Academic Press, New York.
Yao MC, Fuller P, Xi X. 2003. Programmed DNA deletion asan RNA-guided system of genome defense. Science 300:1581–1584.
You Y, Aufderheide K, Morand J, Rodkey K, Forney J. 1991.Macronuclear transformation with specific DNA frag-ments controls the content of the new macronucleargenome in Paramecium tetraurelia. Mol Cell Biol 11:1133–1137.
1742 GENES & DEVELOPMENT
Schoeberl et al.
Cold Spring Harbor Laboratory Press on November 15, 2021 - Published by genesdev.cshlp.orgDownloaded from

10.1101/gad.196493.112Access the most recent version at doi: 26:2012, Genes Dev.
Ursula E. Schoeberl, Henriette M. Kurth, Tomoko Noto, et al.
Tetrahymenathe pattern of DNA elimination in Biased transcription and selective degradation of small RNAs shape
Material
Supplemental
http://genesdev.cshlp.org/content/suppl/2012/08/01/26.15.1729.DC1
Related Content
Genes Dev. August , 2012 26: 1774-1779
Shan Gao and Yifan LiuIntercepting noncoding messages between germline and soma
References
http://genesdev.cshlp.org/content/26/15/1729.full.html#related-urls
Articles cited in:
http://genesdev.cshlp.org/content/26/15/1729.full.html#ref-list-1This article cites 44 articles, 23 of which can be accessed free at:
License
ServiceEmail Alerting
click here.right corner of the article or
Receive free email alerts when new articles cite this article - sign up in the box at the top
Copyright © 2012 by Cold Spring Harbor Laboratory Press
Cold Spring Harbor Laboratory Press on November 15, 2021 - Published by genesdev.cshlp.orgDownloaded from