Bias in Dobson total ozone measurements at high latitudes ... · due to approximations in...
10
Bias in Dobson total ozone measurements at high latitudes due to approximations in calculations of ozone absorption coefficients and air mass G. Bernhard, 1 R. D. Evans, 2 G. J. Labow, 3 and S. J. Oltmans 2 Received 29 October 2004; revised 14 January 2005; accepted 10 February 2005; published 20 May 2005. [1] The Dobson spectrophotometer is the primary standard instrument for ground-based measurements of total column ozone. The accuracy of its data depends on the knowledge of ozone absorption coefficients used for data reduction. We document an error in the calculations that led to the set of absorption coefficients currently recommended by the World Meteorological Organisation (WMO). This error has little effect because an empirical adjustment was applied to the original calculations before the coefficients were adopted by WMO. We provide evidence that this adjustment was physically sound. The coefficients recommended by WMO are applied in the Dobson network without correction for the temperature dependence of the ozone absorption cross sections. On the basis of data measured by Dobson numbers 80 and 82, which were operated by the National Oceanic and Atmospheric Administration (NOAA) Climate Monitoring and Diagnostics Laboratory at the South Pole, we find that omission of temperature corrections may lead to systematic errors in Dobson ozone data of up to 4%. The standard Dobson ozone retrieval method further assumes that the ozone layer is located at a fixed height. This approximation leads to errors in air mass calculations, which are particularly relevant at high latitudes where ozone measurements are performed at large solar zenith angles (SZA). At the South Pole, systematic errors caused by this approximation may exceed 2% for SZAs larger than 80°. The bias is largest when the vertical ozone distribution is distorted by the ‘‘ozone hole’’ and may lead to underestimation of total ozone by 4% at SZA = 85° (air mass 9). Dobson measurements at the South Pole were compared with ozone data from a collocated SUV-100 UV spectroradiometer and Version 8 overpass data from NASA’s Total Ozone Mapping Spectrometer (TOMS). Uncorrected Dobson ozone values tend to be lower than data from the two other instruments when total ozone is below 170 Dobson units or SZAs are larger than 80°. When Dobson measurements are corrected for the temperature dependence of the ozone absorption cross section and accurate air mass calculations are implemented, data from the three instruments agree with each other to within ±2% on average and show no significant dependence on SZA or total ozone. Citation: Bernhard, G., R. D. Evans, G. J. Labow, and S. J. Oltmans (2005), Bias in Dobson total ozone measurements at high latitudes due to approximations in calculations of ozone absorption coefficients and air mass, J. Geophys. Res., 110, D10305, doi:10.1029/2004JD005559. 1. Introduction [2] The Dobson spectrophotometer was developed by G. M. B. Dobson in the 1920s [Dobson and Harrison, 1926; Dobson, 1931] and is still the standard instrument for measuring the atmospheric total ozone column. Climate Monitoring and Diagnostics Laboratory (CMDL) maintains 15 instruments, and operates the World Dobson Ozone Calibration Centre under the auspices of WMO’s Global Atmosphere Watch program. There are about 100 Dobson instruments in operation worldwide. A list of stations can be found on the website http://www.chmi.cz/meteo/ozon/ dobsonweb/stations.htm. Total ozone can be calculated from direct Sun or zenith sky observations. Here we discuss direct Sun measurements only. [3] The Dobson instrument, its measurement errors, and calibration procedures have been described in several pub- lications [e.g., Komhyr, 1980a; Basher, 1982; Komhyr et al., 1989]. Measurement errors typically increase under low- Sun conditions. For example, direct Sun measurements are always contaminated to some degree by diffuse radiation scattered by air molecules into the Dobson’s field of view. As the Sun sets, the relative contribution of diffuse radiation increases. This can result in an apparent decrease in ozone, since diffuse radiation is less attenuated by ozone than JOURNAL OF GEOPHYSICAL RESEARCH, VOL. 110, D10305, doi:10.1029/2004JD005559, 2005 1 Biospherical Instruments, Inc., San Diego, California, USA. 2 Climate Monitoring and Diagnostics Laboratory, NOAA, Boulder, Colorado, USA. 3 NASA Goddard Space Flight Center, Greenbelt, Maryland, USA. Copyright 2005 by the American Geophysical Union. 0148-0227/05/2004JD005559$09.00 D10305 1 of 10
Transcript of Bias in Dobson total ozone measurements at high latitudes ... · due to approximations in...

Bias in Dobson total ozone measurements at high latitudes
due to approximations in calculations of ozone absorption
coefficients and air mass
G. Bernhard,1 R. D. Evans,2 G. J. Labow,3 and S. J. Oltmans2
Received 29 October 2004; revised 14 January 2005; accepted 10 February 2005; published 20 May 2005.
[1] The Dobson spectrophotometer is the primary standard instrument for ground-basedmeasurements of total column ozone. The accuracy of its data depends on the knowledge ofozone absorption coefficients used for data reduction. We document an error in thecalculations that led to the set of absorption coefficients currently recommended by theWorld Meteorological Organisation (WMO). This error has little effect because anempirical adjustment was applied to the original calculations before the coefficients wereadopted by WMO. We provide evidence that this adjustment was physically sound. Thecoefficients recommended by WMO are applied in the Dobson network without correctionfor the temperature dependence of the ozone absorption cross sections. On the basis ofdata measured by Dobson numbers 80 and 82, which were operated by the National Oceanicand Atmospheric Administration (NOAA) Climate Monitoring and Diagnostics Laboratoryat the South Pole, we find that omission of temperature corrections may lead to systematicerrors in Dobson ozone data of up to 4%. The standard Dobson ozone retrieval methodfurther assumes that the ozone layer is located at a fixed height. This approximation leads toerrors in air mass calculations, which are particularly relevant at high latitudes where ozonemeasurements are performed at large solar zenith angles (SZA). At the South Pole,systematic errors caused by this approximationmay exceed 2% for SZAs larger than 80�. Thebias is largest when the vertical ozone distribution is distorted by the ‘‘ozone hole’’ and maylead to underestimation of total ozone by 4% at SZA = 85� (air mass 9). Dobsonmeasurements at the South Pole were compared with ozone data from a collocatedSUV-100 UV spectroradiometer and Version 8 overpass data from NASA’s TotalOzone Mapping Spectrometer (TOMS). Uncorrected Dobson ozone values tend to belower than data from the two other instruments when total ozone is below 170 Dobsonunits or SZAs are larger than 80�. When Dobson measurements are corrected for thetemperature dependence of the ozone absorption cross section and accurate air masscalculations are implemented, data from the three instruments agree with each other towithin ±2% on average and show no significant dependence on SZA or total ozone.
Citation: Bernhard, G., R. D. Evans, G. J. Labow, and S. J. Oltmans (2005), Bias in Dobson total ozone measurements at high
latitudes due to approximations in calculations of ozone absorption coefficients and air mass, J. Geophys. Res., 110, D10305,
doi:10.1029/2004JD005559.
1. Introduction
[2] The Dobson spectrophotometer was developed byG. M. B. Dobson in the 1920s [Dobson and Harrison,1926; Dobson, 1931] and is still the standard instrument formeasuring the atmospheric total ozone column. ClimateMonitoring and Diagnostics Laboratory (CMDL) maintains15 instruments, and operates the World Dobson OzoneCalibration Centre under the auspices of WMO’s Global
Atmosphere Watch program. There are about 100 Dobsoninstruments in operation worldwide. A list of stations canbe found on the website http://www.chmi.cz/meteo/ozon/dobsonweb/stations.htm. Total ozone can be calculatedfrom direct Sun or zenith sky observations. Here we discussdirect Sun measurements only.[3] The Dobson instrument, its measurement errors, and
calibration procedures have been described in several pub-lications [e.g., Komhyr, 1980a; Basher, 1982; Komhyr et al.,1989]. Measurement errors typically increase under low-Sun conditions. For example, direct Sun measurements arealways contaminated to some degree by diffuse radiationscattered by air molecules into the Dobson’s field of view.As the Sun sets, the relative contribution of diffuse radiationincreases. This can result in an apparent decrease in ozone,since diffuse radiation is less attenuated by ozone than
JOURNAL OF GEOPHYSICAL RESEARCH, VOL. 110, D10305, doi:10.1029/2004JD005559, 2005
1Biospherical Instruments, Inc., San Diego, California, USA.2Climate Monitoring and Diagnostics Laboratory, NOAA, Boulder,
Colorado, USA.3NASA Goddard Space Flight Center, Greenbelt, Maryland, USA.
Copyright 2005 by the American Geophysical Union.0148-0227/05/2004JD005559$09.00
D10305 1 of 10

direct radiation at short wavelengths and large SZAs[Josefsson, 1992; Nichol and Valenti, 1993]. At low Sun,errors can also arise due to light scattering within theDobson instrument [Komhyr, 1980b].[4] In this paper, we focus on two additional sources of
error: (1) the effects of temperature and vertical ozonedistribution (i.e., the ozone profile) on the values of ozoneabsorption coefficients used to calculate total ozone fromDobson raw data and (2) systematic errors due to approx-imations in air mass calculations. Error source 1 is relevantat all locations and is well recognized. For example,Komhyr et al. [1993] calculated ozone absorption coeffi-cients using 46 combinations of 11 temperature profilesand 22 ozone profiles. The resulting values of the absorp-tion coefficient for Dobson AD-pair measurements variedbetween 1.3971 and 1.4664; the standard deviation of the46 different values was 0.016. Brinksma et al. [2000]studied the effect of the annual cycle of the temperatureprofile on Dobson AD-pair measurements at Lauder, NewZealand (45�S, 170�E). They found systematic errors inDobson results with an amplitude of 2% if the effect oftemperature on the absorption cross section is not cor-rected. Van Roozendael et al. [1998] performed a similaranalysis for Arosa, Switzerland (46�N, 9�E), and foundthat the seasonal change in the atmospheric temperatureaccounts for a seasonal variation of uncorrected Dobsondata with an amplitude of 0.9% and a systematic offset ofapproximately 1%. All previous calculations did not con-sider latitudes larger than 75�. Cooler stratospheric temper-atures at high latitudes could lead to larger systematicerrors. Error source 2 becomes important when ozonemeasurements are performed at large SZAs, a commonoccurrence at high latitudes.
2. Theoretical Background
2.1. Measurement Equation
[5] According to Beer-Lambert’s law, spectral irradianceE(l) from the direct solar beam at the Earth’s surface iscalculated:
E lð Þ ¼ E0 lð Þ10�a lð ÞXm�b lð ÞpSp0mR�d lð Þma ð1Þ
where
E(l) direct normal irradiance at the surface at wave-length l;
E0 (l) extraterrestrial irradiance at wavelength l;a(l) monochromatic ozone absorption coefficient (base
10) at wavelength l (calculations are presented onthe basis of ‘‘base 10’’ rather than ‘‘base e’’ tobetter compare with historic data);
X total column ozone;m relative optical air mass corresponding to ozone
absorption (see section 2.3 for definition of relativeoptical air mass);
b(l) Rayleigh optical depth (base 10) at 1013.25 hPa;pS station pressure;p0 mean sea level pressure (1013.25 hPa);mR relative optical air mass corresponding to Rayleigh
scattering (extinction);d(l) aerosol optical depth (base 10) at wavelength l;ma relative optical air mass corresponding to aerosol
scattering (extinction).
[6] The Dobson spectrophotometer does not measureirradiance at a single wavelength but instead determinesthe difference between irradiance at two wavelengths, onestrongly and the other weakly affected by ozone absorption.Several wavelength pairs are used in Dobson spectrometry(Table 1). The expression for calculating total ozone usingwavelength pair observations is obtained by evaluatingequation (1) for two different wavelengths, l and l0 withl < l0. By taking the logarithm of the two equationsassociated with l and l0 and calculating their difference,the following expression for the total column ozone X isderived [Komhyr, 1980b; Basher, 1982]:
X ¼N � b lð Þ � b l0ð Þ½ � pS
p0mR � d lð Þ � d l0ð Þ½ �ma
a lð Þ � a l0ð Þ½ �m ; ð2Þ
where N = log[E0(l)/E0(l0)] � log[E(l)/E(l0)].
[7] Since the aerosol optical depth is usually not wellknown, ozone retrievals with the standard Dobson methodare based on a combination of two wavelength-pairmeasurements. For example, when the A and D wavelengthpairs (Table 1) are used, X is calculated with
X ¼NA � ND � DbAD
pSp0mR � DdADma
DaADmð3Þ
where
NA = log[E0(305.5)/E0(325)] � log[E(305.5)/E(325)],ND = log[E0(317.5)/E0(339.9)] � log[E(317.5)/
E(339.9)],DaAD = [a(305.5) � a(325)] � [a(317.5) � a(339.9)],DbAD = [b(305.5) � b(325)] � [b(317.5) � b(339.9)],DdAD = [d(305.5) � d(325)] � [d(317.5) � d(339.9)],and wavelength arguments are given in nm. Total ozone canalso be calculated from other wavelength double pairs, suchas the CD pair, by modifying equation (3) accordingly[Basher, 1982].[8] Using the ‘‘double-pair technique’’ mostly eliminates
the effect of aerosols on ozone retrievals [Basher, 1982].This is particularly the case at high southern latitudes whereaerosol concentrations are low. Aerosol optical depth d(l)can be approximated with Angstrom’s turbidity formulad(l) = (b/ln(10))(l/1000)�a, where l is wavelength in nm.During periods with background aerosol conditions at theSouth Pole, the coefficients a and b are approximately 1.5 and0.007, respectively [Climate Monitoring and DiagnosticsLaboratory (CMDL), 2004, Figure 3.32], leading to DdAD =�0.00006 and DdCD = �0.00003. Although DdAD can be ashigh as�0.001 during periods affected by volcanic aerosols,the value is still very small compared to the term for ozoneabsorption (DaAD = 1.432). The effect of aerosols is thereforeignored in the following calculations.
2.2. Calculation of Effective Ozone AbsorptionCoefficients ––Ai
[9] The absorption coefficients a(l) are calculated fromthe ozone absorption cross section s(l, T) and the altitude-dependent ozone number density r(z):
a lð Þ ¼ 1
X
Z1
z0
s l; T zð Þð Þr zð Þdz; ð4Þ
D10305 BERNHARD ET AL.: BIAS IN DOBSON OZONE MEASUREMENTS
2 of 10
D10305

where z0 is station elevation and T is temperature in Kelvin.Equation (4) implies that a(l) depends on the atmosphericozone and temperature distribution. The ozone column X iscalculated by integrating over the ozone profile:
X ¼ kT0
p0
Z1
z0
r zð Þdz; ð5Þ
where T0 is 273.15 K and k is the Boltzmann constant.[10] The Bass and Paur [1985] ozone absorption cross
sections (O3CS) are implemented throughout this paper forwavelengths below 339.982 nm. Above 340 nm, whereBass and Paur data are not available, theMolina and Molina[1986] O3CS was used. Cross sections were multiplied withthe correction factor
fC ¼ 1:0112� 0:6903= 87:3� T � T0ð Þ½ � ð6Þ
as suggested by Komhyr et al. [1993] based on results byBarnes and Mauersberger [1987]. This factor corrects for atemperature dependence of the O3CS at 253.7 nm, whichwas not considered by Bass and Paur [1985]. The Bass andPaur [1985] O3CS with the Barnes and Mauersberger[1987] correction is also implemented by the Dobsonnetwork. A comparison of the Bass and Paur [1985] O3CSwith more recent measurements of the O3CS has beencompiled by Orphal [2003].[11] Equations (1)–(3) are only applicable to monochro-
matic radiation. Owing to the finite bandwidth of theDobson, a(l) has to be replaced in equations (1)–(3) bythe effective ozone absorption coefficient ai, which is aweighted average of a(l) [Basher, 1982]:
ai ¼�1
Xmlog
ZE0 lð ÞS l;lið Þ10�a lð ÞXm�b lð ÞpS
p0mRdlZ
E0 lð ÞS l;lið Þ10�b lð ÞpSp0mRdl
0BB@
1CCA; ð7Þ
where S(l, li) is the Dobson slit function for nominalwavelength li.[12] For consistency checks, we also consider the approx-
imated (or slit function weighted) effective ozone absorp-tion coefficient ai
approx defined as
aapproxi ¼
Za lð ÞS l;lið ÞdlZS l;lið Þdl
: ð8Þ
2.3. Calculation of Air Mass
[13] Relative optical air mass m is defined as the ratio ofthe actual (slant) optical path length taken by the direct solarbeam to the analogous vertical path when the Sun isoverhead from the surface to the top of the atmosphere. Itcan be expressed by [Thomason et al., 1983]:
m q0;lð Þ ¼ 1Z1
z0
s l; T zð Þð Þr zð Þdz
Z1
z0
s l; T zð Þð Þr zð Þdz
1� n0z0 sin q0ð Þn zð Þz
� 2 �0:5; ð9Þ
where n(z) is the index of refraction of air as a function ofaltitude z, n0 = n(z0), and q0 is the apparent SZA at whichthe Sun appears at the Earth’s surface. Owing to refraction,q0 is smaller than the true SZA, q, at which the Sun wouldappear if the Earth had no atmosphere. The dependence ofm(q0, l) on l is negligible in the wavelength rangeconsidered here. All air mass calculations in this paper arebased on l = 310 nm. If the attenuating layer is a deltafunction at height h above sea level, equation (9) can besimplified to
m q0ð Þ ¼ nh Rþ hð Þ
n2h Rþ hð Þ2�n20 Rþ rð Þ2 sin2 q0h i0:5 ; ð10Þ
Table 1. Dobson Wavelengths, Slit Function Parameters, and Absorption Coefficients
Wavelength,nm or pair
Slit Functiona Effective Ozone Absorption Coefficient,c (atm cm)�1
Base,nm
FWHM,nm
Top,nm
Komhyr et al. [1993]b Our Calculation
aiapprox ai ai
adjusted aiapprox ai
305.5 1.86 1.01 0.16 1.917 1.915 1.915 1.914325.0 5.00 3.56 1.06 0.115 0.109 0.115 0.110A 1.802 1.806 1.806 1.800 1.805308.9 1.86 1.02 0.18 1.244 1.239 1.241 1.242329.1 5.32 3.50 1.68 0.065 0.062 0.065 0.063B 1.179 1.177 1.192 1.176 1.180311.5 1.94 1.06 0.18 0.870 0.873 0.868 0.871332.4 5.94 3.71 1.48 0.039 0.040 0.040 0.039C 0.831 0.833 0.833 0.828 0.832317.5 2.12 1.20 0.28 0.379 0.384 0.384 0.387339.9 6.88 4.20 1.52 0.010 0.017 0.010 0.010D 0.369 0.367 0.374 0.373 0.377AD 1.433 1.439 1.432 1.427 1.428BD 0.811 0.810 0.818 0.803 0.803CD 0.462 0.466 0.459 0.455 0.455aSlit function parameters Base, FWHM, and Top define full width wavelength range at base, half maximum, and top, respectively, of trapezoidal slit
functions fitted to plots in Figure 1 of Komhyr et al. [1993].bEffective ozone absorption coefficient ai
approx, ai, and aiadjusted were taken from Tables 6a, 11, and 13 of Komhyr et al. [1993], respectively.
Coefficient aiapprox was adjusted to describe absorption at �46.3�C rather than �45�C.
cEffective ozone absorption coefficients are given in units of (atm cm)�1 to ease comparisons with historic data; 1 atm cm equals 1000 Dobson units or2.69 1019 molecules per cm2.
D10305 BERNHARD ET AL.: BIAS IN DOBSON OZONE MEASUREMENTS
3 of 10
D10305

where R is the radius of the Earth, r is altitude of the station,and nh is the refractive index at height h. The standardDobson method [Basher, 1982] assumes that the ozonelayer is located at height h and that n0 = nh = 1. In thiscase, the relative air mass attributed to ozone absorptionbecomes
mapprox q0ð Þ ¼ Rþ h
Rþ hð Þ2� Rþ rð Þ2 sin2 q0h i0:5 : ð11Þ
3. Validation of ––Ai Calculation for StandardOzone Profile
[14] Komhyr et al. [1993] (denoted as K93 hereinafter)calculated a set of ozone absorption coefficients ai for a‘‘standard’’ ozone profile. These calculations form the basisof the set of coefficients currently implemented by CMDLand WMO’s Dobson network [Hudson et al., 1991]. Tovalidate the calculations by K93, we determined ai withsimilar input parameters as used by K93, and compared theresults. Parameters of the two implementations are given inTable 2.[15] Since numerical data of the slit functions used by
K93 were not available, we fitted symmetrical trapezoidscentered at the nominal Dobson wavelengths to the exper-imentally determined slit functions of Dobson instrumentnumber 83 plotted in Figure 1 of K93. Top and base widthsof these trapezoids are given in Table 1.[16] When K93 applied their set of ‘‘standard’’ coeffi-
cients ai to observations made by the World StandardDobson Spectrophotometer number 83 at Mauna Loa ob-servatory, they found differences in calculated total ozonevalues of up to 3.8% depending on the choice of Dobsonwavelength pairs. To lessen these discrepancies, aB and aD
were empirically increased by 1.3% and 2.0%, respectively.The adjusted set of coefficients (labeled ai
adjusted in thefollowing) was recommended by the International OzoneCommission (IOC) to be used for data archived in the WorldOzone and Ultraviolet Radiation Data Centre (WOUDC),and adopted by WMO on 1 January 1992 [Hudson et al.,
1991]. The adjusted set of coefficients is also the setcurrently implemented by CMDL.[17] Figure 1 shows our calculation of the monochromatic
ozone absorption coefficient a(l) and the associated effec-
Table 2. Parameters for Calculation of ai for Standard Conditions
Parameter Our Implementation Komhyr et al. [1993]
Atmosphere profile 1986 U.S. standard atmosphere[Anderson et al., 1986]
1962 U.S. standard atmosphere
Effective temperature Teff �46.4�C �46.3�COzone profile Bhartia et al. [1985]
for 45�N and 325 DUBhartia et al. [1985] for 45�N
and 325 DUAir mass 2 2Ozone absorption cross section Bass and Paur [1985],
adjusted with Barnes andMauersberger [1987]a
Bass and Paur [1985], adjusted withBarnes and Mauersberger [1987]a
Slit functions trapezoidal fits to Figure 1 ofKomhyr et al. [1993]
Figure 1 of Komhyr et al. [1993]
Extraterrestrial spectrum Gueymard [2004]b Furukawa et al. [1967]Rayleigh optical depth equation (30) of Bodhaine et al. [1999] Bates [1984]
aIn our implementation the Molina and Molina [1986] O3CS was used to extend the Bass and Paur [1985] O3CS to wavelengths beyond 340 nm;Komhyr et al. [1993] used unpublished data by A. M. Bass and R. J. Paur.
bThe extraterrestrial spectrum (ETS) by Gueymard [2004] has a comparatively coarse resolution. We therefore superimposed the fine structure of thehigh-resolution ‘‘Kitt Peak solar flux atlas’’ [Kurucz et al., 1984] (see ftp://ftp.noao.edu/fts/fluxatl/). The composite spectrum is identical with the spectrumlabeled EGueymard (l) presented in the work by Bernhard et al. [2004]. This publication also discusses the construction and accuracy of the spectrum.
Figure 1. Comparison of monochromatic ozone absorp-tion coefficient a(l) and associated effective ozoneabsorption coefficients ai, ai
approx, and aiadjusted, calculated
by Komhyr et al. [1993] and us for ‘‘standard’’ conditionsdefined in Table 2. (a) The coefficients a(l) and ai,calculated by Komhyr et al. [1993] and us. (b) Ratio of ai,ai
adjusted, and aiapprox as calculated by Komhyr et al. [1993]
to ai calculated by us. The ratio of our calculations ofai
approx to our calculation of ai is also shown. The ratio ofKomhyr’s and our calculation of a339.9 is 1.67 and off thechart. Lines are only given for easier identification of thedifferent data sets.
D10305 BERNHARD ET AL.: BIAS IN DOBSON OZONE MEASUREMENTS
4 of 10
D10305

tive ozone absorption coefficient ai, aiapprox, and ai
adjusted,calculated by K93 and us. Values of the various coefficientsare also provided in Table 1.[18] Our values of ai
approx agree with the correspondingvalues of K93 to within ±1.2%. A similar comparison forai indicates agreement to within ±2.3%, except for a339.9
where our value is 0.010 and the value of K93 is 0.017(67% difference). Figure 1a indicates that the value of K93is unreasonably high, as it is close to the maximum of a(l)in the wavelength interval defined by the Dobson slitfunction S(l, l339.9). There is also no explanation for thelarge difference of 63% between a339.9 anda339.9
approx in the K93data set (Table 1). Additional calculations using the Burrowset al. [1999] O3CS showed that our extension of the Bass andPaur [1985] O3CS with theMolina and Molina [1986] O3CSabove 340 nm cannot be the reason for the discrepancy. Wetherefore conclude that the value of a339.9 given by K93 isunreasonably high. The difference in a339.9 leads to differ-ences of 1.9%, 1.5% and 0.5% in aD, aCD, and aAD,respectively.[19] The empirically adjusted value aD
adjusted agrees withour calculation of aD better than the unadjusted value. Thisindicates that most of the bias in aD caused by the error ina339.9 was removed by the adjustment, and the coefficientsaD, aCD, and aAD currently implemented by WMO shouldtherefore be accurate to within ±1%.[20] Note that our and K93’s value for aB agree to within
0.2%, whereas aBadjusted is high by 1.1%. This suggests that
the modification of aB by K93 may have been inappropri-ate. Calculations of effective Rayleigh scattering coeffi-
cients bi by K93 and us agree to within ±0.3% at allwavelengths.
4. Effect of Approximations in Standard DobsonData Reduction Method
4.1. Effective Ozone Absorption Coefficient
[21] The standard Dobson data reduction method(denoted as SM hereinafter) [Basher, 1982] applies the setof adjusted ozone absorption coefficients ai
adjusted to Dobsonmeasurements from all stations. This may lead to systematicerrors since s(l, T) is temperature-dependent and actualatmospheric temperatures and their vertical distribution maydiffer from the standard value of �46.3�C. The error wasquantified by calculating ai with equation (7) for direct Sunmeasurements ofDobson numbers 80 and 82 performed at theSouth Pole between 1991 and 2003. Both instruments havebeen repeatedly calibrated against the reference Dobsoninstrument number 83, which is, in turn, regularly calibratedwith the Langley method at the Mauna Loa Observatory,Hawaii (20�N, 156�E, 3397 m above sea level). This cross-calibration procedure has been described by Komhyr et al.[1989] and calibration records for instrument numbers 80 and82 were published in CMDL summary reports, for example[CMDL, 2002]. For the calculation of ai, ozone and temper-ature profiles as well as surface pressure were taken fromozonesonde observations performed by CMDL at the SouthPole. Balloons were launched approximately every third dayduring the austral spring [Hofmann et al., 1997]. Only profileswith a burst altitude of at least 30 km were used, and profileswere extrapolated to higher altitudes using an algorithmdescribed by Bernhard et al. [2002]. Other parameterswere identical with those given in Table 1. Figure 2shows aAD and aCD as a function of effective tempera-ture Teff (or ozone-weighted mean temperature), definedas
Teff ¼
Z1
z0
T zð Þr zð Þdz
Z1z0
r zð Þdz
: ð12Þ
Both coefficients aAD and aCD increase with Teff, but thereis also some dependence on ozone column X: For the sameTeff, absorption coefficients are generally smaller when X >220 DU than when X < 220 DU (i.e., ‘‘ozone hole’’condition). Larger ozone abundance shifts the solarspectrum to longer wavelengths where a(l) is smaller,leading to smaller values for aAD and aCD. For a similarreason, aAD and aCD are smaller at larger air mass. Figure 3shows a time series of Teff at the South Pole.[22] Figure 4 depicts the ratios of aAD and aCD, calcu-
lated with the method described above, to associated stan-dard values of 1.432 and 0.459 used by SM. Calculatedvalues deviate from standard values by up to ±4%. Accord-ing to equation (3), underestimating aAD or aCD by 4%leads to an overestimate of X by 4%.
4.2. Relative Optical Air Mass Corresponding toOzone Absorption
[23] In SM, m is calculated with equation (11). This is anapproximation since the actual ozone layer is not a delta
Figure 2. Effective ozone absorption coefficients aAD andaCD, calculated from ozone profiles measured by ClimateMonitoring and Diagnostics Laboratory (CMDL) at theSouth Pole, as a function of effective temperature Teff. Dataare divided into subsets with total column O3 below andabove 220 Dobson units (DU) (1 DU = 0.001 atm cm). Thevertical dashed line indicates the standard temperature of�46.3 �C. Solid lines indicate the values aAD
adjusted = 1.432and aCD
adjusted = 0.459. Circles indicate our calculations of(top) aAD and (bottom) aCD for the standard conditionsdefined in Table 2.
D10305 BERNHARD ET AL.: BIAS IN DOBSON OZONE MEASUREMENTS
5 of 10
D10305
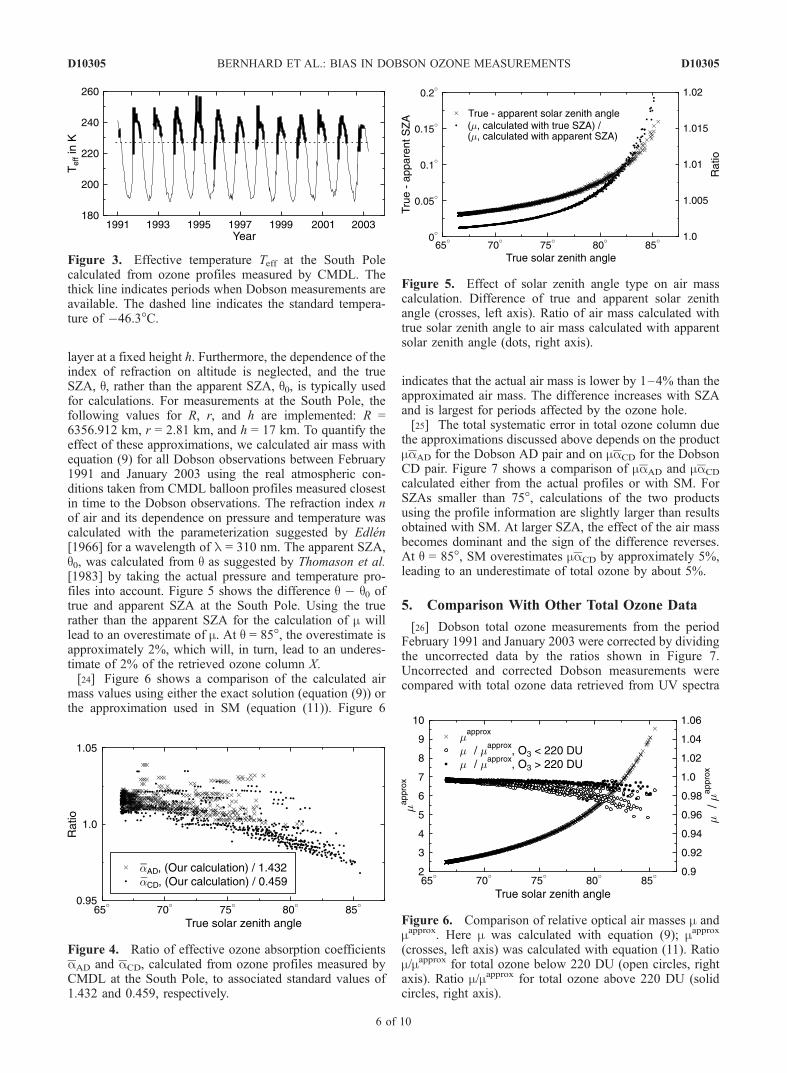
layer at a fixed height h. Furthermore, the dependence of theindex of refraction on altitude is neglected, and the trueSZA, q, rather than the apparent SZA, q0, is typically usedfor calculations. For measurements at the South Pole, thefollowing values for R, r, and h are implemented: R =6356.912 km, r = 2.81 km, and h = 17 km. To quantify theeffect of these approximations, we calculated air mass withequation (9) for all Dobson observations between February1991 and January 2003 using the real atmospheric con-ditions taken from CMDL balloon profiles measured closestin time to the Dobson observations. The refraction index nof air and its dependence on pressure and temperature wascalculated with the parameterization suggested by Edlen[1966] for a wavelength of l = 310 nm. The apparent SZA,q0, was calculated from q as suggested by Thomason et al.[1983] by taking the actual pressure and temperature pro-files into account. Figure 5 shows the difference q � q0 oftrue and apparent SZA at the South Pole. Using the truerather than the apparent SZA for the calculation of m willlead to an overestimate of m. At q = 85�, the overestimate isapproximately 2%, which will, in turn, lead to an underes-timate of 2% of the retrieved ozone column X.[24] Figure 6 shows a comparison of the calculated air
mass values using either the exact solution (equation (9)) orthe approximation used in SM (equation (11)). Figure 6
indicates that the actual air mass is lower by 1–4% than theapproximated air mass. The difference increases with SZAand is largest for periods affected by the ozone hole.[25] The total systematic error in total ozone column due
the approximations discussed above depends on the productmaAD for the Dobson AD pair and on maCD for the DobsonCD pair. Figure 7 shows a comparison of maAD and maCD
calculated either from the actual profiles or with SM. ForSZAs smaller than 75�, calculations of the two productsusing the profile information are slightly larger than resultsobtained with SM. At larger SZA, the effect of the air massbecomes dominant and the sign of the difference reverses.At q = 85�, SM overestimates maCD by approximately 5%,leading to an underestimate of total ozone by about 5%.
5. Comparison With Other Total Ozone Data
[26] Dobson total ozone measurements from the periodFebruary 1991 and January 2003 were corrected by dividingthe uncorrected data by the ratios shown in Figure 7.Uncorrected and corrected Dobson measurements werecompared with total ozone data retrieved from UV spectra
Figure 4. Ratio of effective ozone absorption coefficientsaAD and aCD, calculated from ozone profiles measured byCMDL at the South Pole, to associated standard values of1.432 and 0.459, respectively.
Figure 5. Effect of solar zenith angle type on air masscalculation. Difference of true and apparent solar zenithangle (crosses, left axis). Ratio of air mass calculated withtrue solar zenith angle to air mass calculated with apparentsolar zenith angle (dots, right axis).
Figure 6. Comparison of relative optical air masses m andmapprox. Here m was calculated with equation (9); mapprox
(crosses, left axis) was calculated with equation (11). Ratiom/mapprox for total ozone below 220 DU (open circles, rightaxis). Ratio m/mapprox for total ozone above 220 DU (solidcircles, right axis).
Figure 3. Effective temperature Teff at the South Polecalculated from ozone profiles measured by CMDL. Thethick line indicates periods when Dobson measurements areavailable. The dashed line indicates the standard tempera-ture of �46.3�C.
D10305 BERNHARD ET AL.: BIAS IN DOBSON OZONE MEASUREMENTS
6 of 10
D10305

measured by a SUV-100 spectroradiometer at the SouthPole. The instrument is part of the National Science Foun-dation’s UV monitoring network, operated by BiosphericalInstruments, Inc. [Booth et al., 1994; Bernhard et al., 2004].It is located in the same building as the Dobson spectro-photometer. UV spectra are recorded every 15 min (60 minbefore 1997). The 2s uncertainty of spectral irradiance at310 nm measured by the instrument is 6.4% [Bernhard etal., 2004]. Total ozone was calculated with an inversionmethod described by Bernhard et al. [2003]. In brief, themethod compares SUV-100 spectra with several spectra thatwere calculated with the radiative transfer model UVSPEC/libRadtran [Mayer et al., 1997] using different settings ofthe model total ozone value. The ozone value returned bythe method is the model ozone value that leads to the bestagreement between measurement and model. The CMDLozone profiles used in sections 3 and 4 for the calculation of
ai and m were also used in UVSPEC model calculation.Thus the temperature-dependent vertical ozone distributionis also considered in the SUV-100 data set. The Barnes andMauersberger [1987] correction (equation (6)) was notimplemented. It can therefore be expected that SUV-100data are too high by approximately 0.6%.[27] Figure 8a depicts the ratio of uncorrected Dobson
data to SUV-100 data. The ratio shows some dependence ontotal ozone: There is generally good agreement for totalozone values larger than 170 DU. When total ozone isbelow 170 DU, Dobson measurements are low by 4% onaverage. Figure 8b shows a similar ratio using the correctedDobson data set. The dependence on total ozone is mostlyabsent in the corrected ratio. Dobson data are on averagelower by 1.6% than SUV-100 data.[28] Figure 9 presents a comparison of the SUV-100 data
set with Version 8 overpass data from NASA’s Total OzoneMapping Spectrometer (TOMS) deployed on Nimbus 7(1978–1993) and Earth Probe (1996 to present) satellites.TOMS data are on average 1.7% lower than SUV-100 data.This difference is still within the 2s uncertainty of SUV-100ozone data, which is ±2.5% for SZA < 75� and ±4% forSZA > 75� [Bernhard et al., 2003]. The ratio of the two datasets depends only slightly on total ozone.[29] Version 8 TOMS data are based on an improved
retrieval algorithm, featuring a more accurate a priori ozoneprofile climatology derived from ozonesondes below 25km, and Stratospheric Aerosol and Gas Experiment (SAGE)and Microwave Limb Sounder (MLS) measurements above25 km. The data is averaged into monthly 10� latitude binswith an altitude resolution of approximately 1 km. For thepolar vortex region (80�–90�S), over 18,000 individualMLS measurements were averaged as well as over 900ozonesondes, which were launched from the South PoleStation from 1988 to 2003. Analysis shows that if an ozoneprofile were perturbed by 10% in the 20–40 km region,TOMS ozone values would have an error of less than 1% atslant column density (mX) of less than 1500 DU, and 3.5%at a slant column of 3000 DU. The Version 8 temperatureprofile climatology has been created from National Centersfor Environmental Prediction (NCEP) data and gridded tomonthly 10� latitude bins with an altitude resolution ofapproximately 5 km. The TOMS Version 8 algorithm fur-ther includes an improved cloud height database from theNimbus 7 Temperature Humidity Infrared Radiometer(NIMBUS-7 THIR); a better snow/ice climatology; a moreaccurate terrain height database; and additional aerosol and
Figure 7. Comparison of product of ozone absorptioncoefficients and air mass, calculated either from ozoneprofiles measured by CMDL at the South Pole or with thestandard Dobson method: ratio aAD m/1.432 mapprox (solidcircles) and ratio aCD m/0.459 mapprox (open circles).
Figure 8. (a) Ratio of uncorrected (i.e., original) Dobsontotal ozone data and SUV-100 data at the South Pole.(b) Ratio of corrected Dobson total ozone data and SUV-100data.
Figure 9. Ratio of Total Ozone Mapping Spectrometer(TOMS) Version 8 and SUV-100 total ozone data at theSouth Pole.
D10305 BERNHARD ET AL.: BIAS IN DOBSON OZONE MEASUREMENTS
7 of 10
D10305

sea glint corrections [Labow et al., 2004; Wellemeyer et al.,2004]. A comparison of Earth Probe TOMS Version 8 totalozone data with data from 87 ground stations (Dobson andBrewer instruments) indicates that the average bias betweenthe satellite and the ensemble of ground stations is smallerthan ±3% and largely independent of latitude [Labow et al.,2004]. A comprehensive uncertainty budget for TOMSVersion 8 data is still outstanding.[30] Figure 10 presents a comparison of the Dobson and
TOMS data sets with SUV-100 ozone observations as afunction of SZA. We chose SUV-100 data as the commonreference since SUV-100 spectra are measured close in timewith both Dobson observations and the TOMS overpass.Trend lines were fitted to the data to facilitate the compar-ison. These trend lines indicate that corrected Dobson dataand TOMS data agree on average to within 1% for SZA upto 80�. Above 80�, Dobson data tend to be larger by 1–2%.Uncorrected Dobson data are clearly lower than SUV-100and TOMS data for SZAs larger than 83�. TOMS data areless than SUV-100 data by 1.7% on average, almostindependent of SZA. Statistics of the comparison areprovided in Table 3.
6. Conclusions
[31] A new set of ozone absorption coefficients ai forDobson spectrophotometers was calculated and comparedwith results of similar calculation by K93, which form thebasis of the coefficients recommend by WMO [Hudson etal., 1991]. K93’s and our coefficients agree to within ±2.3%for all but the Dobson wavelength at 339.9 nm. Some of thedifferences may be explained by the slightly differentparameters used by K93 and us (Table 2). Our calculationsuse the most up-to-date data for the extraterrestrial spectrumand Rayleigh optical depth. Differences in slit functionparameterization by K93 and us can lead to variations inai due to the large change of ozone absorption within theband bass of the Dobson instrument. However, variations incenter wavelengths and band pass of individual Dobson
spectrophotometers deployed worldwide are likely largerthan the difference in slit function data implemented by K93and us. Unfortunately, only the slit functions of the StandardDobson number 83 have been measured with a tunable lightsource (K93). Slit functions of other Dobson photometersare assumed to be similar and only wavelength calibrationand band pass are routinely (e.g., monthly) checked withmercury discharge lamps [Komhyr, 1980b].[32] The value for a339.9 is 0.017 in K93’s calculation and
0.010 in ours. Our analysis indicates that the value of 0.017is unreasonably large and likely caused by an error in K93’scalculations. The difference of 67% between the two valuesleads to differences of 1.9%, 1.5% and 0.5% in aD, aCD,and aAD, respectively. The value for aD currently recom-mended by WMO is K93’s aD value, but increased by2.0%. Our analysis provides evidence that this empiricalmodification was justified. Differences between the WMOvalues and our calculations are �0.8%, 0.3% and 0.9% foraD, aAD, and aCD, respectively.[33] We found no clear justification for the empirical
increase of aB by 1.3% suggested by K93 and implementedby WMO. This is of little consequence since the B-wave-length pair is rarely used for total ozone determination.[34] The standard Dobson method assumes a constant
stratospheric temperature of �46.3�C. It does not accountfor actual temperature variations, which affect ozone ab-sorption via the temperature dependence of the O3CS. Atthe South Pole, effective temperatures vary between �50�Cand �18�C during the summer season (Figure 3). Temper-atures often exceeded �46.3�C, which causes an underesti-mate of the effective ozone absorption coefficients (Figure 4),and an overestimate of the resulting total ozone values.[35] The simplification that the ozone layer is confined to
a delta layer at 17 km leads to an overestimate of the relativeozone air mass (Figure 6), which, in turn, leads to anunderestimate of ozone. This systematic error increaseswith SZA and is largest when the ozone profile is distortedby the ‘‘ozone hole.’’ Using the true rather than the apparentSZA for the calculation of air mass further increases theerror in m.
Table 3. Statistics of Comparison of SUV-100, Dobson, and
TOMS Total Ozone Data at South Pole
Data Set Ratio ±1s
Dobson Uncorrected/SUV-100All data 0.980 ± 0.027SZA < 80� 0.984 ± 0.025Dobson AD pair 0.988 ± 0.016Dobson CD pair, ozone > 220 DU 0.983 ± 0.030Dobson CD pair, ozone < 220 DU 0.959 ± 0.033
Dobson Corrected/SUV-100All data 0.984 ± 0.024SZA < 80� 0.982 ± 0.022Dobson AD pair 0.980 ± 0.015Dobson CD pair, ozone > 220 DU 0.997 ± 0.028Dobson CD pair, ozone < 220 DU 0.979 ± 0.032
TOMS Version 8/SUV-100All data 0.983 ± 0.038SZA < 80� 0.984 ± 0.029Nimbus 7 (Feb. 1991 to March 1993) 0.992 ± 0.035Earth Probe (Oct. 1996 to Jan. 2003) 0.980 ± 0.038
Figure 10. Comparison of corrected Dobson and TOMSdata sets with SUV-100 ozone observations as a function ofsolar zenith angle: Ratio of corrected Dobson total ozonedata to SUV-100 ozone (open circles) and ratio of TOMSVersion 8 to SUV-100 data (solid circles). The solid whiteline is a smoothed fit to the ratio Dobson/SUV-100. Thedashed white line is a smoothed fit to the ratio TOMS/SUV-100.
D10305 BERNHARD ET AL.: BIAS IN DOBSON OZONE MEASUREMENTS
8 of 10
D10305
[36] Comparisons with total ozone data from a SUV-100spectroradiometer located at the South Pole and TOMSVersion 8 data indicate that the uncorrected Dobson dataset is too low at small ozone columns and/or large SZAs. Incontrast, a comparison of the corrected Dobson data set withSUV-100 and TOMS measurements exhibit no clear depen-dence on total ozone or SZA. This indicates that thecorrections applied to the Dobson data set lead to an overallaccuracy improvement. Corrected Dobson data agree withTOMS to within ±0.5% on average. Corrected Dobsonmeasurements are on average lower than SUV-100 measure-ments by 1.6%. 0.6% of this difference can be explained bythe omission of the Barnes and Mauersberger [1987]correction in the SUV-100 data set. The remaining differenceis still unresolved, but lies within the uncertainty of the SUV-100 ozone retrieval method [Bernhard et al., 2003] and theuncertainty of Dobson measurements [Komhyr, 1980a;Basher, 1982; Josefsson, 1992; Nichol and Valenti, 1993].[37] It should be noted that corrections applied to Dobson
data are smaller than ±2% for SZA < 77� (m < 4.25). Themajority of Dobson observations performed worldwide ismade at smaller SZAs. Systematic errors discussed in thispaper are therefore relevant mostly for high-latitude siteswhere observations at small SZAs are not possible. How-ever, low-latitude sites may also be affected by significanterrors when stratospheric temperatures deviate substantiallyfrom �46.3�C.
[38] Acknowledgments. We acknowledge Bryan Johnson fromCMDL for his help with the ozonesondes data. We especially appreciatethe invaluable efforts of the many CMDL technical staff members andNOAA Corps Officers who operate the facility year-round at the South Poleto obtain the data used in this report. The U.S. National Science Founda-tion’s Office of Polar Programs (NSF/OPP) supplied the logistics supportfor the facility at the South Pole. SUV-100 measurements at the South Polewere supported by NSF/OPP via a subcontract to Biospherical Instruments,Inc. from Raytheon Polar Services Company. The new TOMS Version8 ozone retrieval was created and implemented by the Ozone ProcessingTeam at NASAGoddard Space Flight Center, particularly P. K. Bhartia, R. D.McPeters, and C. Wellemeyer.
ReferencesAnderson, G. P., S. A. Clough, F. X. Kneizys, J. H. Chetwynd, and E. O.Shettle (1986), AFGL atmospheric constituents profiles (0–120 km),Tech. Rep. AFGL-TR-86–0110, Air Force Geophys. Lab., Bedford, Mass.
Barnes, J., and K. Mauersberger (1987), Temperature dependence of theozone absorption cross section at the 253.7-nm mercury line, J. Geophys.Res., 92(D12), 14,861–14,864.
Basher, R. E. (1982), Review of the Dobson spectrophotometer and itsaccuracy, WMO Global Ozone Res. Monit. Proj. Rep. 13, World Meteor-ol. Organ., Geneva, Switzerland.
Bass, A. M., and R. J. Paur (1985), The ultraviolet cross-sections ofozone: 1. The measurements, in Atmospheric Ozone, edited by C.Zerefos and A. Ghazi, pp. 606–616, Springer, New York.
Bates, D. R. (1984), Rayleigh scattering in air, Planet. Space. Sci., 32(6),785–790.
Bernhard, G., C. R. Booth, and J. C. Ehramjian (2002), Comparison ofmeasured and modeled spectral ultraviolet irradiance at Antarctic stationsused to determine biases in total ozone data from various sources, inUltraviolet Ground- and Space-based Measurements, Models, andEffects, edited by J. R. Slusser, J. R. Herman, and W. Gao, Proc.SPIE Int. Soc. Opt. Eng., 4482, 115–126.
Bernhard, G., C. R. Booth, and R. D. McPeters (2003), Calculation of totalcolumn ozone from global UV spectra at high latitudes, J. Geophys. Res.,108(D17), 4532, doi:10.1029/2003JD003450.
Bernhard, G., C. R. Booth, and J. C. Ehramjian (2004), Version 2 data of theNational Science Foundation’s Ultraviolet RadiationMonitoring Network:South Pole, J. Geophys. Res., 109, D21207, doi:10.1029/2004JD004937.
Bodhaine, B. A., N. B. Wood, E. G. Dutton, and J. R. Slusser (1999), OnRayleigh optical depth calculations, J. Atmos. Oceanic Tech., 16, 1854–1861.
Booth, C. R., T. B. Lucas, J. H. Morrow, C. S. Weiler, and P. A. Penhale(1994), The United States National Science Foundation’s polar networkfor monitoring ultraviolet radiation, in Ultraviolet Radiation in Antarc-tica: Measurements and Biological Effects, Antarct. Res. Ser., vol. 62,edited by C. S. Weiler and P. A. Penhale, pp. 17–37, AGU, Washington,D. C.
Bhartia, P. K., D. Silberstein, B. Monosmith, and A. J. Fleig (1985), Stan-dard profiles of ozone from ground to 60 km obtained by combiningsatellites and ground based measurements, in Atmospheric Ozone: Pro-ceeding of the Quadrennial Ozone Symposium Held in Halkidiki, Greece,3–7 September 1984, edited by C. S. Zerefos and A. Ghazi, pp. 243–247, Springer, New York.
Brinksma, E. J., et al. (2000), Validation of 3 years of ozone measurementsover Network for the Detection of Stratospheric Change station Lauder,New Zealand, J. Geophys. Res., 105(D13), 17,291–17,306.
Burrows, J. P., A. Dehn, B. Deters, S. Himmelmann, A. Richter, S. Voigt,and J. Orphal (1999), Atmospheric remote-sensing reference data fromGOME: 2. Temperature-dependent absorption cross sections of O3 inthe 231–794 nm range, J. Quant. Spectrosc. Radiat. Transfer, 61, 509–517.
Climate Monitoring and Diagnostics Laboratory (2002), Climate Mon-itoring and Diagnostics Laboratory summary report no. 26 2000–2001, edited by D. B. King et al., U.S. Dep. of Comm., Boulder,Colo.
Climate Monitoring and Diagnostics Laboratory (2004), Climate Monitor-ing and Diagnostics Laboratory summary report no. 27 2002–2003,edited by R. C. Schnell, A.-M. Buggle, and R. M. Rosson, U.S. Dep.of Comm., Boulder, Colo.
Dobson, G. M. B. (1931), A photoelectric spectrophotometer for measuringthe amount of atmospheric ozone, Proc. Phys. Soc. London, 43, 324–337.
Dobson, G. M. B., and D. N. Harrison (1926), Measurements of the amountof ozone in the Earth’s atmosphere and its relation to other geophysicalconditions, Proc. R. Soc. London, Ser. A, 110, 660–693.
Edlen, B. (1966), The refractive index of air, Metrologia, 2, 71–80.Furukawa, P. M., P. L. Haagenson, and M. J. Scharberg (1967), A compo-site high-resolution solar spectrum from 2080 to 3600 A, NCAR TN-26,55 pp., Natl. Cent. for Atmos. Res., Boulder, Colo.
Gueymard, C. A. (2004), The Sun’s total and spectral irradiance for solarenergy applications and solar radiation models, Sol. Energy, 76(4), 423–453.
Hofmann, D. J., S. J. Oltmans, J. M. Harris, B. J. Johnson, and J. A.Lathrop (1997), Ten years of ozonesonde measurements at the SouthPole: Implications for recovery of springtime Antarctic ozone, J. Geo-phys. Res., 102(D7), 8931–8943.
Hudson, R. D., W. D. Komhyr, C. L. Mateer, and R. D. Bojkov (1991),Guidance for use of new ozone absorption coefficients in processingDobson and Brewer spectro-photometer total ozone data beginning 1January, 1992, WMO Doc. RDP-825, World Meteorol. Organ., Geneva,Switzerland.
Josefsson, W. A. P. (1992), Focused Sun observations using a Brewer ozonespectrophotometer, J. Geophys. Res., 97(D14), 15,813–15,817.
Komhyr, W. D. (1980a), Dobson spectrophotometer systematic total ozonemeasurement error, Geophys. Res. Lett., 7(2), 161–163.
Komhyr, W. D. (1980b), Operations handbook—Ozone observations with aDobson spectrophotometer, WMO Global Ozone Res. Monit. Proj. Rep.6, 125 pp., World Meteorol. Organ., Geneva, Switzerland.
Komhyr, W. D., R. D. Grass, and R. K. Leonard (1989), Dobson spectro-photometer 83: A standard for total ozone measurements, 1962–1987,J. Geophys. Res., 94(D7), 9847–9861.
Komhyr, W. D., C. L. Mateer, and R. D. Hudson (1993), Effective Bass-Paur 1985 ozone absorption coefficients for use with Dobson ozonespectrophotometers, J. Geophys. Res., 98(D11), 20,451–20,465.
Kurucz, R. L., I. Furenlid, J. Brault, and L. Testerman (1984), Solar fluxatlas from 296 to 1300 nm, technical report, 240 pp., Natl. Sol. Obs.,Sunspot, N. M.
Labow, G. J., R. D. McPeters, and P. K. Bhartia (2004), A comparison ofTOMS and SBUV Version 8 total column ozone data with data fromground stations, in Ozone, Proceedings of the XX Quadrennial OzoneSymposium, 1–8 June 2004, Kos, Greece, vol. 1, edited by C. S. Zerefos,pp. 123–124, Int. Ozone Comm., Athens.
Mayer, B., G. Seckmeyer, and A. Kylling (1997), Systematic long-termcomparison of spectral UV measurements and UVSPEC modelingresults, J. Geophys. Res., 102(D7), 8755–8768.
Molina, L. T., and M. J. Molina (1986), Absolute absorption cross sectionsof ozone in the 185- to 350-nm wavelength range, J. Geophys. Res.,91(D13), 14,501–14,508.
Nichol, S. E., and C. Valenti (1993), Intercomparison of total ozone mea-sured at low Sun angles by the Brewer and Dobson spectrophotometersat Scott Base, Antarctica, Geophys. Res. Lett., 20(19), 2051–2054.
D10305 BERNHARD ET AL.: BIAS IN DOBSON OZONE MEASUREMENTS
9 of 10
D10305

Orphal, J. (2003), A critical review of the absorption cross-sections of O3
and NO2 in the ultraviolet and visible, J. Photochem. Photobiol. A, 157,185–209.
Thomason, L. W., B. M. Herman, and J. A. Reagan (1983), The effect ofatmospheric attenuators with structured vertical distributions on air massdeterminations and Langley plot analyses, J. Atmos. Sci., 40, 1851–1854.
Van Roozendael, M., et al. (1998), Validation of ground-based visible mea-surements of total ozone by comparison with Dobson and Brewer spec-trophotometers, J. Atmos. Chem., 29(1), 55–83.
Wellemeyer, C. G., P. K. Bhartia, R. D. McPeters, S. L. Taylor, and C. Ahn(2004), A new release of data from the Total Ozone Mapping
Spectrometer (TOMS), SPARC Newsl. 22, 37–38. (Available at http://www.atmosp.physics.utoronto.ca/SPARC/News22/22_Wellemeyer.html)
�����������������������G. Bernhard, Biospherical Instruments Inc., 5340 Riley Street, San
Diego, CA 92110, USA. ([email protected])R. D. Evans and S. J. Oltmans, NOAA Climate Monitoring and
Diagnostics Laboratory, 325 Broadway, Boulder, CO 80303, USA.([email protected]; [email protected])G. J. Labow, NASA Goddard Space Flight Center, Greenbelt, MD 20771,
USA. ([email protected])
D10305 BERNHARD ET AL.: BIAS IN DOBSON OZONE MEASUREMENTS
10 of 10
D10305