BEYOND VERBAL SCALES: MEASUREMENT OF EMOTIONS IN ... · Plutchik 1991) according to which, emotions...
28
MEASUREMENT OF EMOTIONS Hupp Gröppel-Klein Dieckmann Broeckelmann Walter 72 BEYOND VERBAL SCALES: MEASUREMENT OF EMOTIONS IN ADVERTISING EFFECTIVENESS RESEARCH by Oliver Hupp, Andrea Gröppel-Klein, Anja Dieckmann, Philipp Broeckelmann and Kathrin Walter* Yearbook of Marketing and Consumer Research, Vol.6 (2008) GfK ABSTRACT Emotions are a major topic in marketing science and practice alike (Kroeber-Riel/ Weinberg/Gröppel-Klein 2008, p. 99). B2B, B2C, and retail brands need to be emotio- nally charged to ensure differentiation from competitor brands. But how can emo- tions be reliably measured? Only valid and meaningful measurement of emotions will allow the emotional impact of marketing activities to be optimized in the future. The Institute for Consumer and Behavioural Research at Saarland University together with brand and methodology specialists at GfK joined forces to develop a picture- based scale that is applicable at various brand touch points: it is called GfK EMO Sensor. This article summarizes the theoretical background and the development of the methodological approach. It concludes by presenting initial applications in adver- tising effectiveness research and their practical implications for marketing. * Dr. Oliver Hupp, Division Manager Brand and Communication Research, GfK AG, Nordwest- ring 101, D - 90319 Nürnberg; email: [email protected] Prof. Dr. Andrea Gröppel-Klein, Professor of Marketing and Director of the Institute for Consumer and Behavioural Research, Saarland University, Campus A5 4, D - 66123 Saarbrücken; email: [email protected] Dr. Anja Dieckmann, Senior Specialist in the Department of Basic Research, GfK-Nürnberg e.V., Nordwestring 101, D - 90319 Nürnberg, E-Mail: [email protected] Dipl.-Kfm. Philipp Broeckelmann, Research Assistant at the Institute for Consumer and Behavioural Research, Saarland University, Campus A5 4, D - 66123 Saarbrücken; email: [email protected] Dipl.-Kffr. Kathrin Walter, Junior Specialist Advanced Statistics & Methodological Consulting, GfK AG, Nordwestring 101, D - 90319 Nürnberg; email: [email protected] The authors would like to thank Prof. Dr. Frank Wimmer for his helpful comments during the review process, and also Daniel Becker and Holger Dietrich for their valuable feedback on earlier versions of this article. We are also very grateful to Dr. Dorothea Baun and Dr. Raimund Wildner for their important input during the development process of GfK EMO Sensor. Also published in GfK Jahrbuch der Absatz- und Verbrauchsforschung, Vol. 54 (2008).
Transcript of BEYOND VERBAL SCALES: MEASUREMENT OF EMOTIONS IN ... · Plutchik 1991) according to which, emotions...

MEASUREMENT OF EMOTIONSHupp
Gröppel-KleinDieckmann
BroeckelmannWalter
72
BEYOND VERBAL SCALES: MEASUREMENT OF EMOTIONSIN ADVERTISING EFFECTIVENESS RESEARCHby Oliver Hupp, Andrea Gröppel-Klein, Anja Dieckmann,Philipp Broeckelmann and Kathrin Walter*
Yearbook of Marketing and Consumer Research, Vol.6 (2008)GfK
ABSTRACT
Emotions are a major topic in marketing science and practice alike (Kroeber-Riel/Weinberg/Gröppel-Klein 2008, p. 99). B2B, B2C, and retail brands need to be emotio-nally charged to ensure differentiation from competitor brands. But how can emo-tions be reliably measured? Only valid and meaningful measurement of emotions willallow the emotional impact of marketing activities to be optimized in the future.
The Institute for Consumer and Behavioural Research at Saarland University togetherwith brand and methodology specialists at GfK joined forces to develop a picture-based scale that is applicable at various brand touch points: it is called GfK EMOSensor. This article summarizes the theoretical background and the development ofthe methodological approach. It concludes by presenting initial applications in adver-tising effectiveness research and their practical implications for marketing.
* Dr. Oliver Hupp, Division Manager Brand and Communication Research, GfK AG, Nordwest-ring 101, D - 90319 Nürnberg; email: [email protected]. Dr. Andrea Gröppel-Klein, Professor of Marketing and Director of the Institute forConsumer and Behavioural Research, Saarland University, Campus A5 4, D - 66123 Saarbrücken;email: [email protected]. Anja Dieckmann, Senior Specialist in the Department of Basic Research, GfK-Nürnberg e.V.,Nordwestring 101, D - 90319 Nürnberg, E-Mail: [email protected]. Philipp Broeckelmann, Research Assistant at the Institute for Consumer andBehavioural Research, Saarland University, Campus A5 4, D - 66123 Saarbrücken; email: [email protected]. Kathrin Walter, Junior Specialist Advanced Statistics & Methodological Consulting,GfK AG, Nordwestring 101, D - 90319 Nürnberg; email: [email protected] authors would like to thank Prof. Dr. Frank Wimmer for his helpful comments during the reviewprocess, and also Daniel Becker and Holger Dietrich for their valuable feedback on earlier versions ofthis article. We are also very grateful to Dr. Dorothea Baun and Dr. Raimund Wildner for theirimportant input during the development process of GfK EMO Sensor.
Also published in GfK Jahrbuch der Absatz- und Verbrauchsforschung, Vol. 54 (2008).

1. Introduction
Emotional experiences shape people’s attitudes towards brands and products. Thepleasure of indulging in one’s favorite chocolate, or the pride experienced when friendsadmire one’s new sports car strengthen our brand commitment. Yet it is dampened byfrustration at spending endless time in the waiting loop of a service hotline. Thus, emo-tions continuously affect brand differentiation and long-term brand commitment (cf.Keller 2008a). Among the manifold brand touch points, emotions elicited by commu-nication and, in particular, advertising are especially important for marketing practi-ce (cf. Haimerl 2007). In his seminal work “Visual Communication”, Kroeber-Riel (1993,p. 155 ff.) presents numerous examples of both highly successful and weak emotionalstimuli in advertising, and explains their effects on brand perception and brand atti-tude.
In the GfK Advertising Effectiveness Model, which is based on work by Keller(2008a, 2008b), emotions elicited by the advertising draw the audience’s attention tothe advertising media and thus, ultimately, affect the success of the advertising (for asimplified illustration, see Figure 1).
In the model, catalysts determine the extent to which advertising can lead to changesin the customer mindset (1). These catalysts serve as filters, and can strengthen or weaken the impact of advertising. An advertising stimulus needs to pass through thesefilters and – in an initial, partly unconscious processing step – be classified as perso-nally relevant in order to gain sufficient attention to be taken on to further processing(cf. Franzen 1999, p. 41 ff.; Heath 2007, p. 9). In the Anglo-American marketing lite-
MEASUREMENT OF EMOTIONSHuppGröppel-KleinDieckmannBroeckelmannWalter
73
Yearbook of Marketing and Consumer Research, Vol.6 (2008) GfK
Figure 1

MEASUREMENT OF EMOTIONSHupp
Gröppel-KleinDieckmann
BroeckelmannWalter
74
2.
2.1
rature, this process is called engagement, while in Germany the term involvement ismore common (2). The impact of advertising on brand perception differs depending on engagement strength. The weakest level of advertising impact is the anchorage ofa certain advertisement and the advertised brand in memory. Stronger impacts, in as-cending order, are effects on specific brand associations (brand identity, brand per-sonality, brand benefits), and also on the judgment of the advertised brand, and finallythere is the impact on brand loyality and purchase intention.
As mentioned above, emotional stimuli can act as catalysts to intensify engagementand thus influence the effects of advertising on the customer’s mindset. First, stimulithat produce emotional reactions will prompt the audience to orient itself towards thetriggering event (“primary attention”). Afterwards, strong emotional stimuli can indu-ce the audience to pay greater attention to the advertisement for a longer time (“secon-dary, sustained attention”). Thus, emotions are crucial factors in contributing to suc-cess, affecting whether an advertising stimulus will gain recognition in the competi-tive environment and be further processed.
The monitoring of emotional reactions to advertising therefore plays a major role inadvertising effectiveness research: What emotions are elicited by the people, music and scenes presented in advertisements? And how strong is the emotional reaction?Answering these questions is highly important to not only measure, but also to explainchanges in attitude and behavior – a central goal of advertising effectiveness research.Gaining insights into consumers’ emotional reactions will thus facilitate a targeted andeffective management of brand touch points.
Theory of emotions
What are emotions?
Emotions are of the utmost importance in marketing. But what exactly is an emotion?“Everyone knows what an emotion is, until asked to give a definition”. This quotationfrom Fehr and Russell (1984, p. 464) illustrates the difficulty science and marketinghave in capturing the content of the construct emotion, and distinguishing it from closely related constructs. This difficulty contributes to a considerable degree of uncer-tainty of how emotions can be validly measured.
Until now, there has been no uniform, broadly accepted definition of emotions.Rather, most current definitions are confined to a list of characteristics (cf. Scherer 2005;Plutchik 1991) according to which, emotions are complex reactions to events that arerelevant to a person’s subjective wellbeing. They involve changes in physiology, beha-vior (including facial expressions), and subjective experience. Emotions depend on the
Yearbook of Marketing and Consumer Research, Vol.6 (2008)GfK

2.2
conscious or unconscious appraisal of the triggering event and are associated with certain behavioral responses, which are partly formed by evolution. They can be distin-guished from other affective phenomena by their relatively fast onset, short durationand high intensity (3).
Basically, one can distinguish two different traditions in emotion theories: Appraisaltheorists propose that emotions result from the comparison between a desirable orundesirable goal and the degree of goal attainment. Lazarus (e.g., 1982), one of themost important appraisal theorists, considers cognitive activity a necessary precondi-tion for emotions. According to his theory, emotional experience requires the under-standing that an event can have positive or negative consequences for subjective well-being. Also, people can anticipate and revive emotions by pure mental activity, whichin turn can lead to physical reactions.
According to biologically oriented emotion theorists, emotions are genetically pro-grammed (e.g., Zajonc 1980). They can be triggered automatically and without highercognitive processing by innate or learned stimuli, even before one becomes consciousof these stimuli (e.g., LeDoux 1996). With the help of modern brain-imaging techno-logies, neuroscientists have in recent years done impressive work in shedding lightupon such automatic emotional processes. A series of studies now demonstrates thatemotions can bias decisions in a certain direction before any conscious thought processoccurs (cf. Bechara et al. 2005; Damasio 1996). Arguments which have been traditio-nally regarded as rational are often presented as mere post-hoc rationalizations (e.g.,Haidt 2001). Impulse buying, for instance, can be associated with emotions such ashappiness and surprise (cf. Baun/Gröppel-Klein 2003).
However, based on neurological studies, LeDoux (1996) demonstrates that emotionscan also result purely from mental anticipation and construction. Most current emotionresearchers thus regard both theoretical accounts as legitimate. Emotions can occurautomatically and unconsciously, facilitating fast reactions (e.g., “freezing”). But theycan also result from conscious assessments in cortical areas. There, it is assessed whe-ther relevant goals have been attained or not and whether they are associated withrewards or punishments (for more detail, see Kroeber-Riel et al. 2008, p. 118 f.). But ifemotions can be both biologically pre-wired and arise from higher cognitive activity,their measurement in marketing and advertising effectiveness research becomes evenmore challenging.
Primary and secondary emotions
In a large part of the emotion literature so-called basic emotions are distinguished frommore complex secondary emotions. Going back to Darwin (1872), based on his obser-vations of emotional expressions in many different human societies and across different
MEASUREMENT OF EMOTIONSHuppGröppel-KleinDieckmannBroeckelmannWalter
75
Yearbook of Marketing and Consumer Research, Vol.6 (2008) GfK

MEASUREMENT OF EMOTIONSHupp
Gröppel-KleinDieckmann
BroeckelmannWalter
76
2.3
species, he postulated the existence of a number of fundamental, innate emotions. Mostscientists today still assume a set of primary or basic emotions (e.g., Ekman 1972;Tomkins 1962; Plutchik 1991; Izard 1971). They are characterized by special qualities,such as cross-cultural transferability, developed in earliest childhood, and certainphysiological, mimic and behavioral reactions that inextricably accompany them. Somescientists propose that more complex secondary emotions are the result of the blending of basic emotions (cf. Izard 1994; Plutchik 1962, 2003).
Measurement of emotions
How can emotions be validly measured? Can they simply be captured by self-report orstandardized verbal scales? Biologically oriented emotion researchers often apply neuroscientific methods to measure physiological indicators of emotions such as heartrate, skin conductance level, or regional brain responses (cf. Kroeber-Riel et al. 2008,p. 120 ff.). Observational methods for capturing emotional facial expressions are alsopopular, such as the Facial Action Coding System (FACS; cf. Ekman/Friesen 1975).These approaches have obvious advantages. They are highly objective and can captureemotions while they are occurring. But there are also disadvantages, especially when itcomes to their application in marketing. For instance, not all emotions have a uniquephysiological or mimic pattern. Especially secondary emotions can hardly be deducedin an unambiguous way. Additionally, application of these methods requires muchtime, effort and high levels of expertise, making them almost impracticable for largesamples.
Appraisal theorists mainly concentrate on capturing the conscious emotional expe-rience by verbal methods, such as questionnaires or think-aloud techniques. Indeed,self-report provides the only access to the subjective experience level of emotions,despite all the progress in the neurosciences. The variety of more complex secondaryemotions cannot be revealed in any other way. Additionally, questionnaires are easy toapply and cost-effective, both in data collection and analysis. But they can lead to problems as well. Verbal methods are often criticized for inducing rationalizations in respondents and preventing intuitive responses. This raises serious concerns: Dorespondents have sufficient insight into their emotions to be able to answer questionstruthfully? Does the interview situation induce cognitive filtering of emotional expe-riences, thereby increasing the tendency to give socially desirable answers? Whichunconscious or automatic components of the emotional reactions are missed by verbalmeasurement approaches?
Picture-based approaches, unlike purely verbal questionnaires, are expected to facilita-te intuitive access to emotions that are difficult to verbalize or which respondents are
Yearbook of Marketing and Consumer Research, Vol.6 (2008)GfK

reluctant to talk about. Kroeber-Riel et al. (2008, p. 124) recommend picture scalesespecially for the following applications:
■ “for modality-specific measurement of pictorially encoded emotions”,
■ to gain “access to feelings that are difficult to verbalize or not explicitly conscious”,
■ when “the risk of socially desirable answers is to be diminished”, as well as
■ in “low-involvement situations” (e.g., when viewing TV ads).
At the same time, picture-based scales can give a fresh impetus to the interview andincrease interest, motivation, and, ultimately, response rates. For the basic emotions,picture scales have the additional advantage of cross-cultural applicability. Finally, easeand efficiency of application are comparable to verbal scales.
However, selection and validation of the pictures for such scales requires special care.It is very difficult to find truly unambiguous pictures that represent the same emotionfor most people, especially if the scale is to be extended beyond the basic emotions. Forinstance, misinterpretations can result when the depicted emotional scene is nottaken as metaphor for an emotion (e.g., the picture of a broadly-smiling woman on amerry-go-round is not seen to represent “joy”), but is only associated with the concre-te situation (e.g., “being in an amusement park”). Therefore, it needs to be examinedwhether verbally labeling pictures or collages of pictures with an appropriate short ver-bal description might increase the clarity and power of the message. Additionally, idio-syncratic associations with the pictures can lead to distorted answers. A sleeping catmight express comfortable warm feelings for some people, while others will only thinkof their allergies. Finally, pictures can themselves trigger emotions. In psychologicalresearch, for instance, an internationally validated set of pictures (IAPS: InternationalAffective Picture System; cf. Lang/Bradley/Cuthbert 1999) is often used to induce emo-tions. Pictures therefore pose the risk of changing the emotional experience to be mea-sured. When selecting pictures, it is therefore important to make as sure as possiblethat the picture only shows an emotion (e.g., a frightened woman), but does not indu-ce it (e.g., close-up view of a hairy spider).
In summary, there is no gold standard yet with which all aspects of emotions can becaptured (cf. Scherer 2005, p. 709). It is therefore recommended that pragmatic criteriashould be taken into account when deciding in favor of a certain measurement appro-ach. Our goal is the development of a measurement tool which validly capturesconsumers’ manifold emotions, regardless of whether they are basic or more complexsecondary emotions. Also, it needs to be widely applicable in cross-cultural and onlinestudies, as well as for different products and at diverse brand touch points.
MEASUREMENT OF EMOTIONSHuppGröppel-KleinDieckmannBroeckelmannWalter
77
Yearbook of Marketing and Consumer Research, Vol.6 (2008) GfK

MEASUREMENT OF EMOTIONSHupp
Gröppel-KleinDieckmann
BroeckelmannWalter
78
3. GfK EMO Sensor: Development of a scale for capturing emotional responses
The number of emotions whose marketing relevance has been demonstrated in nume-rous studies extends far beyond the basic emotions (for an overview, see Bagozzi/Gopinath/Nyer 1999; Kroeber-Riel et al. 2008, p.132 ff.). As explained above, only self-report provides access to the differentiated world of human emotional experiences.Thus, researchers at GfK in cooperation with the Institute for Consumer andBehavioural Research at Saarland University decided to develop a questionnaire-based methodology, flexible in its application, for capturing discrete emotions atvarious brand touch points.
As mentioned above, both verbal and picture-based methodologies have pros and cons.The final decision for one approach – verbal or pictorial – will thus be based on anempirical comparison. To allow for a fair comparison, special attention needs to be paid
Yearbook of Marketing and Consumer Research, Vol.6 (2008)GfK
Figure 2

3.1
3.2
to the selection of appropriate, unambiguous pictures. The development of the scale forcapturing emotions can therefore be divided into different steps (see Figure 2). First,relevant emotions are selected to be included in the scale. Second, a search is mountedfor pictures to represent each of these emotions. In a third step, the picture material isreduced in a series of validation studies to only the most unambiguous pictures. Finally,different scale variants – verbal, pictorial, and combinations of them – are used to capture emotional responses to TV ads and then evaluated on different performance criteria.
Step 1: Selection of relevant emotions
Choosing from the large number of emotions mentioned in the relevant literature is nota trivial task. (The fundamental PAD scale alone comprises more than 150 items de-scribing emotional states, cf. Russell/Mehrabian 1977.) To derive a set of emotions thatincluded as many emotions as necessary but at the same time as few as possible, theconcept of basic emotions devised by Plutchik (2003) was used as a starting point.Plutchik reduces all emotions to eight basic emotions (anger, anticipation, disgust,fear, joy, sadness, surprise, trust) with different degrees of intensity, and mixtures ofthem. Love, for instance, is seen as mixture of the basic emotions of joy and trust. Theeight basic emotions were supplemented by eight “mixed” emotions (primary dyads:aggression, awe, disappointment, love, optimism, remorse, submission, contempt) aswell as by emotions that have been shown to be especially relevant in a marketing con-text. These were boredom, compassion, coziness, desire, embarrassment, envy, interest,longing, passion, pride, rejection, and superiority (e.g., Aaker/Stayman/Hagerty 1986;Belk/Ger/Askegaard 2003; Bosch/Schiel/Winder 2006; Verbeek/Belschak/Bagozzi 2004;Zeitlin/Westwood 1986). In the end, the list consisted of 28 emotions to be tested.
Step 2: Selection of pictures to represent the emotions
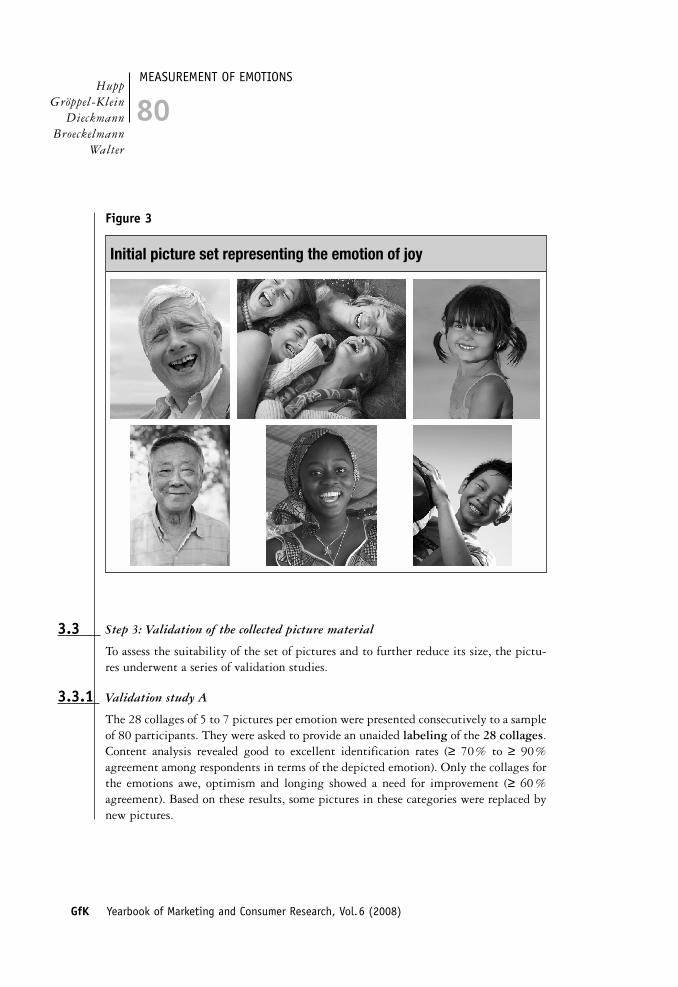
With emotion words as search terms, more than 10,000 pictures from commercial pic-ture libraries were inspected and evaluated in terms of their suitability for representingthe selected emotions. Special attention was paid to the criterion that a picture shouldnot induce the relevant emotion in the respondent, but only depict it. The emotionalexperience of the viewer of the pictures should thus remain as unaffected as possible (cf.Bosch et al. 2006). For each emotion, a set of 10 to 15 pictures was selected, which waslater reduced to between 5 and 7 pictures per emotion based on expert judgment; theyaimed for balance in the depicted situations, as well as in the gender, age and ethnicbackground of the depicted persons (see Figure 3 for an example). This resulted in a setof 152 pictures in total.
MEASUREMENT OF EMOTIONSHuppGröppel-KleinDieckmannBroeckelmannWalter
79
Yearbook of Marketing and Consumer Research, Vol.6 (2008) GfK
MEASUREMENT OF EMOTIONSHupp
Gröppel-KleinDieckmann
BroeckelmannWalter
80
3.3
3.3.1
Step 3: Validation of the collected picture material
To assess the suitability of the set of pictures and to further reduce its size, the pictu-res underwent a series of validation studies.
Validation study A
The 28 collages of 5 to 7 pictures per emotion were presented consecutively to a sampleof 80 participants. They were asked to provide an unaided labeling of the 28 collages.Content analysis revealed good to excellent identification rates (≥ 70% to ≥ 90%agreement among respondents in terms of the depicted emotion). Only the collages forthe emotions awe, optimism and longing showed a need for improvement (≥ 60 %agreement). Based on these results, some pictures in these categories were replaced bynew pictures.
Yearbook of Marketing and Consumer Research, Vol.6 (2008)GfK
Figure 3
3.3.2
Forty of the participants were next asked to rank the pictures in each collage in termsof how well each represented the emotion they saw in the collage. For 26 out of the 28collages, a clear rank order could be determined, suggesting comparable perception ofthe pictures by the participants.
Validation study B
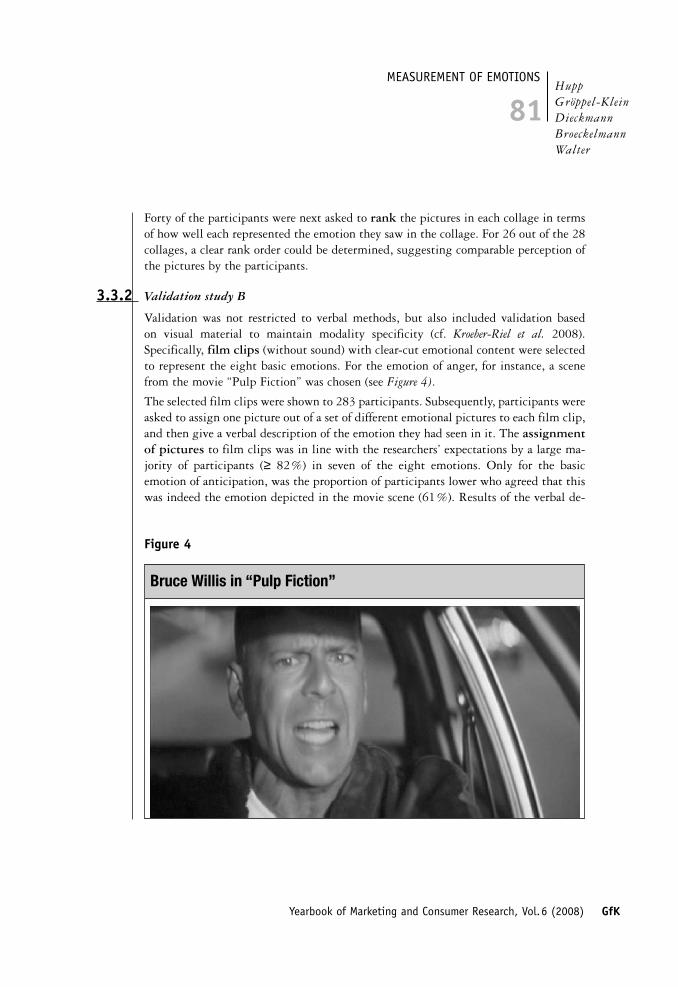
Validation was not restricted to verbal methods, but also included validation based on visual material to maintain modality specificity (cf. Kroeber-Riel et al. 2008).Specifically, film clips (without sound) with clear-cut emotional content were selectedto represent the eight basic emotions. For the emotion of anger, for instance, a scenefrom the movie “Pulp Fiction” was chosen (see Figure 4).
The selected film clips were shown to 283 participants. Subsequently, participants wereasked to assign one picture out of a set of different emotional pictures to each film clip,and then give a verbal description of the emotion they had seen in it. The assignmentof pictures to film clips was in line with the researchers’ expectations by a large ma-jority of participants (≥ 82%) in seven of the eight emotions. Only for the basic emotion of anticipation, was the proportion of participants lower who agreed that thiswas indeed the emotion depicted in the movie scene (61%). Results of the verbal de-
MEASUREMENT OF EMOTIONSHuppGröppel-KleinDieckmannBroeckelmannWalter
81
Yearbook of Marketing and Consumer Research, Vol.6 (2008) GfK
Figure 4

MEASUREMENT OF EMOTIONSHupp
Gröppel-KleinDieckmann
BroeckelmannWalter
82
3.3.3
scription of the movie also showed satisfying agreement levels, but the spectrum of answers was generally broader, supporting the notion that pictures might be more suitable for measuring emotional experiences.
Validation study C
In validation study A, the assignment of pictures to emotions had followed the resear-chers’ judgment, and pictures were presented together in collages accordingly. Next,the aim of validation study C was to find out whether respondents would sort the pic-tures in accordance with their expected emotional content even without previousknowledge of the emotional categories. To address questions of this kind, Griffin andHauser (1993) developed a methodology that does not provide respondents with pre-selected categories, but captures the dimensions and relationships that respondentsthemselves see in the presented items. The task is to sort stimuli according to their per-ceived similarity into as many piles as participants find reasonable. A second goal of thestudy was to further reduce the picture sets to three pictures per emotion.
A representative sample of 501 participants (51% female; Mage = 42.6 years, SDage
= 14.6) was invited to take part in personal interviews at GfK test studios in Berlin,Dresden, Essen, Frankfurt, and Munich. To avoid cognitive overload, each participantwas only shown pictures of half (i. e., 14) of the emotion categories, selected on a ran-dom basis. Participants were told that the pictures represented emotions. Their taskwas to sort pictures into piles so that in their view, the pictures in each pile repres-ented the same or almost the same emotion. The participants were not given anyfurther guidelines in terms of number of piles or number of pictures per pile. Aftercompleting the sorting, they were asked to choose the most representative picturefrom each pile, and then to label each pile – first unaided, then by allocating littletags that had the relevant emotions pre-printed on them.
For each pair of pictures, the percentage of participants was calculated who had sortedthe two pictures into the same pile (“co-assignment rate”). These percentages were usedas proximity measure in a hierarchical cluster analysis. This analysis resulted in clearclusters of pictures for 25 of the 28 expected emotion categories (Ward’s procedure).This means that 25 clusters consisted precisely of those pictures that were also includ-ed in the pre-defined emotion category. Three of these 25 emotion clusters were exclud-ed because the mean paired co-assignment rates were below 50 % (optimism, remorse,contempt). The pictures intended to represent the emotions awe, longing and submis-sion ended up in different clusters and thus, no coherent cluster was derived for theseemotions. Across the remaining 22 emotions the mean paired co-assignment rate was71 %. Based on analysis of answers in the unaided labeling task, the emotion category
Yearbook of Marketing and Consumer Research, Vol.6 (2008)GfK

anticipation was relabeled curiosity. All other categories received the intended or a closely related label from the majority of participants.
The selection of the pictures was based on two central criteria for each picture:
■ number of votes for being the most representative picture of an emotion withina correctly labeled picture pile as a measure of power to express an emotion
■ assignment rate to a pile labeled with the intended emotion as measure of its unam-biguousness
In terms of the first criterion, the three pictures with most votes for being most repre-sentative were selected. The second criterion of unambiguousness was only used toensure that the most representative pictures were not ambivalent. However, the twocriteria only rarely produced diverging rank orders, thus corroborating the quality ofthe selection. Moreover, the selected pictures were consistent with those chosen as best pictures in validation study A in 77% of the cases, so the solution can be regarded asstable.
MEASUREMENT OF EMOTIONSHuppGröppel-KleinDieckmannBroeckelmannWalter
83
Yearbook of Marketing and Consumer Research, Vol.6 (2008) GfK
Table 1

MEASUREMENT OF EMOTIONSHupp
Gröppel-KleinDieckmann
BroeckelmannWalter
84
3.3.4
In summary, the results of the sorting task strongly suggest a reduction of the theore-tically derived emotion categories to 22 (see Table 1), each represented by three pictures, selected in terms of power to express an emotion and unambiguousness. Thereduction of the emotion clusters to only the three selected pictures increases the meanpaired co-assignment rates from 71% to 77%, averaged across all 22 emotions.
Validation study D
A final validation study examined the relationship between the evaluation of TV adsusing the emotional pictures on the one hand, and electrodermal reaction during view-ing on the other. Electrodermal activity is an indicator of strong emotional arousal(cf. Boucsein 1992; Gröppel-Klein 2004). One group of 41 participants were shown ahigh-arousal TV ad for DeBeukelaer Prinzenrolle biscuits, in which the Prince tries tokiss Sleeping Beauty awake. Another group of 39 participants were shown a less arous-ing TV spot for the same product, in which four cooks prepare the chocolate cream forthe biscuits. Out of a pile of 84 pictures (the three best pictures indicated by vali-dation study C, for all 28 originally selected emotions), participants selected those pictures that best represented their emotions while viewing the spots. The levels ofthe electrodermal reaction for the spots had been established in an earlier study byGröppel-Klein/Domke/Bartmann (2006).
As expected, participants assigned more emotion pictures to the Sleeping Beauty spot(7.6 pictures on average) than to the cooks spot (6.8 pictures); in particular, they assig-ned more positive emotion pictures to the Sleeping Beauty spot (4.3 positive emotionpictures on average, compared to 3.3 for the cooks spot). Besides supporting the gene-ral validity of the pictorial measurement approach, the study revealed some difficultiesconcerning the selection of pictures by participants. Pictures that showed similar situ-ational motifs to those used in the TV ad were assigned to the spot based on their out-ward similarity, regardless of their emotional content. For instance, two of the picturesrepresenting the emotion rejection were not once assigned to the Sleeping Beauty spot(see Figure 5, left and center). One picture, however, that showed a kneeling man hold-ing flowers in his hands who is rebuffed by a woman (see Figure 5, right) was assig-ned to the spot by 34.1% of participants. Obviously, although Sleeping Beauty in theTV spot is enraptured by her prince and does not reject him, this particular rejectionpicture was selected by a considerable number of participants due to its situationalsimilarity to the TV spot. Just like in the picture, the spot shows roses and a man cour-ting a woman. Thus, in future studies it has to be ensured that pictures are not usedthat show situations similar to motifs used in the advertising campaign that is to beevaluated.
Yearbook of Marketing and Consumer Research, Vol.6 (2008)GfK

3.4
3.4.1
Step 4: Comparison of different scale formats
Based on the studies already completed, a validated set of emotion pictures is nowavailable. But in what format should they be administered to reveal respondents’ emo-tional reactions? In a first practical test, different presentation formats were used tocapture emotional responses to TV ads, and compared with each other on different performance criteria. Based on expert judgment, five TV spots were selected that wereexpected to elicit very different emotions:
■ An image spot for Adidas, with highly aggressive content, depicting a soccer theme,■ a commercial for Axe deodorants, with disgusting but at the same time funny con-
tent, ■ a spot for Landliebe yoghurts, depicting happy family life in the countryside, ■ a matter-of-fact commercial for HUK-Coburg car insurances, dominated by the price
issue, and finally■ a spot for Havana Club rum, showing young people partying on the streets while
Latin music is playing.
Design
The main goal was to compare five different formats (see Figure 6) for presenting the22 emotions. A primary aim was to compare verbal items and pictures:
■ Format 1: purely verbal emotion labels (“words”)
■ Format 2: purely pictorial representation of emotions by individual pictures (“pictu-res”)
MEASUREMENT OF EMOTIONSHuppGröppel-KleinDieckmannBroeckelmannWalter
85
Yearbook of Marketing and Consumer Research, Vol.6 (2008) GfK
Figure 5

MEASUREMENT OF EMOTIONSHupp
Gröppel-KleinDieckmann
BroeckelmannWalter
86
This comparison was to reveal whether the above-mentioned advantages of pictures(such as access to emotions that are difficult to verbalize) outweigh their disadvantages(such as a certain degree of ambivalence that remains despite the thorough validationprocess).
Three additional variants represented different attempts to foster unambiguous inter-pretations of the picture material:
■ Format 3: Purely pictorial representation of emotions by collages consisting of thethree single pictures selected for each emotion (“collages”). The presentation of threepictures was expected to reduce ambivalence by revealing the intended emotion asthe common theme that unites the pictures.
■ Format 4: Combining verbal and pictorial stimuli in labeled single pictures, that is,pictures that are subtitled by the appropriate emotion word (“pictures + words”)
Yearbook of Marketing and Consumer Research, Vol.6 (2008)GfK
Figure 6

3.4.2
3.4.3
■ Format 5: Combining verbal and pictorial stimuli in labeled collages, that is, colla-ges that are subtitled by the appropriate emotion word (“collages + words”)
By comparing labeled picture variants to purely pictorial variants on the one hand, itcould be found out if the addition of verbal labels indeed increases unambiguousness.On the other hand, the comparison of labeled picture formats and purely verbal formatswould reveal if the presentation of vivid, intuitive pictures in addition to the wordsyields any advantages in terms of the performance criteria. Participants were random-ly assigned to one of the five format conditions.
To further facilitate intuitive answers, a simple dichotomous answer format was used.Participants were asked to indicate for each item (i.e., for each emotion) whether theyhad felt the emotion during the TV ad, yes or no.
The following performance criteria were used to evaluate the different scale variants:
■ scale handling (evaluation of understandability, user friendliness, and enjoying usingthe scale, as seen by the interviewees themselves)
■ validity in terms of conformity with expert judgments
■ differentiation between emotions
■ differentiation between TV ads
Sample
The sample consisted of 1250 participants (50% female; Mage = 40.4 years, SDage =14.4) from AskGfK, the GfK online panel. For her co-operation, each respondent re-ceived 250 panel points worth 2.50 Euros.
Procedure
At the beginning of the interview, respondents were presented with a list of brandsfrom each of the five product categories for which TV ads were shown. They were askedto select those brands that they would consider buying and to indicate their first cho-ice. Subsequently, each respondent saw two ads. Immediately after each ad, participantscompleted the emotion scale, presented in the format that had been randomly assignedto them. After completing the emotion scale, some general questions about the ad wereasked. After both TV ads had been shown and evaluated, participants again indicatedthe brands they would consider buying as well as their first choice for each productcategory. At the end, respondents were asked to evaluate how understandable they hadfound the emotion scale, and how much they had enjoyed doing the task.
MEASUREMENT OF EMOTIONSHuppGröppel-KleinDieckmannBroeckelmannWalter
87
Yearbook of Marketing and Consumer Research, Vol.6 (2008) GfK
MEASUREMENT OF EMOTIONSHupp
Gröppel-KleinDieckmann
BroeckelmannWalter
88
3.4.4 Results
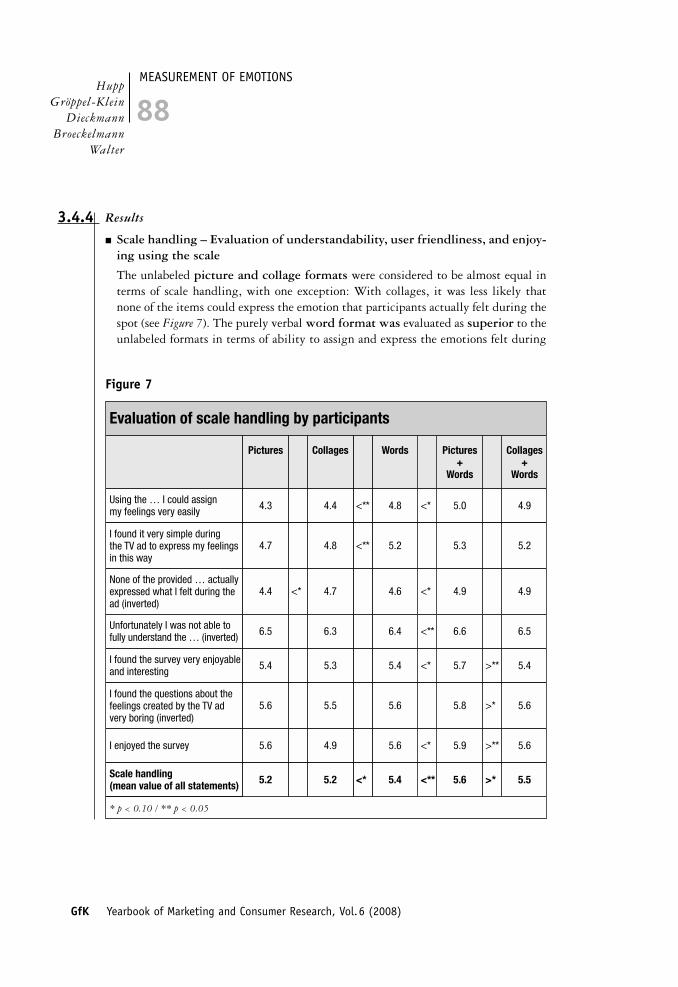
■ Scale handling – Evaluation of understandability, user friendliness, and enjoy-ing using the scale
The unlabeled picture and collage formats were considered to be almost equal interms of scale handling, with one exception: With collages, it was less likely thatnone of the items could express the emotion that participants actually felt during thespot (see Figure 7). The purely verbal word format was evaluated as superior to theunlabeled formats in terms of ability to assign and express the emotions felt during
Yearbook of Marketing and Consumer Research, Vol.6 (2008)GfK
Figure 7

the ad. Using the scale was further improved by presenting pictures in addition toverbal labels, that is, by the word plus picture format, especially regarding enjoy-ment, interest in the task, and ability to assign emotions.
Using labeled collages instead of labeled single pictures did not improve scalehandling any further. Participants even perceived the labeled collage format asslightly more tiring, less interesting than labeled single pictures. This result confirm-ed the comparison between unlabeled single pictures versus collages, which did notreveal clear added benefits for collages.
Significant differences are illustrated only for neighboring scale formats in Figure 7.Further significant contrasts exist, especially between labeled and unlabeled variants.
■ Validity – agreement with expert judgments
To evaluate the validity of the emotion profiles resulting from the five different scaleformats, 18 brand and communications experts at GfK indicated the emotions theyexpected to be elicited by each spot. Figure 8 shows mean absolute deviations, ave-raged across emotions, and correlations between the mean emotion profiles ofrespondents and those of the GfK experts. Again, the unlabeled formats were out-performed by the labeled formats, both with and without pictures. The word pluspicture format achieved the highest level of agreement with the experts’ judgments.
As already seen with the Sleeping Beauty spot in the picture validation study D,unlabeled formats raise further validity concerns if picture motifs bear a resemblan-ce to motifs shown in the TV ads. Picture assignment is then sometimes based on theoutward similarity in appearance of motifs (e.g., of the depicted persons) instead ofbeing based on the conformity of the emotions elicited by the ad with those ex-pressed by the picture. For instance, the emotion disappointment was assigned to theAdidas spot much more frequently in the unlabeled than in the labeled picture con-
MEASUREMENT OF EMOTIONSHuppGröppel-KleinDieckmannBroeckelmannWalter
89
Yearbook of Marketing and Consumer Research, Vol.6 (2008) GfK
Figure 8
MEASUREMENT OF EMOTIONSHupp
Gröppel-KleinDieckmann
BroeckelmannWalter
90
ditions. A more detailed analysis based on the assignment frequencies for each of thethree pictures shows that the frequent mention of disappointment can be ascribed tothe fact that a sports scene is shown on two of the disappointment pictures. The unla-beled picture of a disappointed track athlete was assigned by 35% of respondents,that of a disappointed goal-keeper by as many as 42%, while only 8% selected thepicture of a disappointed man on the telephone. In contrast, in the labeled pictureconditions assignment rates dropped to 13%, 7%, and 6%, respectively. Similarproblems with unlabeled pictures could be observed for basically every ad that wastested. The provision of labels seems to facilitate recollection of and adherence to theinstruction to assign pictures based in the depicted emotion.
■ Differentiation between emotions
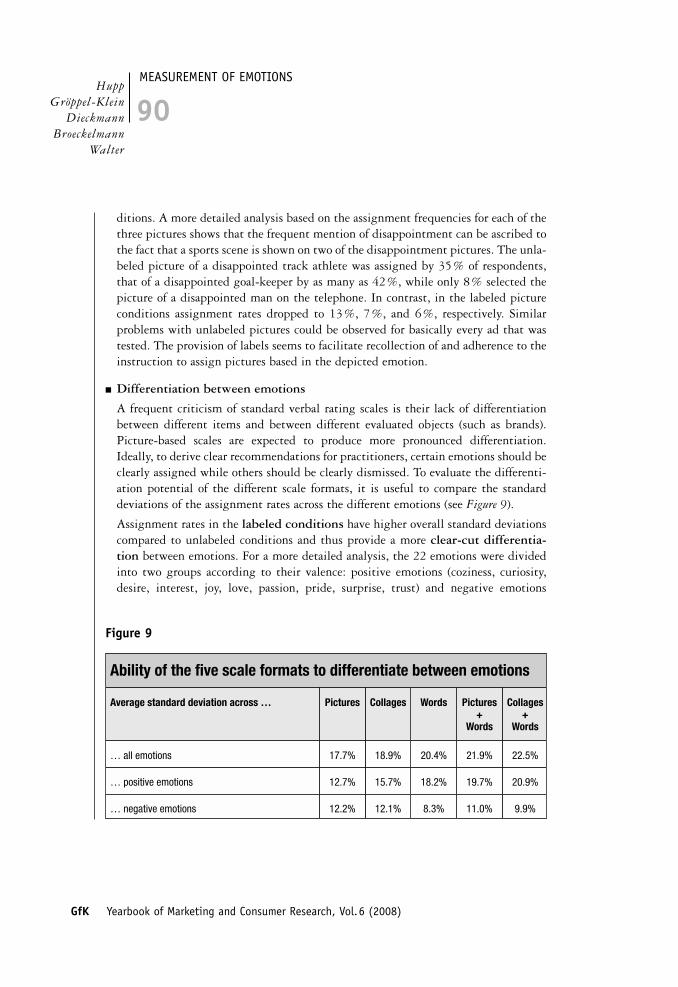
A frequent criticism of standard verbal rating scales is their lack of differentiationbetween different items and between different evaluated objects (such as brands).Picture-based scales are expected to produce more pronounced differentiation.Ideally, to derive clear recommendations for practitioners, certain emotions should beclearly assigned while others should be clearly dismissed. To evaluate the differenti-ation potential of the different scale formats, it is useful to compare the standarddeviations of the assignment rates across the different emotions (see Figure 9).
Assignment rates in the labeled conditions have higher overall standard deviationscompared to unlabeled conditions and thus provide a more clear-cut differentia-tion between emotions. For a more detailed analysis, the 22 emotions were dividedinto two groups according to their valence: positive emotions (coziness, curiosity,desire, interest, joy, love, passion, pride, surprise, trust) and negative emotions
Yearbook of Marketing and Consumer Research, Vol.6 (2008)GfK
Figure 9

(aggression, anger, boredom, compassion, disappointment, disgust, embarrassment,envy, fear, rejection, sadness, superiority). For the positive emotions in particular, thedifference between labeled and unlabeled conditions was even larger. The relativelylow standard deviations in the unlabeled conditions could be interpreted as anotherhint that the emotional content of certain pictures is not unambiguously recognized,resulting in random responses and thus indeterminate assignment rates rather thanin clear yes or no trends. Focusing on the negative emotions only, it is the purely ver-bal format that has the lowest standard deviation of all formats. In the light of thisresult, the mean assignment levels for negative emotions also reveal an interesting,potentially unwelcome trend: The purely verbal format achieves the lowest assign-ment rate of 9.8% on average across all negative emotions, whereas all other formatsachieve average assignment rates in double figures (15.0 % on average). Taken toge-ther, the low assignment rates and the poor differentiation of the word format for nega-tive emotions suggest a stronger trend towards socially desirable answers. In purely ver-bal questionnaires, participants may be more reluctant to admit negative emotions.
MEASUREMENT OF EMOTIONSHuppGröppel-KleinDieckmannBroeckelmannWalter
91
Yearbook of Marketing and Consumer Research, Vol.6 (2008) GfK
Figure 10
MEASUREMENT OF EMOTIONSHupp
Gröppel-KleinDieckmann
BroeckelmannWalter
92
3.4.5
■ Differentiation between TV ads
To evaluate the ability of the different scale formats to differentiate between spots,multidimensional scaling was applied. This way, the position of each spot could beplotted onto an emotion map separately for each format condition (see Figure 10).The further apart a spot is located from the center, the more different it is from theother spots in terms of elicited emotions. Figure 10 shows that the word format leadsto the least pronounced differentiation: The spots are closer together in the emo-tional map when their emotional impact has been measured using words only, com-pared to all other formats. For the spots located in the positive region on the left sideof the emotion map, the labeled variants (labeled pictures and labeled collages) leadto especially pronounced differentiation. For the more negative right side of the emo-tion map, all pictorial formats, labeled and unlabeled, perform comparably well inproducing a differentiated positioning for the spots. This result is in line with theabove-mentioned ability of the different formats to differentiate between emotions.
Summary
The scale formats with labels (words only, labeled pictures, labeled collages) out-perform the purely pictorial formats (pictures, collages) on almost all comparisoncriteria. An especially serious problem is that unlabeled pictures lead to the assignmentof some emotions that are completely unexpected in terms of the expert judgments.This can be explained by similarities in appearance between picture motifs and motifsshown in the TV ad. This problem can be avoided by using labeled pictures.
The comparison between the two labeled pictorial formats and the purely verbal for-mat reveals several advantages from presenting a picture in addition to a verballabel. Labeled pictures lead to more pronounced differentiation across both emotionsand TV spots. Socially desirable answers can be reduced, as indicated by higher selec-tion rates for the negative emotions that a spot is expected to elicit in terms of theexpert judgments. In general, labeled pictures produce higher levels of agreement withexpert judgments and the scale handling gets better scores compared to the other for-mats.
Regarding the comparison between labeled single pictures and labeled collages noconclusive recommendation can be derived. By providing a broader spectrum of pic-tures, labeled collages can reduce the risk that pictures are selected due to similarity inappearance between the emotion picture and the object to be evaluated. But on theother hand, the large number of pictures can make the interview more boring for inter-viewees and lead to declining attention. It would be advisable to assess this risk in pre-tests, or alternatively to move to using the labeled single picture from the outset.
Yearbook of Marketing and Consumer Research, Vol.6 (2008)GfK

4.
In sum, pictures that are subtitled with the appropriate emotion label form anideal compromise for capturing emotions. Thus, as far as the central question is con-cerned of whether verbal or pictorial methods are superior, neither one nor the other issuperior; instead, a combination of words and pictures outperforms alternative formatsacross a wide range of performance criteria. Misinterpretations and wrong selectionsbased on outward similarities of depicted motifs can thus be avoided. At the same time,the provision of pictures obviously increases the willingness of respondents to admit toexperiencing negative emotions. This reduces the detrimental effects of social desirabil-ity, encourages honest and spontaneous answers, and thus produces differentiated pro-files even for negative emotions. The scale – named GfK EMO Sensor – can now be applied to a wide range of questions relevant in marketing.
Applications
GfK EMO Sensor can help to reveal what lies beneath consumer attitudes and beha-vior. With this research tool, marketers can explore the emotions elicited at differentbrand touch points such as ads, exhibition stands, services, and products, and receiveanswers to questions of great practical relevance: What kind of emotions are elicited bycertain marketing activities, and what is their valence? How intense is the emotionalexperience induced in the audience? Does the marketing achieve truly integrated com-munications by yielding coherent emotional effects using different marketing activi-ties?
For advertising agencies, valuable recommendations can be derived from target-group-specific analysis of GfK EMO Sensor data. For instance, the Axe TV ad thatwas included in the large comparison study described above induced mainly negativeemotions – especially rejection and disgust – in viewers over 30 years old. In the pro-duct’s target group of young men, however, the ad succeeded in inducing also positiveemotions, in particular joy and interest, probably due to its humorous elements. Suchdiagnostic information can be generated in pre-tests prior to starting an advertisingcampaign and thus enable marketers to make informed decisions.
GfK EMO Sensor also provides input at the level of the attention attracted by anadvertisement and the personal engagement of the audience. The intensity of emotio-nal experiences is assessed by counting the number of emotions elicited by an adverti-sement. This intensity score is associated with the electrodermal reaction triggered bya TV ad (see picture validation study D) and can therefore indeed be regarded as a validindicator of personal engagement: TV ads with higher emotional intensity scores in-crease arousal and attention in the viewer, thus fostering engagement.
MEASUREMENT OF EMOTIONSHuppGröppel-KleinDieckmannBroeckelmannWalter
93
Yearbook of Marketing and Consumer Research, Vol.6 (2008) GfK

MEASUREMENT OF EMOTIONSHupp
Gröppel-KleinDieckmann
BroeckelmannWalter
94
As illustrated by the GfK Advertising Effectiveness Model in the introduction (seeFigure 1), engagement has a significant impact on the success of advertising. An ana-lysis across the different campaigns included in the GfK EMO Sensor database showsthat the behavioral impact of an ad increases with the intensity of viewers’ emo-tional experience (level 4 in the advertising model): The higher the level of emotio-nality, the more likely are respondents to include the advertised brand in their relevantset or even pick it as their choice. Figure 11 shows that this effect can mainly be attri-buted to the elicitation of positive emotions, whose intensity (just like the intensity ofnegative emotions) can again be calculated by counting the number of selected positi-ve emotions.
The results from GfK EMO Sensor are also associated with other indicators of adver-tising effectiveness of the GfK Advertising Effectiveness Model (see Figure 1). A TVcampaign for Deutsche Telekom shown all over Europe, featuring the currently well-known casting show candidate Paul Potts, is used to illustrate these relationships. GfKEMO Sensor demonstrates that this TV commercial induces the strongest emotional
Yearbook of Marketing and Consumer Research, Vol.6 (2008)GfK
Figure 11

5.
responses among all ads tested so far. In particular, strong positive emotions such assurprise, pride and passion are elicited (4).
As a consequence of its positive emotionality, the spot leads to a noticeable positivechange in brand personality compared to a control group who did not view the spot(level 2: brand associations). The brand is associated more frequently with personalitytraits such as “enthusiastic”, “open-minded”, and even “vulnerable” – traits that standin harsh contrast to the negative stereotypes commonly associated with the Telekombrand. Other criteria of success, that belong to level 2 in the advertising model such asbrand image, are enhanced as well. Image components such as “treating customershonestly and fairly” or “offering uncomplicated services” are evaluated more favorablythan in the control group.
However, emotions are only a necessary, but not sufficient condition for advertisingsuccess, as demonstrated by effectiveness criteria in level 3 in the advertising model.There is no improvement in rational brand evaluations of Telekom such as in brandcompetence (service quality, superiority). Considering that the spot does not provideany direct product information, this comes as no surprise. Emotional aspects of brandattractiveness, in contrast, do show improvement: The advertising campaign succeedsin increasing brand uniqueness and, more importantly, sympathy for Telekom.Additionally, the liking of the spot itself is extremely high compared to other spots inthe GfK pre-test database. Finally, brand loyality (level 4 of the advertising model) isstrengthened, as indicated by increased disposition to repeat usage.
Conclusion and future prospects
GfK EMO Sensor is a picture-based, thoroughly validated tool that makes possibledifferentiated measurement of emotional responses to advertising. The combina-tion of pictures and appropriate emotion labels proved superior in a comprehensivecomparison study, by assuring precise, unambiguous understanding of the pictures andfacilitating spontaneous, honest answers.
In initial applications, the research tool demonstrated its usefulness in the context ofadvertising effectiveness research. For instance, the valence of the emotions elicited bya TV commercial could be associated with the intention to buy as well as with other,softer criteria of ad effectiveness (e.g., brand attitude, attitude towards the advertise-ment). Further applications in market research are currently being explored, for exam-ple, in the evaluation of retail stores and new products, as well as in mystery shoppingand car clinics (where cars and car accessories together with competitive products areassessed by drivers before or shortly after market launch). GfK EMO Sensor will pro-
MEASUREMENT OF EMOTIONSHuppGröppel-KleinDieckmannBroeckelmannWalter
95
Yearbook of Marketing and Consumer Research, Vol.6 (2008) GfK

MEASUREMENT OF EMOTIONSHupp
Gröppel-KleinDieckmann
BroeckelmannWalter
96
vide marketers with better access to the motives underlying consumer behavior. Thus,marketing and market research are supplemented by a reliable measurement tool forevaluating marketing activities and optimizing them from a consumer perspective.Future research will address further relationships. For instance, emotions are expectedto increase advertising recall and recognition independently of their valence (level 1 inthe GfK Advertising Effectiveness Model, see Figure 1) – a hypothesis that remains tobe tested.
Notes
(1) The GfK Advertising Effectiveness Model distinguishes structural and executionalcatalysts. Examples of structural catalysts are the type of advertising medium (e.g.,exhibitions stands tend to create more attention and provide more information thanTV ads) and the relevance of the advertised product to the audience (for a family,for instance, a people carrier is of much more interest than a two-seater). The struc-tural catalysts comprise the general framework for communication and cannot becontrolled by marketers. They are decisive for the willingness to engage with anadvertising medium and are therefore necessary requirements for advertising suc-cess. Among the executional catalysts are well-known creative techniques such asuse of stimuli of high sensory intensity (colors, loud sounds) or emotional stimuli(surprising twists, humor, physically attractive models; cf. Kroeber-Riel 1993,p.101 ff.). The present article focuses on the latter.
(2) According to Heath (2007, p.23), “engagement occurs when consumers devotesome mental time and effort to the brand or brand communication”. He also highlights the close connection between engagement and emotions. For more in-formation on the involvement construct, see Kroeber-Riel et al. (2008) and Hupp(1999).
(3) Moods, attitudes, personality traits, and feelings are closely related to the emotionconstruct (Scherer 2005, p. 703 ff.). In contrast to emotions, moods are more diffu-se and longer-lasting affective states, often without apparent cause (e.g., bad moodvs. the emotion of anger). Attitudes, which are highly relevant in brand research,can also have a strong affective component, besides cognitive and behavioralaspects. But again, attitudes are relatively long-lasting and their affective intensityis lower. Similarly, personality traits include emotional aspects and describe rela-tively stable tendencies of a person to experience certain emotions and moods morefrequently (e.g., irritable persons often experience anger). The term feeling, finally,denotes the subjective experience component of emotions and thus is only one ele-ment of the emotional response.
(4) The ad was tested using the GfK AD*VANTAGE Multimedia pre-test system in a two-group experimental design, with a control group which was not shown thead. Thus, by comparing test and control groups, changes in brand image and brandstrength can clearly be attributed to the advertisement.
Yearbook of Marketing and Consumer Research, Vol.6 (2008)GfK

References
Aaker, D. A. /Stayman, D. M./Hagerty, M. R. (1986): Warmth in Advertising: Measure-ment, Impact, and Sequence Effects, in: Journal of Consumer Research, Vol.12, pp. 365–381.Bagozzi, R. P. /Gopinath, M./Nyer, P. U. (1999): The Role of Emotions in Marketing,in: Journal of the Academy of Marketing Science, Vol. 27, pp. 184–206.Baun, D. /Gröppel-Klein, A. (2003): Happiness and Surprise as Guides to a BetterUnderstanding of Impulse Buying Behaviour, in: European Advances in ConsumerResearch, Vol. 6, Provo, UT, pp. 290–299.Bechara, A. /Damasio, H. /Tranel, D. /Damasio, A. R. (2005): The Iowa Gambling Taskand the Somatic Marker Hypothesis: Some Questions and Answers, in: Trends inCognitive Sciences, Vol. 9, pp. 159–62.Belk, R. W./Ger, G. /Askegaard, S. (2003): The Fire of Desire: A Multisited Inquiry intoConsumer Passion, in: Journal of Consumer Research, Vol. 30, pp. 326–351.Bosch, C. /Schiel, S. /Winder, T. (2006): Emotionen im Marketing [Emotions in Marke-ting], Wiesbaden.Boucsein, W. (1992): Electrodermal Activity, New York.Damasio, A. R. (1996): The Somatic Marker Hypothesis and the Possible Functions ofthe Prefrontal Cortex, in: Philosophical Transactions of the Royal Society of London –Series B, Vol. 351, pp. 1413–1420.Darwin, C. R. (1872): The Expression of the Emotions in Man and Animals, London.Retrieved online: http://darwin-online.org.uk/content/frameset?itemID=F1142&view-type=text&pageseq=1. Ekman, P. (1972): Universals and Cultural Differences in Facial Expressions ofEmotion, in: Cole, J. (ed.): Nebraska Symposium on Motivation 1971, Vol. 19, Lincoln,NE, pp. 207–283.Ekman, P. /Friesen, W. V. (1975): Unmasking the Face: A Guide to Recognizing Emo-tions from Facial Clues, Englewood Cliffs, NJ.Fehr, B. /Russell, J.A. (1984): Concept of Emotion Viewed from a Prototype Per-spective, in: Journal of Experimental Psychology: General, Vol. 113, pp. 464–486.Franzen, G. (1999): Brands & Advertising: How Advertising Effectiveness InfluencesBrand Equity, Henley-on-Thames, UK.Griffin, A. /Hauser, J. R. (1993): The Voice of the Customer, in: Marketing Science, Vol. 12, pp. 1–27.Gröppel-Klein, A. (2004): Aktivierungsforschung und Konsumentenverhalten [Activa-tion Research and Consumer Behavior], in: Gröppel-Klein, A. (ed.): Konsumentenver-haltensforschung im 21. Jahrhundert [Consumer Research in the 21st Century], Wies-baden, pp. 29–66.Gröppel-Klein, A. /Domke, A. /Bartmann, B. (2006): Pretty Woman or Erin Brockovich?Unconscious and Conscious Reactions to Commercials and Movies Shaped by Fairy
MEASUREMENT OF EMOTIONSHuppGröppel-KleinDieckmannBroeckelmannWalter
97
Yearbook of Marketing and Consumer Research, Vol.6 (2008) GfK

MEASUREMENT OF EMOTIONSHupp
Gröppel-KleinDieckmann
BroeckelmannWalter
98
Tale Archetypes – Results from Two Experimental Studies, in: Advances in ConsumerResearch, Vol. 33, pp. 163–174.
Haidt, J. (2001): The Emotional Dog and its Rational Tail: A Social IntuitionistApproach to Moral Judgment, in: Psychological Review, Vol. 108, pp. 814–834.
Haimerl, E. (2007): Emotional or Rational Advertising? A Fatal Error in Communi-cation and Advertising Research [Emotionale oder rationale Werbung? Über einen ver-hängnisvollen Irrtum in Kommunikation und Werbeforschung], in: Jahrbuch derAbsatz- und Verbrauchsforschung, Vol. 53, pp. 4–30.
Heath, R. (2007): Engagement Measures of Brand Message, in: Plummer, J. et al. (eds.):Measures of Engagement. White Paper published by the ARF, New York, pp. 11–32.
Hupp, O. (1999): Seniorenmarketing – Informations- und Entscheidungsverhalten älte-rer Konsumenten [Marketing for Seniors – Information and Decision Behavior amongSenior Consumers], Hamburg.
Izard, C. E. (1971): The Face of Emotion, New York.
Izard, C. E. (1994): Die Emotionen des Menschen: Eine Einführung in die Grundlagender Emotionspsychologie [Human Emotions: An Introduction to the Basics of EmotionPsychology], Weinheim.
Keller, K.L. (2008a): Strategic Brand Management: Building, Measuring and ManagingBrand Equity, 3rd ed., Upper Saddle River, NJ.
Keller, K. L. (2008b): Brand Planning, Cape Town, South Africa.
Kroeber-Riel, W. (1993): Bildkommunikation [Visual Communication], Munich.
Kroeber-Riel, W./Weinberg, P. /Gröppel-Klein, A. (2008): Konsumentenverhalten [Con-sumer Behavior], 9th ed., Munich.
Lang, P. J. /Bradley, M. M./Cuthbert, B. N. (1999): The International Affective PicturesSystem (IAPS): Technical Manual and Affective Ratings, Gainesville, FL.
Lazarus, R. S. (1982): Thoughts on the Relations between Emotion and Cognition, in:American Psychologist, Vol. 37, pp. 1019–1024.
LeDoux, J. E. (1996): The Emotional Brain, New York.
Plutchik, R. (1962): The Emotions: Facts, Theories and a New Model, New York.
Plutchik, R. (1991): The Emotions, Lanham, MD.
Plutchik, R. E. (2003): Emotions and Life – Perspectives from Psychology, Biology andEvolution, Washington, D.C.
Russell, J. A. /Mehrabian, A. (1977): Evidence for a Three-Factor Theory of Emotions,in: Journal of Research in Personality, Vol. 11, pp. 273–294.
Scherer, K. R. (2005): What are Emotions? And How Can They Be Measured?, in: SocialScience Information, Vol. 44, pp. 693–727.
Tomkins, S. S. (1962): Affect, Imagery, Consciousness, Vol. 1: The Positive Affects. NewYork.
Yearbook of Marketing and Consumer Research, Vol.6 (2008)GfK

Verbeek, W./Belschak, F. /Bagozzi, R. P. (2004): The Adaptive Consequences of Pride inPersonal Selling, in: Journal of the Academy of Marketing Science, Vol. 32, pp. 386–402.
Zajonc, R. B. (1980): Feeling and Thinking. Preferences Need No Inferences, in: Ame-rican Psychologist, Vol. 35, pp. 151–175.
Zeitlin, D. M./Westwood, R. A. (1986): Measuring Emotional Response, in: Journal ofAdvertising Research, Vol. 26, pp. 34–44.
MEASUREMENT OF EMOTIONSHuppGröppel-KleinDieckmannBroeckelmannWalter
99
Yearbook of Marketing and Consumer Research, Vol.6 (2008) GfK


![Capturing & Measuring Emotions in UX · The Plutchik Emotion Wheel [1], developed by Plutchik, offered a variety of emotions that were more nuanced than the eight primary emotions.](https://static.fdocuments.us/doc/165x107/5e6d7ba926154f67de6b0d4d/capturing-measuring-emotions-in-ux-the-plutchik-emotion-wheel-1-developed.jpg)