![Measuring Usability Compliance of a [1] Ph.D, … · 2017-08-17 · Malaysian Online Journal of Educational Technology 2017 (Volume 5 - Issue 3 ) Measuring Usability Compliance of](https://static.fdocuments.us/doc/165x107/5f0fdcc07e708231d4464169/measuring-usability-compliance-of-a-1-phd-2017-08-17-malaysian-online-journal.jpg)
Beyond Usability - Measuring Elements of User … · Beyond Usability – Measuring Aspects of User...
113
DISS. ETH NO. 17901 Beyond Usability – Measuring Aspects of User Experience A dissertation submitted to the SWISS FEDERAL INSTITUTE OF TECHNOLOGY ZURICH for the degree of Doctor of Sciences presented by Philippe Georges Zimmermann Dipl. Natw. ETH born 17.02.1972 citizen of Ennetbürgen, Nidwalden accepted on the recommendation of Prof. Dr. Theo Wehner, examiner Prof. Dr. Sissel Guttormsen Schär, co-examiner Prof. emer. Dr. Dr. Helmut Krueger, co-examiner 2008
Transcript of Beyond Usability - Measuring Elements of User … · Beyond Usability – Measuring Aspects of User...

DISS. ETH NO. 17901
Beyond Usability – Measuring Aspects of User Experience
A dissertation submitted to the
SWISS FEDERAL INSTITUTE OF TECHNOLOGY ZURICH
for the degree of
Doctor of Sciences
presented by
Philippe Georges Zimmermann
Dipl. Natw. ETH
born 17.02.1972
citizen of Ennetbürgen, Nidwalden
accepted on the recommendation of
Prof. Dr. Theo Wehner, examiner Prof. Dr. Sissel Guttormsen Schär, co-examiner Prof. emer. Dr. Dr. Helmut Krueger, co-examiner
2008
Page 1
Table of Contents Summary ........................................................................................................... 4
Zusammenfassung ............................................................................................ 6
1 Introduction ................................................................................................. 8
1.1 Background .......................................................................................... 8
1.2 User Experience ................................................................................. 10
1.3 Measuring elements of User Experience ............................................ 13
1.4 Scope ................................................................................................. 15
1.5 Outline ................................................................................................ 16
2 Existing approaches to User Experience evaluation .................................. 17
2.1 Introduction ........................................................................................ 17
2.2 UX models and frameworks ................................................................ 19
2.2.1 Beyond the instrumental ............................................................... 19
2.2.2 Emotion, mood and affect ............................................................. 23
2.2.3 The experiential ............................................................................ 26
2.2.4 Related evaluation approaches .................................................... 28
2.3 Measuring UX ..................................................................................... 28
2.3.1 Measurement considerations........................................................ 29
2.3.2 Measuring affect ........................................................................... 32
2.3.3 Measuring hedonic qualities ......................................................... 39
2.3.4 Measuring the experiential ........................................................... 41
3 Method ..................................................................................................... 43
3.1 First impressions and affective reactions ............................................ 43
3.1.1 A UX framework ........................................................................... 43
3.2 The mediating effect of mood and affect in interaction ........................ 47
3.2.1 Affect, emotion, mood .................................................................. 47
3.2.2 Affect in UX .................................................................................. 49
3.2.3 Towards a measurement instrument for mood in UX .................... 51
3.3 Sensory encounters and hedonic qualities .......................................... 52
3.3.1 Hedonic and pragmatic qualities of products ................................ 52
3.3.2 Sensory encounters ..................................................................... 52
3.3.3 Towards a measurement instrument for hedonic qualities ............ 53
4 Study 1: Mood in interaction ..................................................................... 55
4.1 Introduction ........................................................................................ 55
4.2 Method – Experiment 1 ....................................................................... 56
4.2.1 Design .......................................................................................... 56
4.2.2 Subjects ....................................................................................... 56
4.2.3 Mood induction ............................................................................. 56

Page 2
4.2.4 Questionnaires ............................................................................. 58
4.2.5 Task ............................................................................................. 58
4.2.6 Technical environment ................................................................. 58
4.2.7 Procedure .................................................................................... 60
4.2.8 Behavioural measurements .......................................................... 61
4.2.9 Data preparation .......................................................................... 62
4.3 Results ............................................................................................... 66
4.3.1 Participants .................................................................................. 66
4.3.2 Valence and arousal ratings ......................................................... 66
4.3.3 Mouse movement parameters ...................................................... 67
4.4 Method – Experiment 2 ....................................................................... 69
4.4.1 Design .......................................................................................... 69
4.4.2 Subjects ....................................................................................... 69
4.4.3 Mood induction ............................................................................. 70
4.4.4 Questionnaires ............................................................................. 70
4.4.5 Task ............................................................................................. 70
4.4.6 Behavioural measurements .......................................................... 70
4.4.7 Procedure .................................................................................... 70
4.5 Results ............................................................................................... 70
4.5.1 Participants .................................................................................. 70
4.5.2 Valence and arousal ratings ......................................................... 71
4.5.3 Mouse movement parameters ...................................................... 72
4.6 Discussion .......................................................................................... 72
4.6.1 Mood induction with film clips ....................................................... 72
4.6.2 Movement parameters.................................................................. 73
4.6.3 Parameter selection and analysis ................................................. 75
4.6.4 Conclusions ................................................................................. 75
5 Study 2: Perceived hedonic quality ........................................................... 76
5.1 Introduction ........................................................................................ 76
5.2 Modules .............................................................................................. 78
5.2.1 Manikin library .............................................................................. 78
5.2.2 Semantic differential ..................................................................... 80
5.2.3 Self-Assessment Manikin ............................................................. 82
5.2.4 Personality ................................................................................... 84
5.2.5 Lifestyle ........................................................................................ 84
5.2.6 Direct inquiries about the product ................................................. 86
5.2.7 Demographics .............................................................................. 87
5.2.8 Analysis module ........................................................................... 88
5.3 Discussion .......................................................................................... 89
6 Conclusions .............................................................................................. 91

Page 3
Annex ........................................................................................................... 93
Annex A: Mouse movement parameters ....................................................... 93
Annex B: Smoothing and interpolation of data .............................................. 97
References ...................................................................................................... 98
Page 4
Summary Over the last decade, there has been growing interest in the topic of User
Experience (UX). As technology matured, interactive products became not only
more useful and usable, but also fashionable, fascinating things to desire.
Traditionally, human-computer interaction (HCI) research has developed quality
measures for interactive, goal- and task-oriented technology. Driven by the
impression that a narrow focus on interactive products as tools does not capture
the variety and emerging aspects of technology use, practitioners and
researchers alike are looking for a viable alternative to traditional HCI.
Although the usability definition in the ISO 9241-11 standard (ISO, 1998)
already contains the notion of satisfaction, UX is encompassing more than just
satisfaction. However, UX research is a still young discipline that incorporates
researchers from diverse fields with their differing views. It comes as no surprise
that UX theory and definitions are somewhat fuzzy and inconclusive. A common
understanding has formed around the notion that UX takes a holistic view that
encompasses also non-task related issues, is subjective and emphasizes positive
aspects of interaction. The theoretical research frameworks that evolved over the
years stress three different aspects of UX: non-task related, hedonic aspects,
user needs, and affect and emotions.
In parallel with the emerging research frameworks, a range of new
measurement methods was developed. Based on the diverging theoretical basis,
there are numerous measurement methods, ranging from mood boards to
sophisticated questionnaires, from interviews to physiological measurements. A
need for systematic measurement and the development of new measures for UX
has been identified.
Based on a model of UX that is described in this thesis, two aspects of UX
were found to be important to measure: mood and perceived hedonic quality.
Mood plays a central, mediating role in product perception and evaluation.
Although there are existing methods to measure mood state, they are not
applicable to the interaction phase of human product interaction. The hypothesis
states that a changing mood state expresses itself in motor behaviour and that
the changes in motor behaviour can be measured. A test environment for the
recording of computer mouse actions was developed. Two experiments were
conducted with inconclusive results. There are indications that motor expression
and affective arousal are connected.

Page 5
The second measurement method is based on first impressions of products,
so called “sensory encounters”. Perceived hedonic quality, encompassing
aesthetic and symbolic aspects of products, plays an important role in sensory
encounters. Hedonic qualities of a product are comprised of the needs for
stimulation, identification and evocation. The complex nature of product character
has led to the development of a multifactorial measurement method, which
applies a projective method with visual and verbal test modules.

Page 6
Zusammenfassung Über das letzte Jahrzehnt ist das Interesse am Thema User Experience (UX)
stetig gewachsen. Während die Technik langsam den Kinderschuhen entwächst,
wurden interaktive Produkte nicht nur brauchbarer und benutzbarer, sondern
auch modische, faszinierende Dinge, zu denen eine emotionale Bindung
aufgebaut werden kann. Seit langem werden in der die Mensch-Maschinen
Interaktionsforschung Instrumente für die Qualitätsmessung von ziel- und
aufgabenorientierter Technologie entwickelt. Getrieben vom Eindruck, dass ein
zu enger Fokus auf interaktiven Produkten als Werkzeuge die Gesamtheit und
die Variabilität von wichtiger werdenden Aspekten der Technologiebenutzung
nicht berücksichtigen kann, haben sich Forscher und Praktiker gleichermassen
nach Alternativen zur traditionellen MMI umgesehen.
Obwohl bereits die Usability Definition im ISO 9241-11 Standard (ISO, 1998)
„Zufriedenheit“ erwähnt, umfasst das Konzept der UX doch deutlich mehr.
Allerdings ist UX eine noch junge Disziplin, die Forscher und Praktiker aus allen
möglichen Gebieten umfasst, mit all ihren verschiedenen Ansichten. Es erstaunt
deshalb nicht, dass UX Theorien und Definitionen noch immer unklar und wenig
einheitlich sind. Ein gemeinsames Verständnis hat sich herausgebildet, welches
UX eine holistische, ganzheitliche Sichtweise zuschreibt, die auch nicht
aufgabenorientierte Aspekte berücksichtigt, das die Betonung auf das Subjektive
von UX legt und das den Fokus von UX auf den positiven Aspekten der
Interaktion sieht. Die theoretischen Modelle, die über die letzten Jahre
entstanden sind, betonen drei verschiedene Aspekte von UX: die nicht
aufgabenorientierte Sichtweise, die Berücksichtigung von hedonischen,
ganzheitlichen Aspekten und Benutzerbedürfnissen, sowie Stimmungen und
Emotionen.
Parallel zu den sich entwickelnden theoretischen Modellen wurden eine Reihe
von Messmethoden entwickelt. Basierend auf den divergierenden theoretischen
Grundlagen sind unzählige Messmethoden entstanden, von Mood-Boards bis
ausgeklügelten Fragebögen, von Interviewtechniken bis zu physiologischen
Messungen. Trotz dieser Vielfalt konnte ein Bedürfnis nach systematischer
Messung von UX ausgemacht werden.
Basierend auf einem UX Modell, welches in dieser These dargestellt wird,
sind zwei Aspekte identifiziert worden die für eine Messung berücksichtigt werden
sollten: Stimmung und wahrgenommene hedonische Qualität. Stimmungen
spielen eine wichtige, vermittelnde Rolle in der Produktwahrnehmung und
Produktevaluation. Es gibt zwar bereits einige Methoden für die Messung von

Page 7
Stimmung, aber die lassen sich während der Interaktion mit einem Produkt nur
schlecht oder gar nicht anwenden. Die Grundhypothese für die Entwicklung einer
neuen Methode für die Stimmungsmessung besagt, dass sich ändernde
Stimmungszustände im motorischen Verhalten zeigen und diese
Verhaltensänderungen gemessen werden können. Es wurde eine Testumgebung
entwickelt, mit der Mausaktionen an einem Computer aufgezeichnet und
ausgewertet werden können. Zwei Experimente wurden durchgeführt, die aber
keine klaren Resultate zeigen. Es gibt Hinweise aus dem ersten Versuch, dass
ein Zusammenhang zwischen affektiver Erregung und motorischem Ausdruck
besteht.
Die zweite Messmethode basiert auf dem ersten Eindruck den man von
Produkten bekommt. Diese Eindrücke wurden als „Sensory Encounters“
beschrieben, weil sie in erster Linie sinnlich sind. Die wahrgenommene
hedonische Qualität von Produkten umfasst ästhetische und symbolische
Aspekte von Produkten und spielt eine Wichtige Rolle in Sensory Encounters.
Hedonische Qualitäten können weiter unterteilt werden in die Bedürfnisse nach
Stimulation, Identifikation und Evokation. Die komplexe Natur des
Produktcharakters hat zu einer multifaktoriellen Messmethode geführt, welche
einen projektiven Ansatz implementiert mit verbalen und graphischen
Testmodulen.

Page 8
1 Introduction A goal of Human-Computer Interaction (HCI) research has
always been the development of quality measures for interactive
products. A well-known and widely accepted quality measure of
products in task-oriented settings is usability. Over the last decade, a
new generation of interactive software and electronic products came
into market and the HCI community became aware that
performance- and task-oriented measures like effectiveness and
efficiency could not accurately predict or explain the attractiveness
and market success of these new products. Beginning in the 1990ies
and especially in recent years, a whole range of new concepts and
measures – like emotional usability (Logan, 1994), pleasure (Jordan,
2000) or hedonic qualities (Hassenzahl, 2001) – were developed to
evaluate non-utilitarian qualities of products, subsumed in the
research field of User Experience (UX). While these concepts and
models are still very diverse, a common understanding of the
elements determining UX is taking shape. Unlike Usability, which is
concerned mainly with the attributes of the product and the
prevention of obstacles and errors, the focus of UX is on the user
and the construction of a positive user experience and its expression
in the emotions, attitudes and values resulting from the interaction
with a product.
1.1 Background
Today, designers and developers have an unprecedented freedom when
designing products: advances in material sciences, production technology and
logistics, the continuing miniaturisation of components, the increasing speed of
computer chips, and the drop of prices for materials and parts have given great
freedom when planning and designing products. The global markets for
technology and materials have led to technically mature, but also very similar
products in respect to functionality, technical standard and price. Examples of this
trend are electronic products like mp3-players, mobile phones or computers.
Hence, on a global market it becomes increasingly important for companies to
differentiate their products with a distinct visible design and the creation of an
individual image through marketing and company brand instead of additional
functionality or price.
Moreover, consumers and users increasingly express a demand for
differentiated design. People like to express their individual lifestyle or their
affiliation with the social peer group through products they own and use (Crilly,

Page 9
Moultrie, & Clarkson, 2004). Clothing, cars, bags or mobile phones have become
a projection surface for people’s identity. Experiential marketing has picked up
this line of thought by stressing that not functionality and features of a product are
important to the consumer, but the overall “experience” that people choose after
identifying the relevance of a brand or product to their needs. Customers want
products “that dazzle their senses, touch their hearts and stimulate their minds”
(Lenderman, 2006, p. 18).
While at first sight this experience-centred view seems appropriate for
products and devices for a personal, private use only (e.g. games), it applies
increasingly to applications and devices in the professional area as well. On the
one hand, because interactive appliances and software have become an integral
part of our everyday lives that we use to communicate, to entertain us, to gather
information and other daily activities. On the other hand, because the clear
boundaries between work related and private applications of products start to
blur: we use mobile phones and handhelds, email, laptops or the internet and its
many services both privately and professionally. There is a shift from
performance- and task-oriented systems, we use to get work efficiently and
effectively done, to experiences with and through interactive systems that
stimulate or please us aesthetically, psychologically, physiologically, socially,
intellectually, etc.
Through this shift in interactive system use, the demand of companies for
differentiation of their products in more than functionality and the demand of the
consumers for individualization, stimulation and use experience, the focus of
design and production of products has changed. With these new demands, the
need for new quality criteria and methods for quality evaluation of interactive
systems has emerged.
Although the HCI community has readily embraced the notion that
functionality and performance-oriented measures are not enough to judge the
quality of a product, there has been little theoretical underpinning in the field to
meet the demands of this change. HCI research has put a lot of effort in the
development of methods and tools for usability evaluation, but has only recently
started to describe theoretical models that explain the attractiveness of products
and the elements that describe the experience before, while and after the use of
products. The question is less how the system is used, but why, and if, people
like and use certain products (and why not others) and what they gain from using
it. An efficient and effective product interaction that leads to a satisfied user
seems just not enough. Hassenzahl, Platz, Burmester and Lehner (2000) also
criticize the measure of satisfaction within the usability concept:

Page 10
“We are aware that user satisfaction is a part of the usability concept
provided by ISO 9241-11. However, it seems as if satisfaction is
conceived as a consequence of user experienced effectiveness and
efficiency rather than a design goal in itself. This implies that
assuring efficiency and effectiveness alone guarantees user
satisfaction.”
(Hassenzahl, Platz, Burmester, & Lehner, 2000, p. 202)
Fulton, a game designer, put it concisely in a statement about games and
usability: “The easiest game to use would consist of one button labelled Push.
When you push it, the display says YOU WIN.” (Pagulayan, Keeker, Wixon,
Romero, & Fuller, 2003, p. 886). Nonetheless, usability is a widely accepted
quality aspect of interactive products, and it has not become obsolete in
“experience design” (Shedroff, 2001), but today people often take it for granted
that a product is useful and usable. Moreover, there is evidence (e.g.
Hassenzahl, 2004a) that there is a complex interplay between aesthetic and
functional attributes of products.
1.2 User Experience
Over the last decade, a range of theoretical models have evolved (e.g. Logan,
1994; Jordan, 2000; Hassenzahl, 2001; Mäkelä & Fulton Suri, 2001; Garrett,
2002; Battarbee, 2004; Mahlke, 2008), trying to grasp the elements of the user-
product interaction that go beyond effectiveness and efficiency. They have been
published in a new research area referred to as User Experience (UX). However,
these models and research frameworks, coming from practitioners and
researchers of areas like psychology, design, HCI, ethnography, marketing or
philosophy, are far from having a coherent understanding of what user
experience actually is. Looking at the historical roots of the term and the diverse
professions involved in the development of UX, it comes as no surprise that a
consortium1 of UX researchers collected five fundamentally different coexisting
definitions of UX.
Although there are early occurrences of the term “user experience” (e.g. in
Edwards and Kasik’s “User Experience with the CYBER graphics terminal”
(1974)), Norman and Draper were among the first to use it in today’s sense in a
book on user-centred system design:
“This section of the book contains chapters that get directly at the
question of the quality of the user’s experience. This is of course the
1 COST Action 294 – MAUSE: http://www.cost294.org/

Page 11
ultimate criterion of User Centered System Design, but most workers
approach it obliquely in various ways such as exploring the
implementation techniques, or applying existing cognitive
approaches.”
(Norman & Draper, 1986, p. 64)
While the expression itself disappeared for a few years from the area of user-
centred design, the concept was picked up in different contexts (e.g. Carroll &
Thomas, 1988; Davis, Bagozzi, & Warschaw, 1992; Logan, 1994) and gradually
evolved to the understanding of UX we have today. Katja Battarbee correctly
states that in the design domain, experiences have always been addressed
(Battarbee, 2004, p. 23), but Experience Design has a somewhat different
meaning as it describes a hybrid design discipline that focuses on environmental
and multi-sensorial design, particularly in the context of digital displays and
installations (Knemeyer & Svoboda, 2006).
Popularized in the HCI community was the term by Donald Norman’s self-
selected professional title of User Experience Architect for his job at Apple
Computer Inc. in 1993. Because of Norman’s status as a thought leader in the
HCI community, this unconventional title raised awareness for the new concept.
The link that connects all UX research is the entirely user-oriented perspective on
human-product interaction. The quality of a product can be evaluated only from
the perspective of the user. UX is a holistic, all-encompassing concept that takes
characteristics of the user, the product and the usage situation into account. In
addition, UX also emphasises the importance of emotional aspects of the user
(emotional experience) as well as the product (emotional expression).
Hassenzahl, Law and Hvannberg (2006) emphasise three main aspects where
UX is going beyond the traditional usability metrics:
- Holistic: Usability focuses on task related (pragmatic) aspects and their
accomplishment, whereas UX takes a more holistic approach, including
non-task related (hedonic) aspects of product possession and use, such
as beauty, challenge, stimulation or self-expression.
- Subjective: Having its origin in psychology and human factors, usability
evaluation with “objective” measurement methods (e.g. eye-tracking) and
rests primarily on observation. UX stresses the “subjective”, it is explicitly
interested in the way people experience and judge products they use. It
may not matter how good a product is objectively, it must also be
experienced to have an impact.
- Positive: While usability focuses on problems, barriers, frustration or
stress and how they can be overcome, UX stresses the importance of
positive outcomes of technology use or possession, e.g. positive emotions
Page 12
such as joy, pride, and excitement or simply value. This does not imply
that usability is unessential. It rather emphasizes that positive does not
necessarily equate with an absence of the negative.
Although this sounds like a common understanding of UX, in the existing
literature UX “is associated with a broad range of fuzzy and dynamic concepts,
including emotional, affective, experiential, hedonic, and aesthetic variables. ...
Inclusion and exclusion of particular values or attributes seem arbitrary,
depending on the author’s background and interest. ... [And] the landscape of UX
research is fragmented and complicated by diverse theoretical models with
different foci such as emotion, affect, experience, value, pleasure, beauty, etc.”
(Law, Roto, Vermeeren, Kort, & Hassenzahl, 2008, p. 2396). All of this
complicates a concise definition of UX.
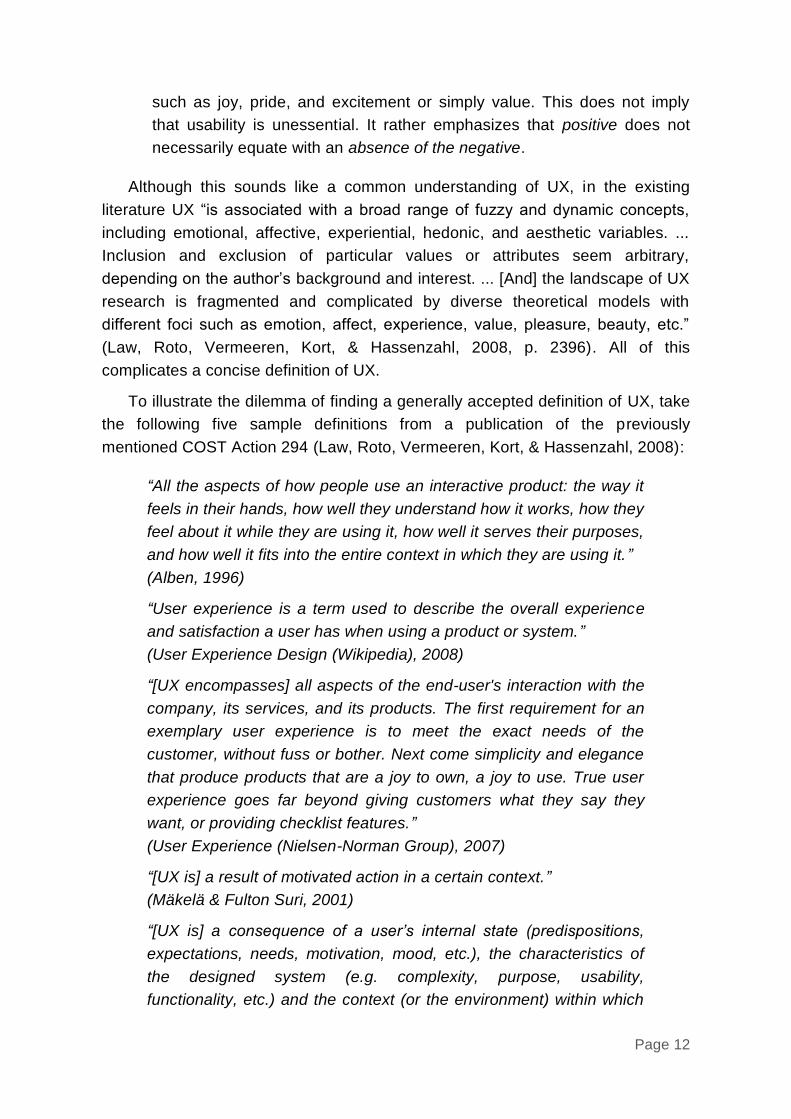
To illustrate the dilemma of finding a generally accepted definition of UX, take
the following five sample definitions from a publication of the previously
mentioned COST Action 294 (Law, Roto, Vermeeren, Kort, & Hassenzahl, 2008):
“All the aspects of how people use an interactive product: the way it
feels in their hands, how well they understand how it works, how they
feel about it while they are using it, how well it serves their purposes,
and how well it fits into the entire context in which they are using it.”
(Alben, 1996)
“User experience is a term used to describe the overall experience
and satisfaction a user has when using a product or system.”
(User Experience Design (Wikipedia), 2008)
“[UX encompasses] all aspects of the end-user's interaction with the
company, its services, and its products. The first requirement for an
exemplary user experience is to meet the exact needs of the
customer, without fuss or bother. Next come simplicity and elegance
that produce products that are a joy to own, a joy to use. True user
experience goes far beyond giving customers what they say they
want, or providing checklist features.”
(User Experience (Nielsen-Norman Group), 2007)
“[UX is] a result of motivated action in a certain context.”
(Mäkelä & Fulton Suri, 2001)
“[UX is] a consequence of a user’s internal state (predispositions,
expectations, needs, motivation, mood, etc.), the characteristics of
the designed system (e.g. complexity, purpose, usability,
functionality, etc.) and the context (or the environment) within which

Page 13
the interaction occurs (e.g. organisational/social setting,
meaningfulness of the activity, voluntariness of use, etc.).”
(Hassenzahl & Tractinsky, 2006)
The definition of UX is an ongoing process in the community and it is not
within the scope of this thesis to define UX conclusively. You find an overview of
existing UX frameworks and models in Chapter 2 and a framework of UX with the
core elements relevant to understand the approach taken in this thesis in Chapter
3. The thesis builds mainly on the definition of Hassenzahl and Tractinsky (2006),
but emphasises different aspects of UX. This definition is the most
comprehensive and detailed definition, is rooted in HCI and is appropriate to
embed the measurement instruments for UX presented in the following chapters.
1.3 Measuring elements of User Experience
Without a commonly accepted definition, it is quite adventurous to think of
methods and tools to measure UX. The multitude of theoretical frameworks has
led to even more approaches to evaluate the different aspects of UX.
Furthermore, the definition of UX – including the user, the product and the usage
situation – implies that these three components are included in an evaluation
methodology. While the product and its instrumental (e.g. utility, usability) and
non-instrumental (e.g. aesthetic, symbolic or motivational aspects) qualities can
be controlled by the developer or designer and can be readily evaluated, the
transient internal state of the user and the ever-changing context the product is
used in are harder to grasp methodologically.
Hassenzahl and Tractinsky (2006) have identified three major perspectives
within the multitude of UX approaches:
The thread labelled beyond the instrumental predominantly deals with
human needs beyond the instrumental. The term instrumental stands for aspects
of the interaction that deal with the achievement of behavioural goals (in work
settings), for reaching the goal of a task. Other authors refer to it as utilitarian
(e.g. Batra & Ahtola, 1990), functional (e.g. Kempf, 1999) or pragmatic (e.g.
Hassenzahl, 2004a) as opposed to non-instrumental or hedonic properties of a
product.
The second thread deals with approaches that focus on affect and emotions.
On the one hand, emotions are seen as an antecedent influencing the quality of
interaction, e.g. an expressive design or the internal state of the user, on the
other hand affect is seen as a consequence of interaction, changing the users
emotions through interaction with a product.

Page 14
The third thread looks at UX in a holistic, non-reductionist manner. The
research in this area tries to look at the experience as a whole and does not
decompose the user experience into measurable elements. Research taking this
holistic view stresses the temporal and situational character of UX. It is often
research from the design field taking this approach and is especially challenging
to be evaluated scientifically.
Within these different threads of research can further be distinguished
between approaches primarily for formative evaluation (e.g. design, development)
and summative evaluation (e.g. of the end product), which often use different
methods and tools for UX evaluation. Although the different approaches employ
elaborate theoretical foundations, they often lack appropriate methodologies and
tools for the evaluation of UX. Chapter 2 outlines a selection of existing
approaches and the corresponding evaluation methodologies.
These methods have a number of drawbacks. The holistic view to UX
encompasses all aspects of the user, the product and the context, and includes
the temporal aspects of all three components. Although it is important for a
designer to consider these aspects, it is almost impossible to measure and
control it in its completeness. Coming from the traditional HCI field, the
knowledge gain and generalization possibilities of e.g. the cultural probes
technique seem problematic.
The thread of research concerned with emotions and affect lacks a common
understanding of which emotions are actually important in the context of UX.
There are different sets of emotions and affective reactions to products that vary
considerably, from joy, fun or pride to surprise, amusement, disgust or
disappointment. How these exactly contribute to product quality is unclear. The
evaluation of emotions poses some additional problems:
- Emotions last only a short time (a few seconds), so measurement has to
be precise or retrospective.
- Retrospective assessment can be subject to distortions, e.g. through
social desirability or self-deception.
- Emotions are subjective, and although there are instruments to distinguish
at least a few emotions objectively from each other, an accurate account
of what is felt can only come from the subject itself.
- Emotions are not necessarily conscious; hence, self-assessment of
emotions is not always possible.
- It is unclear how many and which distinct emotions humans can feel,
which are basic and which are complex emotions (see e.g. Gomez, 2005).

Page 15
The instruments for evaluation of needs beyond the instrumental are mainly
questionnaires, using verbal accounts of product attributes or personal needs and
values. As aesthetics is an important component of this thread of UX, it would
seem necessary to have visual results of the evaluation as well. Furthermore,
where an expert evaluator (e.g. a designer), is able to give precise account of
subtle aesthetic attributes of products, a lay evaluator might not be able to
explicitly state and label these attributes. Hence, an implicit method would seem
more appropriate.
1.4 Scope
The focus of this thesis is the development of new methods for UX evaluation.
As stated in the chapter above, existing UX evaluation methods have a number of
weaknesses and drawbacks that are addressed in the development of two new
evaluation tools.
The first method addresses the measurement of mood state of computer
users and belongs to the thread of emotions and affect in UX. It explores the
possibility of implicitly capturing the mood state of a user, working on a computer
with a standard mouse and keyboard, through the detection of changes in motor
behaviour variables. The relationship of emotions and moods is very close (see
also Chapter 3.2.1 for details), as mood is a result as well as an influencing factor
of emotion. So instead of assessing a small set of distinct emotions
retrospectively, the outcome of these emotional episodes, mirrored in the mood of
the user, is assessed concurrent with the interaction between the user and the
software. Therefore, the approach encompasses the need for a predefined set of
distinct emotions, it measures the affective reaction during the interaction and not
retrospectively, is objective and not subjective and is implicit and unobtrusive. A
detailed description of the method can be found in Chapter 3.2, two experiments
concerning the validation of the method are described in Chapter 4.
The second method addresses the evaluation of needs and values beyond
the instrumental. It takes up the notion that we use and own products that satisfy
certain needs and express values that are important to us. Similar to meeting an
unknown person for the first time and evaluating within seconds or minutes if we
like the person, what personality we assume he/she has and if we will get along
with that person, we make an appraisal of products based on what we see (or
hear, or smell, or feel) and decide if the product matches our needs and values.
Because this short appraisal is often unconscious, the measurement tool employs
an implicit, projective method. It does not only use visual and verbal techniques in
the survey, but also has visual and verbal evaluation results. More details about

Page 16
the premises of the method are laid out in Chapter 3.3, a detailed description of
the measurement tool can be found in Chapter 5.
The thesis will not pursue a conclusive definition of UX, as it is an ongoing
process within the UX community, but will instead build mainly on Hassenzahl’s
and Tractinsky’s (2006) understanding of UX. An overview of existing models and
frameworks for UX is given in Chapter 2. The focus of this thesis is the
development of new evaluation instruments for UX from an engineering point of
view and although UX builds heavily on psychology, it will only elaborate
psychological constructs where necessary and not replicate psychological
theories.
1.5 Outline
The remaining chapters are structured as follows:
Chapter 2 presents a selective literature review of existing models and
frameworks of UX from different research fields. Implications for measurement of
UX are highlighted and where available according measurement instruments
discussed.
Chapter 3 describes the methodological foundations and premises for the two
measurement methods and presents a UX framework for the context of this
thesis. It points to additional and differing views of UX and emphasises the
important aspects of the two methods in the context of the framework.
Chapter 4 presents the two experiments conducted for the mood in interaction
evaluation method, the test setup and the results and discusses the implications
of the results.
Chapter 5 describes the tool aimed at evaluating the perceived hedonic
qualities of products. The content and goals of the different modules of the tool
are presented and discussed.
Chapter 6 states the conclusions of the theoretical and practical
considerations in the thesis and makes suggestions for further investigations.

Page 17
2 Existing approaches to User Experience evaluation
A wide range of models and research frameworks for User
Experience (UX) exist today. The contributions come from diverse
fields such as HCI, design, psychology, marketing or even
philosophy and have accordingly diverging viewpoints on the subject.
The structure of this chapter follows the simple classification of
Hassenzahl and Tractinsky and groups a selection of existing
approaches into beyond the instrumental (Chapter 2.2.1), emotion
and affect (Chapter 2.2.2), the experiential (Chapter 2.2.3) and other
approaches (Chapter 2.2.4). Important aspects of UX, which have
led to the development of the two measurement instruments
described in this thesis, are highlighted in the context of the
respective UX models.
2.1 Introduction
User Experience is rapidly becoming a key term in the world of (interactive)
product design. While the HCI community has readily adopted it, it has been
critiqued at the same time repeatedly for being vague, elusive or fleeting. The
term user experience is – depending on the background and focus of the
researcher or practitioner – associated with a wide variety of, even contradictory,
meanings. The common denominator of these models and theories is its rejection
of the dominant, task- and work-related usability paradigm as the exclusive
quality measure of interactive products.
Although the ideas represented by UX are important, they are by no means
original (Hassenzahl & Tractinsky, 2006, p. 91). Early accounts of quality aspects
beyond usability include for example Malone (1981), who mentions challenge,
fantasy and curiosity as characteristics of motivating instructional environments.
Likewise, Carrol and Thomas’ (1988) article on fun or Logans (1994) concept of
emotional usability, which complements the “traditional” usability are other early
mentions of non-utilitarian quality aspects. Albens (1996) quality of experience
that includes dimensions like aesthetic experience or needs is the first in a series
of programmatic publications (e.g. Alben, 1996; Hassenzahl, Beu, & Burmester,
2001; Overbeeke, Djajadiningrat, Hummels, & Wensveen, 2002) that started to
promote UX in the HCI community. Gradually, more theoretical papers have
replaced this literature. Although there is a great diversity of UX approaches, it is
indicative of the interdisciplinarity of UX research and a “boost for innovation

Page 18
rather than a problem” (Wright & Blythe, 2007). The following chapters give an
overview of important contributions.
Hassenzahl and Tractinsky (2006), as mentioned in the introduction of the
thesis initially proposed the structure used here that is represented in the chapter
titles. It is only one possibility to structure UX approaches; other authors have
categorized them differently. Mahlke (2008) adopts the categories of non-
instrumental qualities and emotion and affect approaches, but additionally sees
phenomenological and design as relevant perspectives. Battarbee (2004)
organises UX theories into three categories: person-centred frameworks (what
people need), product-centred frameworks (design and research checklists) and
focus on the action (frameworks about interaction), and treats emotions as a
separate thread of UX. Strictly speaking not as a categorization, Blythe et al.
(2007) propose five bipolar dimensions to characterize UX frameworks (see Table
2-1).
Table 2-1: Five aspects of UX and associated dimensions (Blythe et al., 2007)
Aspect Content dimension
Theory Reductive - Holistic
Purpose Evaluation - Development
Method Quantitative - Qualitative
Domain Work based – Leisure based
Application Personal - Social
Reductive approaches simplify the complexity of experience through
measuring individual elements of UX, whereas holistic approaches try to capture
the experience as a whole. The distinction between evaluation and development
is comparable to summative and formative evaluation. Methods for development
focus on the process of creating (designing, developing). The distinction between
quantitative and qualitative measurement is well known and applicable to UX
studies as well. Although the boundary between work and leisure is becoming
blurred, work related activities are mainly goal directed whereas in leisure based
activities pleasure or fun play a more important role. Increasingly, models
address experiences in a social context, rather than focusing on the personal
experience of single persons.
The aspects Blythe et al. have emphasised will help to comprehend the
relative importance of the mentioned UX models and the two measurement
instruments presented in this thesis. Within the course of the discussion of UX
frameworks in the next chapters, other relevant aspects are highlighted in the
context of the particular theory.
Page 19
2.2 UX models and frameworks
The terms instrumental and non-instrumental are used here to distinguish
between traditional quality aspects (e.g. usability, functionality) and newer
aspects (e.g. human needs, emotions). Other authors have referred to
instrumental aspects also as utilitarian (e.g. Batra & Ahtola, 1990) or functional
(e.g. Kempf, 1999). In his framework of UX, Hassenzahl (2003) has referred to
instrumental and non-instrumental as pragmatic and hedonic respectively. While
most authors include instrumental aspects in their frameworks and consider them
as separate but complementing constructs to non-instrumental aspects, hedonic
aspects are seen as an affective quality of a product (Chapter 2.2.2) or as non-
task related attributes of a product (Chapter 2.2.1).
2.2.1 Beyond the instrumental
The common denominator of these views are the product attributes that fulfil
underlying human needs (Hassenzahl & Tractinsky, 2006) and the user
experiences that revolve around these needs. Human needs are the drivers for
product use and possession. Human needs considered relevant in the context of
products range from fun, excitement, appeal, novelty and change (Logan, 1994),
challenge, curiosity and emotional connection (Malone, 1981), to surprise,
diversion, mystery, intimacy, influencing the environment and understanding and
changing one’s self (Gaver & Martin, 2000). According to Hassenzahl (2006), two
broad categories within the array of human needs relevant in a product context
can be distinguished: competence/personal growth and relatedness/self-
expression.
Jordan (2000) argues for a hierarchical organization of needs, similar to
Maslow’s hierarchy of human needs (Maslow, 1943), in which the satisfaction of a
lower level need is a necessary precondition for fulfilment of higher-level needs.
Jordan’s first level is functionality, the second level usability and the highest level
is pleasure. Within the pleasure level, he distinguishes four aspects of pleasure,
which draw from earlier work of Tiger (1992): Physio-pleasure is associated with
the sensual experience of a user with the product (e.g. touch, smell, taste). Socio-
pleasures arise in the relationship with others or the society as a whole (e.g.
status, connection). Psycho-pleasure is related to people’s cognitive and
emotional reactions (e.g. satisfaction of instrumental needs) and Ideo-pleasure
pertains to people’s values (e.g. aesthetics, taste, personal aspirations). Jordan
does not develop any specific measurement instruments in his book, but instead
provides an overview of a range of methods rooting in design and marketing
Page 20
research, such as private camera conversation, focus groups, think aloud
protocols, experience diaries, reaction checklists or interviews.
A similar approach to human needs, but specifically coined to interactive
products like websites, are Marcus’ (2004) six degrees of freedom. The six
categories relate to specific product categories or activities: I-ware (me-ware, my-
ware) relates to identity and privacy, you-ware (love-ware) to relationships with
others, fun-ware to entertainment, buy-ware (sell-ware) is connected to
commerce, know-ware (who-what-why-where-when-ware) to information and be-
ware (self-aware) to wellbeing and self-enhancement. Marcus neither applies his
model to specific examples and connects it to UX, nor does he develop specific
measurement instruments for his model.
Margolin (1997) identified four relevant dimensions a designer should focus
on to get a better understanding of the needs of a user. It is a purely theoretical
construct without any means to evaluate these dimensions objectively. The social
dimension refers to ethics and responsibility in the context of society and
legislation. The inventive dimension relates to being able to conceive products
that will be enjoyed and valued by the user. The operational dimension relates to
simplicity and clarity in product design. In the aesthetic dimension, he calls for the
importance of aesthetics in product design and criticises designers that consider
their aesthetic judgement to be independent of user taste.
Instrumental and non-instrumental qualities
The relative importance of instrumental and non-instrumental qualities, and if
they are organized hierarchically are open questions in the UX domain. Some
studies could show that instrumental as well as non-instrumental aspects are
equally important predictors of product appeal (Huang, 2003; Hassenzahl, 2001).
Helander and Tham (2003) coined the expression Hedonomics as the connection
between ergonomics and hedonics. Although functionality is a necessary
precondition for the acceptance of many products, the hierarchical organization of
needs and their relative importance may be user (e.g. early adopters vs. late
adopters), product (e.g. consumer vs. producer goods) and/or context dependent.
The usage context includes the aims of product use. Hassenzahl (2003) states
that people can have two different categories of goals in product interaction, do
and be goals, with corresponding modes of interaction: goal and action mode.
The goal mode is practical and task-oriented, whereas the action mode is for fun
and entertainment. These modes try to explain, why things can be irritating at
times (in goal directed mode), but at other times exciting, challenging and fun (in
action oriented mode).

Page 21
Hassenzahl (2001) refers to instrumental quality aspects as pragmatic
aspects and to non-instrumental aspects as hedonic aspects and combines in his
framework of UX traditional usability measures with aspects that address human
needs for social power, novelty and change. In a later publication (Hassenzahl,
2003), he identifies three sub-dimensions of hedonic qualities: stimulation,
identification and evocation. Because people strive for personal development,
products have to be stimulating. They should provide new impressions,
opportunities, and insights. Because individuals tend to express their self through
physical objects, their possessions (Prentice, 1987), products should be able to
communicate identity. This self-expressive function is entirely social. Evocation
relates to the fact that products can evoke memories. In this case, the product
represents past events, relationships or thoughts that are important to the
individual. The perceived (apparent) product character then leads to
consequences: judgments about the product's appeal (e.g., good/bad), emotional
consequences (e.g., pleasure, satisfaction) and behavioural consequences (e.g.,
time spent with the product). Hassenzahl has developed a questionnaire
(“AttrakDiff”2) to evaluate pragmatic and hedonic qualities of products.
A comprehensive framework that encompasses the perception of instrumental
and non-instrumental qualities and emotional reactions of users has been
proposed by Mahlke (2008). He includes influencing factors (system, user, and
context parameters) and consequences of user experiences in his model, (e.g.
acceptance of the system and usage behaviour). Instrumental qualities include
utility and usability; aesthetic, symbolic and motivational aspects comprise the
non-instrumental qualities; the emotional user reactions finally consist of
subjective feelings, motor expressions, physiological reactions, cognitive
2 http://www.attrakdiff.de/
Figure 2-1: Key elements of the model of user experience (Hassenzahl, 2003)

Page 22
appraisals and behavioural tendencies. Although very comprehensive, the
framework does not explicitly state how all these elements interrelate with each
other. In his three experimental studies, he uses a multitude of measurement
instruments: questionnaires (for instrumental, non-instrumental and affective
qualities), performance measures (e.g. time or completion rates) and
physiological measurements (e.g. heart rate or EMGs).
Aesthetics and visual design
A different thread of research focuses on non-instrumental aspects of
appearance, design and aesthetics. Among the first to systematically study the
connection between visual aesthetics and usability were Kurosu and Kashimura
(1995) who conducted an experiment with 26 different interfaces of automatic
teller machines (ATM) and found a high correlation between apparent (perceived)
usability and beauty of the interface. Around this time, many studies started to
investigate aesthetics and usability. Tractinsky, who doubted the results of
Kurosu and Kashimura, replicated the experiment (Tractinsky, 1997) and found
similar results. Alben (1996) identified beauty as an important quality aspect of
technology experience. Tractinsky, Katz and Ikar (2000) claimed that what is
beautiful is usable.
Burmester, Platz, Rudolph and Wild (1999) have studied the influence of
aesthetic design on users’ quality perceptions by using a traditional version of a
user interface and one that was specifically worked over by a designer. People
used questionnaires with 23 items to indicate their statements after the
presentation of each interface. They found that the designed version received
higher ratings with respect to quality impression, apparent usability and
superiority.
A study by Park, Choi and Kim (2004) aimed at identifying critical factors that
are closely related to the aesthetic fidelity of web pages. They conducted three
empirical studies with professional web designers and users. Subjects used
questionnaires with 278 terms arranged in bipolar Likert-scales to state their
opinion about the websites. They identified thirteen aesthetic dimensions and
instructed designers to design example websites with respect to selected
dimensions. They found that users rated the quality on a specific aesthetic
dimension higher if the designer had focused on it.
A couple of theoretical frameworks deal with aesthetic appreciation of visual
stimuli. Lindgaard and Whitfield (2004) position visual aesthetics of interactive
systems within an evolutionary context. They apply Whitfield’s (2000) collative-
motivation model of aesthetics to explain the results of prior experimental
research on product preference. This approach combines cognitive and affective

Page 23
processes to explain aesthetic appreciation based mostly on the prototypical
nature of a stimulus (“ancestral, wired-in preferences for specific stimuli”, p. 86).
Leder, Belke, Oeberst and Augustin (2004) propose an information-
processing stage model of aesthetic processing, derived from an analysis of the
appreciation of modern art. According to the model, aesthetic experiences involve
five stages: perception, explicit classification, implicit classification, cognitive
mastering, and evaluation. The model also differentiates between aesthetics
emotion and aesthetic judgments as two types of outputs.
Reber, Schwarz and Winkielman’s (2004) approach to understanding
aesthetic pleasure is based on the concept of processing dynamics: the more
fluently perceivers can process an object, the more positive their aesthetic
response. They review variables known to influence aesthetic judgments such as
figural goodness, figure-ground contrast, stimulus repetition, symmetry, and
prototypicality and trace their ability to change processing fluency. In contrast to
theories that trace aesthetic pleasure to objective stimulus features per se, they
propose that beauty is grounded in the processing experiences of the perceiver
perceiver, which are only partly a function of stimulus properties.
2.2.2 Emotion, mood and affect
Research on affect has gained significant attention over the last three
decades. The importance of emotions for a wide range of central processes such
as decision-making, perception, cognition, learning, social judgement or
behaviour has been acknowledged (e.g. Forgas, 1995; Picard, Affective
Computing, 1997; Russell, 2003). In design, emotions have always played an
important role, but only recently systematic research about the interrelation of
emotions and design has started. One of the pioneering publications to address
affect in the field of HCI has been the book “Affective Computing” (Picard, 1997).
However, affective computing – computing that relates to, arises from, or
deliberately influences emotions (p. 3) – takes a computer perspective and deals
predominantly with negative emotions (e.g. stress or frustration). Publications in
the field of affective computing deal with mechanisms to detect, prevent and undo
negative emotions arising from the interaction of humans with technology.
UX research focuses more on positive emotions like enjoyment, fun, trust or
pride and the qualities of products that lead to affective reactions. There are two
major perspectives of dealing with affect in UX. One perspective understands
emotions as consequences of product use (e.g. Desmet & Hekkert, 2002;
Hassenzahl, 2003; Tractinsky & Zmiri, 2006; Mahlke, 2008). Emotions are seen
as the result of cognitive appraisal processes of the product and the usage
situation. Surprise, for example, may be felt if the interaction deviates from

Page 24
expectations, and could turn into joy in case of a positive appraisal or to
frustration, in case of a negative appraisal. The other perspective on emotions in
UX sees emotions as antecedents of product use and evaluative judgements
(e.g. Zhang & Li, 2004; Norman, 2004; Tractinsky, 1997). In line with technology
acceptance literature, the role of affect in an individual’s evaluation, reaction and
acceptance of technology is studied.
Although emotions have received a lot of interest in UX and design
(“emotional design”), there are only a few comprehensive frameworks, which
encompass products, users and emotions. Often, there are notions of emotions
and other affective states, but a theoretical foundation is missing. Some
frameworks that incorporate emotions along other aspects have been discussed
in the previous chapters (e.g. Hassenzahl, 2006; Mahlke, 2008).
In the context of product design
and evaluation, emotional responses
are interesting because they have
consequences on buying intention,
usage of the product and
communication about the product to
others. As Desmet (2002) elaborates,
seeing, using, owning, and coveting
products all elicit different kinds of
emotions and emotional responses.
Desmet and Hekkert (2002) establish
a basic process model regarding the
elicitation process of emotions in
human-technology interaction that
comprises four parameters: concern,
product, appraisal, and emotion. The
first three parameters, and their interplay, determine if a product elicits an
emotion, and if so, which emotion is evoked (see Figure 2-2).
The central implication of the concept of appraisal is that not the event (e.g.
interaction with a product) as such is responsible for the emotion, but the
meaning the individual attaches to this event. Concerns can for example be
needs, preferences, instincts, motives, goals, or values (Scherer, 2001), and can
be regarded as points of reference in the appraisal process (Frijda, The
Emotions, 1986). Thus, a concern match or mismatch determines the significance
of a product for our well-being. Products that match users’ concerns are
appraised as beneficial, and those that mismatch their concerns are harmful.
Figure 2-2: Basic model of product emotions (Desmet, 2003)

Page 25
Some concerns, such as the concern for safety and the concern for love, are
general, others are context-dependent, such as the concern for being home
before dark or the concern for securing a good seat for your friend at the cinema.
In a later publication, Desmet (2003) proposed five categories of emotions
elicited by products: instrumental, aesthetics, social, surprise, and interest
emotions. Instrumental emotions (e.g. disappointment, satisfaction) derive from
perceptions of whether a product will allow the user to achieve his objectives.
Aesthetic emotions (e.g. disgust, attraction) relate to appeal, the potential for
products to delight or offend our senses. Desmet does not use the term “taste” in
this context, but states that the appraisal of aesthetic emotions is based on innate
and learned attitudes. Social emotions (e.g. indignation, admiration, contempt)
result from the extent to which a product can comply with socially determined
standards. The product is appraised in terms of legitimacy. Surprise emotions
(e.g. amazement, pleasant and unpleasant surprises) are driven by the
perception of novelty in a design, i.e. the design is sudden and unexpected.
Finally, interest emotions (e.g. boredom, fascination, inspiration) are elicited by
the perception of challenge combined with promise, and all involve an aspect (or
lack) of stimulation. Desmet (2002) developed a measurement tool for product
emotions called “PrEmo”, which visually assesses 14 emotions (7 positive and 7
negative) on a 3-level scale.
Norman (2004) defines three levels of information processing: first the
“prewired”, automatic visceral level; second the behavioural level, which involves
brain processing and controls everyday activities; and third the reflective level for
contemplative processing. The visceral level marks the start of affective
processing by making rapid judgments on what is good or bad. Processes on the
visceral level are biologically determined and relate to instinctive attraction to
form, colour and the resulting bodily reactions. The behavioural level is the site of
most human behaviour. Its actions are reinforced or inhibited by the reflective
layer and can enhance or inhibit the visceral layer. Behavioural responses deal
with use and functionality, and the interfaces and objects that people for example
touch, grip and drive. While the reflective level does not have direct access to
neither sensory input nor the behavioural control, it watches over, reflects upon,
and tries to bias the behavioural level. Reflective responses deal with matters of
identity and culture that are associated with products. Although Norman proposes
that different aspects of emotions play a role on all three levels, it remains unclear
how these emotions arise from the interaction with a product.
Rafaeli and Vinali-Yavetz (2004) develop a similar model of the relationship
between the qualities of physical artefacts and the emotions they elicit. This
model suggests that artefacts are analyzed according to three conceptually

Page 26
distinct aspects: instrumentality, aesthetics, and symbolism. They discuss three
different mechanisms of emotion elicitation, each based on one of the three
quality dimensions: hygiene, sensory and associative mechanisms.
A different view on affect in UX, rooted in technology acceptance literature,
present Zhang and Li (2004). They showed perceived affective quality to be a
predictor of perceived usefulness, perceived ease of use and ultimately of
behavioural intentions. This is in line with previous research (Davis, Bagozzi, &
Warschaw, 1992), which reported an impact of perceived enjoyment on
technology acceptance. Affective quality (Russell, 2003), however, is a construct
closely tied to an object or a stimulus, and is the ability of this stimulus to change
(core) affect. This is different to the models presented above that understand
affect and emotions as states of the user.
A range of theoretical UX models focus on the design for specific emotion-
related phenomena (e.g. fun, pleasure, engagement, motivation, flow). These are
interesting concepts, but they are difficult to conceptualize and measure. The
previously mentioned framework of Hassenzahl (2003) deals with pleasure and
satisfaction as consequences of product experiences. The term engagement, as
used by Laurel (1991), describes a positive, first person interaction experience
that people can have with computers. Carroll and Thomas (1988) argued for the
consideration of fun of use in interactive system design. Brandtzæg and Følstad
(2001) describe aspects of enjoyment, building on a demand-control-support
model for good and healthy work. Finally, Csikszentmihalyi (1990) focuses on the
optimal experience and the concept of flow in interaction, which is also widely
acknowledged in psychological literature.
2.2.3 The experiential
The experiential perspective of UX takes a holistic view on experience and
emphasizes (in contrast to the other two perspectives in the previous chapters)
the situatedness and the temporal character of UX. Nonetheless, a clear
distinction from the other two perspectives is often not possible, as these models
frequently include needs and emotions.
In this view, user experience has been described as the spark between what
has happened in the past and what is expected in the future. This is the simplest
of the models. For Mäkelä and Fulton-Suri (2001), experiences are motivated
actions in a context, which are influenced by past experiences and in turn shape
future expectations. They break down the moment of experiencing to elements
that can be analyzed: context, motivations and actions. They postulate that action
is influenced both by motivational level needs (why someone is doing something)
and action level needs (how something is accomplished in the moment), which

Page 27
may be emotionally directed. The motivational level of action is entangled with
thinking about identity, roles or values, and action level needs connect with
usability and tasks.
Forlizzi and Ford (2000) point out that designers can only design situations
rather than neatly predicted outcomes. Beside the user’s personal appraisal of a
situation, there are other factors that are beyond control when designing: different
cultural backgrounds, prior experience as well as emotional states which cause
different subjective interpretations of a certain moment. They introduce four
concepts relevant to understand the quality of an experience: sub-consciousness,
cognition, narrative, and storytelling. Sub-conscious experiences do not compete
for the user’s attention and thinking processes. Cognition is used to represent
experiences that require users to think about what they are doing. The narrative
concept represents experiences that have become meaningful for the user. The
set of features and affordances of a product offers such a narrative of use. In
turn, a user interacts with some subset of features, based on usage situation,
prior experience and current emotional state to make a unique and subjective
story.
Experience can also be described in a less dynamic fashion. For McCarthy
and Wright (2004), experience is composed of four strands: sensory, emotional,
spatio-temporal and compositional strands. This means that all experience has a
structure that happens in space and time and is sensory as well as emotional. As
Forlizzi and Ford (2000) attempted to describe how experience changes, this
view emphasizes what is common to all experience. In addition, they discuss six
sense-making processes that relate to experience: anticipating, connecting,
interpreting, reflecting, appropriating and recounting.
Battarbee (2004) introduces the concept of co-experience to consider
experiences constructed in social interaction. Co-experience is understood as an
experience that users themselves create together in social interaction. Together
Forlizzi and Battarbee (2004) present an approach to incorporate the concept of
co-experience into the framework proposed by Forlizzi and Ford (2000).
The frameworks that take an experiential position resist the reduction of
experience into single factors or processes and look at experience as a unique
combination of various elements over time, which makes it difficult to
conceptualize these models for research. The complexity of experiences and
their changing nature lead to unique events that are hard to repeat and to create
and even harder to evaluate quantitatively. Therefore, evaluation methodology is
made up mainly of qualitative methods, such as interviews, storytelling, cultural
probes or expert appraisals.

Page 28
2.2.4 Related evaluation approaches
Two more models related to UX are mentioned here to complement this
overview. Although thematically close to UX, they are concerned with the
development of products rather than the evaluation of UX. Both methods are
strongly linked to practice.
Kansei engineering (e.g. Nagamachi, 2001) was founded 30 years ago, as an
ergonomics and consumer-oriented technology for producing goods and
products. Kansei engineering is a method that attempts to identify the feelings
that customers seek and enables engineers to create products and suggest these
feelings in their look and feel. Feeling, here, is a crude translation of the
Japanese concept of kansei, which means something like the psychological
feeling or image of a product. In a systematic engineering and testing process,
products are designed to support the image the manufacturer wants aims for.
Interaction designers who focus on designing digital content address a
particular subset of product interaction in their frameworks. Rooted in user-
centred design, Garrett (2002) offers a model of information design that
structures the elements of websites that influence in his view the “user
experience”. The design of user experience happens on five levels: strategy,
scope, structure, skeleton and surface. Strategy relates to user needs and site
objectives; scope to functional specifications and content requirements; structure
to interaction design and information architecture; the skeleton encompasses
aspects of information design (interface and navigation) and the surface
corresponds to the visual design.
His model is more an instruction of how to proceed when planning a website
(or the presentation of other electronic content) than an actual UX framework,
although he calls his publication “The elements of User Experience”.
2.3 Measuring UX
The previous chapters on existing UX frameworks have made evident that UX
is an ill-defined, complex construct that encompasses aspects of the user’s inner
state, characteristics of the product and the usage context. These multiple facets
of UX and the different aims of the researchers trying to get a hold of experiences
have led to a multitude of measurement and evaluation methods that are
presented in the following chapters. Measures for hedonic qualities and user
needs, for affect, and briefly for the experiential are presented. Instrumental
measurement instruments (e.g. usability measures) are not within the scope of

Page 29
this thesis. Beforehand, some important considerations concerning UX evaluation
are discussed.
2.3.1 Measurement considerations
While some HCI researchers and practitioners believe that constructs like fun,
love, beauty or happiness cannot be measured, others are convinced that it is
necessary to find means to make UX aspects operational. It is possible to
measure almost anything, but the concern is whether the measure is meaningful,
useful and valid.
Objective vs. subjective
The debate on objective vs. subjective measurements has animated many
HCI discussions. As UX evaluation stands in the tradition of usability evaluation,
this debate is not exclusive to UX research. Given the subjective nature of UX, it
would seem feasible to use subjective measurements. However, some constructs
cannot be clearly categorized as objective or subjective. To illustrate this
dilemma, look at three views on beauty (see Mulder & van Vliet, 2008): 1) the
objectivist’s view, which regards beauty as a property of an object that is able to
produce pleasurable experiences in a perceiver. Typical features of beauty in this
view are balance and proportion, symmetry, complexity, (figure-ground) contrast
and clarity, and the golden section; 2) the subjectivist’s view, which regards
beauty as a function of idiosyncratic qualities of the perceiver - “beauty is in the
eye of the beholder”. A typical argument is the social constructivist’s emphasis on
the historically changing and culturally relative nature of beauty; 3) the
interactionist’s view, which regards beauty as emerging from patterns in the way
people and objects relate. UX will need subjective and objective measures and
the dispute is not only which type of measure is more appropriate, but also
whether and how they are related and under which conditions.
Design vs. evaluation
Designers and developers need a continuous feedback during the phase of
creating a product to employ an optimal user experience. The methods needed in
a retrospective evaluation of product appeal and the methods needed for a
prospective and continuous feedback during the design process are
fundamentally different. During development, it is often not possible to “measure”,
because there might only be a sketch or a wireframe model that does not exhibit
the product features in a way that it can be tested with potential users. Designers
and developers need inspiration, whereas the evaluator needs an objective
estimation of the final products appeal. These different requirements are mirrored
in the theoretical frameworks presented in the last chapter.
Page 30
It is related to the distinction made in instructional design between formative
and summative assessment. Summative assessment is characterized as
assessment of learning and is contrasted with formative assessment, which is
assessment for learning (Summative assessment (Wikipedia), 2008). Likewise,
UX needs methods for formative evaluation that help improve and form ideas
during the design phase, and methods for summative evaluation, which provide
information on the product's efficacy and its ability to evoke the expected user
experience.
Formative evaluation of UX is particularly difficult, because it needs to link
product or design features to the actual experience. The design of a product is
complex and it is difficult to manipulate single features without changing the
character of the product fundamentally. Park, Choi and Kim (2004) for example
have identified 13 aesthetic dimensions and 256 corresponding distinctive visual
elements of web pages. Researchers also strive to connect product features and
qualities to emotional responses and these further to attitudes, actions and
experiences (see e.g. Rhea, 1992). Moreover, this becomes increasingly difficult:
the more the qualitative richness of the product and context is included, the less
transferable the individual findings are (Roto, 2006).
Temporal aspects
Although strictly speaking UX describes the experience while interacting with
a product, the matter of investigation starts before even the first contact with the
product and lasts beyond the actual use. UX is not a static measure (e.g. a
momentary emotion), but changes over time and influences the next experiences.
The user has a history, which shaped his needs and expectations, her ability to
cope with a certain situation, his knowledge about the world of products and how
to handle them, and she has a future that is shaped by the experience with the
product. In addition, the usage context and the environment are changing as well,
and influence the experience even when not interacting (e.g. through advertising).
While this actual experience is important, it is, due to its complex, situated
and temporal nature, very difficult to address by measurement. Some frameworks
(e.g. McCarthy & Wright, 2005) incorporate the temporal nature of UX, but cannot
properly transfer the model into measurement tools. Roto (2006) suggests to
compartmentalize the process and to look at UX before, during and after
interaction. She names the phase before the actual interaction expected UX, the
phase after the interaction overall UX. The expected UX is formed by brand
image, advertising, friends or knowledge acquired prior to interaction. Expected
UX significantly influences UX during the interaction. Separating the different

Page 31
phases of experience facilitates the development of measurement instruments, as
the emphasis on what to measure can be shifted from phase to phase.
Implicit measurement
Temporal aspects are not only relevant when deciding what, but also when to
measure. The evaluation of a user’s experience during interaction is the key
element to understand the connection between product attributes and the user’s
experience. Self-reports during the interaction phase pose problems as they
might interrupt the flow of the interaction. Furthermore, the momentary state of
the user becomes conscious which might not be desired. Retrospective
evaluation on the other hand, is interesting because it provides summary
judgements about the overall quality of an experience (Hassenzahl & Ullrich,
2007). However, retrospective evaluations are not simple averages or sums of all
the prior moments encountered during interaction, they rather reflect peak
moments during the experience, especially when subjective feelings (e.g.
emotions, pain) are concerned. Furthermore, the interest of UX research in
retrospective measurements can be doubted, as they reflect past experiences
(e.g. satisfaction) and are not an indicator of future behaviour.
In conclusion, there is a need for UX measurement concurrent with the
interaction, but it should be implicit to avoid bias of the evaluation and
disturbance of the interaction. For retrospective measurement, Desmet (2002)
argues that the best way to understand emotions elicited by a product’s
appearance is by non-verbal means, although both verbal and non-verbal self-
reports are subject to the general tendency of people to modify their emotional
reporting increasingly over time. For retrospective measurement, an implicit,
projective method seems appropriate.
Perceived/expected vs. experienced/observed
Related to the debate about subjective vs. objective measurement is the
question, whether perceived qualities of products or actually experienced
qualities are more relevant and if expected UX (as intended by the designer) or
actually observed UX (as experienced by the user) are the same. Several UX
frameworks stress aspects labelled “perceived XY”, e.g. perceived
affective/hedonic quality, perceived ease of use or perceived usefulness. The
focus of UX on the subjective, personal experience justifies this emphasis. For
UX, the perceived quality is more important than the objective quality, e.g. if a
user perceives the system as easy to use, the objective ease of use is irrelevant
(as long as it is not a self-deception of the user). Often, it is easier to assess the
perceived quality rather than the experienced quality by measurement tools.
Page 32
The other issue mentioned, if expected UX and actually observed UX match,
is relevant for designers, as it feeds back information about how well the intended
design could evoke the desired UX. It is difficult to design for UX, because not
just the product determines the experience, but also the user and the usage
context have to be considered, but defy control. The validity and reliability of
measurement instruments for the design phase can be improved by continuous
comparison with instruments that measure the observed UX.
Granularity of measurement
UX can be analyzed on different granularity levels. An example of a detailed
granularity level is the UX of a single key click. For example: Was the key easy to
press? Were the tactile, auditory, and visual feedbacks pleasurable? A higher
level of granularity is a use case: Did the user achieve his goals by using the
system the previous time, and did he enjoy that use case? On an even higher
level, we can investigate the relationship between the product and the user, even
after he has replaced the product with a new one. All these different granularity
levels provide useful information about UX, and can be used for different
purposes. If we want to improve a specific product detail, we can create several
alternative designs of that detail and apply the smallest granularity level to
evaluate the different designs. If we want to understand which features work well
for different users in different contexts, we apply the use case analysis level. If we
want to understand the value and importance of a product to the user, we apply
the overall relationship level. It would also be interesting to see how the user
experiences aspects on a lower level correlate with the overall UX.
2.3.2 Measuring affect
Larsen and Fredrickson (1999) point out that every emotion measurement
method has its strengths and weaknesses and that when measuring emotions a
working definition of emotions should be the basis to choose relevant methods.
The multi-component model proposed by Scherer (1984) with its five aspects
subjective feelings, physiological reactions, motor expressions, cognitive
appraisals and behavioural tendencies serves as a structure for the presentation
of emotion measurement approaches (a more detailed discussion of affect,
emotion and mood can be found in Chapter 3.2.1).
Subjective feelings
Clinical psychology has a long tradition of affect measurement. There exist
literally dozens of affect inventories: verbal descriptions of an emotion or
emotional state, rating scales, standardized checklists, questionnaires or
semantic and graphical differentials. Subjective ratings are based on the
Page 33
assumption that people to some degree are aware of their emotions and are able
to describe them (Mehrabian, 1995).
One such self-assessment technique emerged from research on the
measurement of meaning. The semantic differential scale by Osgood (1957) has
influenced both measurement methods and emotion theories (e.g. the
dimensional emotion theory (Mehrabian, 1996)). The semantic differential was
developed for the investigation of the linguistic meaning of words. Osgood divided
language into three main dimensions of meaning: Evaluation, Potency and
Action. On those dimensions are different simple bipolar keyword couples placed.
Individual profiles are made by asking people to rate the object of interest with
those bipolar word couples on the three dimensions. The semantic differential
can be adapted by using different word lists. A wide variety of questionnaires and
interview techniques exist.
The Semantic Differential Scale devised by Mehrabian and Russell (1974)
consists of a set of 18 bipolar adjective pairs that generate scores on the valence,
arousal and dominance scales. There are several examples that translated this
approach into scales of varying item numbers and affective dimensions. The Brief
Mood Introspection Scale (BMIS) is a mood adjective scale with an item sample
of 16 adjectives, 2 selected from each of eight mood states: happy, loving, calm,
energetic, fearful/anxious, angry, tired, and sad (Mayer & Gaschke, 1988). The
Mood-State Introspection Scale (MIS) is a 62-item adjective checklist with 10
mood subscales. The Russell Adjective Scale (RAS) is a 58-item adjective
checklist with 11 subscales designed to measure factors of mood (Russel, 1979).
The affect grid (Russell, Weiss, & Mendelssohn, 1989) is another semantic
questionnaire to assess emotional states. In contrast to SAM (see below), the
affect grid is a single scale questionnaire. It consists of a 9 x 9-matrix that is
surrounded by eight adjectives describing emotions. Additionally, the adjectives
are arranged by the dimensions valence and arousal, like the ones in Russell’s
circumplex model of emotion (Russel, 1980). Individuals are instructed to rate
their emotional state by setting a cross in one field of the matrix.
The Self-Assessment-Manikin (SAM), devised by Lang (1980), is designed to
assess the dimensions of valence, arousal and dominance/control directly by
means of three sets of graphical manikins (see Figure 2-3 for valence and
arousal dimensions). The manikins represent five states from happy to unhappy,
excited to calm and being in control to being controlled. Individuals rate their
feeling either on a manikin or in the space between two manikins, which results in
nine graduations per dimension.

Page 34
Desmet (2002) presented an extended adaptation of this approach (Figure
2-4). It builds on the premise that emotions elicited by product design are typically
of low intensity and have a mixed character. The PrEmo tool depicts 14
animations of a cartoon character. The character expresses seven positive
emotions, i.e. inspiration, desire, satisfaction, pleasant surprise, fascination,
amusement, admiration, and seven negative, i.e. disgust, indignancy, contempt,
disappointment, dissatisfaction, boredom, and unpleasant surprise. The non-
verbal assessment is supposed to reduce intercultural differences, especially
those that result from semantic verbalizing of emotions.
Figure 2-3: The scales valence (top) and arousal (bottom) of the Self-Assessment-Manikin (Lang,1980)
Figure 2-4: The PrEmo measurement tool (Desmet, 2002)

Page 35
The majority of existing UX research uses some form of questionnaire to
assess the emotional state of subjects. Either a verbal or a graphical differential
with one or more items, or statements indicating an affective state (e.g. “I find
using this system to be enjoyable”, Zhang & Li, 2004, p. 644) that is rated as how
much it applies to the current state of the subject. Several studies have also used
open questions (e.g. McCarthy & Wright, 2005; Tractinsky & Zmiri, 2006), where
subjects could indicate their affective state in their own words. Data is in these
cases analyzed qualitatively. One notable exception is the approach of Mahlke
(2008), who incorporated measures for subjective feelings, physiological
reactions and motor expression.
Physiological reactions
Over the past few decades, empirical work has provided evidence for a
correspondence between a number of physiological variables (e.g. skin
conductance, heart rate, facial muscle activity, cortical activity, startle reflex or
eye blink magnitude) and the emotional dimensions of valence and arousal (e.g.
Ekman, Levenson, & Friesen, 1983; Bradley & Lang, 2000; Bradley, Codispoti,
Cuthbert, & Lang, 2001; Gomez, 2005). Physiological signals can provide
information regarding the intensity and quality of an individual’s internal affect
experience.
One possible measure of physiological correlates of emotions is skin
conductance, also known as electrodermal activity (EDA). It is a measure of the
hydration in the epidermis and dermis of the skin. The physiological basis of SC
is the activity of the eccrine sweat glands. These glands have a wide distribution
over the body surface, but are especially concentrated in the palms of the hands
and the soles of the feet. In psychophysiological research, EDA is typically
recorded from the surface of the hand. Common parameters are skin
conductance response (SCR), skin conductance level (SCL). Eccrine glands in
the skin of the hand respond only weakly to heat but strongly to psychological
and sensory stimuli. The sweating to psychological stimuli has sometimes been
termed “arousal” sweating. Previous research suggests that the magnitude of
SCR and SCL covary with the arousal level of the subject, regardless of their
valence (e.g. Lang, Greenwald, Bradley, & Hamm, 1993).
Another way to gain information on physiological activation is to record heart
activity by an electrocardiogram. There are a variety of parameters for analyzing
and interpreting the raw signal. Common time-related parameters are heart rate,
inter-beat-interval, and heart rate variability (Fahrenberg, 2001). Heart rate (HR)
is one of the most studied physiological measures in emotion research, but its
behaviour is far from being fully understood. Both the direction of HR change

Page 36
(acceleration vs. deceleration) and the effects of emotion have varied based on
the experimental paradigms and the type of mental processing (for a detailed
overview see: Gomez, 2005). To summarize, it can be said that heart activity
seems to be a more reliable indicator for arousal and mental workload than for
emotional valence (see Fahrenberg, 2001).
The correlations between affect and breathing parameters are gaining
increasing interest in psychophysiological research. Respiration can be measured
as the rate or volume at which an individual exchanges air in their lungs. Rate of
respiration and depth of breath are the most common measures of respiration.
Results of several studies (e.g. Bloch, Lemeignan, & Aguilera, 1991; Gomez,
2005) suggest that arousal increases respiration rate while rest and relaxation
decreases respiration rate. (Negative) valence causes irregularities in the
respiration pattern.
Other research suggests that pupillometry is a good indicator for autonomic
responses and mental workload. The more demanding a process is, the larger
the pupil is supposed to be (Beatty, 1982). Hess and Polt (1960) found a
significant correlation between dilatation and the valence of a stimulus.
Physiological signals are measured with a wide variety of instruments and
sensors. Unfortunately, using physiological signals requires specialized and
frequently expensive equipment and technical expertise to run the equipment
which makes this method suitable for lab experiments but not for applied use.
Sensors are attached directly to the body, which can be considered obtrusive or
even invasive by many subjects. Additionally, it can be quite difficult to separate
confounding factors influencing physiological reactions in order to attribute
significant changes to the experimental variable (Kramer, 1991).
Motor expressions
Motor expressions include facial expressions, gestures, posture, body
language, motor behaviour (e.g. hand muscles, head movements) or voice
modulation. Motor expression measurement methods are based on the fact that
the body usually responds physically to an emotion (e.g. changes in muscle
tension, coordination, strength, frequency) and that the motor system acts as a
carrier for communicating affective state. Especially promising for these methods
is that people also use many of signals in everyday life to evaluate the affective
state of other people. In contrast to physiological measurement, methods in this
area can often be applied in a non-invasive way. The three most prominent of
these methods are face recognition, electromyography (EMG) and voice
intonation analysis, which both have been investigated in many research projects
(for an overview see Cowie, et al., 2001).
Page 37
The Facial Action Coding System (FACS) is based on the analysis of 44 facial
muscles (Ekman & Friesen, 1978). A trained person categorizes the observed
pattern of activity in respect to six basic emotions fear, anger, joy, disgust, grief,
and surprise. To gain reliable information, FACS requires an intensive training.
Computerbased, automatic analysis of facial expression does not yet lead to
comparable results (e.g. Cohen, Sebe, Chen, Garg, & Huang, 2003).
Electromyography (EMG) measures muscle activity by detecting surface
voltages that occur when a muscle is contracted. Over the last decades, EMG
has been widely used in emotion research to investigate facial muscle activity.
One advantage of facial EMG is its ability to detect minimal changes in muscle
contractions that can be hardly identified by simply looking at faces. In isometric
conditions (no movement) EMG is closely correlated with muscle tension (Stern,
Ray, & Quigley, 2001), this is, however, not true for isotonic movements (when
the muscle is moving). When used on the jaw, EMG provides a very good
indicator of tension in an individual due to jaw clenching (Cacioppo, Berntson,
Larsen, Poehlmann, & Ito, 1993). Facial EMG studies have found that activity of
the corrugator supercilii muscle, which lowers the eyebrow and is involved in
producing frowns, varies inversely with the emotional valence of presented stimuli
and reports of emotional state. The activity of the zygomaticus major muscle,
which controls smiling, is positively associated with positive emotional stimuli and
positive affect (Cacioppo et al., 1993).
Another approach based on measuring motor expressions is the analysis of
speech characteristics, like speed, intensity, melody, and loudness. Empirical
research suggests that these qualities are highly correlated with affect, and are
therefore reliable indicators for emotional reactions (Schuller, 2006). Automatic
speech analysis requires advanced methods for recording, preparing and
analysis of data.
Body postures and gestures have been analysed both manually (through
observation) as well as automatically (through video analysis). Grammer, Honda,
Schmitt & Juette (1999) have developed video analysis software for frame-by-
frame extraction of motion differences. They have found that body movements
correlate to courtship behaviour, depression and affect in general (e.g. Juette,
2001).
Affect measurement through motor expression is very promising. Chapter 4
presents the development and verification of a new method based on mouse
actions of computer users. A more detailed overview of methods for the analysis
of motor expression, especially in respect to HCI, is discussed in Chapter 3.2.

Page 38
Cognitive appraisals
To assess cognitive appraisals, both quantitative and qualitative methods are
available. As a quantitative approach, the GAF (Geneva Appraisal Questionnaire)
by Scherer (2001) measures retrospectively the quality of an emotional episode
as antecedent of a relevant connoted event. The items of the GAF represent the
five dimensions of Scherer’s component process model of emotion: intrinsic
pleasantness, novelty, goal/need significance, coping potential, and norm/self
compatibility (Scherer, 2001). In addition, the questionnaire contains questions on
the timing and the social context of the emotional experience and the event, as
well as questions on intensity, duration, and regulation of the emotional
experience. The GAF is a rather long questionnaire and therefore the application
of the original version in human-technology interaction is less suitable.
A qualitative approach to assessment of cognitive appraisals servers the
thinking aloud method. People are encouraged to state and describe every
emotional reaction they feel during interaction with a product. The statements are
recorded, reduced in respect to the focus of research, and analyzed by a
qualitative procedure. To prevent disturbing interactions between usage and
assessment, the thinking aloud method can be applied retrospectively, e.g. by
presenting a video (Mahlke, 2008).
Behavioural tendencies
The measurement of performance and behaviour has a long tradition in HCI
research. Central indicators of performance are speed of reaction (e.g. the time
required for single input operations or completing a defined goal), the accuracy of
reaching a goal or the number of errors made. Findings of Partala and Surakka
(2004) indicate that behavioural data is related to EMG values. The results
demonstrate that low activation of the corrugator supercilii muscle is related to a
high rate of successful and goal conductive reactions with a usable designed
system.
In humans, often the overt action is missing in an emotional episode. The
body mobilizes for a response without actually conducting the action. Adrenaline
flows and the cardiovascular system moves oxygen to the gross muscles in
preparation. In this sense, emotions are often dispositions to action, rather than
the actions themselves (Frijda, The Emotions, 1986; Lang, 1995). When a
stimulus prompts the execution of an action procedure, preparatory metabolic
changes occur in muscles and glands. Measurement of these changes could until
recently only be done by invasive methods (e.g. analysing metabolites in the
blood), but increasingly non-invasive methods become available (e.g. skin
Page 39
temperature measurement with infrared sensors; blood flow in certain brain
regions through PET (positron emission tomography) scans).
In HCI, behavioural tendencies can be detected for example by the force of
clicking a mouse-button (Ark, Dryer, & Lu, 1999) or by analysis of the movements
while selecting and moving icons on a touch-screen (Wensveen, Overbeeke, &
Djajadiningrat, 2000). In design research, products with enriched emotional
content have been investigated in respect of the behavioural reactions they
impose on users (Djajadiningrat, 1998).
2.3.3 Measuring hedonic qualities
Most UX models incorporate non-instrumental qualities in some form, as the
overview of UX frameworks in Chapter 2.2 has shown. Although there is an
intensive theoretical discussion of non-instrumental aspects and their application
to design and HCI, only a few approaches provide validated measurement
instruments for a quantitative or qualitative evaluation. This fact complicates
further research on their importance and interplay with other aspects of user
experience.
A clear distinction between measures of hedonic qualities and measures for
more experiential approaches (see next chapter) cannot be made, because
experiential approaches often include hedonic qualities. Furthermore, visual
aesthetics and symbolic aspects are closely related, but are often separately
mentioned in publications. Hence, the categorization of the following chapters is
somewhat artificial, but tries to give a basic structure to the measurement
approaches presented.
A category of its own would be user needs and expectations. While hedonic
qualities are always aspects of the product, needs are concerns of the user and
essential determinants of the outcome of an evaluation of instrumental and non-
instrumental qualities of the product. Human needs are the drivers for product
use and possession. In Chapter 2.2.1, a range of needs considered relevant in
the context of products was presented. Although human needs are central
elements of most of the presented UX frameworks, not the needs themselves are
object of evaluation, but how well the product can meet these needs and
expectations. A discussion of the interrelation of needs and product qualities can
be found in Chapter 3.
Symbolic aspects
Symbolic aspects represent the meanings or associations a product elicits in
a user. Hassenzahl, Burmester and Koller (2003) developed an online
Page 40
questionnaire (“AttrakDiff”3) that assesses three dimensions of product qualities:
a pragmatic (instrumental) quality, a first hedonic quality stimulation and a second
hedonic quality identification. Additionally, they included a measure for overall
attractiveness of the product. The questionnaire is based on the UX framework of
Hassenzahl (2003), but leaves out a third hedonic quality aspect, evocation. The
questionnaire uses randomly presented bipolar word pairs, such as “inviting-
rejecting”, “likable-disagreeable”, “confusing-clear” or “exceptional-common”.
Multiple items are combined to one of the three quality measures.
Rafaeli and Vilnai-Yavetz (2004) collected through interviews with experts (for
design and communication) statements, which belong to one of three categories:
instrumental, aesthetic and symbolic. The qualitative analysis confirmed that
statements about products belong mainly to one of these categories. A typical
“symbolic” statement was for example “green symbolizes nature, symbolizes
environmental friendliness”. Tractinsky and Zmiri (2006) built – based on the
findings of Rafaeli and Vilnai-Yavetz – a questionnaire assessing three similar
dimensions: aesthetics, symbolism and usability. Item referring to the symbolic
dimension include: “communicates desirable image”, “represents likeable things”,
“creates positive associations”.
Mahlke (2008) distinguishes an associative and a communicative dimension
within symbolic aspects of products. He mixes items of Hassenzahl’s AttrakDiff
questionnaire with a selection of items he made up himself. Rubinoff (2004) uses
in his evaluation method a dimension called “branding” which includes items for
aesthetic and symbolic qualities.
Aesthetic aspects
The fields of fine art and design, as well as psychology have a long tradition
of evaluating aesthetics. Where in art, quantitative methods are of lesser
relevance, psychology has approached aesthetics primarily perceptually. Most
psychological work related to aesthetics has focused on perceptual features
(Leder, Belke, Oeberst, & Augustin, 2004), but for the context of UX, studies
showing a connection of perception and emotion are of particular interest.
According to Frijda (1989), aesthetic experiences can be seen as affectively
positive. Concerning the development of the affective state due to aesthetic
experience, the affective state at the beginning of an aesthetic experience is
particularly important. Konečni and Sargent-Pollock (1977) found that the
emotional state of the participants was a good predictor for ratings of
pleasantness in that positive judgments were made under conditions of positive
mood. Moreover, aesthetic experience might also change the affective state.
3 http://www.attrakdiff.de/
Page 41
Various approaches to the assessment of visual aesthetics of products take
an HCI or design perspective. Kleiss and Enke (1999) for example used 18 pairs
of bipolar attributes to assess the visual appearance of automotive audio
systems, such as “stylish-functional”, “revolutionary-established”, exciting-boring”,
etc.. In a similar study, Park, Choi and Kim (2004) identified 13 aesthetic
dimensions in the design of web sites. Nonetheless, like in other approaches
some of the items also represent instrumental and symbolic qualities.
Schenkman and Jönsson (2000) modulated seven aesthetic aspects to
assess visual aesthetics: complexity, legibility, order, beauty, meaningfulness,
comprehension, and overall impression. Each variable is only represented by one
item and the names of the concepts seem somewhat ambiguous.
Lavie and Tractinsky (2004) present a comprehensive approach to the
measurement of visual aesthetic. They developed a questionnaire based on four
empirical studies that consists of two main dimensions of visual aesthetics, which
they labelled classical aesthetics and expressive aesthetics. The classical
aesthetics dimension relates to aesthetic notions that presided from antiquity until
the 18th century. These notions emphasize orderly and clear design and are
closely related to many of the design rules advocated by usability experts today.
The expressive aesthetics dimension is manifested by the designers’ creativity
and originality and by the ability to break design conventions (Lavie & Tractinsky,
2004, p. 269). To measure each of the dimensions they give a five-item scale.
Hassenzahl (2007) criticizes that the dimension of expressive aesthetics
measures more symbolic or motivational aspects that are conveyed by visual
attributes than directly focusing on aesthetic aspects.
2.3.4 Measuring the experiential
Methods in this category include a great variety of qualitative, eventually less
systematic evaluation strategies that try to measure certain or even all aspects of
a user experience. Some of the methods have been used in HCI (e.g. observation
or task analysis) and marketing (e.g. focus groups) for a long time. In an attempt
for completeness, some methods are mentioned here, but it would go beyond the
focus of this thesis to discuss them in detail.
Fisher and Sanderson (1996) propose to use conversation analysis, verbal
and non-verbal protocol analysis and discourse analysis to capture the
experience. In a recent overview, Ardito, Costabile, Lanzilotti and Montinaro
(2007) have proposed some methods to evaluate games
- Direct Observation and Video Analysis for examining behaviour
- Focus groups to capture first impressions and opinions
- Essays and drawings analysis

Page 42
- Motivational patterns, e.g. the Task Status Display (TSD) pattern
Csikszentmihalyi and Larson (1987) have developed the Experience
Sampling Method (ESM). The experiences, thoughts, and feelings of a number of
people at random moments during the day are sampled as they go about their
daily activities. Participants in an ESM study carry an electronic pager and fill out
reports and questionnaires when they are notified.
The cultural probes technique (Gaver, Dunne, & Pacenti, 1999) is intended
more as an inspiration for designers than an evaluation of existing products.
Subjects receive a kit with different tools to capture experiences in it, e.g. a photo
camera, dream recorder, notebook, etc. People describe their experiences and
attitudes towards their life, similar to the ESM of Csikszentmihalyi and Larson. A
similar approach is the technology biography of Blythe, Monk and Park (Blythe,
Monk, & Park, 2002).
Some more systematic and acknowledged approaches include:
- Attribution: a description of the product with adjectives: the product is
sporty, elegant…
- Comparison: a comparison of the product with something else: animal,
profession, artefact...
- Negation: attributes that do not fit with the design
- Sensation: effect of the product on the five senses: how would the product
smell, taste, feel…?
- Narration: a story describing the product emotion: every story contains
symbols and memories which can be related to the product
- Projection: a description not of the object itself, but of the user, buyer,
owner of the product
- Product Personality Assignment (PPA): A method (Jordan, 1997) to relate
product design to human personality types, using the Myers-Briggs Type
Indicator
- Mood board: a mood board is a collage of images, corresponding to the
expression of the product
- Visual positioning: systematic approach of a mood board; subjects are
questioned and respond with their own or pre-defined images

Page 43
3 Method The last chapter has shown that there is a great variety of UX
theories and frameworks available. The associated measurement
methods are not very sophisticated or take a too abstract approach,
compared to traditional usability evaluation methods. Furthermore, it
is unclear, how these measures feed back to user experiences.
The aim of this thesis, as stated at the beginning, is the
development of new evaluation methods for UX. In order to do this,
the measurement has to be grounded in a theory, and aspects of the
theory have to be identified that are a) relevant for the construct, and
b) measureable. This chapter starts with the presentation of a UX
framework that assists to embed the two measurement instruments
into a context. Important elements are emphasised and examples
illustrate the practical meaning of the framework. The two
measurement methods are presented and the elements they
measure are highlighted. In Chapters 3.2 and 3.3, methodological
aspects are presented and discussed.
3.1 First impressions and affective reactions
The UX model described here was inspired by ideas of different frameworks
presented in the last chapter and integrates and extends them to a new model.
Especially the terminology and the basic distinction of pragmatic and hedonic
qualities of products are borrowed from Hassenzahl’s framework of UX (for
details see, Hassenzahl, 2003).
3.1.1 A UX framework
Figure 3-1 shows an overview of the proposed model with its key elements. At
the beginning of the user experience process, the user perceives the product’s
features (e.g. layout, content, functionality, interaction capabilities). He combines
them with his personal expectations, needs or standards to form the perceived
product character (e.g. innovative, comprehensible, or professional). The product
character is a high-level description, similar to the character we attribute to
people (Janlert & Stolterman, 1997). It summarizes a product’s qualities, e.g.
novel, interesting or useful, and thus reduces complexity. The perceived product
character is constructed automatic and in just a moment, and it triggers strategies
for handling the product (Hassenzahl, 2003). The product character consists of
groups of pragmatic (e.g. utility, functionality) and hedonic (e.g. stimulation,
novelty, identification) qualities. Pragmatic attributes are connected to the users’
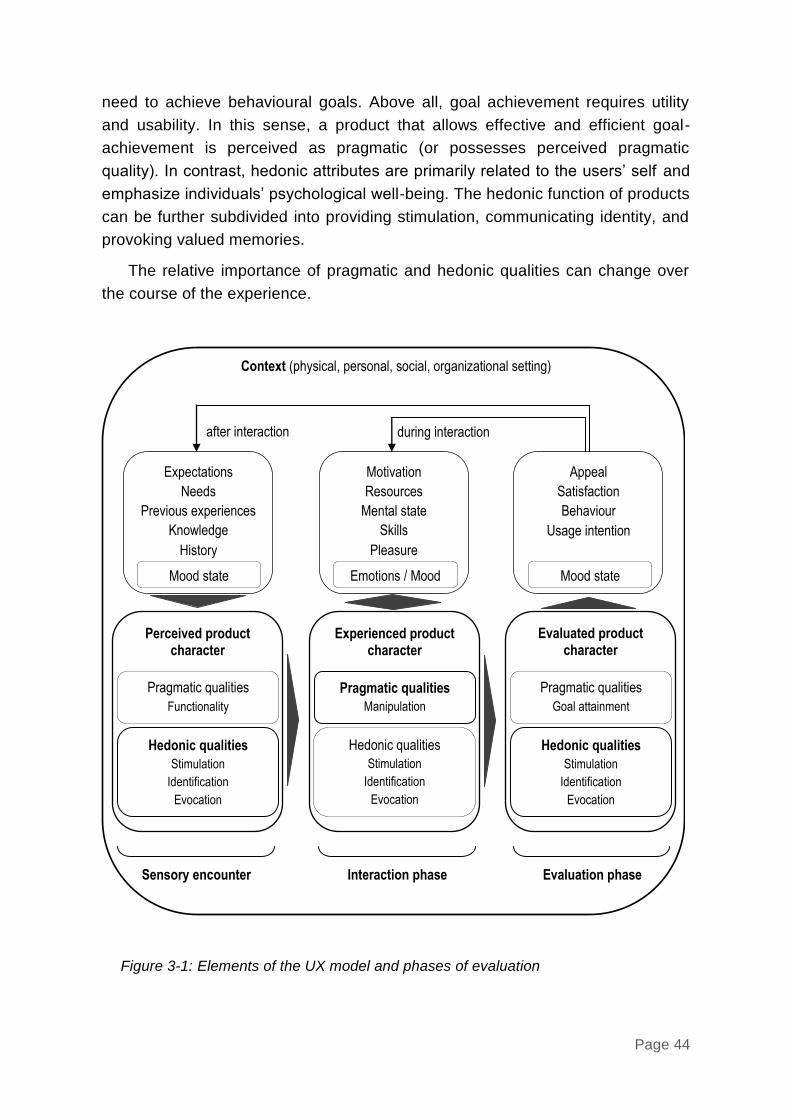
Page 44
need to achieve behavioural goals. Above all, goal achievement requires utility
and usability. In this sense, a product that allows effective and efficient goal-
achievement is perceived as pragmatic (or possesses perceived pragmatic
quality). In contrast, hedonic attributes are primarily related to the users’ self and
emphasize individuals’ psychological well-being. The hedonic function of products
can be further subdivided into providing stimulation, communicating identity, and
provoking valued memories.
The relative importance of pragmatic and hedonic qualities can change over
the course of the experience.
Expectations
Needs
Previous experiences
Knowledge
History
Motivation
Resources
Mental state
Skills
Pleasure
Appeal
Satisfaction
Behaviour
Usage intention
during interaction after interaction
Context (physical, personal, social, organizational setting)
Sensory encounter Interaction phase Evaluation phase
Perceived product character
Pragmatic qualities
Functionality
Hedonic qualities
Stimulation
Identification
Evocation
Experienced product character
Pragmatic qualities
Manipulation
Hedonic qualities
Stimulation
Identification
Evocation
Evaluated product character
Pragmatic qualities
Goal attainment
Hedonic qualities
Stimulation
Identification
Evocation
Mood state Emotions / Mood Mood state
Figure 3-1: Elements of the UX model and phases of evaluation

Page 45
The first encounter with a product (i.e. seconds to minutes, depending on the
product) is purely sensual and is named here sensory encounter (MacDonald,
2001; 2002).
The next phase is the actual interaction phase with the product, e.g. buying a
good on a website or driving a car. The user will modulate the product character
to an experienced product character from qualities and product features that he
experiences, based on his motivation, resources, skills or mood state. The
relevant product qualities might be the same as during sensory encounter, or
might be different qualities if they were not perceivable or were of minor
importance during the first phase. The experience with the product will continually
feedback to motivation, mood state or resources and will eventually elicit
emotions.
Finally, after the interaction or during breaks in the interaction phase, the
product is retrospectively evaluated in the evaluation phase. The perceived
product character is compared to the experienced product character, some
features are valued more important than others retrospectively and product is
evaluated if it fulfils the current or future needs. This evaluation leads to
consequences: affective state might be maintained or changed (e.g. satisfaction,
good or bad mood), explicit evaluations (e.g. judgements of appeal, beauty,
goodness), or behavioural consequences (e.g. usage intention,
approach/avoidance). The consequences of a particular product character are not
necessarily always the same, but are moderated by the specific usage situation.
Individuals might find a product novel, but do not necessarily evaluate it as
appealing. In other words, evaluation of hedonic or pragmatic qualities can
potentially lead to a positive outcome, but does not have to.
The three phases have similarities to Norman’s 3-level theory of human
behaviour (Norman, 2004) that integrates affective and cognitive processes. In
each level, the world is being evaluated (affect) and interpreted (cognition). The
lowest level processes takes place at the reaction (or visceral) level, which
surveys the environment and rapidly communicates affective signals to the higher
levels. The routine (or behavioural) level is where most of our learned behaviour
takes place. Finally, the reflection level is where the highest-level processes
occur. The important role of affect in human behaviour is that our thoughts
normally occur after the affective system has transmitted its information
(Tractinsky & Zmiri, 2006).
While Norman’s levels are hierarchical and parallel processes, the three
phases of constructing product character are sequential. In the sensory
encounter phase, aesthetics play an important role. Although aesthetics are not
explicitly highlighted in the model, they are part of pragmatic, but especially

Page 46
hedonic quality attributes of the product. Aesthetic evaluations may take place on
all three levels or phases, but there is evidence that first aesthetic impressions
are formed immediately at a low level (sensory encounter phase) and precede
cognitive processes (e.g. Zajonc & Markus, Affective and Cognitive Factors in
Preferences, 1982; Norman, 2004). Those first impressions may persist and
correlate highly with later evaluations of interactive systems (Tractinsky, Katz, &
Ikar, 2000; Tractinsky, Cokhavi, & Kirschenbaum, 2004; Fernandes, Lindgaard,
Dillon, & Wood, 2003). Instrumentality considerations (i.e. pragmatic qualities) are
most likely to take place at the routine level (interaction phase). The model
stresses the importance of pragmatic qualities during interaction. Considerations
of the artefact’s symbolism (hedonic qualities) are likely to occur at the reflective
level (evaluation phase).
The outcomes of the evaluation feed back to the expectations, needs, history
or moods of the user, influencing the next experience with the same or a different
product. However, they can also feed back to an ongoing interaction, e.g. working
for days or month with a computer in an office workplace.
An example application of the framework
For a better understanding, let us take a look at an example. A person, e.g.
Brad, is interested in buying a new car. He has been looking through brochures of
car companies, has seen advertising on TV and has been talking to a friend
about his experiences with cars [input: knowledge, history, previous experiences].
He actually needs a car that takes him to work every day [input: needs], but he
also likes to make a statement about his social status with the car [input:
expectations]. The car dealer presents him a new Volkswagen (VW) model
[context: social]. Brad likes the dark colour because it looks elegant [perceived
product character] and since he is in a good mood [input: affect/mood], the sporty
style of the VW springs to his eye [hedonic quality: identification]. It reminds him
of his first car he had when he was young [hedonic quality: evocation]. And he is
surprised of the new design of the back lights that he has never seen before like
this [hedonic quality: stimulation]. The car dealer mentions the reliability of the
engine to Brad [pragmatic quality: functionality]. Brad constructs mentally a
perceived product character of the car.
Then, he can test drive the VW. The leather interior supports the notion of an
elegant, noble car [hedonic quality: identification]. Brad likes the quiet sounds of
the engine, and that the car speeds up very quickly. He also notices the clear
arrangement of meters on the dashboard [pragmatic quality:
functionality/manipulation]. He is surprised how unexpectedly unconstrained the
gears can be shifted [hedonic quality: stimulation]. The smell of the new interior

Page 47
reminds him of happy moments driving around in a new car [hedonic quality:
evocation]. Good that he is such an experienced driver [input: skills/knowledge], it
makes driving around a real pleasure [feedback: emotions]. This is a car to his
taste [experienced product character]. Brads mood is even getting better
[feedback: mood] when he notices the passers-by that admire him in his car
[context: social; hedonic quality: identification; feedback: motivation]. His mood
gets worse when the engine wouldn’t start after a stop in front of a red traffic light
[pragmatic quality: functionality; feedback: mood]. But he finally makes it back to
the car dealer.
Brad is unsure of the reliability of the car because the engine has once not
started [pragmatic quality: goal attainment]. He finds the car dealers promise of
reliability not true and is not satisfied [consequence: satisfaction]. He decides to
wait with his purchase [consequence: usage/purchase intention]. All in all, he
does not really like the car now [consequence: appeal; evaluated product
character], although he really enjoyed the envious looks of the passers-by
[consequence: pleasure/enjoyment; hedonic quality: identification; context:
social]. He spent another two hours evaluating cars, and he really needs a new
car, that makes him feel a little depressed [consequence: mood; feedback:
needs/previous experiences/mood; context: personal].
The example should have illustrated the basics of the UX framework
presented. In the following, two important aspects – the moderating aspect of
affect, emotions and mood and hedonic qualities – will be discussed in more
detail. Mood and hedonic qualities are the elements of UX that will be measured
by the methods developed within the scope of this thesis.
3.2 The mediating effect of mood and affect in interaction
3.2.1 Affect, emotion, mood
Before continuing with details of the UX framework, the terms affect, emotion
and mood should be clarified. The terms affect, emotion and mood are often used
interchangeably without a clear definition (Forgas, 1995). The term affect is used
here as a higher-level label and the most generalized of the three terms. It may
be used to refer to both emotions and moods (Forgas, 1995). This is consistent
with the understanding in related research (e.g. Brave & Nass, 2003; Russell,
2003). An emotion has the properties of a reaction: it often has a specific cause,
a stimulus or preceding thought, it is usually an intense experience of short
Page 48
duration - seconds to minutes - and the person is typically well aware of it. On the
other hand, a mood tends to be subtler, longer lasting, less intensive, more in the
background, giving the affective state of a person a tendency in positive or
negative direction. Moods tend to be nonspecific compared to emotions, which
are usually specific and focused on an identifiable person, object or event. In
psychological research, it has been shown that mood affects memory,
assessment, search strategy (e.g. in e-commerce), judgment, expectations,
opinions and motor behaviour (e.g. Derbaix & Pecheux, 1999).
In contrast to emotions, people may not be aware of their mood until their
attention is drawn to it. Moods tend to bias which emotions are experienced,
lowering the activation thresholds for mood-related emotions or serve as an
“affective filter”. A series of discrete emotions, on the other hand, can become the
cause of a more enduring emotional state (e.g. Aboulafia, Bannon, & Fernstrom,
2001; Brave & Nass, 2003). In other words, distinct emotional episodes result in
changes of mood state. Hence, it is important to consider the biasing effect of
moods, e.g. in UX studies: subjects in a good mood are likely to experience
positive emotions, subjects in a bad mood experience more likely negative
emotions.
Core affect and affective quality
In the context of UX, the concepts of affect introduced by Russel (2003) might
be more useful, as they distinguish clearly between emotion, mood (feeling) and
the objects that might lead to changes in affect.
Core affect refers to a neurophysiological state that is consciously accessible
as a simple, non-reflective feeling that needs not to be directed at anything
(Russell & Feldman Barrett, 1999). Core affect is considered to be primitive,
universal and ubiquitous, it lasts over the course of time and is always present
(Diener & Iran-Nejad, 1986). Although core affect is not necessarily consciously
directed at anything, it can become directed, as when it is part of an emotional
episode. Core affect has also been called affect (Watson & Tellegen, 1985),
mood (Morris, 1989), and feeling (Russell, 2003).
Empirical research found that core affect, can be described by two
independent dimensions, the degree of pleasantness (valence: pleasure-
displeasure) and the degree of activation (arousal: sleepy-activated). Valence
summarizes how well one is doing, the extent to which one is feeling good or bad.
Arousal refers to a sense of mobilization or energy, the extent to which one is
feeling engaged or energized.
Affective quality is the ability to cause a change in core affect (Russell, 2003).
Whereas core affect exists within the person, affective quality exists in the

Page 49
stimulus. Objects, places, and events all have affective quality. They enter
consciousness being affectively interpreted. The perception of the affective
quality of the stimuli typically becomes conscious at any one time, then influences
subsequent reactions to those stimuli (Russell, 2003).
Perceived affective quality is an individual’s perception of an object’s ability to
change his or her core affect. It is a perceptual process that estimates the
affective quality of the object. It begins with a specific stimulus and remains tied
to that stimulus (Russell, 2003). Perception of affective quality has been called
other terms such as evaluation, affective judgment, or affective reaction, and it is
considered a ubiquitous and elemental process (Zajonc & Markus, Affective and
Cognitive Factors in Preferences, 1982; Russell, 2003).
It is worth noting that core affect can change without reference to any external
stimulus, and a stimulus can be perceived as affective quality with no change in
core affect - as when a depressed patient admits that the sunset is indeed
beautiful but cannot alter a persistently depressed mood (Russell, 2003). The
contributing factors to a person’s core affect can be numerous, either internally
(factors within the person) or externally (stimuli in the environment). From an HCI
perspective, the connection between a person’s affect and the possible affect-
eliciting quality of a product is interesting. Perceived affective quality is a
construct that makes such a connection. In addition, one thing that is very
attractive or affect evoking to one person may not be so to another. Perceived
affective quality reflects this subjectivity.
3.2.2 Affect in UX
UX research stresses the importance of emotions and psychological research
could show that they are fundamental aspects of human beings, influencing
perception, cognition, behaviour, judgement or decision-making (e.g. Forgas,
1995; Russell, 2003). The proposed model of UX shows that mood and emotions
are also important in the view of the author, but maybe in a different sense than
other UX frameworks understand the influence of affect in user-product
relationships.
In Chapter 2.2.2 it has been noted that there are two major perspectives of
dealing with affect in UX. One perspective understands emotions as
consequences of product use, as the result of cognitive appraisal processes of
the product and the usage situation. The other perspective on emotions in UX
sees emotions as antecedents of product use and evaluative judgements. The
presented framework adds a third perspective that sees affect as a mediator
between perception, experience and evaluation of product use.

Page 50
The interplay of emotions and moods with cognition and perception is
complex. Zajonc (1980) showed that valenced affective reactions can be
instantaneous, automatic, and without cognitive processing. Current HCI
research understands the emotional view as opposed to traditional usability
research that stressed cognition, but contemporary psychology understands
emotions and cognition as integral parts of each other (Hassenzahl, 2004b).
Complex emotions like joy, satisfaction or pride require cognitive processing.
Satisfaction, for example, is the consequence of comparing an event’s outcome
(e.g. product use) with one’s expectations (Ortony, Clore, & Collins, 1988).
Therefore, complex emotions as a consequence of the evaluation of a product
must be part of any UX framework. However, the process of evaluation feeds
back to the affective state while interacting, but also influences future perceptions
and experiences. Cognitive and affective experiences are linked reciprocally
(Scherer, 2001). Discrete emotions, as noted in the last chapter, can become the
cause of a more enduring emotional state (mood) and moods tend to bias which
emotions are experienced.
As the concept of core affect shows (Russell, 2003), there are also longer
lasting, non-reflective feelings, which are not directed at anything and are always
present. These mood states at the beginning of an experience can affect the
quality of information processing according to Forgas (1995). Positive affect, for
example, supports a holistic mode of processing, which is based on activation of
wide semantic fields in memory, in contrast to negative affect that leads to a more
restricted processing. Mood is therefore an important mediator for experiences.
Another issue of UX models concerns the connection of product attributes
and emotions and whether an emotional experience can actually be designed or
not. Hassenzahl (2004b) argues that designers can shape, but not determine an
emotional experience. Emotions are too ephemeral. Often emotional design is
understood as the attempt to induce emotions through a particular product, but
the most fundamental discrete emotions (e.g. love, hate, liking) are only
momentary and largely dependent on context. The emotional state of a computer
user for example is usually not oriented towards the device itself, but to the
overall activity in general (either work activity or pleasure), where the computer or
software is merely a mediating tool between the motive and the goals of the user.
For this reason, one and the same action or situation may lead to various and
even contradictory emotional colouring. Therefore, objects or products should not
be seen as affective themselves (Aboulafia, Bannon, & Fernstrom, 2001). This
implies that affect measurement should not take place on the product level, but
on the level of the user.

Page 51
3.2.3 Towards a measurement instrument for mood in UX
The measurement of affect in UX poses a number of problems as the
discussion of the framework just has shown. It is unclear whether the
measurement of complex emotions as outcome of an evaluation would be more
important or the measurement of mood influencing the perception and changing
over the course of the experience. The development of a new measurement
method seems appropriate, considering the following aspects:
- Discrete emotions last only a short time (a few seconds to minutes), so
measurement would have to be precise or retrospective.
- Retrospective assessment can be subject to distortions, e.g. through
social desirability or self-deception.
- The change of affect during interaction is as important as the emotional
consequences of product evaluation.
- It is unclear how many and which distinct emotions humans can feel,
which are basic and which are complex emotions.
- Affect is subjective, and although there are instruments to distinguish at
least a few emotions objectively from each other, an accurate account of
what is felt can only come from the subject itself.
- Affect is not necessarily conscious; hence, self-assessment of affect is not
always possible.
- Describing affect verbally can be ambiguous and difficult, if mixed or
complex emotions are involved.
- Mood as an antecedent, consequence and mediator of different affective
and cognitive processes appears to be a central aspect in UX.
The method developed therefore addresses the implicit measurement of
mood state during interaction. It explores the possibility of implicitly capture the
mood state of a user, working on a computer with a standard mouse and
keyboard, by detecting changes in motor behaviour variables through mouse
movements. Instead of assessing a small set of distinct emotions retrospectively,
the continuously changing result of emotional episodes, mirrored in the mood of
the user, is assessed. The measurement is concurrent with the interaction
between the user and the software.
Chapter 4 presents two experiments that tested the implication that mood and
motor expressions are actually connected and presents the results of the
feasibility study. In the next chapter, a short literature review is presented that
explores empirical research regarding motor expressions and affect.

Page 52
3.3 Sensory encounters and hedonic qualities
3.3.1 Hedonic and pragmatic qualities of products
The presented UX model assumes that two distinct groups of qualities,
namely pragmatic and hedonic qualities, can describe product characters.
Pragmatic qualities are connected to the users’ need to achieve behavioural
goals. Primarily, goal achievement requires utility and usability. In this sense, a
product that allows for effective and efficient goal-achievement is perceived as
pragmatic (or possesses perceived pragmatic quality). In contrast, hedonic
attributes are primarily related to the users’ self. They can be further subdivided
into stimulation, identification and evocation (Hassenzahl, 2003).
Stimulation, novelty, and challenge are prerequisites of personal development
(i.e. the propagation of knowledge and development of skills), which in turn is a
basic human need (e.g. Csikszentmihalyi, 1975; Schwartz & Bilsky, 1987).
Products have to provide new impressions, opportunities and insights.
Identification addresses the human need to express one’s self through
objects. This self-presentational function of products is entirely social; individuals
want to be seen in specific ways by relevant others (e.g. Prentice, 1987; Wicklund
& Gollwitzer, 1982). Using and possessing a product is a means to a desired self-
presentation.
Products can represent past events, relationships or thoughts that are
important to the individual. When products can provoke memories, they have
hedonic qualities. Souvenirs, for example, are a product category that provides
only hedonic value by keeping memories of a pleasant place or time alive.
A product can therefore be perceived as pragmatic because it provides
effective and efficient ways to achieve behavioural goals. Moreover, it can be
perceived as hedonic because it provides stimulation by its challenging and novel
character, identification by communicating important personal values to relevant
others or evocation because it evokes memories.
3.3.2 Sensory encounters
The first encounter with a product (i.e. seconds to minutes, depending on the
product) is purely sensual (visual, auditory, tactile or olfactory) and is named
therefore sensory encounter (MacDonald, 2001; 2002). Although aesthetic
aspects are not explicitly mentioned in the framework, they are implicitly included
in the product character and the product qualities. Hedonic aspects encompass
aesthetic and symbolic aspects. Aesthetics play an important role in product
evaluation, especially on the first impression, but a human will not just “purely”

Page 53
perceive colours or forms, he will make sense of it. Pragmatic (instrumental)
qualities play only an inferior role in sensory encounters. Sensory encounters are
comparable to meeting a person for the first time. We decide within seconds to
minutes if we like the person, if we will get along with him/her and what we can
expect of the person. We instantly create a “personality” from elements that we
can perceive.
Social scientists have shown that people also associate the physical
appearance of products with personality attributes (Dion, Berscheid, & Walster,
1972). Desmet (2003) suggests that objects can be associated with user groups
or institutions, which are the objects of social appraisal. In the UX framework
presented, the product character is constructed from pragmatic and hedonic
qualities (with a less significant role for pragmatic quality). Janlert and Stolterman
(1997) refer to character as a “coherent set of characteristics and attributes that
apply to appearance and behaviour alike, cutting across different functions,
situations and value systems - aesthetical, technical, ethical - providing support
for anticipation, interpretation and interaction.” (p. 297).
Researchers in the area of marketing and consumer behaviour concluded that
the aesthetic quality of a product influences consumers’ attitudes towards the
product. For example, Bloch (1995) claimed that the “physical form or design of a
product is an unquestioned determinant of its marketplace success” (p. 16).
Gladwell (2005) propagates the “magic” of the first impression and presents
different examples how the sensory encounter determines later evaluation.
To sum up: the sensory encounter is an important determinant of later product
evaluation. People succeed in constructing a product character (or personality),
before the actual interaction starts.
3.3.3 Towards a measurement instrument for hedonic qualities
As in chapter 2.3.3 on the measurement of hedonic qualities was discussed,
there are only a few existing methods to assess hedonic aspects of products. And
even the few that exist, measure either purely aesthetic aspects or use simple
verbal questionnaires with a small number of items.
The aim of chapter 5 of this thesis is the presentation of a new measurement
instrument for the perceived product character that is constructed during sensory
encounter. There is a need for a new method, because a number of limitations of
existing methods had been identified:
- Aesthetics are very important during sensory encounter, but nevertheless,
existing methods apply verbal methods. A mix of verbal and visual
methods would improve the explanatory power of the method.

Page 54
- Verbalization of a product character is yet more difficult, because the
process of constructing the character is mainly subconscious. An indirect,
projective method would be more appropriate.
- Moreover, the assessment of the product character might be distorted or
biased when made conscious. The measurement tool should account for
that and take a playful approach.
- Product character is complex. With an over simplistic method it is not
possible to grasp the complete character. It should be measured
multifactorial.
- Often, the aim of the methods is to relate product features to product
character (e.g., round corners make the product look feminine). Although
this might be a long-term goal, the interplay of single elements making up
the character of the product is too complex. To capture product character
in its completeness poses enough difficulties for the moment. Ideal would
be a method that feeds back inspirations to designers anyway.
- Methods do not account for the subjective nature of product character.
Objective results are important, but subjective information might be
appropriate, too.
- The existing methods are very static. The requirements of different product
groups (e.g. cars, furniture, chocolates, software) might be very different
and the product character of a car has to be described differently than the
character of a software. The measurement tool should therefore be flexible
and modular.
- The perceived product character might be influenced by culture,
demographics or time. So it is important to include information on the
subjects in a test-tool.
The method presented in chapter 5 therefore addresses the measurement of
the perceived product character during a sensory encounter. Although it
encompasses all aspects of the product character, specific emphasis is put on
the hedonic quality identification. Because the sensory encounter is short and
often unconscious, the measurement tool employs an implicit, projective method.
It uses visual and verbal techniques in the survey, and provides visual and verbal
results. It uses a playful, pleasurable approach, and supplies designers with
visual and verbal inspirations. The measurement tool is made up of different
modules to guarantee flexibility and provide qualitative and quantitative results.
Page 55
4 Study 1: Mood in interaction Two experiments were designed to investigate the effects of
induced mood in the affective dimensions valence and arousal on
motor-behavior parameters while completing a computer task. Film
clips were used as affect elicitors. The task was an online-shopping
task that required participants to shop on an e-commerce website for
office-supplies. 76 subjects participated in the first experiment using
a between groups design, 32 subjects participated in the second
experiment using a within groups design. To begin with, all
participants viewed an emotionally neutral film clip. Then, they were
presented with one out of four emotional film clips: a positive valence
high-arousal, a positive valence low-arousal, a negative valence
high-arousal, and a negative valence low-arousal clip. Computer-
mouse movements of subjects during the task were recorded to log-
files. Movement parameters from 12 categories were calculated and
statistically analyzed. In experiment 1, a significant effect of arousal
on movement parameters could be found, no effect was found for
valence. In experiment 2 these findings could not be replicated, no
effect was found for valence or arousal.
4.1 Introduction
The need for new mood measurement methods for UX research, especially
concurrent with interaction, has been identified in chapter 3.2. The basic idea for
the new method was to use mood dependent changes in motor expression of the
hand while manipulating a computer. There is evidence in the research literature
that a connection between motor expression of the hand and mood exists
(Wallbott, 1982; de Meijer, 1989; Wallbott, 1998; Juette, 2001; Zacks, 2004;
Hartmann, Mancini, & Pelachaud, 2006; Ahmed & Traore, 2007). The following
feasibility studies explore, which movement parameters would be suitable for an
automatic analysis and if the correlation between movement parameters and
mood would be statistically relevant.
An extensive literature research has been made to find existing parameter
sets for the analysis of movements. Although some studies found movement
parameters correlated with depression, frustration or suitable for authentication,
concise results of which movement variables are interrelated with valence and
arousal were not available. One aim of the study is therefore to collect possible
movement parameters that describe the quality of movement and to select those
that are supposed to be correlated with valence and arousal.

Page 56
To get appropriate samples of differing mood states, we induced mood in the
laboratory with film clips. Films are often used as affective elicitors because they
can induce a wide range of affective responses (Gross & Levenson, Emotion
elicitation using films, 1995). There is an ongoing discussion about whether
artificially induced mood can be equated with natural mood state, but for practical
reasons – to get a large enough sample with a wide variety of mood states – film
clips as affect elicitors were used.
The second aim of the study was to test the assumption that mood
dependent changes in motor expression, translated from hand movement to
movements of a mouse cursor on the screen, can be analyzed and show
statistically relevant differences. To investigate this aim, the subjects conducted a
shopping task at the computer, while their mouse activity was recorded. The task
intended to be affectively neutral to change the induced mood as little as
possible.
In parallel to the recording of mouse parameters, physiological data
(respiration, electrodermal activity, heart rate, and electromyography) was
recorded by another research group (see Gomez (2005) for results).
4.2 Method – Experiment 1
4.2.1 Design
The experiment applied a between-group design. The four different mood
states PVHA, PVLA, NVHA, and NVLA (P=positive, N=negative, H=high, L=low,
V=valence, A=arousal) serve as a between group factor (independent variable).
4.2.2 Subjects
Participants were 76 volunteers (39 men and 37 women). The mean age was
24 years, ranging from 17 to 35. Most participants were undergraduate students.
Entry criteria for the study included good general health and German as mother
tongue.
4.2.3 Mood induction
All participants viewed two film clips. The first clip was the same for all
participants and was labelled “neutral clip” because it was expected to be
emotionally neutral (neutral valence, low arousal4). It showed excerpts from an
4 Affectively “neutral” is the most common, everyday state that is felt most of the day, i.e. the
answer to the question “How do you do?” would be “ok”, but not good or bad. Because of the calibration of the valence/arousal space, this state is on neutral valence and slightly low arousal.

Page 57
educational program about the characteristics and applications of materials. The
clip was 10' 18'' long. For the second clip, participants were presented with one of
the following four clips. Scenes of different sports (e.g., climbing, surfing, skiing,
parachuting) with rock and pop music in the background were selected to induce
the positive high-arousal emotional state (sport clip, 10' 02''). Takes from
landscapes and animals with soft music score were used for the elicitation of
positive low-arousal emotions (nature clip, 6' 19''). A scene adopted from the
movie “The Deer Hunter” (Cimino, 1978), depicting captives in Vietnam being
forced to play Russian roulette, was chosen to induce negative high-arousal
feelings (torture clip, 10' 10''). Excerpts from the documentary “Les Enfants du
Borinage - Lettre à Henri Storck" (Jean, 1999) about the Borinage, an old mining
area and now a slum in Belgium, were meant to elicit negative low-arousal
emotions (slum clip, 10' 52''). The nature clip had a shorter length than the others
because in the selection phase, boredom was reported by some subjects when
viewing a longer version. These four clips are referred to as emotional clips.
Table 4-1: Content of the film clips used in the experiment (PV = positive valence, HA = high arousal, NV = negative valence, LA = low arousal)
Mood Content
Neutral Educational movie about the characteristics of different materials
PV/HA Clips of different sports with rock and pop music
PV/LA Takes of landscapes and animals with classical music
NV/HA Extract from Deer Hunter, depicting captives in Vietnam war
NV/LA Documentary about an old mining area and now a slum
The five clips were selected from 23 clips based on evaluation in pretesting in
our laboratory. They were chosen for their ability to induce different emotional
states defined by the affective dimensions of valence and arousal. Their ability to
evoke specific discrete emotions such as disgust, fear, or joy was not used as
selection criterion.
The film clips were presented on a computer screen, embedded into the
experimental environment. Sound intensity was set at a comfortable level. If
desired, participants could regulate it.

Page 58
4.2.4 Questionnaires
Affective state
Affective state was quantified with the rating scales of the graphical Self-
Assessment-Manikin (SAM) (Lang, 1980). The SAM is a language-free
instrument for rating valence and arousal, and consists of a graphic figure
representing nine levels each of valence and arousal (see Figure 2-3). Subjects
were asked to rate their momentary mood state on the nine point graphical scale.
Valence and arousal ratings were completed electronically on the computer
screen.
Personality
Because subjective responses and motor expression to affective stimuli may
be influenced by personality traits (e.g. Gross, Sutton, & Ketelaar, 1998),
participants completed at the end of the experiment the German version of the
“NEO Five-Factor Inventory” (NEO-FFI) by (Costa & McCrae, 1992) on the five
personality traits neuroticism, extraversion, openness, agreeableness, and
conscientiousness.
4.2.5 Task
Subjects had to shop on an e-commerce website for office-supplies (see
example in Figure 4-1). The task was selected because of its applied, real-world
nature with little impact on the induced mood. Each task was divided into 8
subtasks telling the subject to buy one of the products from the website or – as a
last task – to write a predefined message to the shop operator. For example: “Buy
6000 sheets of fanfold paper.”
4.2.6 Technical environment
The technical environment consisted of a standard Windows PC with monitor
(21” diagonal), mouse, keyboard and speakers. The experiment was fully
automated and implemented as a web-based application, running on a local web-
server with scripting support and a database for data collection. All materials
(questionnaires, shop, film clips) were supplied from the local computer, all
subject data and relevant behavioural data was stored locally. The materials were
presented in a standard web-browser running in a kiosk-mode (a browser without
menu controls, limiting interaction to the controls within the web-page).

Page 59
The recording of mouse movements and mouse clicks was implemented with
a custom-made JavaScript5 application. Mouse recording data was transferred
asynchronous via AJAX (Asynchronous JavaScript and XML) and saved in XML
(Extensible Markup Language) format.
The following events were recorded:
- Mouse-down: mouse button pressed
- Mouse-up: mouse button released
- Mouse-click: mouse button click
- Double-click: mouse button clicked twice in short succession
- Mouse-move: movement of mouse
- Page-load: new page in web-browser window loaded
- Page-unload: page in web-browser window unloaded
For each recorded event, the following information was saved:
- X and y coordinates of the mouse pointer
- Timestamp in milliseconds (since start of recording)
- Code for event type
- URL (Uniform Resource Locator) of the page that is displayed
Figure 4-1: Task window as presented to the subjects: online-shop on top, task on the bottom
5 ECMA-Script 4: http://www.ecmascript-lang.org/

Page 60
4.2.7 Procedure
The study consisted of a between groups design comprised of four
experimental conditions. Participants were randomly assigned to view the positive
high-arousal clip (sport film group), the positive low-arousal clip (nature film
group), the negative high-arousal clip (torture
film group), or the negative low-arousal clip
(slum film group). Assignment was constrained
so that approximately equal numbers of men
and women were assigned to each condition.
The four groups were composed as follows:
sport film group: 20 (10f/10m); nature film
group: 18 (9f/9m); torture film group: 19
(9f/10m); slum film group: 19 (9f/10m). The
experimental procedure was identical for all
groups except for the second film clip.
Students were invited to participate in an
experiment announced to investigate
physiological responses during two activities,
i.e., while watching film clips and while
completing a computer task. The two activities
were presented as unrelated, and subjects
were not informed about the recording of their
mouse activities prior to the experiment.
Participants were tested individually in one
experimental session. The experiment took
place in a noiseless, air-conditioned room.
Participants sat at a prepared table on a
comfortable armchair which was placed in
front of a computer monitor. First, they filled
out an informed consent, and the experimenter
provided them with an outline of the
experimental procedure. Participants were told
that they would complete three online-
shopping tasks and would see two short film
clips of about ten minutes in the order “task –
film clip – task – film clip – task”. They were
further told that after each task and each film clip they should answer some
questions and that all instructions during the experiment would be given at the
appropriate stage on the computer interface, so that they would go through the
Introduction
Subject data
Task exercise
Initial mood assessment
MOOD INDUCTION (neutral clip)
Mood assessment 1A
Task 1
Mood assessment 1B
MOOD INDUCTION (emotional clip)
Mood assessment 2A
Task 2
Mood assessment 2B
Debriefing
Figure 4-2: Experimental procedure
Page 61
experiment without the intervention of the experimenter. Yet, the presence of the
experimenter assured that they could ask at any time if something was unclear.
Following completion of biographical and health data questionnaires, bands
and electrodes were attached. After this, the participant was left alone. The
experimenter sat in another part of the room separated from the participant by a
cabinet. He could observe the subject by means of a closed circuit video system.
After the first computer task that served to familiarize the participants with the
website, the neutral clip was presented. Afterwards, the participants completed
the computer task for a second time. Then, the emotional clip was shown,
followed by the third task. After completing each of the three tasks and viewing
the two film clips, participants rated their momentary feeling state. After the last
rating, bands and sensors were removed.
The experiment ended after 1.5 to 2 hours with the completion of the
questionnaires. Participants were then offered something to eat, and the
experimenter revealed the aims of the study and made sure that participants
were fine. All participants reported to feel good. Finally, participants were thanked
and paid for their participation and asked not to reveal any of the details of the
experiment to other potential participants.
4.2.8 Behavioural measurements
In an extensive literature review, possible parameters that describe
movements were collected. The parameters can be grouped into the following
categories (see also Annex A: Mouse movement parameters):
- General activation
- Response time
- Spatial expansion
- Temporal expansion
- Speed
- Efficiency/Targeting
- Variability
- Fluency/course
- Complexity
- Energy
- Expressivity
- Emphasis
In a theoretical evaluation and selection process, the following 25 parameters
were selected for analysis (for a complete list of parameters see Annex A: Mouse
movement parameters):

Page 62
- Median velocity of movements (speed_median)
- Interquartile range of velocity of movements (speed_7525)
- Median acceleration of movements (accel_median)
- Interquartile range of acceleration of movements (accel_7525)
- Median expressivity of movements (expressivitaet_median)
- Interquartile range of expressivity of movements (expressivitaet_7525)
- Median distance of movements (mov_median_pixel)
- Average displacement from ideal movement (abstand_total_perMove)
- Interquartile range of movement distances (mov_7525_pixel)
- Interquartile range of displacement from ideal movement (abstand_7525)
- Maximum movement distance (mov_max_pixel)
- Maximum movement duration (mov_max_msec)
- Maximum displacement from ideal movement (abstand_max)
- Standard deviation of displacements from ideal movements (abstand_std)
- Average difference between ideal movement and actual movement
(realIdeal_diff)
- Clicks per minute (clicks_time)
- Number of movements (bewegungen_anz)
- Total distance travelled with mouse (mov_total_pixel)
- Total duration of mouse in movement (mov_total_msec)
- Number of velocity changes per movement (accdec_anz)
- Maximum velocity in all movements (speed_max)
- Maximum acceleration in all movements (accel_max)
- Maximum deceleration in all movements (decel_max)
- Median duration between a mouse click and the start of the movement
(clickMov_med)
- Median duration between the stop of a movement and the mouse click
(movClick_med)
4.2.9 Data preparation
Background
During the course of the experiment, mouse actions were recorded
continually into a log-file. For each action, type (e.g. click, movement), screen
coordinates and a timestamp were recorded. With this data, basic parameters
can be calculated with simple trigonometric functions, which reflect the changes
in distance, time, speed and acceleration between log-file entries, as well as the
length of an ideal line between two points in space. Subsequently, parameters of
higher-order can be calculated from these parameters.
The recording was event-based (as opposed to time-based, in fixed intervals),
meaning that an entry was written only when a change in activity happened, i.e. a

Page 63
movement or a mouse click. Some implications and difficulties result for the
processing of mouse actions, similar to the processing of physiological signals,
which has lead to complex pre-processing of the data. Highlighted in the following
are the segmentation of the data into meaningful parts (i.e. movements and
pauses) and the smoothing and interpolation of event data.
Data preparation and calculation was done with the software Matlab (The
MathWorks company).
Segmentation
Data segmentation was done gradually in two steps. In a first step, the whole
log-file was divided into segments by mouse clicks, so each segment started right
after a mouse click and ended before the next mouse click. As the task was goal
directed, the assumption that most movements were started and ended by a
mouse click could be made. But not all movements end with a mouse click, so a
further segmentation was made when the mouse “paused”. A pause was defined
as no movement for longer than 250 milliseconds. No information was found in a
literature research to determine this value, so it was approximated from visual
analysis of movement data. The resulting distinct movements were then filtered,
so that any movement below the threshold of 400 milliseconds was ruled out as a
“real” movement to avoid micro-movements as artefacts of recording technique.
Smoothing and interpolation
The spatial and temporal intervals between data points could become as
small as 5 milliseconds and 1 pixel and thus made the calculation of error-prone.
To avoid artefacts and outliers, the data was smoothed with a zero-phase moving
average filter with a window size of 5. This filter calculates each data point as an
average of the neighbouring data points, the window size determines, how many
neighbouring points will be included in the calculation.
Because the time intervals between data points (event-based recording) were
not equal, an interpolation of the data was made. New data point were calculated
with a fixed time interval of 20 milliseconds. The interval is large enough to
assure accuracy of further calculations, and small enough so details of the
movement are not lost.
Calculation of parameters
After the data preparation, the actual calculation of the base parameters
distance, time, speed and acceleration between data points was completed. A
detailed listing of calculations would go beyond the scope of this chapter, but to

Page 64
exemplify some more complex parameter calculations are presented in the
following.
Deviation of mouse movement from the shortest connection between beginning
and end of a movement (ideal line):
∆𝑑𝑖𝑠𝑡𝑎𝑛𝑐𝑒𝑛 = 𝑥2 − 𝑥1 𝑦1 − 𝑦0 − 𝑥1 − 𝑥0 𝑦2 − 𝑦1
𝑥2 − 𝑥1 2 + 𝑦2 − 𝑦1 2
Number of crossings of the actual mouse movement with the ideal line:
𝑐𝑟𝑜𝑠𝑠𝐼𝑑𝑒𝑎𝑙𝐿𝑖𝑛𝑒𝑛𝑢𝑚 = ∆𝑑𝑖𝑠𝑡𝑎𝑛𝑐𝑒𝑛 = 0
𝑛𝑢𝑚𝑏𝑒𝑟 𝑜𝑓 𝑚𝑜𝑣𝑒𝑚𝑒𝑛𝑡𝑠
Starting point (x1, y1)
End point (x2, y2) Mouse movement
Ideal line
Distance
Point on curve (x0, y0)
Time [ms] Dis
tan
ce f
rom
ide
al l
ine
[p
ixe
l]
100 200 400
40
20
Figure 4-3: Example movement and calculation of deviation from ideal line

Page 65
Calculation of complexity (number of changes in acceleration/deceleration),
expressiveness (average slope velocity of speed peaks) and emphasis (average
peak height):
𝑐𝑜𝑚𝑝𝑙𝑒𝑥𝑖𝑡𝑦𝑛𝑢𝑚 = 𝑎+ + 𝑎−
𝑛𝑢𝑚𝑏𝑒𝑟 𝑜𝑓 𝑚𝑜𝑣𝑒𝑚𝑒𝑛𝑡𝑠
𝑒𝑥𝑝𝑟𝑒𝑠𝑠𝑖𝑣𝑒𝑛𝑒𝑠𝑠𝑚𝑒𝑑𝑖𝑎𝑛 = 𝑚𝑒𝑑𝑖𝑎𝑛 𝑚𝑎𝑥 𝑣𝑛
𝑠𝑙𝑜𝑝𝑒 𝑑𝑢𝑟𝑎𝑡𝑖𝑜𝑛𝑛
𝑒𝑚𝑝ℎ𝑎𝑠𝑖𝑠 = max(𝑣𝑛)
𝑛𝑢𝑚𝑏𝑒𝑟 𝑜𝑓 𝑝𝑒𝑎𝑘𝑠
Starting point
End point Mouse movement
Ideal line Crossing point
Crossing point
Ve
loci
ty
Acc
ele
rati
on
(d
ott
ed
lin
e)
time
a+ a
+ a
- a
-
Velocity maxima
Peak duration
Peak duration
Figure 4-4: Example movement with two crossing points with the ideal line
Figure 4-5: Velocity and acceleration of an example movement

Page 66
4.3 Results
4.3.1 Participants
No differences in age, sex, education, computer use, weight, body size, and
personality traits (NEO-FFI) between groups on a significance level of 0.05.
4.3.2 Valence and arousal ratings
Before the neutral clip
There were no significant differences between groups found at the start of the
experiment. The results of two one-way ANOVAs were:
Valence: F (3,70) = .394; p = .76 > .05;
Arousal: F (3,70) = .909; p = .44 > .05;
After the neutral clip
The clip was rated by all groups as emotionally neutral. Means for valence
and arousal were, respectively, as follows: sport film group: 5.4, 3.7; nature film
group: 5.6, 3.7; torture film group: 5.2, 3.4; slum film group: 5.3, 3.7.
No significant differences were found between groups after the neutral clip,
but the variance within groups has decreased compared to before the neutral clip.
The results of two one-way ANOVAs were:
Valence: F (3,70) = .229; p = .87 > .05;
Arousal: F (3,70) = .159; p = .92 > .05;
After the emotional clip
Mean values of self-ratings after the emotional clip are as expected. The
analysis (ANOVA) showed that for valence ratings, the valence effect was highly
significant (F (3,70) = 19.35; p < .001), for arousal, the arousal effect was highly
significant (F (3,70) = 21.40; p < .001). Mean values are reported in Table 4-2.
Additionally, pre-planned contrasts for the two factors valence (two levels:
positive (+1), negative (-1)) and arousal (two levels: high (+1), low (-1)) was
carried out on the affective ratings after the emotional clips. The results showed
highly significant differences between the contrasts for valence (T (53.8) = 7.5; p
< .001) and arousal (T (70) = 7.66; p < .001).

Page 67
After the task, after emotional clip
To test the influence of the task on the induced mood and to control if mood
persisted until the end of the task, affective ratings after the last task were
analyzed.
Table 4-2: Mean values and standard deviations (in parentheses) of self-assessment ratings after the emotional clip and after the following task
Means after
emotional clip Means after task
Valence Arousal Valence Arousal
V↑A↑ 6.2 (1.2) 6.6 (1.4) 6.0 (1.3) 5.0 (1.3)
V↑A↓ 7.1 (1.1) 3.7 (1.5) 6.4 (1.0) 4.6 (1.3)
V↓A↑ 4.2 (2.0) 6.9 (1.5) 6.1 (1.2) 5.1 (1.2)
V↓A↓ 3.9 (1.1) 4.7 (1.4) 5.7 (0.9) 4.5 (1.6)
An ANOVA analysis with the pre-planned contrasts valence and arousal was
carried out. No significant differences were found between groups and levels
anymore after the task;
Valence: F (3,70) = 1.01; p = .39 > .05;
Valence contrast: T (70) = .99; p = .32 > .05;
Arousal: F (3,70) = 1.08; p = .36 > .05;
Arousal contrast: T (70) = 1.72; p = .09 > .05;
4.3.3 Mouse movement parameters
For the further analyses the four groups were rearranged into two contrasting
factors: valence (two levels: positive (+1), negative (-1)) and arousal (two levels:
high (+1), low (-1)). Furthermore, not the absolute parameter values were used
for the analysis, but the logarithmic differences between the task parameters after
the neutral film clip and task parameters after the emotional clip, to reduce
individual differences in movement characteristics and error variance.
Individual parameters
For the independent variables valence and arousal separately, t-tests were
run with each of the 25 individual movement parameters. The significance level
was adjusted to 0.05 / 25 = 0.002 to account for multiple tests. For valence, no
significant differences were found, for arousal, the parameters mov_total_msec
(T (55.5) = 3.53; p = .001) and accdec_anz (T (55.9) = 3.6; p = .001) showed
significant differences.

Page 68
Principal components
It can be assumed that several of the parameters are correlated and measure
a similar construct. To reduce from 25 individual parameters to fewer dimensions,
and to be able to run tests with a higher significance level than 0.002, data
reduction with a principal component analysis was conducted. The resulting
principal components that were used in the further analysis are as follows (labels
of the components by the author):
Component 1 – Movement speed
- Median velocity of movements (speed_median)
- Interquartile range of velocity of movements (speed_7525)
- Median acceleration of movements (accel_median)
- Interquartile range of acceleration of movements (accel_7525)
- Median expressivity of movements (expressivitaet_median)
- Interquartile range of expressivity of movements (expressivitaet_7525)
Component 2 – Spatial expansion
- Median distance of movements (mov_median_pixel)
- Average displacement from ideal movement (abstand_total_perMove)
- Interquartile range of movement distances (mov_7525_pixel)
- Interquartile range of displacement from ideal movement (abstand_7525)
Component 3 – Maximum expansion
- Maximum movement distance (mov_max_pixel)
- Maximum movement duration (mov_max_msec)
- Maximum displacement from ideal movement (abstand_max)
- Standard deviation of displacements from ideal movements (abstand_std)
- Average difference between ideal movement and actual movement
(realIdeal_diff)
Component 4 – General activation
- Clicks per minute (clicks_time)
- Number of movements (bewegungen_anz)
- Total distance travelled with mouse (mov_total_pixel)
- Total duration of mouse in movement (mov_total_msec)
- Number of velocity changes per movement (accdec_anz)
Component 5 – Maximum speed
- Maximum velocity in all movements (speed_max)
- Maximum acceleration in all movements (accel_max)
- Maximum deceleration in all movements (decel_max)
Component 6 – Response time

Page 69
- Median duration between a mouse click and the start of the movement
(clickMov_med)
- Median duration between the stop of a movement and the mouse click
(movClick_med)
With the six resulting components, a MANOVA with valence and arousal as
independent variables was run. There is a significant effect for arousal, no
significant effect for valence and the interaction.
Valence effect: F (6,65) = .46; p = .836 > .05;
Arousal effect: F (6,65) = 2.42; p = .036 < .05;
Valence x arousal: F (6,65) = 1.6; p = .161 < .05;
In the post hoc tests Component 4 (General activation) shows significant
differences between high and low arousal groups (F (1,70) = 11.75; p = .001 <
.05).
4.4 Method – Experiment 2
The second experiment was designed analogous to the first one. Its aim is to
replicate findings of the first experiment and reduce error variance compared to
the first experiment through the application of a repeated measures design. The
differences to the first experiment are stated in the following chapters.
4.4.1 Design
The experiment applied a repeated measures within-group design as opposed
to the between-group design of the first experiment.
The same four mood states PVHA, PVLA, NVHA, and NVLA (P=positive,
N=negative, H=high, L=low, V=valence, A=arousal) serve as independent
variables.
4.4.2 Subjects
Participants were 32 volunteers, all female. In the first study, the effect of
mood induction on the different sexes has been suspected to differ. Although
affective ratings showed no significant differences for sex, literature suggests that
motor expression and effects of mood induction might be different.
Most participants were undergraduate students. Entry criteria for the study
included good general health and German as mother tongue.

Page 70
4.4.3 Mood induction
The same five movie clips (1 neutral, 4 emotional) have been used (see
Chapter 4.2.3).
4.4.4 Questionnaires
The same Self-Assessment Manikin questionnaire was used as in the first
study (see Chapter 4.2.4). Personality was not assessed anymore because it
showed no correlation with affect ratings or motor expression.
4.4.5 Task
The same shopping task was used (see Chapter 4.2.5), but to avoid
sequence effects, more sub-tasks were created. The sub-tasks were presented
randomized on-screen.
4.4.6 Behavioural measurements
Behavioural measurements and data preparation techniques match the ones
in the first experiment (see Chapter 4.2.8).
4.4.7 Procedure
The procedure differed from the first experiment (see Chapter 4.2.7) in two
aspects. First, there were no physiological measurements anymore. The
preparations for the physiological measurement needed a lot of time and effort
and the measurement during the experiment took up a large amount of total
experiment duration. Because the subjects needed to view five film clips and
complete five tasks, the experiment would have been extended for too long.
Second, because of the repeated measures design, each participant was
presented with the neutral clip to start, and then was randomly presented with the
four emotional clips, questionnaires and tasks. The procedure was the same for
every clip: mood questionnaire – film clip – task – mood questionnaire.
4.5 Results
4.5.1 Participants
No differences in age, sex, education or computer use were found on a
significance level of 0.05.

Page 71
4.5.2 Valence and arousal ratings
Valence and arousal ratings were analyzed for the four emotional clips. The
data was tested with two repeated measures ANOVAs with the pre-planned
contrasts valence (two levels: positive (+1), negative (-1)) and arousal (two levels:
high (+1), low (-1)).
Mean values of self-ratings (see also Table 4-3) after the emotional clips are
as expected. The repeated measures ANOVA showed that for valence ratings,
the valence effect was highly significant, for arousal, the arousal effect was highly
significant
Valence ratings: F (2.48, 71.97) = 86.61; p < .001;
Arousal ratings: F (3,87) = 34.62; p < .001;
For the valence contrast, the valence rating were highly significant for the
different clips, the arousal ratings were not significant as expected. For the
arousal contrast, the arousal ratings were highly significant, the valence ratings
were not significant as expected:
Valence
Valence contrast: F (1,29) = 180.20; p < .001;
Arousal contrast: F (1,29) = 1.44; p = .24 > .05;
Arousal
Arousal contrast: F (1,29) = 108.00; p < .001;
Valence contrast. F (1,29) = 0.42; p = .52 > .05;
Table 4-3: Mean values and standard deviations (in parentheses) of self-assessment ratings after the emotional clips and the following tasks
VALENZ
HH HL LH LL
nach Film 6.2 (1.9) 7.1 (1.2) 2.9 (1.4) 2.5 (1.2)
nach Aufg. 5.7 (1.3) 5.9 (1.1) 4.5 (1.2) 4.5 (1.2)
AROUSAL
HH HL LH LL
nach Film 6.3 (1.6) 3.7 (1.8) 6.9 (1.6) 3.5 (1.4)
nach Aufg. 4.7 (1.4) 4.2 (1.2) 4.7 (1.8) 3.8 (1.2)
Page 72
4.5.3 Mouse movement parameters
For the analysis of mouse movement parameters, the principal components of
the first experiment were applied to the data of the second experiment. The fit of
the principal components with the data of the second experiment was tested and
confirmed: the correlations between variables within the individual components
were high and the component analysis verified that variables within the
components are stable.
Individual parameters
The data was tested with the independent variables valence and arousal with
repeated measures ANOVAs with the pre-planned contrasts valence (two levels:
positive (+1), negative (-1)) and arousal (two levels: high (+1), low (-1)). For the
repeated measures ANOVAs, the significance level was adjusted to 0.05 / 25 =
0.002, to account for multiple tests. For valence, no significant differences were
found, for arousal, the parameter clicks_time (F (1,29) = 20.56; p < .001) showed
significant differences.
Principal components
The data was tested with a repeated measures MANOVA with the pre-
planned contrasts valence and arousal. The dependent variables were the
components, repeated measures factors were the mood states.
The overall test showed no significant result (F (18,252) = .813; p = .68) and
also the pre-planned contrasts showed no significant effect.
The findings from the first experiment could not be confirmed. No other
significant results could be obtained.
4.6 Discussion
The aim of the study was to support the assumption that there are movement
parameters that show a correlation with the affective dimensions valence and
arousal. This implies that mood state is actually taking influence on how a
computer user is manipulating his mouse.
4.6.1 Mood induction with film clips
A precondition for the analysis of the experiment at hand is a working mood
induction. Although it is possible to use subjects in a natural mood state, and it is
disputed if artificially induced mood has the same effects as natural mood, it is
feasible to use a mood induction technique and to test its effectiveness. Only if

Page 73
the effect of the mood induction is strong enough, differences in movement
parameters can be expected. The mean values of the self-assessment and the
according tests confirm that the film clips had the intended effect.
Interesting although is the result of the mood values after the task: there were
no significant differences between the groups anymore. The induced mood wears
off. It is difficult to determine if the task had a moderating effect or if the task was
too long. In accordance to UX theory, the interaction itself should have an effect
on mood state, even if the task was explicitly chosen for its neutrality. In addition,
the cognitive load of the task (some of the subtasks were rather demanding
cognitively) could influence mood state towards neutral valence and arousal. The
task length averaged to 10 minutes and thus does not exceed the timeframe
mood induction has proved to be effective found in literature. To account for this
diminishing effect, the parameter log-files were cut to include the first 250
seconds of the task only.
In future studies, mood induction should be implemented differently. The one
time mood induction at the beginning of the task is not suitable for this test setup.
One possibility is to use music or scents that can continue their effect while the
user is interacting with the computer. Music has the disadvantage that rhythm
might lead to more repetitive, rhythmic movements and has thus been ruled out
for the present study. Scents and odours are not a standard method to induce
mood (yet), and could be promising. In line with UX theory, it would be obvious to
use the interaction itself to induce mood. An appropriate stimulus would have to
be found that induces a controlled mood state.
A stimulus from the product that the subjects interact with will face the
problem to account for individual differences in the reaction to affective stimuli. A
similar problem has the mood induction technique with films. Although the group
averages might show the desired effect, the individual might react with a quite
different affective reaction to a stimulus (a film). For other mood induction
techniques, the proportion of subjects that do not or not in the desired way react
affectively has been estimated. The Velten mood induction technique, for
example, does not induce the desired mood in 30-50% of all subjects.
4.6.2 Movement parameters
The analysis uncovered a significant correlation of arousal with some
movement parameters in the first experiment. This is in accordance with another
study of Maehr (2005). However, the parameters that make up the dimension
general activation (e.g. number of movements, clicks per minute, total distance
travelled with mouse) do not describe the quality of movements in the narrower
sense like speed, acceleration or movement length do. Thus, it is still not clear if

Page 74
arousal actually influences movement per se or if subjects just are more or less
activated (which is the definition of arousal: activation), which mirrors itself in the
dimension of general activation. This would be in line with the missing
correlations of valence with movement parameters.
Noticeable in the movement data were the great differences between
individuals. The movement patterns differed much more between individuals than
between the neutral and the emotional mood state within individuals. This had
been acknowledged by researchers concerned with the authentication of users
based on movement patterns (e.g. Ahmed & Traore, 2007). This research uses
similar aspects of movements as this study, but the aim is to differentiate
between individuals and to rule out variation from affective, physical or mental
state of the moment. In this study, this issue has been addressed by using the
neutral task as a baseline and subtracting the values of the neutral task from the
emotional values.
Nevertheless, the basic assumption that every individual reacts with the same
modulation of motor expression to affective stimuli (e.g. moves the mouse faster
with increasing arousal) might not be correct. Significant characteristics of
movements and their changes would have to be “uncovered” for every person
specifically. A solution for this dilemma is not the search for general and universal
patterns and movement characteristics, but the search and the development of
adaptive systems, as for example Schuller (2006) has proposed. The
development of adaptive systems is costly and needs a lot of technical expertise,
but the research for individual movement patterns could be done in qualitative
studies with only a few subjects. It would be interesting to see if there are
individual patterns that are influenced by affective state.
Moods, as compared to emotions, are rather subtle affective states that often
are subconscious (see Chapter 3.2.1). It is not clear if the effect mood has on
motor expression is strong enough to be detected by such a measurement
method as the present. Considering the great differences between individuals
that were noted in this study, it is questionable if the sensitivity of the method is
sufficient. Furthermore, the use of a computer mouse and the constricted space
of movements it allows, the sitting position or the translation of motor expression
from the hand to the mouse and to the computer screen, suggest that a lot of
information about changing motor expression that would be present cannot be
detected. It is possible and could be object of investigation in further research,
that a direct observation of motor expression (e.g. with EMG sensors) would yield
better and clearer results and could provide hints for possible parameters.

Page 75
4.6.3 Parameter selection and analysis
The selection and calculation of the movement parameters posed a problem
in this study. There are only a few relevant studies that deal with the selection of
movement parameters, especially such studies concerned with parameters in the
context of micro motor movements of the hand. There is a lot of research in
clinical psychology on depression and movement of the body, but they are not
applicable to the current context. The actual choice of parameters made for this
study is somewhat arbitrary, although a lot of effort went into a wide selection,
categorization and calculation of parameters. The assignment of parameters to
higher-level categories, which were the basis for the actual selection process, is
definitely not unambiguous.
The pre-processing of parameters with segmentation, smoothing and
interpolation is problematic. Especially segmentation would have required
concrete guidelines and thresholds. This has been acknowledged by Schuller
(2006) and Maehr (2005) already, but they did not publish their respective values
for thresholds. Apparently, there is an uncertainty concerning the calculation of
parameters that leads to different definitions and applications among researchers.
For the present study, thresholds had to be acquired by a visual analysis of
movement data.
The analysis of the study based entirely on classical statistical test
methodology that was developed for linear concepts and correlations.
Alternatively, newer analysis methods could detect different interrelations
between independent and dependent variables. For example, artificial neural
networks have been used to approximate arbitrary functions, where the type of
relation does not have to be known. Neural networks can model correlations that
are non-linear and complex. Schuller (2006) has used a combination of newer
analysis methods and had more success in detecting connections of affect and
motor behaviour (but his study has some other downsides that make application
problematic).
4.6.4 Conclusions
Although a final confirmation of a correlation between mood state and mouse
movement parameters could not be brought forward, some evidence could be
collected that some form of interrelation exists. The significant results for arousal
in the first experiment can motivate additional research. The study had several
methodological difficulties that should be addressed in future research.

Page 76
5 Study 2: Perceived hedonic quality Hedonic product qualities have been identified as important
aspects and predictors of overall product quality and appeal.
However, existing methods and instruments for the evaluation of
hedonic qualities are rather simple and rudimentary, assessing
product qualities with direct, verbal enquiries. This chapter describes
a new method and the development of an associated measurement
tool that addresses the shortcomings of existing methods. The tool
has a modular, flexible, web-based layout, incorporates verbal and
visual assessments and outputs, and applies a projective, playful
approach. The tool accounts for the complexity of hedonic qualities
in the assessment and the results. Method and measurement tool
are still in development.
5.1 Introduction
Measuring hedonic qualities of products was identified as a central aspect of
UX (see Chapter 3.3). It has been brought forward that hedonic quality is an
important predictor for the evaluation of overall product appeal (Tractinsky, Katz,
& Ikar, 2000; Zhang & Li, 2004; Hassenzahl, 2007). Especially within the first
impression of a product, the sensory encounter, perceived hedonic aspects are
important. Currently, only a few methods exist to measure these aspects and
these are frequently rudimentary and overly simple. The aims of the present
study are to address shortcomings of current methods, propose a new, improved
measurement method and to put it into a comprehensive tool for practical use.
Sensory encounters last only for a short time. The perception of sensory
qualities (i.e. visual aesthetics, tactile and auditory qualities) plays a predominant
role. Cognitive and affective processing is limited to automatic judgements (e.g.
good or bad) and stays subconscious. Processes on this level are biologically
determined and relate to instinctive attraction to form, colour and the resulting
bodily reactions (cf. Norman’s (2004) visceral level of information processing).
A measurement method therefore needs to find a way to access this
subconscious information without making it explicit. A possibility is to apply a
projective method, where the perceived qualities can be projected onto a neutral
agent. Projective techniques aim at measuring unconscious psychological states
and attitudes. They are based on the assumption that they bypass conscious
individual reflections of people’s cognitive and affective processes. Classic
projective methods are for example the Rorschach inkblot test (after Hermann
Rorschach (1884-1922) or the Thematic Apperception Test (TAT), where a

Page 77
picture - often of people with their emotional expressions ambiguous or hidden -
is presented to a subject and is asked to describe the situation. A projective
method uses a medium (e.g. drawings or essays) onto which people project
aspects of their personality or their emotions during the measurement. Individual
responses are then analysed in order to derive for example personality
characteristics or emotions.
The method presented here uses virtual characters, called manikins, onto
which the product character can be projected by the subject. The manikins are
constructed by the subjects from a library of heads, torsos, legs, and shoes. The
subsequent assessments in the course of the test refer to the manikin and not to
the product directly anymore.
In sensory encounters, visual aesthetics play an important role (although not
exclusive). Nevertheless, the most prominent method to assess hedonic quality,
Hassenzahl’s “AttrakDiff” (Hassenzahl, Burmester, & Koller, 2003), uses a purely
verbal approach. Other techniques, such as creating mood boards, use a purely
visual approach. Both approaches are able to capture certain qualities, others
not. It would seem favourable to include some visual information side by side with
verbal information to capture the whole product character. The present method
uses different sub-tests or test-modules, which are displayed consecutively to the
subject and apply a variety of different assessment forms: questionnaires, visual
constructions, verbal differentials, multiple choice, slider indicators, or open
question formats. Accordingly, the result is not a simple number, but a
multifactorial construct that reproduces the complex product character on
different dimensions. The results provide quantitative data as well as qualitative
information about the product.
Although the tool makes various information about the product available, it
does not necessarily have to be related to distinct product features. Some
researchers have proposed the relation of product qualities to distinct product
features a central aspect of their methods (e.g. Hassenzahl, 2003; Mahlke, 2008).
While it is a possible long-term goal to provide information to designers, as of
which features relate to which perceived qualities, it is difficult enough to capture
the product character in its completeness for the moment. Nevertheless, the
results can still provide valuable inspiration for designers, particularly through the
visual results (e.g. the manikins).
The method proposed here tries to consider all the mentioned aspects. It has
been implemented into a dynamic, modular, web-based tool for the evaluation of
products. In the following, the different modules of the tool are presented.
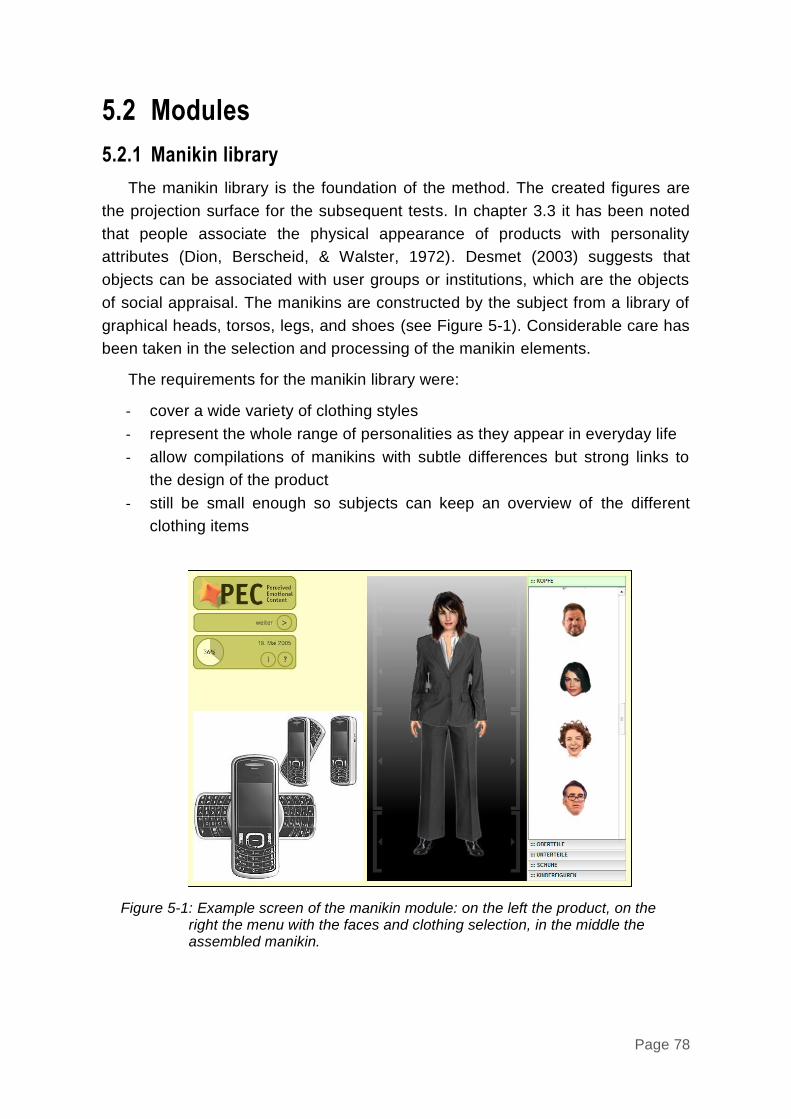
Page 78
5.2 Modules
5.2.1 Manikin library
The manikin library is the foundation of the method. The created figures are
the projection surface for the subsequent tests. In chapter 3.3 it has been noted
that people associate the physical appearance of products with personality
attributes (Dion, Berscheid, & Walster, 1972). Desmet (2003) suggests that
objects can be associated with user groups or institutions, which are the objects
of social appraisal. The manikins are constructed by the subject from a library of
graphical heads, torsos, legs, and shoes (see Figure 5-1). Considerable care has
been taken in the selection and processing of the manikin elements.
The requirements for the manikin library were:
- cover a wide variety of clothing styles
- represent the whole range of personalities as they appear in everyday life
- allow compilations of manikins with subtle differences but strong links to
the design of the product
- still be small enough so subjects can keep an overview of the different
clothing items
Figure 5-1: Example screen of the manikin module: on the left the product, on the right the menu with the faces and clothing selection, in the middle the assembled manikin.

Page 79
Starting point for the selection of clothing types was the Outfit-5 study
(Spiegel Verlag, 2002). The representative study includes the responses of
10’000 Germans answering questions concerning clothing, fashion and brands
and their attitudes towards clothing, shoes and accessories. The study classifies
men and women separately into seven clothing style types each, e.g. the
conformist, the fashionable, the intellectual, etc. Each type is described by its
attitudes and preferences towards clothing style, fashion, shopping behaviour, or
body image and is depicted with a prototypical image of a person wearing the
according clothing.
These 14 clothing types build the core of the manikin library. We added more
clothing and faces to account for regional differences, changing fashion
preferences and necessary additions in the context of product emotions (e.g.
“ugly faces” to account for negative affective reactions). During the PEC-Test
subjects compile one manikin out of the heads and clothing selections presented,
representing the ideal user or the preferred buyer of the product. The images of
Figure 5-2: Example output of the manikin module

Page 80
heads, clothing and shoes are shown fully randomised in order to avoid a
sequencing bias.
The manikins not only serve as a projection for the following test modules, but
are also part of the (visual) results of the evaluation (see Figure 5-2). The
manikins give a first overview of fundamental aspects of product quality,
transferred to style, colour or personality of the figures. Their visual impact can
serve as an inspiration to designers. The manikins can give an unsorted,
subjective impression of the product quality or they can be categorized either by
visual aspects of the figures themselves or by characteristics of the subjects (i.e.
demographic information) and their statements (i.e. mapping of manikins to
answer categories).
5.2.2 Semantic differential
Charles Osgood originally introduced semantic differentials as measurement
instruments in 1950-ies to measure people's reactions to stimulus words and
concepts. They are applied either as ratings on bipolar scales defined with
contrasting adjectives at each end like “good-bad”, “soft-hard” or “valuable-
worthless” or as “likert” single scales, psychometric response scales where
respondents specify their level of agreement to a statement or term (Likert, 1932).
Table 5-1: The adjective pairs used in the semantic differential. The two pairs in each box belong to the same semantic category and have an equivalent emotional meaning (adapted from Küthe, Thun & Schriefers, 1995).
German English
Sachlich – Romantisch Rational – Sensitiv
Factual – Romantic Rational – Sensitive
Konventionell – Originell Seriös – Ungewöhnlich
Conventional – Fancy Serious – Unorthodox
Klassisch – Modisch Zurückhaltend – Aufdringlich
Conservative – Trendy Demure – Pushy
Traditionell – Avantgardistisch Alt – Jung
Traditional – Avant-garde Old – Young
Herb – Süss Hart – Weich
Bitter – Sweet Hard – Soft
Natürlich – Künstlich Verspielt – Streng
Natural – Artificial Playful – Strict
Sparsam – Verschwenderisch Billig – Nobel
Frugal – Lavish Cheap - Classy
Sympathisch - Unsympathisch Likeable – Not likeable

Page 81
Mehrabian and Russell (1974) adapted the method to construct a set of 18
bipolar adjective pairs that generate scores on the affective valence, arousal and
dominance scales. There have been many adaptations of this method using
diverse sets of terms. We used a selection of adjective pairs from “Marketing mit
Bildern” [marketing with images] (Küthe, Thun, & Schriefers, 1995), measuring
seven characteristics of products with two adjective pairs each (see Table 5-1).
This test module is related to the technique used in the “AttrakDiff”
questionnaire (Hassenzahl, Burmester, & Koller, 2003), that assesses pragmatic
quality, hedonic qualities (identification, stimulation) and overall attractiveness.
The semantic differential used here addresses classic and expressive aesthetic
qualities, the hedonic quality stimulation and overall attractiveness. In respect to
content, the different dimensions resemble the dimensions “classical aesthetics”
and “expressive aesthetics”, which Lavie and Tractinsky (2004) found in a study
on website layout. The classical dimension concerns aesthetic notions that
emphasize orderly and clear design and are closely related to many of the design
rules advocated by usability experts. The expressive aesthetics dimension
manifests itself by the designers' creativity and originality and by the ability to
break design conventions.
Figure 5-3: Screenshot of the semantic differential module.
In course of the test, subjects indicate agreement or disagreement with the
adjectives on a 7 point scale (see Figure 5-3). The results include mean and
median values of bipolar word pair ratings and higher-level dimensions, as well

Page 82
as graphical profiles of the word pairs, which also allow comparisons between
products (see Figure 5-4).
5.2.3 Self-Assessment Manikin
The Self-Assessment-Manikin (SAM), devised by Bradley and Lang (1994), is
used to assess the affective dimensions valence and arousal directly by means of
two sets of graphical manikins (see also Chapter 2.3.2). An Assessment of
affective qualities of products has been made by several authors. For ecample
Zhang and Li (2004) have made the construct perceived affective quality
operational on the two dimensions aroused-sleepy and pleasant-unpleasant.
Desmet (2002) has used a more differentiated approach by assessing seven
negative product emotions (disgust, indignation, contempt, unpleasant surprise,
dissatisfaction, disappointment, boredom) and seven positive emotions (inspired,
desire, pleasant surprise, amusement, admiration, satisfaction, fascination).
Figure 5-4: Profile of a product rated with the semantic differential (words in German). Mean values (large green dots, number below dot), median values (black crosses), confidence intervals (red lines, second number in parenthesis), standard deviations (grey lines, first number in parenthesis) of the population ratings.
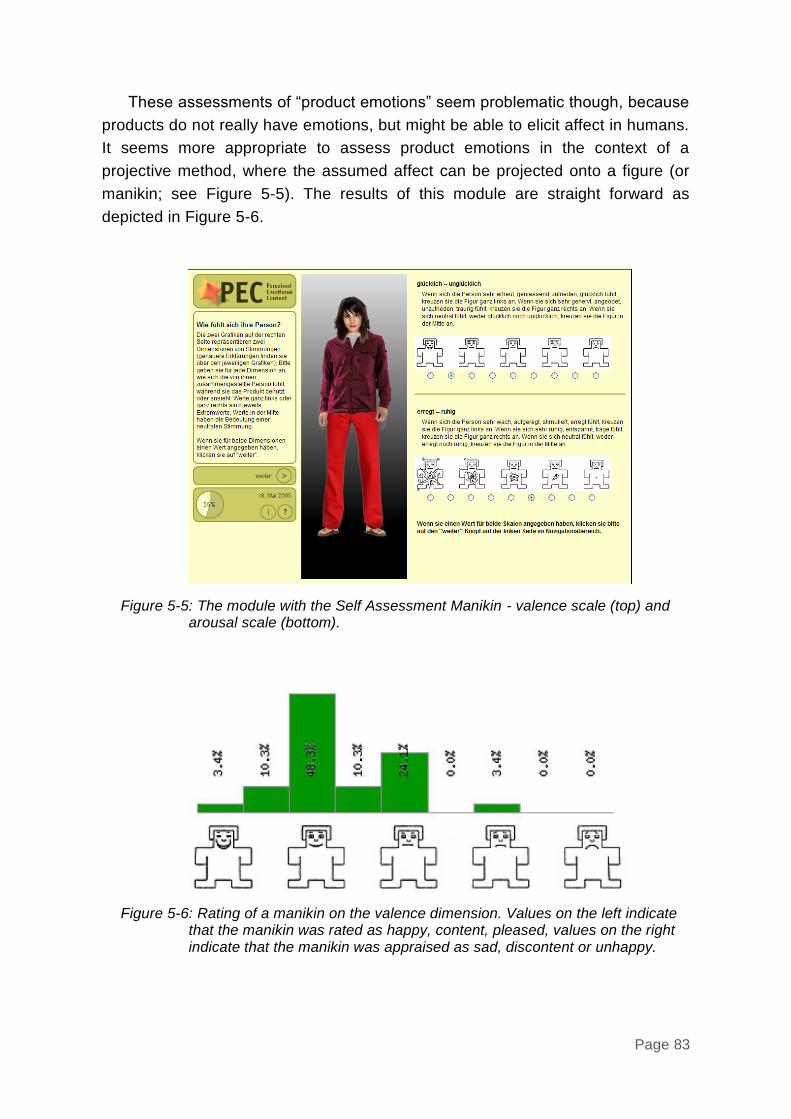
Page 83
These assessments of “product emotions” seem problematic though, because
products do not really have emotions, but might be able to elicit affect in humans.
It seems more appropriate to assess product emotions in the context of a
projective method, where the assumed affect can be projected onto a figure (or
manikin; see Figure 5-5). The results of this module are straight forward as
depicted in Figure 5-6.
Figure 5-5: The module with the Self Assessment Manikin - valence scale (top) and arousal scale (bottom).
Figure 5-6: Rating of a manikin on the valence dimension. Values on the left indicate that the manikin was rated as happy, content, pleased, values on the right indicate that the manikin was appraised as sad, discontent or unhappy.
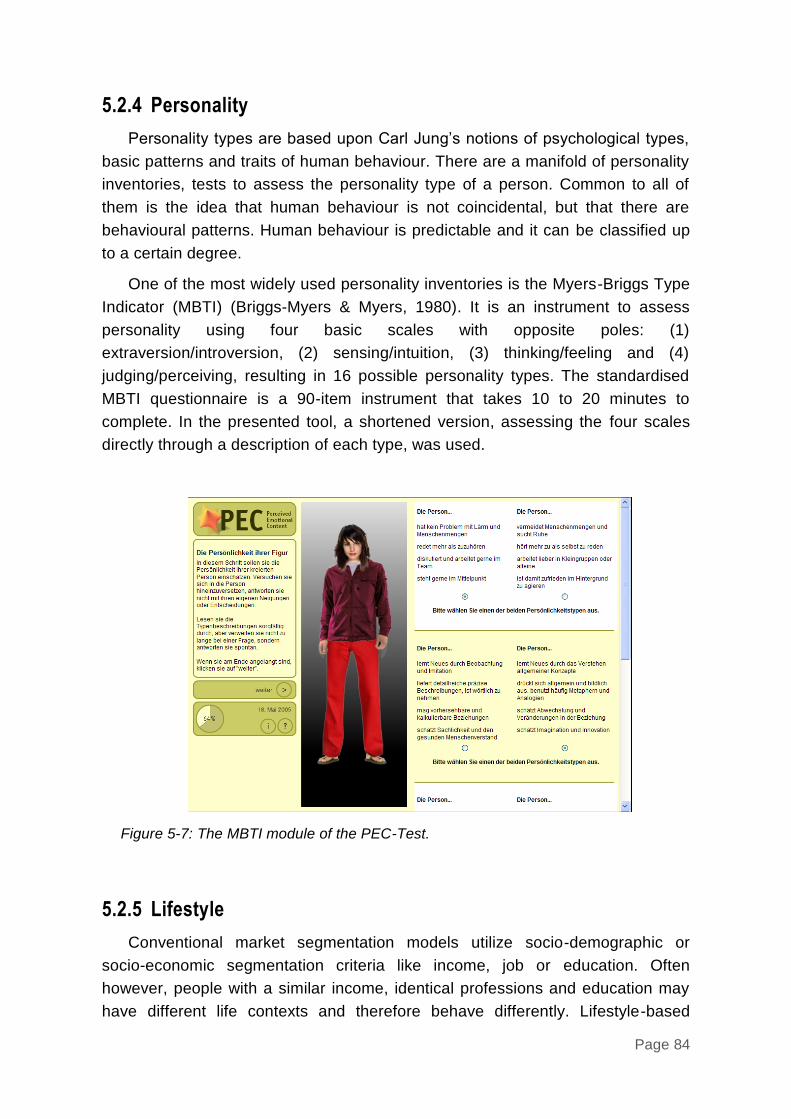
Page 84
5.2.4 Personality
Personality types are based upon Carl Jung’s notions of psychological types,
basic patterns and traits of human behaviour. There are a manifold of personality
inventories, tests to assess the personality type of a person. Common to all of
them is the idea that human behaviour is not coincidental, but that there are
behavioural patterns. Human behaviour is predictable and it can be classified up
to a certain degree.
One of the most widely used personality inventories is the Myers-Briggs Type
Indicator (MBTI) (Briggs-Myers & Myers, 1980). It is an instrument to assess
personality using four basic scales with opposite poles: (1)
extraversion/introversion, (2) sensing/intuition, (3) thinking/feeling and (4)
judging/perceiving, resulting in 16 possible personality types. The standardised
MBTI questionnaire is a 90-item instrument that takes 10 to 20 minutes to
complete. In the presented tool, a shortened version, assessing the four scales
directly through a description of each type, was used.
Figure 5-7: The MBTI module of the PEC-Test.
5.2.5 Lifestyle
Conventional market segmentation models utilize socio-demographic or
socio-economic segmentation criteria like income, job or education. Often
however, people with a similar income, identical professions and education may
have different life contexts and therefore behave differently. Lifestyle-based
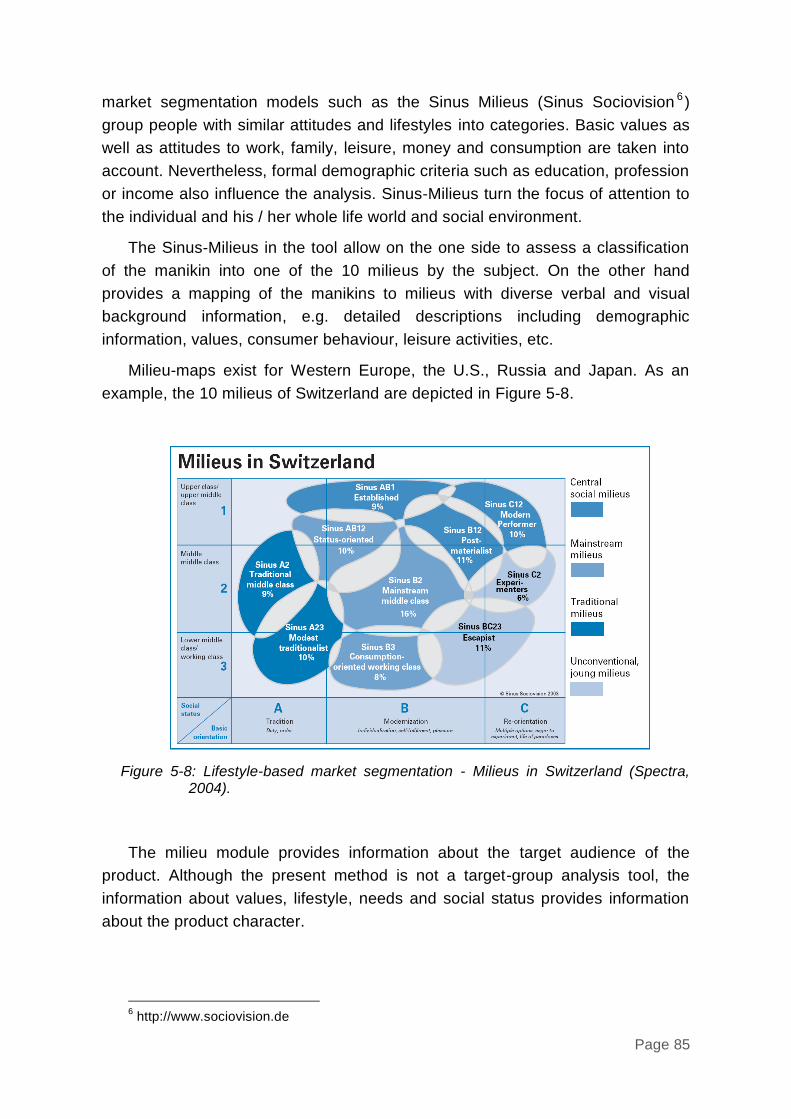
Page 85
market segmentation models such as the Sinus Milieus (Sinus Sociovision 6 )
group people with similar attitudes and lifestyles into categories. Basic values as
well as attitudes to work, family, leisure, money and consumption are taken into
account. Nevertheless, formal demographic criteria such as education, profession
or income also influence the analysis. Sinus-Milieus turn the focus of attention to
the individual and his / her whole life world and social environment.
The Sinus-Milieus in the tool allow on the one side to assess a classification
of the manikin into one of the 10 milieus by the subject. On the other hand
provides a mapping of the manikins to milieus with diverse verbal and visual
background information, e.g. detailed descriptions including demographic
information, values, consumer behaviour, leisure activities, etc.
Milieu-maps exist for Western Europe, the U.S., Russia and Japan. As an
example, the 10 milieus of Switzerland are depicted in Figure 5-8.
Figure 5-8: Lifestyle-based market segmentation - Milieus in Switzerland (Spectra, 2004).
The milieu module provides information about the target audience of the
product. Although the present method is not a target-group analysis tool, the
information about values, lifestyle, needs and social status provides information
about the product character.
6 http://www.sociovision.de
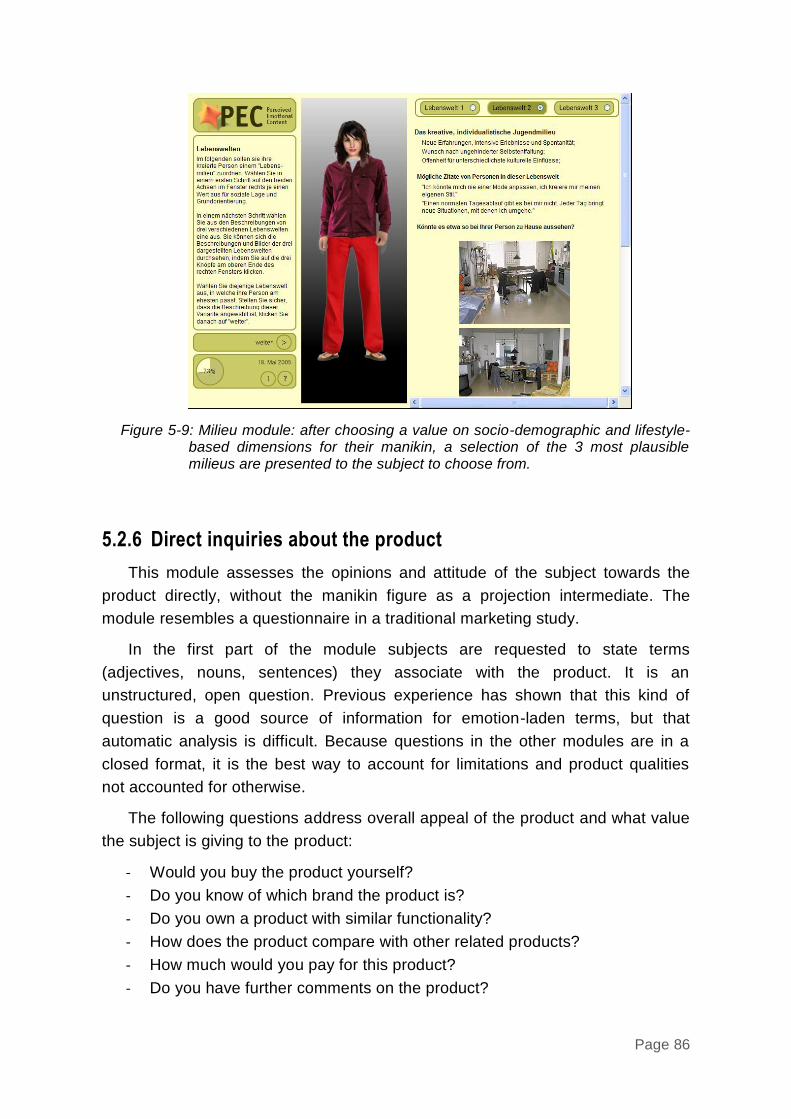
Page 86
Figure 5-9: Milieu module: after choosing a value on socio-demographic and lifestyle-based dimensions for their manikin, a selection of the 3 most plausible milieus are presented to the subject to choose from.
5.2.6 Direct inquiries about the product
This module assesses the opinions and attitude of the subject towards the
product directly, without the manikin figure as a projection intermediate. The
module resembles a questionnaire in a traditional marketing study.
In the first part of the module subjects are requested to state terms
(adjectives, nouns, sentences) they associate with the product. It is an
unstructured, open question. Previous experience has shown that this kind of
question is a good source of information for emotion-laden terms, but that
automatic analysis is difficult. Because questions in the other modules are in a
closed format, it is the best way to account for limitations and product qualities
not accounted for otherwise.
The following questions address overall appeal of the product and what value
the subject is giving to the product:
- Would you buy the product yourself?
- Do you know of which brand the product is?
- Do you own a product with similar functionality?
- How does the product compare with other related products?
- How much would you pay for this product?
- Do you have further comments on the product?

Page 87
Figure 5-10: The product module, assessing attitude towards the product without an intermediate manikin.
5.2.7 Demographics
Figure 5-11: Demographics data module.
The module assesses common demographic data of the subjects. The
demographic information is used to analyse results in a more detailed manner in
respect to differing demographics (e.g. sec, age, place of living, etc.).

Page 88
The module contains questions about: age, sex, marital status, children, place
of living (city, conurbation, village), way of living (family/couple/single household,
flat share, other), type of ownership (own a flat/house, rent a flat/house),
education, job, income and computer usage.
5.2.8 Analysis module
The analysis module aims at an automatic processing of the results, but is still
in development. Simple statistics and a variety of graphical representations of the
data from the different modules are provided. As of now, the modules are
analysed separately for each test series. The idea is to build up a database with
the results of all studies conducted with the tool to provide a basis for product
comparison.
Figure 5-12: Example result output of the analysis module (manikins).

Page 89
Figure 5-13: Example result output of the analysis module (personality).
5.3 Discussion
The overall attractiveness is an important factor in product evaluations. Until
recently, evaluation methods were confined to instrumental (pragmatic) aspects,
as in traditional usability evaluation. It is common sense that pragmatic aspects
alone do not determine the attractiveness of a product; hence, instruments for the
evaluation of hedonic qualities of products are needed. Marketing and consumer
oriented psychology have developed questionnaires and other methods (e.g.
structured interviews, focus groups) for the assessment of hedonic qualities for
quite a while, but these approaches have only a limited capability to assess
modern interactive technology.
The UX model presented in chapter 3 shows the interplay of pragmatic and
hedonic qualities and the resulting perceived product character. To evaluate
products and their effects on the user/owner/customer requires a
Page 90
multidimensional instrument, flexible enough to adapt to the differing
requirements of product category, situation, and subjects. The presented tool for
product evaluation has a modular composition and is therefore completely
flexible. Test modules can be added on request and tests can be setup in any
combination required. The web-based layout enables remote testing, e.g. with
product images.
The underlying model of UX shows an approach to decompose user
experiences into measurable elements. However, these elements might not be
the conclusion to what shapes UX, as further research could prove. First
preliminary tests with the tool have shown that it provides valuable results, but
reliability of the tool and validity of the method need further exploration.
Page 91
6 Conclusions User experience research is a still young discipline that incorporates
researchers from diverse fields with their differing views. It comes as no surprise
that UX theory and definitions are inconclusive. The research and practice in UX
are maturing since it has popularized the HCI community. But are there well-
defined policies where to position UX in a map of information technology
evaluation? Is there enough common ground and any sound plans how to refine
methodologies on designing and evaluating UX? There have been different
advances in search of a common “UX manifesto” (Law, Roto, Vermeeren, Kort, &
Hassenzahl, 2008), but as the theoretical part on research frameworks and
measurement methods in this thesis illustrates, they are still far from reaching
common ground.
So what is UX? UX is about technology that fulfils more than just instrumental
needs, in a way that acknowledges its use as a subjective, situated, complex and
dynamic encounter. UX is a consequence of a user’s internal state
(predispositions, expectations, needs, motivation, mood, etc.), the characteristics
of the designed system (e.g. complexity, purpose, usability, functionality, etc.)
and the context (or the environment) within which the interaction occurs (e.g.
organisational/social setting, meaningfulness of the activity, voluntariness of use,
etc.).
What are the challenges for future research? Above all, non-instrumental
needs must be better understood, defined and made operational. Although not an
immediate aim, it would be interesting to know which product attributes are linked
to which needs. Based on a better understanding, their interplay and importance
can be studied. An intriguing question is how the overall quality, or the
“goodness” of a product is formed, given pragmatic and hedonic aspects and
underlying needs (Hassenzahl, 2004a). Are instrumental and non-instrumental
quality perceptions related to each other, as for example demonstrated for beauty
and usability by Tractinsky et al. (2000)? What is the role and importance of
usability measures within the field of UX? Can we create dynamic quality models,
which are able to describe an adequate weighting of quality aspects for a given
product in a given context? What is the impact of non-instrumental qualities when
explicitly designed in terms of acceptance, valuation and choice?
However, not just in relation to non-instrumental and hedonic aspects remain
a lot of questions. The role of affect in human-product interaction is unclear. Is
affect an antecedent, a consequence or a mediator of product perception and
use? It is for example debatable if technology should actually be a vehicle for

Page 92
affect maintenance and regulation. Is it possible to design emotions or are they
too fleeting? If emotions are the consequence of personal and situational
aspects, how can designers have the control needed to evoke specific emotions?
How is it possible to cope with the seeming complexity of experience?
In their effort to strive for a UX manifesto, Law et al. (2007) see the future of
UX research lie on three pillars:
Principle
- Work on a unified view of UX
- Develop a generic UX model comprising the structure and process of UX
- Identify boundaries of UX
Policy
- Identify the relationship between UX and related fields
- Understand the role of UX in the means-end chains between product
attributes, usage consequences and product values
- Develop standards for UX
- Identify teaching strategies
Plan
- Develop theoretically sound methodologies for analyzing, designing,
engineering and evaluating UX
- Understand UX in practice through case studies
The theoretical considerations and the presentation of new measurement
methods in this thesis aim at contributing to these three pillars.
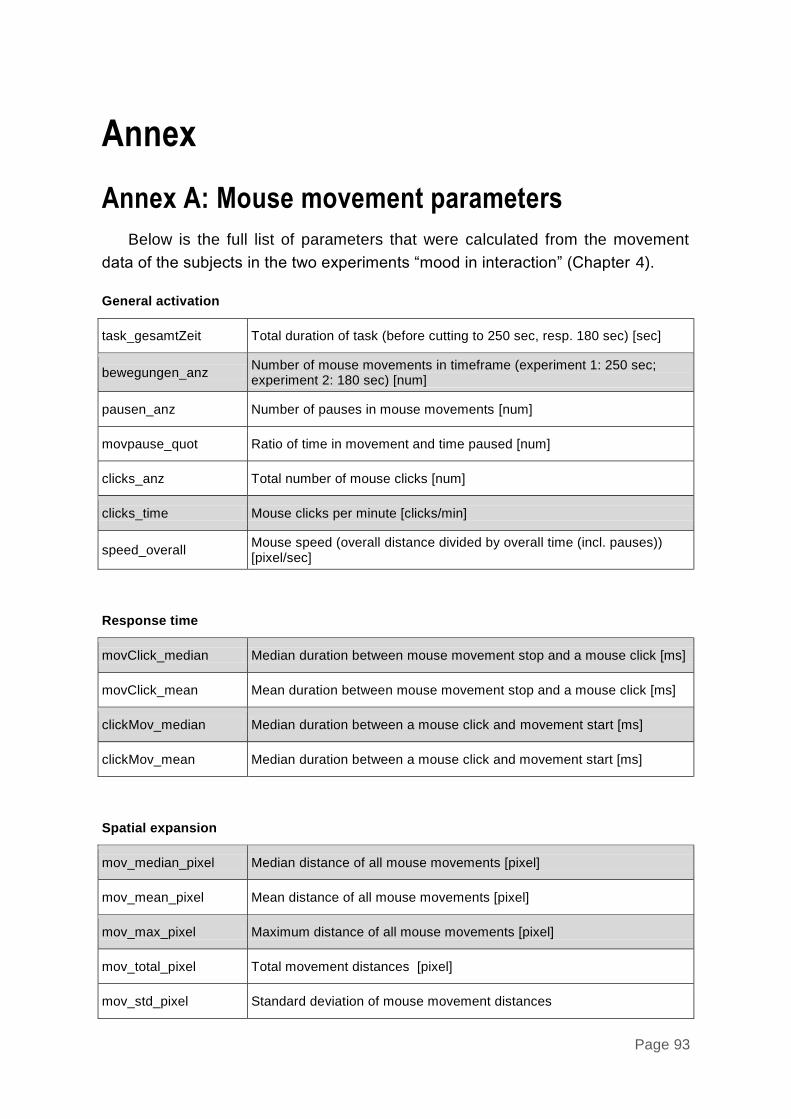
Page 93
Annex
Annex A: Mouse movement parameters
Below is the full list of parameters that were calculated from the movement
data of the subjects in the two experiments “mood in interaction” (Chapter 4).
General activation
task_gesamtZeit Total duration of task (before cutting to 250 sec, resp. 180 sec) [sec]
bewegungen_anz Number of mouse movements in timeframe (experiment 1: 250 sec; experiment 2: 180 sec) [num]
pausen_anz Number of pauses in mouse movements [num]
movpause_quot Ratio of time in movement and time paused [num]
clicks_anz Total number of mouse clicks [num]
clicks_time Mouse clicks per minute [clicks/min]
speed_overall Mouse speed (overall distance divided by overall time (incl. pauses)) [pixel/sec]
Response time
movClick_median Median duration between mouse movement stop and a mouse click [ms]
movClick_mean Mean duration between mouse movement stop and a mouse click [ms]
clickMov_median Median duration between a mouse click and movement start [ms]
clickMov_mean Median duration between a mouse click and movement start [ms]
Spatial expansion
mov_median_pixel Median distance of all mouse movements [pixel]
mov_mean_pixel Mean distance of all mouse movements [pixel]
mov_max_pixel Maximum distance of all mouse movements [pixel]
mov_total_pixel Total movement distances [pixel]
mov_std_pixel Standard deviation of mouse movement distances
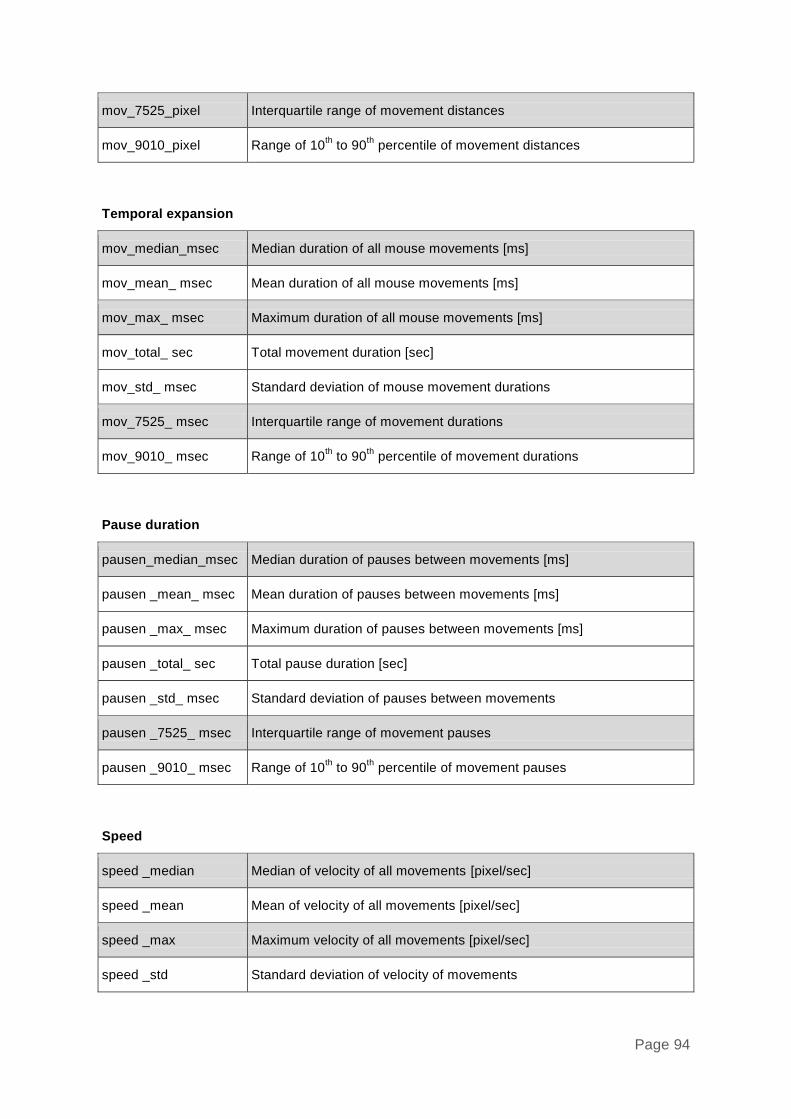
Page 94
mov_7525_pixel Interquartile range of movement distances
mov_9010_pixel Range of 10th to 90
th percentile of movement distances
Temporal expansion
mov_median_msec Median duration of all mouse movements [ms]
mov_mean_ msec Mean duration of all mouse movements [ms]
mov_max_ msec Maximum duration of all mouse movements [ms]
mov_total_ sec Total movement duration [sec]
mov_std_ msec Standard deviation of mouse movement durations
mov_7525_ msec Interquartile range of movement durations
mov_9010_ msec Range of 10th to 90
th percentile of movement durations
Pause duration
pausen_median_msec Median duration of pauses between movements [ms]
pausen _mean_ msec Mean duration of pauses between movements [ms]
pausen _max_ msec Maximum duration of pauses between movements [ms]
pausen _total_ sec Total pause duration [sec]
pausen _std_ msec Standard deviation of pauses between movements
pausen _7525_ msec Interquartile range of movement pauses
pausen _9010_ msec Range of 10th to 90
th percentile of movement pauses
Speed
speed _median Median of velocity of all movements [pixel/sec]
speed _mean Mean of velocity of all movements [pixel/sec]
speed _max Maximum velocity of all movements [pixel/sec]
speed _std Standard deviation of velocity of movements

Page 95
speed _7525 Interquartile range of velocity of movements
speed _9010 Range of 10th to 90
th percentile of velocity of movements
speed _avg_total Average velocity (total distance of all movements divided by total time of all movements) [pixel/sec]
Efficiency/Targeting
abstand_total Total displacement of movement from ideal movement (= straight line from starting to end point of single movement) [pixel]
abstand_total_perMove Displacement from ideal movement per movement [pixel/move]
abstand_ perTime Displacement from ideal movement per movement time segment [pixel/sec]
abstand_max Maximum displacement from ideal movement [pixel]
abstand_std Standard deviation of displacements from ideal movements
abstand_7525 Interquartile range of displacements from ideal movements
abstand_9010 Range of 10th to 90
th percentile of displacements from ideal movements
Variability
realIdeal_diff Average difference per movement between actually travelled distance and length of ideal movement [pixel/move]
crossIdealLine_anz Number of intersects of actual mouse movement with the straight connection between starting and end point (ideal line) [num]
Fluency/course
accel_median Median acceleration [pixel/sec2]
accel_mean Mean acceleration [pixel/sec2]
accel_max Maximum acceleration [pixel/sec2]
accel_std Standard deviation of acceleration
accel_7525 Interquartile range of acceleration
accel_9010 Range of 10th to 90
th percentile of acceleration
decel_max Maximum deceleration [pixel/sec2]
speed _std Standard deviation of velocity of movements

Page 96
Complexity
accel_anz Number of segments with accelerated movement or number of velocity maxima per movement [num/move]
decel_anz Number of segments with decelerated movement or number of velocity minima per movement [num/move]
accdec_anz Number of changes in velocity per movement [num/move]
Energy
accel_time_avg Average duration of acceleration segments [ms]
acceldecel_quot Ratio of acceleration duration and deceleration duration
Expressivity
expressivitaet_median Median of mean velocity increase per velocity peak (velocity maxima / duration; a measure for the speed of movement displacement)
expressivitaet_mean Mean of mean velocity increase per velocity peak
expressivitaet_std Standard deviation of mean velocity increase per velocity peak
expressivitaet_7525 Interquartile range of mean velocity increase per velocity peak
expressivitaet_9010 Range of 10
th to 90
th percentile of mean velocity increase per velocity
peak
Emphasis
emphasis Average height of velocity peaks (sum of peak velocity / number of peaks; closely related to expressivity)
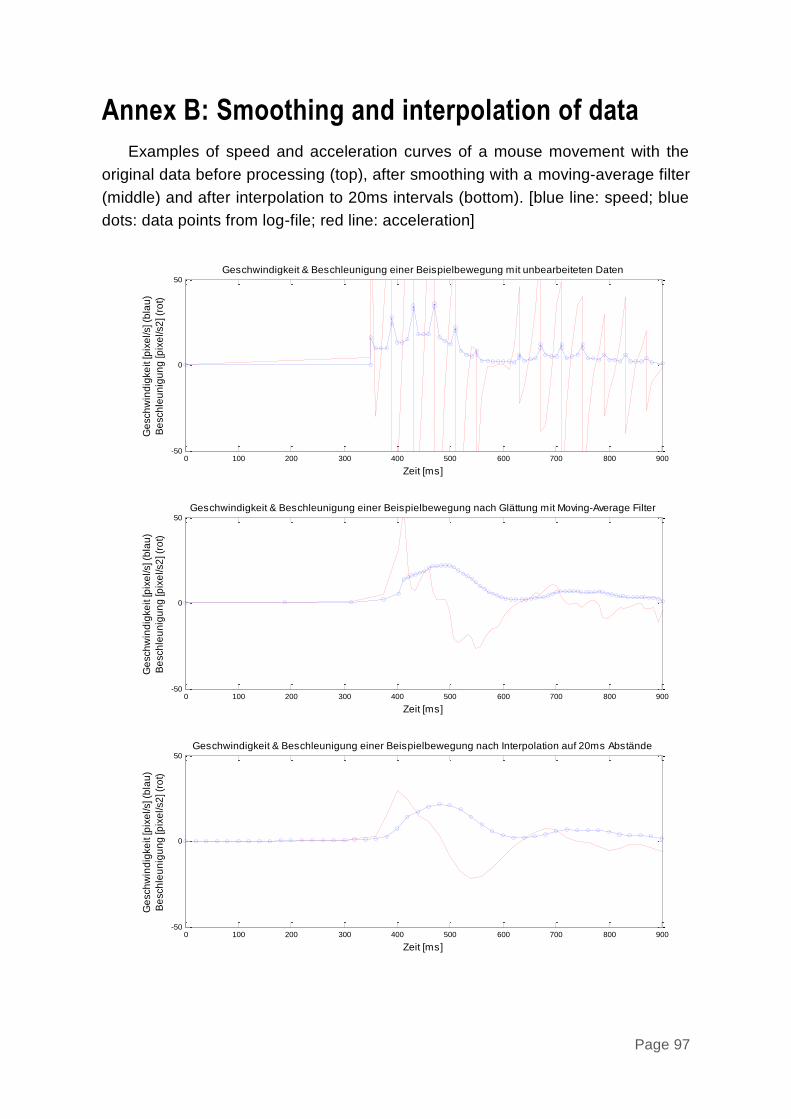
Page 97
Annex B: Smoothing and interpolation of data
Examples of speed and acceleration curves of a mouse movement with the
original data before processing (top), after smoothing with a moving-average filter
(middle) and after interpolation to 20ms intervals (bottom). [blue line: speed; blue
dots: data points from log-file; red line: acceleration]
0 50 100 150 200 250 300 350 400 450 500
0
200
400
600
800
1000
Bildschirmhorizontale (verkürzt) [pixel]
Bild
sch
irm
ve
rtik
ale
[p
ixe
l]
Beispielbewegung mit Messpunkten
0 100 200 300 400 500 600 700 800 900-50
0
50
Zeit [ms]
Ge
sch
win
dig
ke
it [p
ixe
l/s] (b
lau
)
Be
sch
leu
nig
un
g [p
ixe
l/s2
] (r
ot)
Geschwindigkeit & Beschleunigung einer Beispielbewegung mit unbearbeiteten Daten
0 50 100 150 200 250 300 350 400 450 500
0
200
400
600
800
1000
Bildschirmhorizontale (verkürzt) [pixel]
Bild
sch
irm
ve
rtik
ale
[p
ixe
l]
Beispielbewegung mit Messpunkten
0 100 200 300 400 500 600 700 800 900-50
0
50
Zeit [ms]
Ge
sch
win
dig
ke
it [p
ixe
l/s] (b
lau
)
Be
sch
leu
nig
un
g [p
ixe
l/s2
] (r
ot)
Geschwindigkeit & Beschleunigung einer Beispielbewegung nach Glättung mit Moving-Average Filter
0 50 100 150 200 250 300 350 400 450 500
0
200
400
600
800
1000
Bildschirmhorizontale (verkürzt) [pixel]
Bild
sch
irm
ve
rtik
ale
[p
ixe
l]
Beispielbewegung mit Messpunkten
0 100 200 300 400 500 600 700 800 900-50
0
50
Zeit [ms]
Ge
sch
win
dig
ke
it [p
ixe
l/s] (b
lau
)
Be
sch
leu
nig
un
g [p
ixe
l/s2
] (r
ot)
Geschwindigkeit & Beschleunigung einer Beispielbewegung nach Interpolation auf 20ms Abstände

Page 98
References
Aboulafia, A., Bannon, L., & Fernstrom, M. (2001). Shifting perspectives from
effect to affect: some framing questions. In M. Helander, H. M. Khalid, & P. O.
Tham (Ed.), Proceedings of the International Conference on Affective Human
Factors Design (pp. 508-514). ASEAN Academic Press.
Ahmed, A. A., & Traore, I. (2007). A New Biometric Technology Based on Mouse
Dynamics. IEEE Transactions on Dependable and Secure Computing , 4 (3),
165-179.
Alben, L. (1996). Quality of Experience. Interactions , 3 (3), 11-15.
Ardito, C., Costabile, M. F., Lanzilotti, R., & Montinaro, F. (2007). Toward the
evaluation of UX. In E. Law, A. Vermeeren, M. Hassenzahl, & M. Blythe
(Eds.), Towards a UX manifesto (pp. 6-9). COST294-MAUSE.
Ark, W. S., Dryer, D. C., & Lu, D. J. (1999). The Emotion Mouse. Proceedings of
HCI International (pp. 818-823). Mahwah, NJ: Lawrence Erlbaum Associates.
Batra, R., & Ahtola, O. T. (1990). Measuring the hedonic and utilitarian sources of
consumer choice. Marketing Letters , 2, 159-170.
Battarbee, K. (2004). Co-Experience: Understanding User Experiences in Social
Interaction (Doctoral dissertation). Helsinki: University of Art and Design.
Beatty, J. (1982). Task-evoked pupillary responses, processing load, and the
structure of processing resources. Psychological Bulletin , 91 (2), 276-292.
Bloch, P. H. (1995). Seeking the ideal form: Product design and consumer
response. Journal of Marketing , 59 (3), 16-29.
Bloch, S., Lemeignan, M., & Aguilera, N. (1991). Specific respiratory patterns
distinguish among human basic emotions. International Journal of
Psychophysiology , 11 (2), 141-154.
Blythe, M., Hassenzahl, M., Law, E., & Vermeeren, A. (2007). An Analysis
Framework for User Experience (UX) Studies: A Green Paper. In E. Law, A.
Vermeeren, M. Hassenzahl, & M. Blythe (Ed.), COST294-MAUSE affiliated
workshop, (pp. 1-5). Lancaster, UK.
Blythe, M., Monk, A., & Park, J. (2002). Technology biogarphies: field study
techinques for home use product development. CHI '02 Extended Abstracts
on Human Factors in Computing Systems (pp. 658-659). New York: ACM.

Page 99
Bradley, M. M., & Lang, P. J. (2000). Measuring emotion: Behavior, feeling, and
physiology. In R. D. Lane, & L. Nadel (Eds.), Cognitive neuroscience of
emotion (pp. 242-276). New York: Oxford University Press.
Bradley, M. M., & Lang, P. J. (1994). Measuring emotion: the Self-Assessment
Manikin and the Semantic Differential. Journal of Behavior Therapy and
Experimental Psychiatry , 25 (1), 49-59.
Bradley, M. M., Codispoti, M., Cuthbert, B. N., & Lang, P. J. (2001). Emotion and
Motivation I: Defensive and Appetitive Reactions in Picture Processing.
Emotion , 1 (3), 276-298.
Brandtzæg, P. B., & Følstad, A. (2001). How to Understand Fun: Using Demands,
decision latitude and social support to understand fun in Human Factors
Design. In M. Helander, H. M. Khalid, & M. P. Tham (Ed.), Proceedings of
The International Conference on Aff ective Human Factors Design (pp. 131-
139). London: Asean Academic Press.
Brave, S., & Nass, C. (2003). Emotion in Human-Computer Interaction. In J. A.
Jacko, & A. Sears (Eds.), The Human-Computer Interaction Handbook (pp.
81-96). London: Lawrence Erlbaum Associates.
Briggs-Myers, I., & Myers, P. (1980). Gifts Differing: Understanding Personality
Type. Consulting Psychologists Press.
Buchenau, M., & Suri, J. F. (2000). Experience prototyping. In D. Boyarski, & W.
A. Kellogg (Ed.), Proceedings of the 3rd Conference on Designing interactive
Systems DIS '00 (pp. 424-433). New York: ACM.
Burmester, M., Platz, A., Rudolph, U., & Wild, B. (1999). Aesthetic design - just
an add on? In H. J. Bullinger, & J. Ziegler (Eds.), Human Computer
Interaction: Ergonomics and User Interfaces (pp. 671-675). Mahwah, NJ:
Lawrence Erlbaum.
Cacioppo, J. T., Berntson, G. G., Larsen, J. T., Poehlmann, K. M., & Ito, T. A.
(1993). The Psychophysiology of Emotion. In J. M. Haviland-Jones (Ed.),
Handbook of Emotions (pp. 119-142). New York: The Guilford Press.
Carroll, J. M., & Thomas, J. C. (1988). FUN. SIGCHI Bulletin , 19 (3), 21-24.
Chen, H. (2006). Flow on the net - detecting Web users' positive affects and their
flow states. Computers in Human Behavior , 22, 221-233.
Cohen, I., Sebe, N., Chen, L., Garg, A., & Huang, T. S. (2003). Facial Expression
Recognition from Video Sequences: Temporal and Static Modeling. Computer
Vision and Image Understanding , 91 (1-2), 160-187.

Page 100
Costa, P. T., & McCrae, R. R. (1992). Revised NEO Personality Inventory (NEO
PI-R) and NEO Five Factor Inventory (Professional Manual). Assessment
Resources: Psychological Assessment Resources.
Cowie, R., Douglas-Cowie, E., Tsapatsoulis, N., Votsis, G., Kollias, G., Fellenz,
W., et al. (2001). Emotion recognition in human-computer interaction. IEEE
Signal Processing Magazine , 18 (1), 32-80.
Crilly, N., Moultrie, J., & Clarkson, P. J. (2004). Seeing things: consumer
response to the visual domain in product design. Design Studies , 25, 547-
577.
Csikszentmihalyi, M. (1975). Beyond boredom and anxiety. San Francisco:
Jossey-Bass.
Csikszentmihalyi, M. (1990). Flow: The Psychology of Optimal Experience. New
York: Harper.
Csikszentmihalyi, M., & Larson, R. (1987). Validity and reliability of the
Experience-Sampling Method. Journal of Nervous and Mental Disease , 175
(9), 526-536.
Davis, F. D., Bagozzi, R. P., & Warschaw, P. R. (1992). Extrinsic and intrinsic
motivation to use computers in the workplace. Journal of Applied Social
Psychology , 22, 1111-1132.
de Meijer, M. (1989). The contribution of general features of body movement to
the attribution of emotions. Journal of Nonverbal Behavior , 13 (4), 247-268.
Derbaix, C., & Pecheux, C. (1999). Mood and children: Proposition of a
measurement scale. Journal of Economic Psychology , 20 (5), 571-591.
Desmet, P. (2003). A multilayered model of product emotions. The design journal
, 6 (2), 4-13.
Desmet, P. (2002). Designing Emotions (Doctoral Dissertation). Netherlands:
Delft University of Technology.
Desmet, P., & Hekkert, P. (2002). The basis of product emotions. In W. Green, &
P. Jordan (Eds.), Pleasure with products: Beyond usability (pp. 60-68).
London: Taylor & Francis.
Diener, E., & Iran-Nejad, A. (1986). The relationship in experience between
various types of affect. Journal of Personality and Social Psychology , 50 (5),
1031-1038.
Dion, K., Berscheid, E., & Walster, E. (1972). What is beautiful is good. Journal of
Personality and Social Psychology , 24 (3), 285-290.

Page 101
Djajadiningrat, J. P. (1998). Cubby: What you see is where you act. Interlacing
the display and manipulation spaces (Doctoral dissertation). Delft, the
Netherlands: Delft University of Technology.
Doerr, J., & Kerkow, D. (2006). Total control of user experience in software
development - a software engineering dream? In E. Law, User Experience -
Towards a Unified View (pp. 94-99).
Edwards, E. C., & Kasik, D. J. (1974). User Experience with the CYBER graphics
terminal. Proceedings of VIM-21, (pp. 284-286).
Ekman, P., & Friesen, W. V. (1978). Facial Action Coding System: A Technique
for the Measurement of Facial Movement. Palo Alto, CA: Consulting
Psychologists Press.
Ekman, P., Levenson, R. W., & Friesen, W. V. (1983). Autonomic nervous system
activity distinguishes among emotions. Science , 221 (4616), 1208-1210.
Fahrenberg, J. (2001). Physiologische Grundlagen und Messmethoden der Herz-
Kreislaufaktivität [Physiological fundamentals and measurement methods of
cardiovascular activity]. In F. Rösler (Ed.), Grundlagen und Methoden der
Psychophysiologie (pp. 317-454). Göttingen: Hogrefe.
Fernandes, G., Lindgaard, G., Dillon, R., & Wood, J. (2003). Judgning the appeal
of web sites. Proceedings of the 4th World Congress on the Management of
Electronic Commerce. Hamilton: McMaster University.
Fisher, C., & Sanderson, P. (1996). Exploratory sequential data analysis:
exploring continuous observational data. Interactions , 3 (2), 25-34.
Forgas, J. P. (1995). Mood and Judgement: The Affect Infusion Model (AIM).
Psychological Bulletin , 117 (1), 39-66.
Forlizzi, J., & Battarbee, K. (2004). Understanding experience in interactive
systems. Proceedings of the 2004 conference on Designing Interactive
Systems (DIS 04) (p. 261). New York: ACM.
Forlizzi, J., & Ford, S. (2000). The building blocks of experience: An early
framework for interaction designers. Proceedings of Conference on Designing
Interactive Systems, (pp. 419-423).
Frijda, N. H. (1989). Aesthetic emotion and reality. American Psychologist , 44
(12), 1546-1547.
Frijda, N. H. (1986). The Emotions. Cambridge: Cambridge University Press.
Garrett, J. J. (2002). The elements of user experience – user-centered design for
the web. Berkeley, CA: New Riders/Pearson Education.

Page 102
Gaver, B., Dunne, T., & Pacenti, E. (1999). Cultural Probes. Interactions , 6 (1),
21-29.
Gaver, W. W., & Martin, H. (2000). Alternatives: Exploring information appliances
through conceptual design proposals. Proceedings of the CHI 2000
Conference on Human Factors in Computing (pp. 209-216). New York: ACM
Press.
Gladwell, M. (2005). Blink. The power of thinking without thinking. New York:
Time Warner Book Group.
Goleman, D. (1995). Emotional Intelligence. New York: Bantam Books.
Gomez, P. (2005). Respiratory Responses to Visual and Acoustic Stimuli From a
Dimensional Perspective of Emotion (Doctoral Dissertation). Aachen: Shaker
Verlag.
Grammer, K., Honda, R., Schmitt, A., & Juette, A. (1999). Fuzziness Of
Nonverbal Courtship Communication. Unblurred By Motion Energy Detection.
Journal of Personality and Social Psychology , 77 (3), 509-524.
Gross, J. J., & Levenson, R. W. (1995). Emotion elicitation using films. Cognition
and Emotion , 9 (1), 87-108.
Gross, J. J., Sutton, S. K., & Ketelaar, T. (1998). Relations between affect and
personality: Support for the affect-level and affective-reactivity views.
Personality and Social Psychology Bulletin , 24 (3), 279-288.
Hartmann, B., Mancini, M., & Pelachaud, C. (2006). Implementing Expressive
Gesture Synthesis for Embodied Conversational Agents. In Gesture in
Human-Computer Interaction and Simulation (Vol. 3881, pp. 188-199). Berlin:
Springer.
Hassenzahl, M. (2007). Aesthetics in interactive products: Correlates and
consequences of beauty. In H. N. Schifferstein, & P. Hekkert (Eds.), Product
experience. Amsterdam: Elsevier Science.
Hassenzahl, M. (2004b). Emotions Can Be Quite Ephemeral. We Cannot Design
Them. Interactions , 11 (5), 46-48.
Hassenzahl, M. (2006). Hedonic, Emotional, and Experiential Perspectives on
Product Quality. In C. Ghaoui, Encyclopedia of Human Computer Interaction
(pp. 266-272). London, Hershey: Idea Group.
Hassenzahl, M. (2001). The effect of perceived hedonic quality on product
appealingness. International Journal of Human-Computer Interaction , 13 (4),
481-499.
Page 103
Hassenzahl, M. (2004a). The Interplay of Beauty, Goodness, and Usability in
Interactive Products. Human-Computer Interaction , 19 (4), 319-349.
Hassenzahl, M. (2003). The thing and I: Understanding the relationship between
user and product. In M. Blythe, C. Overbeeke, A. F. Monk, & P. C. Wright,
Funology: From usability to enjoyment (pp. 31-42). Dordrecht: Kluwer.
Hassenzahl, M., & Tractinsky, N. (2006). User Experience – a Research Agenda.
Behaviour and Information Technology , 25 (2), 91-97.
Hassenzahl, M., & Ullrich, D. (2007). To do or not to do: Differences in user
experience and retrospective judgements depending on the presence or
absence of instrumental goals. Interacting with Computers , 19, 429-437.
Hassenzahl, M., Beu, A., & Burmester, M. (2001). Engineering Joy. IEEE
Software , 18 (1), 70-76.
Hassenzahl, M., Burmester, M., & Koller, F. (2003). AttrakDiff: Ein Fragebogen
zur Messung wahrgenommener hedonischer und pragmatischer Qualität
[AttrakDiff: A questionnaire for the measurement of perceived hedonic and
pragmatic qualities]. In J. Ziegler, & G. Szwillus (Eds.), Mensch & Computer
2003.Interaktion in Bewegung (pp. 187-196). Stuttgart, Leipzig: B.G. Teubner.
Hassenzahl, M., Law, E. L.-C., & Hvannberg, E. T. (2006). User Experience –
Towards a unified view. Proceedings of NorciCHI. The Fourth Nordic
Conference on Human-Computer Interaction, (pp. 1-3). Oslo.
Hassenzahl, M., Platz, A., Burmester, M., & Lehner, K. (2000). Hedonic and
ergonomic quality aspects determine a software´s appeal. CHI 2000
Conference Proceedings (pp. 201-208). New York: ACM Press.
Hektner, J., Schmidt, J., & Csikszentmihalyi, M. (2007). Experience Sampling
Method: Measuring the Quality of Everyday Life. London: Sage Publications.
Helander, M. G., & Tham, M. P. (2003). Hedonomics - affective human factors
design. Ergonomics , 46, 1269-1272.
Hess, E. H., & Polt, J. M. (1960). Pupil Size in Relation to Interest Value of Visual
Stimuli. Science , 132 (3423), 349-350.
Huang, M. H. (2003). Designing Website attributes to induce experiential
encounters. Computers in Human Behavior , 19, 425-442.
ISO. (1998). ISO 9241: Ergonomic requirements for office work with visual
display terminals (VDTs) - Part 11: Guidance on usability. Geneva:
International Organization for Standardization.
Janlert, L. E., & Stolterman, E. (1997). The character of things. Design Studies ,
18 (3), 297-314.

Page 104
Jordan, P. W. (2000). Designing pleasurable products. An introduction to the new
human factors. London, New York: Taylor & Francis.
Jordan, P. W. (1997). Products as personalities. In S. A. Robertson (Ed.),
Contemporary Ergonomics (pp. 73-78). London: Taylor & Francis.
Juette, A. (2001). Veränderungen der Bewegungsqualität mit zunehmender
Despressivität [Changes of movement quality with increasing despression]
(Doctoral dissertation). Vienna: University of Vienna.
Kempf, D. S. (1999). Attitude formation from product trial: Distinct roles of
cognition and affect for hedonic and functional products. Psychology &
Marketing , 16, 35-50.
Kleiss, J. A., & Enke, G. (1999). Assessing Automotive Audio System Visual
Appearance Attributes Using Empirical Methods. In Human Factors in Audio
Interior Systems, Driving, and Vehicle Seating. Warrendale: Society of
Automotive Engineers.
Knemeyer, D., & Svoboda, E. (2006, 08 11). User Experience - UX. Retrieved 05
01, 2008, from http://interaction-
design.org/encyclopedia/user_experience_or_ux.html
Konečni, V. J., & Sargent-Pollock, D. (1977). Arousal, positive and negative
affect, and preference for Renaissance and 20th-century paintings. Motivation
and Emotion , 1 (1), 75-93.
Kramer, A. F. (1991). Physiological metrics of mental workload: a review of recent
progress. In D. L. Damos (Ed.), Multiple-Task-Performance (pp. 329-360).
London: Taylor & Francis.
Küthe, E., Thun, M., & Schriefers, T. (1995). Marketing mit Bildern [marketing
with images]. Köln: DuMont.
Kurosu, M., & Kashimura, K. (1995). Apparent usability vs. inherent usability:
experimental analysis on the determinants of the apparent usability.
Conference on Human Factors in Computing Systems (pp. 292-293 ). New
York: ACM.
Lang, P. J. (1980). Behavioral treatment and bio-behavioral assessment:
Computer applications. In J. B. Sidowski, H. Johnson, & T. A. Williams (Eds.),
Technology in Mental Health Care Delivery Systems (pp. 119-137). Norwood,
NJ: Ablex.
Lang, P. J. (1995). The emotion probe: Studies of motivation and attention.
American Psychologist , 50 (5), 372-385.

Page 105
Lang, P. J., Greenwald, M. K., Bradley, M. M., & Hamm, A. O. (1993). Looking at
pictures: Affective, facial, visceral, and behavioral reactions.
Psychophysiology , 30, 261-273.
Larsen, R. J., & Fredrickson, B. L. (1999). Measurement issues in emotion
research. In D. Kahnemann, E. Diener, & N. Schwarz (Eds.), Well-Being: the
foundations of hedonic psychology. New York: Russel Sage Foundation.
Laurel, B. (1991). Computers as Theatre. Boston, MA: Addison-Wesley.
Lavie, T., & Tractinsky, N. (2004). Assessing dimensions of perceived visual
aesthetics of web sites. International Journal of Human-Computer Studies ,
60 (3), 269-298.
Law, E., Roto, V., Vermeeren, A., Kort, J., & Hassenzahl, M. (2008). Towards a
Shared Definition of User Experience. CHI 2008 Proceedings (pp. 2395-
2398). Florence, Italy: ACM.
Law, E., Vermeeren, A., Hassenzahl, M., & Blythe, M. (2007). Towards a UX
Manifesto. Lancaster, UK: COST294-MAUSE.
Leder, H., Belke, B., Oeberst, A., & Augustin, D. (2004). A model of aesthetic
appreciation and aesthetic judgments. British Journal of Psychology , 95 (4),
489-508.
Lenderman, M. (2006). Experience the Message: How Experiential Marketing Is
Changing the Brand World. New York: Carroll & Graf.
Likert, R. (1932). A technique for the measurement of attitudes. Archives of
Psychology , 140 (5), 1-55.
Lindgaard, G., & Whitfield, T. (2004). Integrating aesthetics within an evolutionary
and psychological framework. Theoretical Issues in Ergonomics Science , 5
(1), 73-90.
Logan, R. J. (1994). Behavioral and emotional usability: Thomson consumer
electronics. In M. E. Wiklund, Usability in practice: How companies develop
user friendly products (pp. 59-82). Boston: Academic Press.
MacDonald, A. S. (2001). Aesthetic intelligence: optimizing user-centred design.
Journal of Engineering Design , 12 (1), 37-45.
MacDonald, A. S. (2002). The Scenario of Sensory Encounter: Cultural Factors in
Sensory-Aesthetic Experience. In W. S. Green, & P. W. Jordan (Eds.),
Pleasure with products: beyond usability (pp. 113-123). London: Taylor &
Francis.
Maehr, W. (2005). eMotion - Estimation of the User’s Emotional State by Mouse
Motions. Diplomarbeit. Dornbirn: Fachhochschule Vorarlberg.
Page 106
Mahlke, S. (2008). User Experience of Interaction with Technical Systems
(Doctoral dissertation). Berlin: Technische Universität.
Mäkelä, A., & Fulton Suri, J. (2001). Supporting Users’ Creativity: Design to
Induce Pleasurable Experiences. In M. Helander, & H. M. Khalid (Ed.),
Proceedings of the Conference on Affective Human Factors (pp. 387-391).
London: Asean Academic Press.
Malone, T. W. (1981). Toward a Theory of Intrinsically Motivating Instruction.
Cognitive Science: A Multidisciplinary Journal , 5 (4), 333-369.
Marcus, A. (2004). Six Degrees of Separation: Defining User Experience Spaces.
User Experience Magazin , 16.
Margolin, V. (1997). Getting to know the user. Design Studies , 18 (3), 227-236.
Maslow, A. H. (1943). A Theory of Human Motivation. Psychological Review , 50
(4), 370-396.
Mayer, J. D., & Gaschke, Y. N. (1988). The Experience and Meta-Experience of
Mood. Journal of Personality and Social Psychology , 55 (1), 102-111.
McCarthy, J., & Wright, P. (2005). A Practitioner-Centred Assessment of a User-
Experience Framework. International Journal of Technology and Human
Interaction , 1 (2), 1-23.
McCarthy, J., & Wright, P. (2004). Technology as experience. Cambridge: MIT
Press.
Mehrabian, A. (1995). Framework for a Comprehensive Description and
Measurement of Emotional States. The Journal of Genetic Psychology , 121
(3), 339-361.
Mehrabian, A. (1996). Pleasure-arousal-dominance: A general framework for
describing and measuring individual differences in Temperament. Current
Psychology , 14 (4), 261-292.
Mehrabian, A., & Russell, J. A. (1974). An approach to environmental
psychology. Cambridge, MA: The MIT Press.
Morris, W. N. (1989). Mood: The Frame of Mind. New York: Springer-Verlag.
Mulder, I., & van Vliet, H. (2008). In Search of The X-Factor to Develop
Experience Measurement Tools. In J. Westerink, M. Ouwerkerk, T. Overbeek,
W. Pasveer, & B. de Ruyter (Eds.), Probing Experience: From Assessment of
User Emotions and Behaviour to Development of Products (Vol. 8, pp. 43-56).
Springer Netherlands.

Page 107
Nagamachi, M. (2001). Kansei Engineering – A Powerful Ergonomic Technology
for Product Development. In M. Helander, H. M. Khalid, & M. P. Tham (Ed.),
Proceedings of the Conference on Affective Human Factors (pp. 9–14).
London: Asean Academic Press.
Newell, A. (2006). Theatre as an intermediary between users and CHI designers.
HI 2006, (pp. 111-117). Montreal, Quebec, Canada.
Norman, D. A. (2004). Emotional Design: Why we love (or hate) everyday things.
New York: Basic Books.
Norman, D. A., & Draper, S. (1986). User Centered System Design: New
Perspectives on Human-Computer Interaction. Hillsdale: Lawrence Erlbaum.
Oppenheim, A. V., & Schafer, R. W. (1989). Discrete-Time Signal Processing.
Englewood Cliffs, NJ: Prentice-Hall.
Ortony, A., Clore, G. L., & Collins, A. (1988). The cognitive structure of emotions.
Cambridge, MA: Cambridge University Press.
Osgood, C. E., Suci, G., & Tannenbaum, P. (1957). The Measurement of
Meaning. University of Illinois Press.
Overbeeke, C. J., Djajadiningrat, J. P., Hummels, C. M., & Wensveen, S. G.
(2002). Beauty in Usability: Forget about ease of use! In W. S. Green, & P. W.
Jordan, Pleasure with products: Beyond usability (pp. 9-18). London: Taylor &
Francis.
Pagulayan, R. J., Keeker, K., Wixon, D., Romero, R. L., & Fuller, T. (2003). User-
Centered Design in Games. In J. A. Jacko, & A. Sears, The Human-Computer
Interaction Handbook (pp. 883-906). London: Lawrence Erlbaum Associates.
Park, S., Choi, D., & Kim, J. (2004). Critical factors for the aesthetic fidelity of web
pages: empirical studies with professional web designers and users.
Interacting with Computers , 16 (2), 351-376.
Partala, T., & Surakka, V. (2004). The effects of affective interventions in human-
computer interaction. Interacting with Computers , 16 (2), 295-309.
Picard, R. W. (1997). Affective Computing. Cambridge, MA: MIT Press.
Picard, R. W., & Klein, J. (2002). Computers that recognize and respond to user
emotion: theoretical and practival implications. Interacting with Computers ,
14, 141-169.
Plutchik, R. (2001). The Nature of Emotions. American Scientist , 89 (4), 344-349.
Prentice, D. A. (1987). Psychological correspondence of possessions, attitudes,
and values. Journal of Personality and Social Psychology , 53 (6), 993-1003.
Page 108
Prentice, D. A. (1987). Psychological correspondence of possessions, attitudes,
and values. Journal of Personality and Social Psychology , 53 (6), 993-1003.
Rafaeli, A., & Vilnai-Yavetz, I. (2004). Instrumentality, aesthetics and symbolism
of physical artifacts as triggers of emotion. Theoretical Issues in Ergonomics
Science , 5 (1), 91-112.
Rhea, D. K. (1992). A New Perspective on Design: Focusing on Customer
Experience. Design Management Journal , 40-48.
Roto, V. (2006). Web Browsing on Mobile Phones - Characteristics of User
Experience (Doctoral Dissertation). Helsinki: University of Technology.
Rubinoff, R. (2004, 04 21). How To Quantify The User Experience. Retrieved 05
10, 2008, from sitepoint.com: http://www.sitepoint.com/article/quantify-user-
experience
Russel, J. A. (1980). A circumplex model of affect. Journal of Personality and
Social Psychology , 39 (6), 1161-1178.
Russel, J. A. (1979). Affective space is bipolar. Journal of Personality and Social
Psychology , 37 (3), 345-356.
Russell, J. A. (2003). Core Affect and the Psychological Construction of Emotion.
Psychological Review , 110 (1), 145-172.
Russell, J. A., & Feldman Barrett, L. (1999). Core affect, prototypical emotional
episodes, and other things called emotion: Dissecting the elephant. Journal of
Personality and Social Psychology , 76 (5), 805-819.
Russell, J. A., Weiss, A., & Mendelssohn, G. A. (1989). The Affect Grid: A single-
item scale of pleasure and arousal. Journal of Personality and Social
Psychology , 57, 493-502.
Schenkman, B. N., & Jönsson, F. U. (2000). Aesthetics and preferences of web
pages. Behaviour & Information Technology , 19 (5), 367-377.
Scherer, K. R. (2001). Appraisal considered as a process of multi-level sequential
checking. In K. R. Scherer, A. Schorr, & T. Johnstone (Eds.), Appraisal
processes in emotion: Theory, methods, research (pp. 92-120). New York:
Oxford University Press.
Scherer, K. R. (1984). On the nature and function of emotion: A component
process approach. In K. R. Scherer, & P. Ekman (Eds.), Approaches to
emotion (pp. 293-317). Hillsdale, NJ: Erlbaum.
Schorr, A. (2001). Subjective measurement in appraisal research: present state
and future perspectives. In K. R. Scherer, A. Schorr, & T. Johnstone (Eds.),

Page 109
Appraisal Processes in Emotion: Theory, Methods, Research (pp. 331-349).
New York: Oxford University Press.
Schuller, B. (2006). Automatische Emotionserkennung aus sprachlicher und
manueller Interaktion [Automatic recognition of emotions from verbal and
manual interaction] (Doctoral dissertation). München: Technische Universität
München.
Schwartz, S. H., & Bilsky, W. (1987). Toward a universal psychological structure
of human values. Journal of Personality and Social Psychology , 53 (3), 550-
562.
Shedroff, N. (2001). Experience Design. Berkeley, CA: New Riders /Pearson
Education.
Spiegel Verlag, H. (2002). Outfit-5 Typologie. Hamburg: Spiegel Verlag.
Stern, R. M., Ray, W. J., & Quigley, K. S. (2001). Psychophysiological Recording.
New York: Oxford University Press.
Summative assessment (Wikipedia). (2008, 05 18). Retrieved 06 01, 2008, from
http://en.wikipedia.org/wiki/Summative_assessment
Tiger, L. (1992). The Pursuit of Pleasure. Boston: Little, Brown & Company.
Tractinsky, N. (1997). Aesthetics and apparent usability: empirically assessing
cultural and methodological issues. Conference on Human Factors in
Computing Systems (pp. 115-122). New York: ACM.
Tractinsky, N., & Zmiri, D. (2006). Exploring Attributes of Skins as Potential
Antecedents of Emotion in HCI. In P. Fishwick (Ed.), Aesthetic Computing
(pp. 405-422). Cambridge, MA: MIT Press.
Tractinsky, N., Cokhavi, A., & Kirschenbaum, M. (2004). Using Ratings and
Response Latencies to Evaluate the Consistency of Immediate Aesthetic
Perceptions of Web Pages. Proceedings of the Third Annual Workshop on
HCI Research in MIS. Wahington, D.C.
Tractinsky, N., Katz, A. S., & Ikar, D. (2000). What is beautiful is usable.
Interacting with Computers , 13, 127-145.
User Experience (Nielsen-Norman Group). (2007, 01 05). Retrieved 05 10, 2008,
from Nielsen-Norman Group:
http://www.nngroup.com/about/userexperience.html
User Experience Design (Wikipedia). (2008, 05 03). Retrieved 05 10, 2008, from
Wikipedia: http://en.wikipedia.org/wiki/User_experience_design

Page 110
Wallbott, H. G. (1982). Bewegungsstil und Bewegungsqualität. Untersuchungen
zum Ausdruck und Eindruck gestischen Verhaltens. Weinheim: Beltz Verlag.
Wallbott, H. G. (1998). Bodily expression of emotion. European Journal of Social
Psychology , 28, 879-896.
Wallbott, H. G. (1985). Hand Movement Quality: A Neglected Aspect of
Nonverbal Behavior in Clinical Judgement and Person Perception. Journal of
Clinical Psychology , 41 (3), 345-359.
Watson, D., & Tellegen, A. (1985). Tellegen. Psychological Bulletin , 98 (2), 219-
235.
Weisstein, E. W. (2003, Februar 1). Point-Line Distance--2-Dimensional.
Retrieved Dezember 12, 2007, from MathWorld--A Wolfram Web Resource:
http://mathworld.wolfram.com/Point-LineDistance2-Dimensional.html
Wensveen, S., Overbeeke, K., & Djajadiningrat, T. (2000). Touch me, hit me and
I know how you feel: a design approach to emotionally rich interaction.
Proceedings of the 3rd conference on Designing interactive systems:
processes, practices, methods, and techniques (pp. 48-52). New York: ACM.
Whitfield, T. (2000). Beyond prototypicality: towards a Categorical-Motivation
model of aesthetics. Empirical Studies of the Arts , 18, 1-11.
Wicklund, R. A., & Gollwitzer, P. M. (1982). Symbolic self-completion. Hilldsdale,
NJ: Lawrence Erlbaum Associates.
Wright, P., & Blythe, M. (2007). User Experience Research as an Inter-discipline:
Towards a UX Manifesto. In E. Law, A. Vermeeren, M. Hassenzahl, & M.
Blythe, Towards a UX Manifesto (pp. 65-70). COST294-MAUSE workshop.
Yeung, C. M., & Wyer, R. J. (2004). Affect, appraisal and consumer judgment.
Journal of Consumer Research , 31 (2), 412-424.
Zacks, J. M. (2004). Using movement and intentions to understand simple events.
Cognitive Science , 28, 979-1008.
Zajonc, R. B. (1980). Feeling and thinking: Preferences need no inferences.
American Psychologist , 35 (2), 151-175.
Zajonc, R. B., & Markus, H. (1982). Affective and Cognitive Factors in
Preferences. Journal of Consumer Research , 9 (2), 123-131.
Zhang, P., & Li, N. (2004). Love at first sight or sustained effect? The role of
perceived affective quality on user’s cognitive reactions to information
technology. Proceedings of the Twenty-Fifth International Conference on
Information Systems (ICIS), (pp. 283-295).

Page 111

Page 112
About the Author
Philippe Zimmermann was born in Bern, Switzerland in 1972. He studied Environmental Sciences at the Federal Institute of Technology in Zurich, Switzerland (1993-2000). He worked in the corporate IT-Departments of IBM and Siemens for several years before he co-founded and managed a company for web application development. From 2002-2005 he worked at the Swiss Federal Institute of Technology in the Man-Machine Interaction group where he also pursued his doctoral studies in the area of human-computer interaction. Since 2005 Philippe Zimmermann works at the University of Bern as a research associate. His current research interests include the measurement of affect in the context of HCI, affective reactions to design and designed objects, assessment of motivational factors in e-learning environments, and user experience evaluations.