Beyond ‘Dieselgate’ Implications of unaccounted and future ...
12
Beyond ‘Dieselgate’: Implications of unaccounted and future air pollutant emissions and energy use for cars in the United Kingdom Christian Brand Environmental Change Institute and Transport Studies Unit, University of Oxford, South Parks Road, Oxford OX1 3QY, UK HIGHLIGHTS Explores the recent ‘Dieselgate’ affair and potential policy responses. Impacts on human health of ‘real world’ NOX emissions in the UK are significant. De-dieselization can have air quality benefits while showing few carbon disbenefits. Electrification shows largest ‘co-benefits’ but needs transformative approach. Electrification may mean faster decline in road tax revenues. article info Article history: Received 11 March 2016 Received in revised form 10 June 2016 Accepted 24 June 2016 Available online 15 July 2016 Keywords: Transport Cars NO X emissions Dieselgate Transport policy Scenario modelling abstract The ‘Dieselgate’ emissions scandal has highlighted long standing concerns that the performance gap between ‘real world’ and'official’ energy use and pollutant emissions of cars is increasing to a level that renders ‘official’ certification ratings virtually ineffective while misleading consumers and damaging human health of the wider population. This paper aims to explore the scale and timing of historic and future impacts on energy use and emissions of the UK car market. To achieve this aim it applies a be- spoke disaggregated model of the transport-energy-environment system to explore the impacts of ret- rospective and future policy scenarios on the UK car market, trade-offs between greenhouse gas and air quality emissions, and fuel use and associated tax revenues. The results suggest that the impacts on human health of ‘real world’ excess NO X emissions in the UK are significant. Future ‘low diesel’ policies can have significant air quality benefits while showing few (if any) carbon disbenefits, suggesting future car pricing incentives may need to be rebalanced taking more account of effects of local air pollution. Car pricing incentives are however unlikely to transform the car market without additional market changes, industry push, infrastructure investment and policy pull aimed at cleaner, lower carbon vehicles. & 2016 The Author. Published by Elsevier Ltd. This is an open access article under the CC BY license (http://creativecommons.org/licenses/by/4.0/). 1. Introduction 1.1. The challenge – and potential opportunity? The ‘Dieselgate’ 1 emissions scandal has highlighted growing concerns that the performance gap between ‘real world’ and ‘of- ficial’ energy use and air pollutant emissions of road vehicles is increasing to a level that renders ‘official’ certification ratings virtually ineffective while misleading consumers and damaging human health of the wider population. While real world CO 2 emissions have been shown to be on average a third higher (CCC, 2015b; ICCT, 2014a; TandE, 2015a), NO X emissions can be up to 40 times higher than official certification values and standards oper- ating in the EU (Hagman et al., 2015; ICCT, 2014b; Weiss et al., 2012), the US (Barrett et al., 2015) and China (Lau et al., 2015; Shen et al., 2015). For CO 2 , the gap between test results and real-world Contents lists available at ScienceDirect journal homepage: www.elsevier.com/locate/enpol Energy Policy http://dx.doi.org/10.1016/j.enpol.2016.06.036 0301-4215/& 2016 The Author. Published by Elsevier Ltd. This is an open access article under the CC BY license (http://creativecommons.org/licenses/by/4.0/). E-mail address: [email protected] 1 While there is no official definition of the term ‘Dieselgate’, it has become synonymous with the use by the Volkswagen Group of a ‘defeat device’ that detects when a diesel car is undergoing an official emissions tests and optimises engine performance to minimise air pollutant emissions to meet stringent emissions regulations. The device is only activated during the official test. Vehicles by other manufacturers have also been shown to exceed emissions in real world driving conditions; however, there has been no evidence of ‘defeat devices’ being used outside Volkswagen. Energy Policy 97 (2016) 1–12
Transcript of Beyond ‘Dieselgate’ Implications of unaccounted and future ...

Energy Policy 97 (2016) 1–12
Contents lists available at ScienceDirect
Energy Policy
http://d0301-42
E-m1 W
synonymwhen aperformregulatimanufaconditiooutside
journal homepage: www.elsevier.com/locate/enpol
Beyond ‘Dieselgate’: Implications of unaccounted and future airpollutant emissions and energy use for cars in the United Kingdom
Christian BrandEnvironmental Change Institute and Transport Studies Unit, University of Oxford, South Parks Road, Oxford OX1 3QY, UK
H I G H L I G H T S
� Explores the recent ‘Dieselgate’ affair and potential policy responses.
� Impacts on human health of ‘real world’ NOX emissions in the UK are significant.� De-dieselization can have air quality benefits while showing few carbon disbenefits.� Electrification shows largest ‘co-benefits’ but needs transformative approach.� Electrification may mean faster decline in road tax revenues.a r t i c l e i n f o
Article history:Received 11 March 2016Received in revised form10 June 2016Accepted 24 June 2016Available online 15 July 2016
Keywords:TransportCarsNOX emissionsDieselgateTransport policyScenario modelling
x.doi.org/10.1016/j.enpol.2016.06.03615/& 2016 The Author. Published by Elsevier
ail address: [email protected] there is no official definition of the termous with the use by the Volkswagen Group odiesel car is undergoing an official emissionance to minimise air pollutant emissions tons. The device is only activated during the octurers have also been shown to exceed emns; however, there has been no evidence oVolkswagen.
a b s t r a c t
The ‘Dieselgate’ emissions scandal has highlighted long standing concerns that the performance gapbetween ‘real world’ and'official’ energy use and pollutant emissions of cars is increasing to a level thatrenders ‘official’ certification ratings virtually ineffective while misleading consumers and damaginghuman health of the wider population. This paper aims to explore the scale and timing of historic andfuture impacts on energy use and emissions of the UK car market. To achieve this aim it applies a be-spoke disaggregated model of the transport-energy-environment system to explore the impacts of ret-rospective and future policy scenarios on the UK car market, trade-offs between greenhouse gas and airquality emissions, and fuel use and associated tax revenues. The results suggest that the impacts onhuman health of ‘real world’ excess NOX emissions in the UK are significant. Future ‘low diesel’ policiescan have significant air quality benefits while showing few (if any) carbon disbenefits, suggesting futurecar pricing incentives may need to be rebalanced taking more account of effects of local air pollution. Carpricing incentives are however unlikely to transform the car market without additional market changes,industry push, infrastructure investment and policy pull aimed at cleaner, lower carbon vehicles.
& 2016 The Author. Published by Elsevier Ltd. This is an open access article under the CC BY license(http://creativecommons.org/licenses/by/4.0/).
1. Introduction
1.1. The challenge – and potential opportunity?
The ‘Dieselgate’1 emissions scandal has highlighted growing
Ltd. This is an open access article
‘Dieselgate’, it has becomef a ‘defeat device’ that detectss tests and optimises engineo meet stringent emissionsfficial test. Vehicles by otherissions in real world drivingf ‘defeat devices’ being used
concerns that the performance gap between ‘real world’ and ‘of-ficial’ energy use and air pollutant emissions of road vehicles isincreasing to a level that renders ‘official’ certification ratingsvirtually ineffective while misleading consumers and damaginghuman health of the wider population. While real world CO2
emissions have been shown to be on average a third higher (CCC,2015b; ICCT, 2014a; TandE, 2015a), NOX emissions can be up to 40times higher than official certification values and standards oper-ating in the EU (Hagman et al., 2015; ICCT, 2014b; Weiss et al.,2012), the US (Barrett et al., 2015) and China (Lau et al., 2015; Shenet al., 2015). For CO2, the gap between test results and real-world
under the CC BY license (http://creativecommons.org/licenses/by/4.0/).

3 This paper focused on NOX pollution and standards as this was the issue
C. Brand / Energy Policy 97 (2016) 1–122
performance has increased from 8% in 2001–31% in 2012 and 40%in 2014 (TandE, 2015a). Up to nine out of ten diesel cars on Eur-ope's roads are said to break European NOX pollution limits,2 andthe current generation of Euro 6 vehicles have been shown toemit, on average, seven times more NOX than certified Europeanvalues (Beevers et al., 2012; Dehmer, 2015; ICCT, 2014b). While theemissions scandal began in the US, little quantified evidence existson the effects of excess emissions in the UK, which is a largermarket for diesel cars. There is also a lack of quantification of thepotential trade-offs between human health and climate changemitigation effects in the UK.
Given that transport accounts for 46 per cent of all NOxemissions in the region (EEA, 2015), the performance gap partlyexplains why NOx emissions in many European countries continueto miss targets (Beevers et al., 2012). The other reasons are thegrowth in overall traffic and the increase in the diesel marketshare for cars. In the UK, for instance, diesel vehicles accounted forfewer than 1 per cent of cars on the road in 1984 – last year thatfigure had risen to more than a third, with new registrations to-talling about 1.35 million (or half) of all new cars in 2014 (SMMT,2014). This compares to the almost 1.2 million VW diesel vehiclesaffected in the UK, and about 11 million VW diesel vehiclesworldwide (Sheffield, 2015; Yeomans, 2015).
1.2. Lack of effective policy response in the UK
The human health ‘costs’ of diesel related air pollution (seeSupplementary material S1 for further details) are highly policy-relevant. The UK Government has been subject to legal proceed-ings for failing to meet European Limit Values for NO2, and theirplans to reduce NO2 concentrations and meet these limits wassubmitted to the European Commission at the end of 2015 (DEFRA,2015a). Some major urban hotspots will continue to exceed EClimits for another decade to come (DEFRA, 2015a) as effectivemitigation of local air pollution is proving to be an enormouschallenge in cities across the globe (Barrett et al., 2015; Carrington,2016; Walton et al., 2015; Woodcock et al., 2009). The policy re-sponse so far has been slow and ineffective as the reliance onupdating the vehicle type-approval testing procedure and asso-ciated legislation are still on-going (CCC, 2015b) and will not havesignificant effects for another decade or more.
The proposed policy and technological solutions include ac-tions at national and local levels: a national diesel car scrappagescheme; a ban on (older) diesel vehicles in cities; the requirementfor new taxis to be ULEV by a certain date; rebalancing of nationalfuel duty and road tax (Vehicle Excise Duty, or VED) consistentwith reducing not just CO2 emissions but also NO2 and particulatematter (PM); and national monetary incentives for switching tocleaner vehicles including ultra-low emission cars, taxis, vans andbuses (DEFRA, 2015b; UK EAC, 2015). The quantified effects ofthese measures in the UK are largely unknown.
Partly fuelled by the ‘Dieselgate’ affair, the electrification oftransport has gained further momentum, with Germany announ-cing it is to provide financial incentives of around €5000 forpeople to buy electric cars (EurActiv, 2015a, 2015b) and the UKextending its plug-in vehicle grant (d5000 per ULEV) that has ledto a 1% take up of plug-in vehicles amongst total new vehicle re-gistrations of 2.6 million in 2015 (SMMT, 2016). Some commen-tators suggest that continuing reductions in battery prices willbring the total cost of ownership of plug-in vehicles below that forconventional-fuel vehicles by 2025, evenwith low oil prices (BNEF,2016). However, doubts remain whether plug-in vehicles are direct
2 European emission standards for vehicles http://ec.europa.eu/environment/air/transport/road.htm
replacements of incumbent technologies or perceived as higherrisk investments, thus limiting potential take-up (AEA Technology,2009; BERR and DfT, 2008; Offer et al., 2011).
Some commentators are favouring a diesel scrappage schemesimilar to that of 2009/10, with diesel car owners being offered upto d2000 to scrap their car and buy an ultra low emission vehicle(ULEV) instead (Cellan-Jones, 2015; Kollewe, 2015a; Vaughan,2014). However, such a scheme may come at a cost to the taxpayerin the hundreds of millions (Vaughan, 2014) and may be con-sidered unfair as it constitutes a direct subsidy to existing carowners. Moreover, as diesel vehicles emit 15–20% less CO2 than apetrol equivalent, they have also made a significant contribution toclimate change mitigation – an argument that was explored in thispaper by investigating the trade-offs between meeting air qualityand climate change objectives (Kollewe, 2015b; van der Zwaanet al., 2013; Vaughan, 2016).
1.3. Aims and objectives of this paper
This paper addressed the above challenge and potential policyand market solutions in two ways. First, it quantified the humanhealth impacts and associated costs of ‘real world’ excess NOX
emissions in the UK context and compare this with an alternativepathway simulating a retrospective purchase penalty for dieselcars between 2009 and 2015. Second, it quantified the NOX-relatedhuman health and climate change mitigation impacts of futurepolicy scenarios aimed at the UK diesel car market.3 This paperthus aims to fill existing gaps in the work going on relating to theassessment of ‘real world’ vs ‘official’ emissions and potentialpolicy responses elsewhere which: (a) ignores the potential trade-offs between human health and climate change mitigation im-pacts; (b) lacks detailed analysis of how policy and market signalscan change the evolution of the car market; (c) ignores wider fueland/or vehicle life cycle emissions impacts in comparing differentpathways; and (d) lacks investigating the impacts on transport fueluse and associated tax revenues.
2. Approach, methods and data
2.1. Approach and choice of modelling tool
To achieve the above aims the study applied an existing andpreviously published transport-energy-environment modellingframework that has been applied in a number of policy modellingstudies (Anable et al., 2011; Anable et al., 2012; Brand et al., 2013;Brand et al., 2012). The UK Transport Carbon Model (UKTCM) wasthe tool of choice for this analysis because it integrates a house-hold car ownership model, vehicle consumer choice model, ve-hicle stock evolution model and vehicle and fuel life cycle emis-sions model in a single scenario modelling framework. The in-tegrated transport sector tool is able to provide policy-focusedconclusions which allow an assessment of the effectiveness ofdifferent policy instruments (including regulation, pricing andavailability of charging infrastructure) on different vehicle andconsumer segments. UKTCM has the ability to place the ‘de-die-selization’ and electrification of the car market in the context ofother (low carbon) transport behaviours on the basis of theirwhole life cycle emissions and impacts on human health, includingpotential changes in the way in which cars are used, together with
surrounding the Dieselgate affair. It is important to note that the inclusion in thedamage cost calculation of other pollutants, notably PM, may change the damagecost values. Since total multi-pollutant valuations were likely to increase the totals,the figures reported in this study can be considered on the conservative side.

C. Brand / Energy Policy 97 (2016) 1–12 3
the impacts on government tax revenue. It may therefore have amuch broader remit and wider range of applications in scenarioand policy analyses than, for instance, the top-down ‘ASIF’(Schipper, 2011) decomposition framework, sectoral models thatlack endogenizing consumer behaviour (Fontes and Pereira, 2014;Rogan et al., 2011), or integrated assessment models that by andlarge favour technology solutions and fuel shifts over travel ac-tivity and consumer behaviour modelling (Creutzig, 2015; Oxleyet al., 2013).
The modelling framework was first applied in a UK case studyto quantify the implications of the performance gap between ‘realworld’ and ‘official’ energy use and air pollutant emissions ofEURO5 and EURO6 diesel cars. In a forward looking modellingexercise it was then applied to explore the energy and emissionsimpacts of alternative policy scenarios of a CO2-graded purchase/scrappage tax on diesel cars and an ambitious electrificationpathways for UK car fleet. The modelling framework is brieflysummarised below followed by describing the core methods, dataand assumptions for the scenario portfolio used in this study.
2.2. The UK Transport Carbon Model (UKTCM): outline and keymethods
The UKTCM is a highly disaggregated, bottom-up modellingframework of the transport-energy-environment system. Builtaround a flexible and modular database structure, it models an-nual projections of transport supply and demand, for all passengerand freight modes of transport, and calculates the correspondingenergy use, life cycle emissions and environmental impacts year-by-year up to 2050. It takes a holistic view of the transport system,built around a set of exogenous scenarios of socio-economic, socio-technical and political developments. The model is technology richand, in its current version, provides projections of how differentvehicle technologies evolve over time for 770 vehicle technologycategories,4 including 283 car technologies such as increasinglyefficient gasoline internal combustion engine (ICE) vehicles, hybridelectric vehicles (HEV), battery electric vehicles (BEV), plug-inhybrid electric vehicles (PHEV) and hydrogen fuel cell vehicles(HFCV). UKTCM played a key role in developing the Energy2050‘lifestyle’ scenarios (Anable et al., 2011; Anable et al., 2012) for theUK Energy Research Centre (UKERC) and in exploring the effec-tiveness of low carbon car purchasing incentives in the UK (Brandet al., 2013). An overview of the model has been published inBrand et al. (2012). For the analysis presented in this paper,UKTCM was developed, updated and recalibrated from version 2.0(as reported in Brand et al., 2013) to the current version 3.1.
Car technology evolution, use and impacts are modelled in fourareas of modelling: (1) the car ownership model, (2) the car sales,choice and use model, (3) the direct energy use and emissions modeland (4) the life cycle energy and environmental impacts model.
2.2.1. Modelling car sales, technology choice and useNew car sales are a function of total car ownership and car
scrappage, with the latter modelled as a function of average lifeexpectancy via a S-shaped (modified Weibull) scrappage prob-ability curve (Brand, 2010; Brand et al., 2012). The new car marketis first segmented into private and company/fleet markets, theninto three vehicle segments according to common definitions of
4 A UKTCM ‘vehicle technology category’ is defined as a typical representativeof a combination of transport type (passenger or freight), vehicle type (e.g. mo-torcycle, car, HGV, train), vehicle size (e.g. small car of segment A/B, van, heavytruck, intercity rail), primary fuel type (e.g. gasoline, diesel, electricity), vintage (e.g.ICE Euro 5 2009–15, PHEV ‘Euro 7’ 2020–25) and hybridisation (ICE, HEV, PHEV).‘Vintaging’ is used to simulate changes in performance, efficiencies, consumerpreferences, costs and policy levers over time.
car size and class (A/B – ‘small’, C/D – ‘medium’, E/F/G/H – ‘large’).Using UK data to illustrate the segmentation, Fig. 1a shows thesales by ownership and size in 2013, highlighting the significanceof the fleet/company market (52.5% of all new cars). This is animportant distinction for modelling the car market as the fleet/company segment has historically been dominated by diesel cartechnology, and plug-in vehicles now taking in-roads in the samesegment, but in smaller sizes. Fig. 1b shows the split by ownershipand consumer segment, following the approach used by ElementEnergy and Aberdeen University for the Energy Technologies In-stitute in the UK (Element Energy, 2013).
The UKTCM's car choice model is a discrete choice model thatestimates the purchase choice probability based on an assessment ofoverall vehicle ‘attractiveness’ (or ‘utility’) from amongst a set ofvehicle choices (or ‘alternatives’), each with their own financial andnon-financial ‘attributes’. The weighting of attributes varies acrossconsumer segments, because consumers’ opinions on the importanceof different vehicle attributes vary. The model therefore reproducesthe variation in utility of different vehicles across consumer seg-ments, and the variation over time as vehicle attributes improve. Thechoice model was run for each vehicle segment and consumer seg-ment, with the share of vehicle and consumer segments being keptconstant in the Reference (REF) case. The modelling methods aredescribed in more detail in the Supplementary material S2.
2.2.2. Energy and emissions from vehicle operationIn-use energy consumption (in volume and energy units) and
air pollutant emissions (in tonnes of CO2, NOX, PM, CH4, NMVOC,and so on) from motorised travel were computed by using dis-aggregate sets of emission factors, which were based on the resultsof large scale vehicle emissions testing programmes. For roadtransport, speed distributions for each vehicle type (car, motor-cycle, van, HGV) and road segment type (urban, rural, motorway)were used to calculate energy consumption and emissions, basedon average speed-emissions curves developed in previous researchand emissions inventories such as COPERT II and III (EEA, 1998,2000), MEET (Hickman et al., 1999), HBEFA (INFRAS, 2004) andNAEI (NETCEN, 2003). Emissions factors for road vehicles at nor-mal operating temperatures (often called ‘hot’) were a polynomialfunction of average speed, with up to ten coefficients for eachpollutant. The fitted average-speed emissions curves typically re-semble U-shapes, with NOX emissions curves showing relativelyhigher emissions at speeds above 100 km/h. The road transportmodule also takes account of ‘cold start’ effects, which mainlydepend on ambient temperatures and trip distances. The approachallowed us to model the combined effects of different fleet com-positions, different sets of emission factors (e.g. ‘official’ vs ‘realworld’), traffic characteristics, cold starts, fuel quality and driverbehaviour. The UKTCM Reference Guide (Brand, 2010) describesthe functional relationships in detail. ‘Official’ NOX and CO2
emissions factors and electricity consumption for cars are given inSupplementary material S3.
2.2.3. Life cycle energy use, emissions and impactsBased on a typical environmental life cycle assessment frame-
work (ICO, 2006), the UKTCM includes a life cycle inventory modeland an environmental impacts assessment model. The formercomputes energy use and emissions (including primary energyand land use) from the manufacture, maintenance and disposal ofvehicles; the construction, maintenance, and disposal of infra-structure; and the supply of energy (fuels). The latter then pro-vides an assessment of the damage caused by calculating impactindicators and external costs. The life cycle inventory model usesthe ‘hybrid approach’ of process-chain analysis and input-outputanalysis (Marheineke et al., 1998). Process chain analysis is usedfor the main supply paths, and aggregated values for complete

Fig. 1. a/b: Car sales (a: left) and consumer split (b: right) in the UK market (2013 data).Source: adapted from SMMT (2014), Element Energy (2013) and ETI (ETI, 2014)
Table 1Damage costs per ton (2015 prices) for NOX and PM2.5 by population density.Source: DEFRA (2015a)
Population/building density NOX damage costs [d/ton]a PM2.5 damage costs [d/ton]
Lowb Central Higha Lowa Central Higha
High (‘transport inner conurbation’) 20,455 51,137 81,820 110,590 141,248 160,507Medium (‘transport average’) 8417 21,044 33,670 45,510 58,125 66,052Low (‘rural’) 2610 6524 10,438 14,108 18,020 20,476
Notes:a The central sensitivities reflect uncertainties around the lag between exposure and the health impact. The sensitivity for NOX also reflects the uncertainty around the
link between NO2 exposure and mortality.b NOX damage costs if PM2.5 is also valued (per ton, 2015 prices).
C. Brand / Energy Policy 97 (2016) 1–124
process chains are used within the model. For additional upstreamprocesses, considered to be second or third-order effects, input-output analysis is used. This hybrid approach is seen as appro-priate as much of the evidence in the literature suggests that, inmost cases, over the lifetime of a vehicle, vehicle operation pro-duces the vast majority of energy use and emissions (Bastani et al.,2012; Lane, 2006; MacLean and Lave, 2003; Ogden et al., 2004;Sperling and Yeh, 2010). While the fuel supply and vehicle man-ufacture stages typically account for about 20% of total lifetimeGHG emissions – being roughly equal in magnitude – vehiclemaintenance and disposal account for a much smaller share (ibid.).
The methodology for determining external costs is based on anevaluation of marginal effects (marginal external costs/benefits),which were estimated using the Impact Pathway Approach de-veloped previously in European research (Bickel et al., 2003; EC,2005; Rabl and Holland, 2008; Rabl et al., 2014) and is commonlyused in transport modelling and appraisal (DfT, 2014a; Macharisand Bernardini, 2015; Michiels et al., 2012; Mulley et al., 2013). Forinstance, average damage costs to human health of direct NOX andPM2.5 emissions by population density are shown in Table 1below.5 The UKTCM Reference Guide (Brand, 2010) describes thefunctional relationships and data used in detail.
5 The full Impact Pathway (IPA) modelling is relatively resource and time in-tensive. To support decision making, damage costs per ton of emissions were de-veloped by DEFRA for use by analysts. These damage costs were derived from thefull IPA analysis, providing a proportionate approach to valuing of the impacts ofchanges in air quality.
2.2.4. Limitations of the approach usedThere are some important limitations and uncertainties in the
approach. The data underlying the car choice model used in thefuture scenario analysis are based on stated preference and ‘what-if’ type assumptions on exogenous factors. More up-to-date evi-dence is needed on the characteristics, behaviours and attitudes ofcurrent diesel, gasoline and EV owners in the UK (towards re-vealed preference). In order to keep pace with the rapid devel-opment of the market and inform future policy making aimed atlimiting damage to health from diesel vehicles and at the sametime supporting the growth of the EV market, evidence on vehicleownership and use should ideally be collected on a continuous orsemi-regular basis (Brook Lyndhurst, 2015). This study has adop-ted a relatively simple analysis of linking emissions with impacts,the marginal damage costs approach based on aggregated resultsusing the more detailed impact pathway approach. While thelimited sensitivity analysis around the key factors determiningdamage costs on human health helps to explore the underlyinguncertainty, further work may be required on impact modelling atthe roadside and local levels, e.g. by linking place-based modelssuch as UKTCM with integrated assessment models as has beendone in some notable UK studies on cross-sectoral implicationsand climate ‘co-benefits’ in road transport pollution abatement(Oxley et al., 2015; Oxley et al., 2013; Oxley et al., 2012; Oxleyet al., 2009).
2.3. The UK case study – modelling ‘official’ and ‘real world’
C. Brand / Energy Policy 97 (2016) 1–12 5
pollutant emissions
2.3.1. Reference pathway (REF) – key data and assumptionsUKTCM v3.1 was calibrated to UK national statistics for the year
2013 (DfT, 2014b). The base case or ‘Reference scenario’ (REF)broadly depicts a projection of transport demand, supply, energyuse and emissions as if there were no changes to transport andenergy policy beyond October 2015. It was modelled using UKTCMbased on exogenous assumptions and projections of socio-demo-graphic, economic, technological and (firm and committed) policydevelopments, including the complex CO2-graded road tax6 andcompany car tax regimes. Economic growth data up to 2014 werebased on UK government figures. Future GDP/capita growth wereassumed to average 1.7% p.a. up to 2050 – in line with the historic50-year average for the UK. Transport demand projections weremodelled based on average demand elasticities (of GDP/capita,population and generalised cost) for the 1995–2014 period. Fuelprice and retail electricity price projections were based on 2014UK Government forecasts (DECC, 2014). Vehicle Excise Duty (VED,i.e. annual road tax) and other fuel duties were assumed to remainconstant at 2015 levels. Following an approach commonly used intechnology futures and modelling studies (European Commission,2005; Fulton et al., 2009; Strachan and Kannan, 2008; Strachanet al., 2008; UK Energy Research Centre, 2009; WEC, 2007), pre-tax vehicle purchase costs were kept constant over time for es-tablished technologies and gradually decreased for advanced andfuture technologies, thus exogenously simulating improvements inproduction costs, economies of scale and market push bymanufacturers.7 For example, average purchase prices for BEV carswere assumed to decrease by 2.8% pa from 2015 to 2020, by 1.6%pa until 2030 and 0.6% pa until 2050. The Reference scenariofurther assumed gradual improvements in specific fuel consump-tion and tailpipe CO2 emissions per distance travelled. The rates ofimprovement were based on technological innovation driven en-tirely by market competition, not on policy or regulatory push.8
Fuel consumption and CO2 improvement rates for future car vin-tages were assumed to be 1.5% pa (a somewhat lower and moreconservative rate than the average rate of 4% pa observed for allnew cars between 2008 and 2013). Indirect emissions from fuelsupply and vehicle manufacture, maintenance and scrappage havebeen updated with data from a recent UK based review (Kay et al.,2013). Finally, the default electricity generation mix follows centralgovernment projections (mainly natural gas, wind and nuclear –
with some CCC coal and gas by 2030), implying the carbon contentof retail electricity is gradually decreasing from about 390 gCO2/kWh in 2015 to about 160 gCO2/kWh in 2030 (then staying con-stant to 2050).
2.3.2. Retrospective pathways exploring unaccounted for emissionsTwo retrospective pathways coined Real World (RW) and Real
World plus Diesel Purchase Penalty (RW_DPP) were developed toassess unaccounted-for emissions from diesel cars and the widereffects on energy use and GHG emissions in the UK. First, scenarioRW simply assessed the UK-wide implications of the gap between‘official’ and ‘real world’ NOX emissions by assuming that allEURO5 and EURO6 diesel cars (not just VWs) bought and used in
6 In the UK this is called ‘vehicle excise duty’, or VED.7 The assumption that alternative technologies improve (cost, energy and en-
vironmental performance, consumer preferences) at a faster rate over time appliesequally to all scenarios modelled here, not just the reference scenario.
8 This implies that the EU mandatory agreement on new car CO2 emissionswould not be met. However, separating innovation by competition and innovationby regulation/policy push is slightly arbitrary here as the effects are never easy tountangle. It was merely assumed that half of the recent improvement came frommarket competition and the other half from policy (mainly fiscal) and regulation.
the UK since 2009 perform 4 times worse than official ratingssuggest. Thus, EURO5 diesel cars emitted on average 0.72 gNOX/km instead of 0.18 gNOX/km; and EURO6 cars emitted on average0.32 gNOX/km instead of 0.08 gNOX/km. This factor 4 is in linewith the real world test data for EURO5 cars reported in ICCT,(2014b). For EURO6 cars it is, however, on the conservative side asthe average gap between official and real word was reported to behigher at a factor of 7 (ibid). In terms of market shares, sales datafor the UK show that VW had a 20.5% market share in the UK in2013 (SMMT, 2014), so the factor 4 assumption implies that VWcars of that generation performed about 20 times worse than ex-pected – which falls into the reported range of between 5 and 35times. Any future EURO standards and performance gaps beyondEURO6 (so from about 2020 onwards) are currently uncertain, so itwas assumed that any future vintages (labelled ‘EURO7′ from 2020to 2024, ‘EURO8′ from 2025 to 2029, and so on) would meetemissions standards of at least EURO6 in ‘real world’ conditions.This was considered a reasonable assumption given the increasedefforts to improve real world performance by industry and gov-ernment and the likely tightening of standards beyond EURO6.
Second, to explore how consumers may have responded if theyhad known about the gap in emissions performance, an alternative‘what if’ scenario (RW_DPP) was developed that modelled a ‘pur-chase penalty’ of GBP 2500 for all new EURO5 diesel-fuelled cars(ICE, HEV and PHEV) from 2009 to 2015. The penalty fee ofGBP2,500 was estimated from summing up annual car mileagesover the lifetime of a vehicle (�180k kilometres over 10 years),then multiplying this by the difference in NOX emissions between‘real world’ and ‘official’ rates (0.72–0.18¼0.54 gNOX/km) and theaverage damage costs of NOX on human health of GBP 21,044 perton (Table 1) (DEFRA, 2015a). By placing a penalty at the time ofpurchasing a diesel car the study effectively explored a recent pastwith lower diesel car market shares and different energy use andemissions when compared to the ‘real world’ case (RW). The corescenarios are summarized in Table 2.
2.3.3. Forward looking pathways exploring the effects of potentialpolicy and market responses
Recent pronouncements by market analysts, city authoritiesand business leaders (e.g. BBC News, 2015; TfL, 2015) have sup-ported policy measures such as diesel scrappage fees and pro-motion of ultra-low emissions vehicles (ULEV) and a switch toelectro mobility to reduce the damage to human health by (un-derperforming) diesel cars (EurActiv, 2015b). Three further sce-narios were developed to explore future policy and market re-sponses. First, scenario REF’ depicts a ‘revised baseline’ for com-parison by assuming that all existing and future diesel cars un-derperform by a factor of 4 when compared to legislated standards(from EURO6 in 2015 onwards).9 This is at the lower end of thereported range of 4–20 times higher NOX for EURO6 type approvedprivate cars with diesel engines in city traffic and during coldweather (Hagman et al., 2015). In essence this depicts a futurewhere NOX emissions control will not be achieved as planned.Second, DPT explores the effects of a variable scrappage/purchasetax on new diesel cars, with the tax graded by the vehicle's pur-chase price and specific fuel consumption (Tax�[purchase price]*[specific fuel consumption, SFC]). In 2015, the graded tax rangedfrom approx. GBP800 for small (A/B class) diesel cars to approx.GBP2,500 for large (E-H class) ICE diesel cars, with the tax gra-dually decreasing due to improved SFC. Purchase taxes in thisrange have shown to be fairly effective in accelerating change invehicle uptake in the low carbon context (Brand et al., 2013). Third,
9 This compares to the REF case assuming that only EURO5 and EURO6 dieselcars underperformed in real world driving conditions.
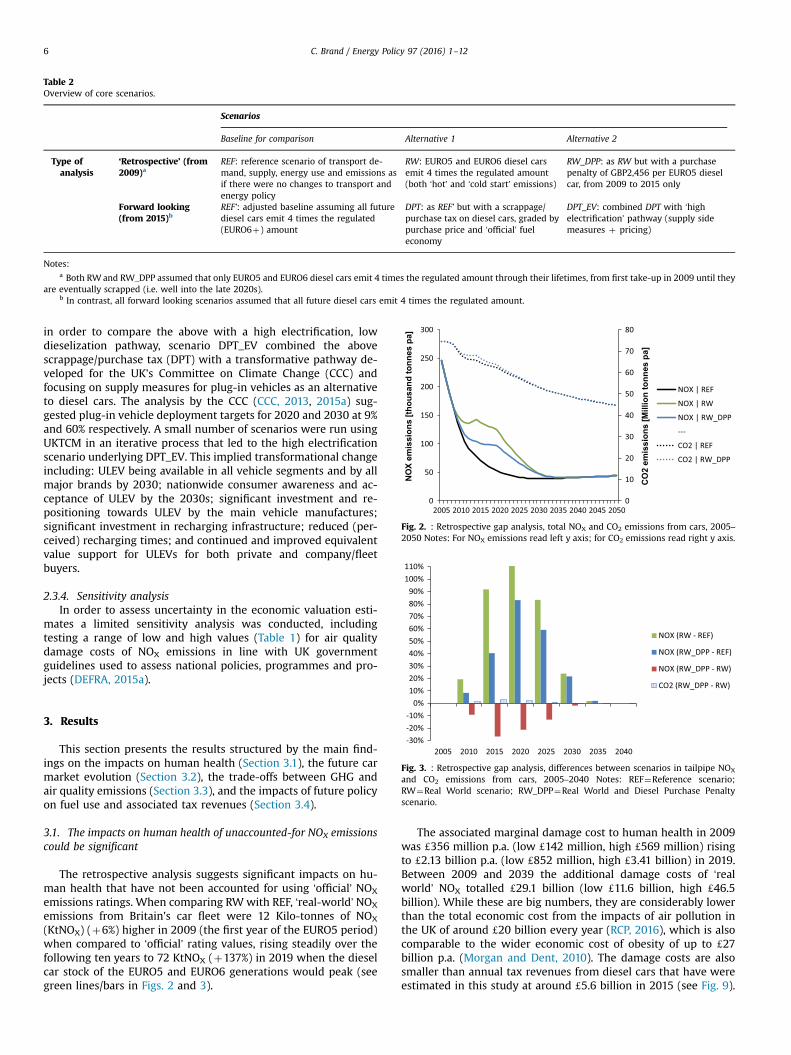
Table 2Overview of core scenarios.
Scenarios
Baseline for comparison Alternative 1 Alternative 2
Type ofanalysis
‘Retrospective’ (from2009)a
REF: reference scenario of transport de-mand, supply, energy use and emissions asif there were no changes to transport andenergy policy
RW: EURO5 and EURO6 diesel carsemit 4 times the regulated amount(both ‘hot’ and ‘cold start’ emissions)
RW_DPP: as RW but with a purchasepenalty of GBP2,456 per EURO5 dieselcar, from 2009 to 2015 only
Forward looking(from 2015)b
REF’: adjusted baseline assuming all futurediesel cars emit 4 times the regulated(EURO6þ) amount
DPT: as REF’ but with a scrappage/purchase tax on diesel cars, graded bypurchase price and ‘official’ fueleconomy
DPT_EV: combined DPT with ‘highelectrification’ pathway (supply sidemeasures þ pricing)
Notes:a Both RWand RW_DPP assumed that only EURO5 and EURO6 diesel cars emit 4 times the regulated amount through their lifetimes, from first take-up in 2009 until they
are eventually scrapped (i.e. well into the late 2020s).b In contrast, all forward looking scenarios assumed that all future diesel cars emit 4 times the regulated amount.
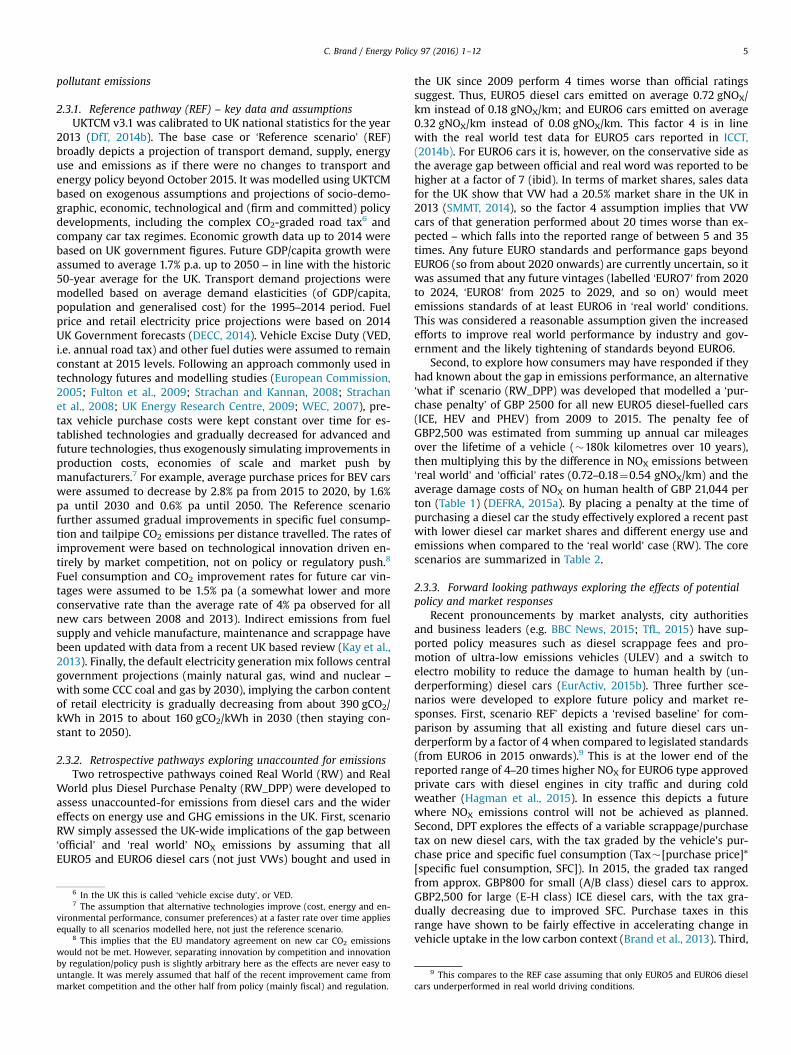
Fig. 2. : Retrospective gap analysis, total NOX and CO2 emissions from cars, 2005–2050 Notes: For NOX emissions read left y axis; for CO2 emissions read right y axis.
C. Brand / Energy Policy 97 (2016) 1–126
in order to compare the above with a high electrification, lowdieselization pathway, scenario DPT_EV combined the abovescrappage/purchase tax (DPT) with a transformative pathway de-veloped for the UK's Committee on Climate Change (CCC) andfocusing on supply measures for plug-in vehicles as an alternativeto diesel cars. The analysis by the CCC (CCC, 2013, 2015a) sug-gested plug-in vehicle deployment targets for 2020 and 2030 at 9%and 60% respectively. A small number of scenarios were run usingUKTCM in an iterative process that led to the high electrificationscenario underlying DPT_EV. This implied transformational changeincluding: ULEV being available in all vehicle segments and by allmajor brands by 2030; nationwide consumer awareness and ac-ceptance of ULEV by the 2030s; significant investment and re-positioning towards ULEV by the main vehicle manufactures;significant investment in recharging infrastructure; reduced (per-ceived) recharging times; and continued and improved equivalentvalue support for ULEVs for both private and company/fleetbuyers.
2.3.4. Sensitivity analysisIn order to assess uncertainty in the economic valuation esti-
mates a limited sensitivity analysis was conducted, includingtesting a range of low and high values (Table 1) for air qualitydamage costs of NOX emissions in line with UK governmentguidelines used to assess national policies, programmes and pro-jects (DEFRA, 2015a).
Fig. 3. : Retrospective gap analysis, differences between scenarios in tailpipe NOX
and CO2 emissions from cars, 2005–2040 Notes: REF¼Reference scenario;RW¼Real World scenario; RW_DPP¼Real World and Diesel Purchase Penaltyscenario.
3. Results
This section presents the results structured by the main find-ings on the impacts on human health (Section 3.1), the future carmarket evolution (Section 3.2), the trade-offs between GHG andair quality emissions (Section 3.3), and the impacts of future policyon fuel use and associated tax revenues (Section 3.4).
3.1. The impacts on human health of unaccounted-for NOX emissionscould be significant
The retrospective analysis suggests significant impacts on hu-man health that have not been accounted for using ‘official’ NOX
emissions ratings. When comparing RWwith REF, ‘real-world’ NOX
emissions from Britain's car fleet were 12 Kilo-tonnes of NOX
(KtNOX) (þ6%) higher in 2009 (the first year of the EURO5 period)when compared to ‘official’ rating values, rising steadily over thefollowing ten years to 72 KtNOX (þ137%) in 2019 when the dieselcar stock of the EURO5 and EURO6 generations would peak (seegreen lines/bars in Figs. 2 and 3).
The associated marginal damage cost to human health in 2009was d356 million p.a. (low d142 million, high d569 million) risingto d2.13 billion p.a. (low d852 million, high d3.41 billion) in 2019.Between 2009 and 2039 the additional damage costs of ‘realworld’ NOX totalled d29.1 billion (low d11.6 billion, high d46.5billion). While these are big numbers, they are considerably lowerthan the total economic cost from the impacts of air pollution inthe UK of around d20 billion every year (RCP, 2016), which is alsocomparable to the wider economic cost of obesity of up to d27billion p.a. (Morgan and Dent, 2010). The damage costs are alsosmaller than annual tax revenues from diesel cars that have wereestimated in this study at around d5.6 billion in 2015 (see Fig. 9).

Fig. 4. : Scenario comparison of new car sales by propulsion system Notes: REF’2015 refers to base year sales. REF’¼Reference scenario (revised); DPT¼DieselPurchase Tax scenario; DPT_EV¼Diesel Purchase Tax and EV package scenario. Theanalysis suggested no significant take up of hydrogen FCV, dedicated biofuel ICVand gas powered ICV, largely due to the assumed lack of any model/brand supply.Therefore, these propulsion systems were omitted from the chart.
Fig. 5. : Scenario comparison of total car stock by propulsion system in 2020, 2030and 2050 Note: REF’ 2015 refers to base year sales. REF’¼Reference scenario (re-vised); DPT¼Diesel Purchase Tax scenario; DPT_EV¼Diesel Purchase Tax and EVpackage scenario. The total stock of dedicated biofuel ICV, (LPG/CNG) gas poweredICV and hydrogen FCV was negligible (o10 thousand), largely due to the assumedlack of any model/brand supply. Therefore, these propulsion systems were omittedfrom the chart.
C. Brand / Energy Policy 97 (2016) 1–12 7
An emissions related purchase price premium on diesel cars (asin RW_DPP) could have avoided about 43% (a total of 419 KtNOX)of the ‘real world’ gap in NOX emissions if consumers had per-ceived diesel cars as being more damaging to health and chosenhigher shares of alternative drivetrains to diesel ICEs (NB: RW_DPPwas compared with RW here). However, a fleet with fewer dieselswould have emitted somewhat higher tailpipe CO2 emissions, withthe difference to baseline peaking at 2.2 Million tons of CO2
(MtCO2) per year in 2014 (or 3.3% of direct CO2 emissions fromcars) and summing up to 23.1 MtCO2 between 2009 and 2030. Bycomparing RW_DPP to RW (i.e. fewer diesel cars in the fleet be-tween about 2010 and 2030), the modelling suggests that theavoided damage cost to human health of d12.2 billion (low d4.6billion, high d19.5 billion) clearly outweighed the carbon costs10 ofd607 million (low d243 million, high d971 million).
3.2. A diesel purchase tax alone will not transform the car marketwithout supply side measures aimed at clean vehicles
The retrospective ‘purchase penalty’ showed a significant dropin the market share for diesel cars. While the baseline (REF)market share of new diesels rapidly increased from 27% in theearly 2000s to about 45% in 2015, it was only about 19% during thesix years the ‘purchase penalty’ was in place (RW_DPP). Most ofthe fuel shift in car purchasing was to gasoline ICV, with someshifting to gasoline HEV, resulting in the NOX and CO2 emissionschanges shown above.
When switching focus to the forward-looking scenarios, themain effect of the graded purchase/scrappage tax on diesel cars(DPT) was a moderate shift in preferences from diesel (ICV, HEV)to conventional gasoline (mainly ICV but also some HEV) and plug-in vehicles (BEV, gasoline PHEV), particularly for the more pricesensitive fleet/company car market. While diesel market shares inthe baseline scenario (REF’) stayed at just below 50% between 2015and 2050, they were somewhat lower at 35% in DPT (or 26% lowerthan the REF’ baseline), with gasoline ICV and BEV increasing theirshares by about 25% each (Fig. 4).
In contrast to DPT, the DPT_EV pathway showed a markedtransition from conventional ICV to ULEV from the mid 2020sonwards (Fig. 4). While new BEV and PHEV only made up 4% of themarket share in 2020, this had risen to nearly half of all new carsbeing plug-in (39% PHEV, 9% BEV) by 2030. By 2050, the share hadrisen further to 60% (24% PHEV, 36% BEV). In contrast, new dieselICV and diesel HEV sales dropped from nearly half in 2015–31% in2020, 20% in 2030 and 17% in 2050.
The evolution of the total car fleet is shown in Fig. 5, suggestingthat the 2020 stock will look pretty much the same as it is today.By 2030, the car fleet would include significantly fewer diesel ICVin the DPT case, and plug-in vehicles (mainly PHEV) would havetaken significant shares away from ICVs and HEVs in the DPT_EVcase. By 2050, the majority of the fleet would be plugged-in only ifthe UK adopted appropriate ULEV measures (as in DPT_EV but notin DPT). However, the modelling suggests that even higher ULEVuptake of the fleet of more than 60% is unlikely to materializewithout further policy incentives (e.g. free parking, free electricity,new business models of EV ownership and use), supply shift to EV(e.g. decreasing model/brand supply of gasoline ICV cars) andregulation (e.g. eventually banning gasoline and diesel cars in
10 Carbon valuation was based on the ‘social cost of carbon’ (SCC) that mea-sures the full cost of an incremental unit of carbon (or greenhouse gas equivalent)emitted now, calculating the full cost of the damage it imposes over the whole of itstime in the atmosphere. The SCC was preferred over market prices (e.g. EU tradingscheme) as the road transport sector is a non-traded sector. Values were taken fromUK guidance, ranging from GBP 13.5/tCO2e (Low) to 22.5 (central) and GBP 41.5/tCO2e (High).
urban areas).
3.3. Future ‘low diesel’ policies and supply measures can have sig-nificant air quality benefits while showing few (if any) carbondisbenefits
The results of the forward looking analysis suggests that po-licies designed to ‘discourage’ diesel sales and/or promote ULEV ascleaner alternatives can have significant impacts on air quality andcarbon emissions (Figs. 6 and 7). When compared to the ‘realworld’ baseline (REF’), the variable purchase/scrappage tax on newdiesel cars (DPT) resulted in moderate NOX emissions reductions,rising steadily from 1.1 KtNOX p.a. (0.8%) in 2015 – the first year ofthe policy – to around 16 KtNOX p.a. (15%) in 2025. The totalavoided marginal damage costs to human health between 2015and 2025 were d2.91 billion (low d1.04 billion, high d4.66 billion).Beyond 2025 the emissions savings levelled off then stayedroughly constant with average reductions of 18 KtNOX p.a. out to2050, indicating a saturation of the policy's main effect of fuelswitching away from diesel. In that period the annual avoideddamage cost to human health due to reduced NOX averaged d516million p.a. (low d193 million p.a., high d826 million p.a.).
To achieve higher and increasing emissions savings and avoided

Fig. 6. : Future policy analysis, total NOX and CO2 emissions from cars, 2015–2050Note: REF’¼Reference scenario (revised); DPT¼Diesel Purchase Tax scenario;DPT_EV¼Diesel Purchase Tax and EV package scenario.
Fig. 7. : Future policy analysis, differences between scenarios in car NOX and CO2
emissions, 2015–2050 Note: REF’¼Reference scenario (revised); DPT¼Diesel Pur-chase Tax scenario; DPT_EV¼Diesel Purchase Tax and EV package scenario.
C. Brand / Energy Policy 97 (2016) 1–128
damage costs beyond 2025 additional market changes, industrypush, infrastructure investment and policy pull would be requiredas explored in DPT_EV. When compared to baseline (REF’), NOX
emissions in DPT_EV were lower at 31 KtNOX p.a. (�30%) in 2030and 62 KtNOX p.a. (�55%) in 2050, by which time about threequarters of the reduction was due to the additional supply sidemeasures (Figs. 6 and 7). Between 2025 and 2050 the total avoideddamage cost of reduced NOX emissions came to a substantial d35billion (low d15 billion, high d56 billion).
In terms of carbon emissions the results showed that already inthe forward-looking baseline case (REF’) direct emissions of CO2
from cars fell substantially, from the 2015 level of 65 MtCO2 to 61MtCO2 in 2020, 53 MtCO2 in 2030 and 45 MtCO2 in 2050.11 Whilethe post-2008 economic downturn and rising fuel costs weremajor factors underlying the short term fall before 2015 (Fig. 2),the longer-term decrease of about 18% between 2015 and 2030 islargely the result of improvements in fuel efficiency and emissionsperformance of new cars penetrating the fleet and some fuelswitching to HEVs and PHEVs, thus offsetting the overall growth inthe demand for car travel. The diesel car purchase/scrappage tax(DPT) showed higher carbon emissions when compared to baseline
11 Changes in carbon emissions are the result of a number of interrelatedfactors, including the penetration of lower emission cars into the vehicle fleet,changes in demand for cars and other modes, changes in car total ownership (e.g. adecrease in total ownership means lower indirect carbon emissions from manu-facture, maintenance and scrappage) and changes in upstream fuel emissions. Forfurther details on how this is done in UKTCM see Brand (2010a/b) and Brand et al.(2012).
(REF’), with the difference first increasing to 1.0 MtCO2 by 2025then gradually decreasing to 0.2 MtCO2 by the 2040s (Fig. 7). Aswith the retrospective analysis, this was due to the lower share of(lower carbon) diesel cars in the fleet. As expected the combina-tion of the diesel purchase/ scrappage tax with the higher uptakeof ULEV in scenario DPT_EV yielded significant emissions savingsfrom 2025 onwards, gradually reducing emissions fromþ0.6 MtCO2 in 2018 to �6.4 MtCO2 in 2030 and �19.9 MtCO2 p.a.in 2050. DPT_EV thus achieved significant ‘co-benefits’ in thelonger term by incentivizing and promoting cleaner and lowercarbon alternatives to diesel cars.
As shown in the Supplementary material (S4), intra-scenariodifferences in total life cycle emissions impacts were not as sig-nificant as with direct emissions, as direct GHG emissions savingswere being offset by gradual increases in indirect GHG emissionsfrom the increase of emissions from upstream electricity genera-tion. As expected, the biggest changes came from the radical(perhaps necessary from a climate perspective) changes in sce-nario DPT_EV.
3.4. Wider impact on energy use, fuel demand and fuel tax revenues
In the short term all scenarios showed only a small increase inoverall energy use and a switch from diesel to gasoline (ICV, HEV),which can be explained by gasoline ICV being less energy efficientthan diesel ICV (Fig. 8). In the medium to longer term the mod-elling showed modest (2030) to large (2050) fuel switching anddecreases in energy consumption due to the uptake of more en-ergy efficient propulsion systems in the form of plug-in vehicles(gasoline PHEV, BEV). The diesel purchase tax þ high electrifica-tion scenario (DPT_EV) showed total fuel demand decreasing byup to 52% by 2050 when compared to 2015. This contrasts to adecrease of 31% in baseline scenario (REF’) by 2050. By 2050, dieseldemand drops from about half in the reference case (REF’) to 35%(DPT) and 26% (DPT_EV). By comparison, electricity demand growssteeply in the DPT_EV scenario, particularly in the second half ofthe period, accounting for 21% of total energy consumption by2050. However, in all scenarios, conventional fuels (gasoline þdiesel) still dominate energy use, never falling below 79% of totaldemand.
In 2014/15, about d16.2 billion were raised from cars throughroad fuel tax, which was almost entirely from the duty on gasolineand diesel of d0.61/litre (DfT, 2015). As shown in Fig. 9, the resultssuggest that the road tax revenue stream would not change muchin the short term. However, in the long term the modelling sug-gests that road tax revenues would fall sharply to about d11 billion
Fig. 8. : Pathways comparison of car transport fuel demand (in PJ) by transportfuel, 2020–2050. Note: The demand for LPG, CNG and hydrogen was negligible,largely due to the lack of any take up in the car fleet. Therefore, these fuels wereomitted from the chart. REF’¼Reference scenario (revised); DPT¼Diesel PurchaseTax scenario; DPT_EV¼Diesel Purchase Tax and EV package scenario.

Fig. 9. : Pathways comparison of fuel tax revenues from cars (in dMillion) bytransport fuel – 2015, 2020 and 2050 Note: The demand for CNG and H2 wasnegligible, largely due to the lack of any take up in the car fleet. Therefore, thesefuels were omitted from the chart. REF’¼Reference scenario (revised); DPT¼DieselPurchase Tax scenario; DPT_EV¼Diesel Purchase Tax and EV package scenario.
C. Brand / Energy Policy 97 (2016) 1–12 9
p.a. (REF’, DPT), and even lower to d6 billion p.a. in the highelectrification case (DPT_EV), which while necessary in climateterms may limit the government's ability to pay for the healthdamage costs.
4. Conclusion and policy implications
4.1. Key results: ‘real world’ excess emissions
This study has quantified the human health impacts and as-sociated costs of excess NOX emissions in the UK context andfound that the size and timespan of unaccounted-for NOX emis-sions was significant, with up to more than double the amount ofNOX in the atmosphere than official ratings suggest. This is in linewith recent studies that investigated air quality impacts of excessdiesel emissions in the UK (Beevers et al., 2012; Dunmore et al.,2015; Walton et al., 2015). It is significantly higher than the mostrecent estimates of excess emissions in the US (Barrett et al., 2015),reflecting the different vehicle fleet compositions and emissionsstandards operating in the two countries. The additional damagecosts of ‘real world’ NOX in the UK were significantly higher thanthe US estimates reported in Barrett et al. (2015), reflecting dif-ferences in methodologies (valuation of ‘indirect’ PM2.5 and ozoneonly in the US study), ‘doses’ and population densities. The impactvaluation results of this study compare to the total economic costfrom the impacts of air pollution in the UK of around d20 billionevery year (RCP, 2016), which is also comparable to the widereconomic cost of obesity of up to d27 billion p.a. (Morgan andDent, 2010). More widely, the damage costs reported here werebroadly consistent with estimates reported in a recent WHO study,which estimated the cost of disease and the premature deathsassociated with a wider set of air pollutants (incl. PM) in the UK ataround $83bn (d54bn) (Vidal, 2016; WHO, 2016). Note this in-cludes all economic sectors and modes of transport, so is expectedto be higher.
The results of the retrospective diesel ‘purchase penalty’ sug-gest a trade-off between a large decrease in local air pollutantsagainst a modest increase in climate change pollutants. This can beexplained by the significant fuel switching away from diesels inthe UK car fleet during the 2009–2015 modelling period. The re-lative size of the effects was in line with other modelling exerciseslooking at CO2 and air quality effects of policy (e.g. Leinert et al.,2013).
4.2. Key results: future policy
The finding that a diesel purchase tax is unlikely to transformthe car market without considerable supply side and tax incentivemeasures promoting ULEVs (scenario DPT_EV) contributes to thedebate on what policy options and industry investments are re-quired to meet air quality and climate mitigation goals. Whilescrappage schemes can be effective in reducing emissions (CEMT,1999; Kagawa et al., 2013), they have issues around reliance onincreasingly scarce public funds, are potentially regressive (bene-fitting the rich more than the poor), and have potential reboundeffects (Brand et al., 2013; Vaughan, 2014). A dynamic and revenueneutral ‘feebate’ system could be the better option in the mediumterm, as has been shown in a number of studies (BenDor and Ford,2006; Brand et al., 2013). Furthermore, a purchase/scrappage taxshould not counteract any CO2-graded road tax regime that typi-cally favours diesel cars due to lower CO2 ratings (Leinert et al.,2013). One solution would be to disaggregate CO2-graded taxationlevels further by fuel type, as is currently the case for new com-pany cars in the UK through differential BIK rates (HM Treasury,2015).
To achieve higher and increasing emissions savings (up to 55%less NOX and by 2050), ‘co-benefits’ (CO2 and NOX emissions re-ductions) and avoided damage costs beyond 2025 additionalmarket changes, industry push, infrastructure investment andpolicy pull would be required. The marked transition to plug-invehicles from the mid 2020s onwards explored in DPT_EV can beexplained by the underlying transformational change in a numberof areas beyond purchase price policy. First, DPT_EV implied thatEV availability would increase following existing trends, meaningthey will be widely available in all vehicle segments and by allmajor brands by 2030 (in the REF’ baseline and DPT policy sce-nario, vehicle supply stays constant at 2015 levels, implying per-ceived supply penalties). Significant investment and repositioningby the major manufactures would be required, potentially drivenby increasingly stringent new car CO2 regulation after 2020 thateventually can only be met by ULEVs (Berggren and Magnusson,2012). Second, consumer awareness and acceptance were assumedto increase significantly, with a steep increase in the 2020s (si-mulated by an S-curve) leading to 95% of potential buyers beingaware of ULEVs and their incentives by 2030, and 100% by 2040. Toachieve the critical mass for acceptance and awareness wouldinvolve require promotional campaigns, large field trials, dedicatedcar clubs and the ‘neighbour’ effect to diffuse widely and evenconvince the ‘Resistors’. Third, the scenario further assumed in-vestment in the next 15 years in high levels of overnight (mainlyoff-street) charging complemented by a national network of about2000 rapid charging points for day charging to increase the marketbase for plug-in vehicles (in particular for the fleet segment) andprovide national coverage by 2030. This effectively meant that by2030 74% of private buyers (compared to 70% in REF’/DPT) and 80%of fleet buyers (compared to 40% in REF’/DPT) would have ‘cer-tainty of access’ to charging. The investment needed would be inthe tens of millions of GBP. Fourth, with a growing fast chargingnetwork happening over time the perceived EV charging timeswere decreasing with increasing BEV power rates (assumed toincrease rapidly from 3 kW in 2015–7 kW in 2020 and then to50 kW; for PHEV, this maxed out in 2020 at 7 kW). Last, in order tomitigate the purchase price premium of ULEVs the scenario as-sumed continued and improved equivalent value support forULEVs for both private and company/fleet buyers, through capitalincentives and continuation of the CO2-graded VED that in-centivizes ULEV uptake. The plug-in car-grant was recently ex-tended to 2019 (instead of stopped after 2017) at the current rateof d5000, then reduced by half to 2024 (no grant from 2025 on-wards). In addition, the company car tax regime was revised so

C. Brand / Energy Policy 97 (2016) 1–1210
that cars emitting 50gCO2/km or less (effectively BEV and PHEV)see the 9% Benefit-in-Kind (BIK) rate (as opposed to 13–16% ascurrently planned) (HM Treasury, 2015).
The results contribute to the growing body of evidence thatwhile the health and environmental benefits related to fuelswitching can be significant, the pace and scale of achieving thosebenefits is somewhat uncertain (Åström et al., 2013; van derZwaan et al., 2013), particularly in the UK context where theprojected deep decarbonisation of the electricity system over thelonger term may prove difficult to achieve (Buekers et al., 2014).However, lower carbon content of future road electricity is the keycomponent that drives the carbon reductions in DPT_EV. Whilethe UK Government does not expect London and other AQ ‘hot-spots’ to meet legal pollution levels until at least 2025 (DEFRA,2015a), ambitious taxation policy and further investment in elec-trified mobility will play important roles in meeting those targetsin the medium term. However, this result cannot easily be trans-lated to other countries which rely more on higher carbon (coalfired) power stations that can offset the life cycle carbon andhealth benefits of replacing diesel ICV with plug-in cars (Baptistaet al., 2012).
Finally, fuel tax remains an important policy instrument(Montag, 2015) and source of government revenue (HM Treasury,2015). While the UK already taxes diesel and gasoline at the samerate per litre, diesel is taxed 10% less per unit of energy (TandE,2015a). Electricity is only taxed through VAT (currently 20% forroad transport). This suggests there may be a case for revising thefuel taxation regime taking into account energy, CO2 and airquality impacts – not just those associated with NOX but also PM.In the longer run, the reductions in fuel duty revenues in all futurescenarios can be explained by the take-up and use of more fuelefficient cars and, in the DPT_EV case, the zero duty on electricityas a road transport fuel. The latter issue has been recognised bythe UK Government and other countries around the world – and itis expected that once plug-in vehicles make up significant marketshares, electricity as a transport fuel will have to be taxed ac-cordingly, with expected rebound effects on take up rates. How-ever, as shown in a recent study for the UK (Brand et al., 2013), afuel duty on electricity of 5 pence per kWh (roughly the gasoline-equivalent to the current duty rate for gasoline) would show re-latively small reductions in plug-in vehicle uptake – reflecting thecomparative energy efficiency advantage of electric drivetrains.
4.3. Outlook and future work
The approach used for this study contributes to the growingconsensus that regulation and emissions budgeting based ontailpipe emissions is increasingly no longer fit for purpose andshould be changed to be based on well-to-wheel, and ultimatelylife cycle, emissions (IEA, 2013). Currently the average fuel lifecycle greenhouse gas (GHG) saving for a BEV over its full life hasbeen estimated at about 50% under UK conditions – that is, withthe current mix of grid electricity generation (Kay et al., 2013). Thiscould increase to 75% in 2020 and to 83% by 2030 with the an-ticipated decarbonisation of grid electricity. Also, vehicle life cycleemissions (from manufacture, maintenance and scrappage) addsignificantly to emissions from vehicle use (IEA, 2013; Lane, 2006;MacLean and Lave, 2003) and can be significantly higher for BEVand PHEV than for ICV (Baptista et al., 2012; Kay et al., 2013).
Further work is required in exploring sensitivities around ‘real-world’ vehicle emissions factors of other pollutants affecting hu-man health, most notably PM and hydrocarbons. While this paperfocused on Dieselgate and related NOX pollution and standards itis important to note that the inclusion in the damage cost calcu-lation of other pollutants, notably PM, may change the damagecost values. Since total multi-pollutant valuations were likely to
increase the totals, the figures reported in this study could beconsidered on the conservative side. Further work could also in-vestigate the acceptance of various vehicle propulsion systems bya wider set of the heterogeneous fleet/company market actors.This could be achieved by employing Monte Carlo analysis, whichcan help analyse the propagation of multiple uncertainties in anintegrated transport-energy-environment modelling system suchas UKTCM (Int Panis et al., 2004).
4.4. Final thoughts
The policy and industry response in the aftermath of the ‘Die-selgate’ affair is in full swing. However, there are concerns inEurope whether more realistic ‘real world’ emissions test cycleswill be approved and implemented anytime soon, and that theEuropean Commission's car emissions testing may not have ‘themuscle like US watchdog’ (Stupp, 2016). Some of the major dieselcar manufacturers have agreed to cooperate on real-world emis-sions testing and reductions, including Peugeot Citroen (TandE,2015b) and Renault (AFP, 2016). The regulatory response should gohand in hand with further development of technological solutionsto meet NOX standards. These have been available for some time,including cooled exhaust gas recirculation, lean NOX traps or se-lective catalytic reduction with ammonia (Bertelsen, 2001; Faizet al., 1996; Sanchez et al., 2012). Manufacturers are usuallychosing the NOx aftertreatment technology based on a combina-tion of cost, reliability, fuel economy, and consumer acceptance.
By assessing the potential impact of different policy approachesand consumer responses to the ‘de-dieselization’ (Leinert et al.,2013) of cars, this study contributes to the growing consensus(Barrett et al., 2015; Carrington, 2016; Walton et al., 2015;Woodcock et al., 2009) that future policy may have to go the extramile (pun not intended) by promoting additional market changes,industry push, infrastructure investment and policy pull in orderto achieve the emissions savings, ‘co-benefits’ and avoided damagecosts of a range of pollutants required to meet climate, air qualityand health damage goals. Given the UK's strategic commitments tomeeting its stringent climate objectives and realisation that this islikely to be achieved by a pathway similar to DPT_EV (CCC, 2015a),NOX and other air quality pollutant emissions may be significantlyreduced providing significant ‘co-benefits’.
Acknowledgement
This research was funded by the UK Research Councils (Grantno: EPSRC EP/L024756/1) as part of the Decision Making Theme ofthe UK Energy Research Centre Phase 3. I want to thank the twoanonymous reviewers for the constructive comments and sug-gestions which were a great help to improve the manuscript.
Appendix A. Supplementary material
Supplementary data associated with this article can be found inthe online version at http://dx.doi.org/10.1016/j.enpol.2016.06.036.
References
AEA Technology, 2009. Market Outlook to 2022 for Battery Electric Vehicles andPlug-in Hybrid Electric Vehicles, Final Report to the Committee on ClimateChange, ED46299. AEA Technology, Didcot.
AFP, 2016. Renault promises plan to bring down emissions from diesel vehicles. TheGuardian,, London ⟨http://www.theguardian.com/environment/2016/jan/18/renault-promises-plan-to-bring-down-emissions-from-diesel-vehicles⟩ (lastaccessed 19.01.16).

C. Brand / Energy Policy 97 (2016) 1–12 11
Anable, J., Brand, C., Eyre, N., Layberry, R., Bergman, N., Strachan, N., Fawcett, T.,Tran, M., 2011. Energy 2050 – WG1 Energy Demand: Lifestyle and EnergyConsumption, Working Paper REF: UKERC/WP/ED/2011/001. UK Energy Re-search Centre (UKERC), Energy Demand Theme, Oxford.
Anable, J., Brand, C., Tran, M., Eyre, N., 2012. Modelling transport energy demand: asocio-technical approach. Energy Policy 41, 125–138.
Åström, S., Tohka, A., Bak, J., Lindblad, M., Arnell, J., 2013. Potential impact on airpollution from ambitious national CO2 emission abatement strategies in theNordic countries – environmental links between the UNFCCC and the UNECE –
CLRTAP. Energy Policy 53, 114–124.Baptista, P.C., Silva, C.M., Farias, T.L., Heywood, J.B., 2012. Energy and environmental
impacts of alternative pathways for the Portuguese road transportation sector.Energy Policy 51, 802–815.
Barrett, S.R.H., Speth, R.L., Eastham, S.D., Dedoussi, I.C., Ashok, A., Malina, R., Keith,D.W., 2015. Impact of the Volkswagen emissions control defeat device on USpublic health. Environ. Res. Lett. 10, 114005.
Bastani, P., Heywood, J.B., Hope, C., 2012. The effect of uncertainty on US transport-related GHG emissions and fuel consumption out to 2050. Transp. Res.: Part A:Pol. Pract. 46, 517–548.
BBC News, 2015. Diesel Cars Are ‘Killing People’, Says Former Labour Minister. BBC,London.
Beevers, S.D., Westmoreland, E., de Jong, M.C., Williams, M.L., Carslaw, D.C., 2012.Trends in NOx and NO2 emissions from road traffic in Great Britain. Atmos.Environ. 54, 107–116.
BenDor, T., Ford, A., 2006. Simulating a combination of feebates and scrappageincentives to reduce automobile emissions. Energy 31, 1197–1214.
Berggren, C., Magnusson, T., 2012. Reducing automotive emissions—the potentialsof combustion engine technologies and the power of policy. Energy Policy 41,636–643.
BERR & DfT, 2008. Investigation into the Scope for the Transport Sector to Switch toElectric Vehicles and Plug-in Hybrid Vehicles. Department For Business En-terprise and Regulatory Reform (BERR) & Department for Transport (Dft), TheStationary Office, London.
Bertelsen, B.I., 2001. The U.S. motor vehicle emission control programme. Platin.Met. Rev. 45, 50–59.
Bickel, P., Schmid, S., Tervonen, J., Hämekoski, K., Otterström, T., Anton, P., Enei, R.,Leone, G., van Donselaar, P., Carmigchelt, H., 2003. Environmental MarginalCost Studies. Deliverable 11 UNITE. European Commission 5th FrameworkTransport RTD.
BNEF, 2016. Electric Vehicles to be 35% of Global New Car Sales by 2040. BloombergNew Energy Finance, London and New York ⟨http://about.bnef.com/press-releases/electric-vehicles-to-be-35-of-global-new-car-sales-by-2040/⟩ (last ac-cessed 25.02.16).
Brand, C., 2010. UK Transport Carbon Model: Reference Guide v1.0. UK EnergyResearch Centre, Energy Demand Theme,, Oxford (available for download at)⟨http://www.ukerc.ac.uk/programmes/energy-demand/uk-transport-carbon-model.html⟩.
Brand, C., Anable, J., Tran, M., 2013. Accelerating the transformation to a low carbonpassenger transport system: the role of car purchase taxes, feebates, road taxesand scrappage incentives in the UK. Transp. Res. : Part A: Pol. Pract. 49,132–148.
Brand, C., Tran, M., Anable, J., 2012. The UK transport carbon model: an integratedlife cycle approach to explore low carbon futures. Energy Policy 41, 107–124.
Brook Lyndhurst, 2015. Uptake of Ultra Low Emission Vehicles in the UK, A RapidEvidence Assessment for the Department for Transport. Brook Lyndhurst Ltd.for the Department For Transport, London.
Buekers, J., Van Holderbeke, M., Bierkens, J., Int Panis, L., 2014. Health and en-vironmental benefits related to electric vehicle introduction in EU countries.Transp. Res. : Part D: Transp. Environ. 33, 26–38.
Carrington, D., 2016. The truth about London’s air pollution. The Guardian,, London⟨http://www.theguardian.com/environment/2016/feb/05/the-truth-about-londons-air-pollution⟩ (last accessed 06.02.16).
CCC, 2013. Fourth Carbon Budget Review – Technical Report, Sectoral Analysis ofthe Cost-effective Path to the 2050 Target. Committee On Climate Change(CCC), London.
CCC, 2015a. Meeting Carbon Budgets – Progress in Reducing the UK's Emissions,2015 Report to Parliament. Committee On Climate Change (CCC), London.
CCC, 2015b. Quantifying the Impact of Real-world Driving on Total CO2 Emissionsfrom UK Cars and Vans. Element Energy And ICCT For The Committee On Cli-mate Change, London.
Cellan-Jones, R., 2015. Diesel Cars Are ‘killing people’, Says Former Labour minister.BBC Online. BBC, London ⟨http://www.bbc.co.uk/news/business-34407670⟩(last accessed 05.02.16).
CEMT, 1999. Conclusions and Recommendations on Scrappage Schemes and TheirRole in Improving the Environmental Performance of the Car Fleet, (Retrievedat): ⟨http://www.cemt.org/topics/env/CM9926Fe.pdf⟩. Conférence Européennedes Ministres des Transports (CEMT), Paris.
Creutzig, F., 2015. Evolving narratives of low-carbon futures in transportation.Transp. Rev., 1–20.
DECC, 2014. Updated Energy & Emissions Projections – September 2014, Annex M:Growth assumptions and prices. Department Of Energy And Climate Change,London.
DEFRA, 2015a. Air Quality: Economic Analysis. Department For Environment, Food& Rural Affairs,, London.
DEFRA, 2015a. Improving Air Quality in The UK – Tackling Nitrogen Dioxide in OurTowns and Cities. Department For Environment, Food & Rural Affairs,, London.
DEFRA, 2015b. Improving air quality in The UK – Tackling Nitrogen Dioxide in OurTowns and Cities: List of UK and National Measures. Department For En-vironment, Food & Rural Affairs,, London.
Dehmer, D., 2015. Volkswagen Not Alone in Failing Emissions Tests. Der Tages-spiegel,, Berlin ⟨http://www.euractiv.com/sections/health-consumers/volkswagen-not-alone-failing-emission-tests-318076⟩ (last accessed 11.11.15).
DfT, 2014a. Transport Analysis Guidance: WebTAG. Department For Transport,London ⟨https://www.gov.uk/guidance/transport-analysis-guidance-webtag⟩.
DfT, 2014b. Transport Statistics Great Britain 2014. Department For Transport,London.
DfT, 2015. Transport Statistics Great Britain, 2015 edition. Department For Trans-port, London.
Dunmore, R.E., Hopkins, J.R., Lidster, R.T., Lee, J.D., Evans, M.J., Rickard, A.R., Lewis, A.C., Hamilton, J.F., 2015. Diesel-related hydrocarbons can dominate gas phasereactive carbon in megacities. Atmos. Chem. Phys. 15, 9983–9996.
EC, 2005. ExternE: Externalities of Energy, Methodology 2005 Update. EuropeanCommission, Directorate-General For Research, Sustainable Energy Systems,Brussels.
EEA, 1998. COPERT II: Computer Programme to calculate Emissions from RoadTransport, Users Manual. European Topic Centre on Air and Climate Change.European Environment Agency (EEA), Copenhagen.
EEA, 2000. COPERT III: Computer Programme to Calculate Emissions from RoadTransport – Methodology and Emission Factors (Version 2.1), Technical reportNo 49. European Topic Centre on Air and Climate Change. European Environ-ment Agency (EEA),, Copenhagen.
EEA, 2015. Air Quality in Europe � 2015 report. EEA (European EnvironmentAgency),, Copenhagen.
Element Energy, 2013. Pathways to High Penetration of Electric Vehicles – Finalreport. Element Energy Ltd, Ecolane And University Of Aberdeen For TheCommittee On Climate Change,, Cambridge.
EurActiv, 2015a. Berlin Seeks to Spark e-mobility with €5000 Incentive. Euractiv,,Brussels ⟨http://www.euractiv.com/sections/energy/berlin-seeks-spark-e-mobility-eu5000-incentive-321022⟩ (last accessed 13.01.16).
EurActiv, 2015b. VW’s ‘dieselgate’ puts spotlight on electric cars in Germany. Eur-activ,, EurActiv, Brussels ⟨http://www.euractiv.com/sections/transport/vws-dieselgate-puts-spotlight-electric-cars-germany-318960⟩.
European Commission, 2005. World Energy Technology Outlook � 2050 (WETO-H2). European Commission,, Luxembourg.
Faiz, A., Weaver, C.S., Walsh, M.P., 1996. Air Pollution from Motor Vehicles: Stan-dards and Technologies for Controlling Emissions. The World Bank, WashingtonDC.
Fontes, T., Pereira, S.R., 2014. Impact assessment of road fleet transitions on emis-sions: the case study of a medium European size country. Energy Policy 72,175–185.
Fulton, L., Cazzola, P., Cuenot, F., 2009. IEA Mobility Model (MoMo) and its use inthe ETP 2008. Energy Policy 37, 3758–3768.
Hagman, R., Weber, C., Amundsen, A.H., 2015. Emissions From New Vehicles –
Trustworthy? TØI Report 1407/2015. TØI (Institute Of Transport Economics),Norway and VTT, Finland.
Hickman, J., Hassel, D., Joumard, R., Samaras, Z., Sorenson, S., 1999. MEET - Meth-odology for calculating transport emissions and energy consumption, TRL Re-port no. PR/SE/491/98. TRL, Crowthorne, p. 362.
HM Treasury, 2015. Budget March 2015. HM Treasury, London.ICCT, 2014a. From Laboratory to Road: a 2014 Update of Official and “real-world”
Fuel Consumption and CO2 Values for Passenger Cars in Europe. InternationalCouncil On Clean Transportation (ICCT), Berlin.
ICCT, 2014b. Real-World Exhaust Emissions from Modern Diesel Cars. InternationalCouncil On Clean Transportation (ICCT), Berlin.
ICO, 2006. ISO 14040: Environmental management – Life cycle assessment –Principles and Framework. International Organisation For Standardisation(ISO), Geneva.
IEA, 2013. Life Cycle Assessment of EVs, Task 19. International Energy Agency, Paris,Retrieved 26 March 2015 from ⟨http://www.ieahev.org/tasks/task-19-life-cycle-assessment-of-evs⟩.
INFRAS, 2004. Handbook Emission Factors for Road Transport (HBEFA), version 2.1.INFRAS, Bern (CH).
Int Panis, L., De Nocker, L., Cornelis, E., Torfs, R., 2004. An uncertainty analysis of airpollution externalities from road transport in Belgium in 2010. Sci. Total En-viron. 334–335, 287–298.
Kagawa, S., Hubacek, K., Nansai, K., Kataoka, M., Managi, S., Suh, S., Kudoh, Y., 2013.Better cars or older cars? Assessing CO2 emission reduction potential of pas-senger vehicle replacement programs. Glob. Environ. Change 23, 1807–1818.
Kay, D., Hill, N., Newman, D., 2013. Powering Ahead: The Future of Low-carbon Carsand Fuels. Ricardo-AEA For The RAC Foundation and UKPIA, London.
Kollewe, J., 2015a. UK Government Wrong to Subsidise Diesel, says former minister.The Guardian, London ⟨http://www.theguardian.com/business/2015/oct/01/uk-government-wrong-to-subsidise-diesel-says-former-minister⟩ (last accessed05.10.15.
Kollewe, J., 2015b. UK Government Wrong to Subsidise Diesel, Says Former Min-ister. The Guardian, London.
Lane, B., 2006. Life Cycle Assessment of Vehicle Fuels and Technologies, Final Reportincluding Appendices. Ecolane Transport Consultancy, Bristol.
Lau, C.F., Rakowska, A., Townsend, T., Brimblecombe, P., Chan, T.L., Yam, Y.S.,Močnik, G., Ning, Z., 2015. Evaluation of diesel fleet emissions and controlpolicies from plume chasing measurements of on-road vehicles. Atmos. En-viron. 122, 171–182.
http://www.euractiv.com/sections/health-consumers/volkswagen-not-alone-failing-emission-tests-318076

C. Brand / Energy Policy 97 (2016) 1–1212
Leinert, S., Daly, H., Hyde, B., Gallachóir, B.Ó., 2013. Co-benefits? Not always:quantifying the negative effect of a CO2-reducing car taxation policy on NOxemissions. Energy Policy 63, 1151–1159.
Macharis, C., Bernardini, A., 2015. Reviewing the use of Multi-Criteria DecisionAnalysis for the evaluation of transport projects: time for a multi-actor ap-proach. Transp. Policy 37, 177–186.
MacLean, H.L., Lave, L.B., 2003. Life cycle assessment of automobile/fuel options.Environ. Sci. Technol. 37, 5445–5452.
Marheineke, T., Friedrich, R., Krewitt, W., 1998. Application of a Hybrid Approach tothe Life Cycle Inventory Analysis of a Freight Transport Task, SAE TechnicalPaper Series 982201. Society Of Automotive Engineers (SAE), Warrendale, PA.
Michiels, H., Mayeres, I., Int Panis, L., De Nocker, L., Deutsch, F., Lefebvre, W., 2012.PM2.5 and NOx from traffic: human health impacts, external costs and policyimplications from the Belgian perspective. Transp. Res. : Part D: Transp. En-viron. 17, 569–577.
Montag, J., 2015. The simple economics of motor vehicle pollution: a case for fueltax. Energy Policy 85, 138–149.
Morgan, E., Dent, M., 2010. The Economic Burden of obesity. National ObesityObservatory, National Health Service, Oxford.
Mulley, C., Tyson, R., McCue, P., Rissel, C., Munro, C., 2013. Valuing active travel:including the health benefits of sustainable transport in transportation ap-praisal frameworks. Res. Transp. Bus. Manag. 7, 27–34.
NETCEN, 2003. Vehicle Speed Emission Factors (Version 02/3). NETCEN, AEATechnology Plc For DEFRA, Harwell ⟨http://www.naei.org.uk/other/vehicle_emissions_v8.xls⟩, last accessed 20.10.05.
Offer, G.J., Contestabile, M., Howey, D.A., Clague, R., Brandon, N.P., 2011. Techno-economic and behavioural analysis of battery electric, hydrogen fuel cell andhybrid vehicles in a future sustainable road transport system in the UK. EnergyPolicy 39, 1939–1950.
Ogden, J.M., Williams, R.H., Larson, E.D., 2004. Societal lifecycle costs of cars withalternative fuels/engines. Energy Policy 32, 7–27.
Oxley, T., ApSimon, H.M., de Nazelle, A., 2015. Investigating the sensitivity of healthbenefits to focussed PM2.5 emission abatement strategies. Environ. Model.Softw. 74, 268–283.
Oxley, T., Dore, A.J., ApSimon, H., Hall, J., Kryza, M., 2013. Modelling future impactsof air pollution using the multi-scale UK Integrated Assessment Model(UKIAM). Environ. Int. 61, 17–35.
Oxley, T., Elshkaki, A., Kwiatkowski, L., Castillo, A., Scarbrough, T., ApSimon, H.,2012. Pollution abatement from road transport: cross-sectoral implications,climate co-benefits and behavioural change. Environ. Sci. Policy 19–20, 16–32.
Oxley, T., Valiantis, M., Elshkaki, A., ApSimon, H.M., 2009. Background, Road andUrban Transport modelling of Air quality Limit values (The BRUTAL model).Environ. Model. Softw. 24, 1036–1050.
Rabl, A., Holland, M., 2008. Environmental assessment framework for policy ap-plications: Life cycle assessment, external costs and multi-criteria analysis. J.Environ. Plan. Manag. 51, 81–105.
Rabl, A., Spadaro, J.V., Holland, M., 2014. How much is clean air worth?: Calculatingthe benefits of pollution control.
RCP, 2016. Every breath we take: the lifelong impact of air pollution, Report of aworking party, last accessed at ⟨https://www.rcplondon.ac.uk/projects/outputs/every-breath-we-take-lifelong-impact-air-pollution⟩ on 10/06/2016. Royal Col-lege of Physicians (RCP), London.
Rogan, F., Dennehy, E., Daly, H., Howley, M., Gallachóir, B.P, Ó., 2011. Impacts of anemission based private car taxation policy – First year ex-post analysis. Transp.Res.: Part A: Pol. Pract. 45, 583–597.
Sanchez, F.P., Bandivadekar, A., German, J., 2012. Estimated Cost of Emission Re-duction Technologies for Light-Duty Vehicles. International Council On CleanTransportation, Washington DC.
Schipper, L., 2011. Automobile use, fuel economy and CO2 emissions in in-dustrialized countries: encouraging trends through 2008? Transp. Policy 18,358–372.
Sheffield, H., 2015. Volkswagen emissions scandal: 1.2 million UK vehicles affected,company admits. The Independent, London (last accessed 30.09.15 ⟨http://www.independent.co.uk/news/business/news/volkswagen-emissions-scandal-12-million-uk-vehicles-affected-company-admits-a6673331.html⟩.
Shen, X., Yao, Z., Zhang, Q., Wagner, D.V., Huo, H., Zhang, Y., Zheng, B., He, K., 2015.Development of database of real-world diesel vehicle emission factors forChina. J. Environ. Sci. 31, 209–220.
SMMT, 2014. New Car CO2 Report 2014: The 13th report. The Society Of MotorManufacturers And Traders (SMMT), London.
SMMT, 2016. UK New Car Market Starts 2016 on a High With Best January in 11years. SMMT, London ⟨http://www.smmt.co.uk/2016/02/uk-new-car-market-starts-2016-on-a-high-with-best-january-in-11-years/⟩ (last accessed on18.01.16).
Sperling, D., Yeh, S., 2010. Toward a global low carbon fuel standard. Transp. Policy17, 47–49.
Strachan, N., Kannan, R., 2008. Hybrid modelling of long-term carbon reductionscenarios for the UK. Energy Econ. 30, 2947–2963.
Strachan, N., Kannan, R., Pye, S., 2008. Scenarios and Sensitivities on Long-term UKCarbon Reductions using the UK MARKAL and MARKAL-Macro Energy SystemModels. UK Energy Research Centre (UKERC), London.
Stupp, C., 2016. Commission Car Emissions Testing Won’t Have Muscle like USWatchdog. Euractiv.Com, Brussels ⟨http://www.euractiv.com/section/transport/news/commissioncaremissionstestingwonthavemusclelikeuswatchdog/⟩ (lastaccessed 26.02.16).
T&E, 2015a. Europe's Tax Deals for Diesel. Transport & Environment, Brussels⟨http://www.transportenvironment.org/sites/te/files/publications/2015_10_Europes_tax_deals_for_diesel_FINAL.pdf⟩ (last accessed 07.02.16.
T&E, 2015a. Mind the Gap 2015: Closing the Chasm Between Test and Real-worldCar CO2 Emissions. European Federation For Transport & Environment, Brussels.
T&E, 2015b. Peugeot Citroën and T&E to Cooperate on Real-world Emissions Test-ing. European Federation For Transport & Environment, Brussels ⟨http://www.transportenvironment.org/news/peugeot-citro%C3%ABn-and-te-cooperate-real-world-emissions-testing⟩ (last accessed on 09.12.15.
TfL, 2015. Mayor and TfL Finalise Ulez Requirements for Taxi and Minicab Trades.Transport For London, London.
UK EAC, 2015. Environmental Audit Committee Response to Defra Consultation onAir Quality. UK Environmental Audit Committee, London.
UK Energy Research Centre, 2009. Making the Transition to a Secure and Low-carbon Energy System: Synthesis Report. UK Energy Research Centre, London.
van der Zwaan, B., Keppo, I., Johnsson, F., 2013. How to decarbonize the transportsector? Energy Policy 61, 562–573.
Vaughan, A., 2014. Boris Johnson’s Diesel Car Scrappage Scheme Could Cost d300m.The Guardian, London.
Vaughan, A., 2016. Cutting Diesel Pollution Puts Climate Change Target at Risk, saysVW UK chief. The Guardian, London ⟨http://www.theguardian.com/environment/2016/jan/13/cutting-diesel-pollution-puts-climate-change-target-at-risk-says-vw-uk-chief⟩ (last accessed 13.01.16).
Vidal, J., 2016. Air Pollution: a Dark Cloud of Filth Poisons the World's Cities. TheGuardian, London ⟨http://www.theguardian.com/global-development/2016/jan/16/winter-smog-hits-worlds-cities-air-pollution-soars⟩ (last accessed18.01.16).
Walton, H., Dajnak, D., Beevers, S., Williams, M., Watkiss, P., Hunt, A., 2015. Un-derstanding the Health Impacts of Air Pollution in London. King’S CollegeLondon, for Transport for London and The Greater London Authority, London.
WEC, 2007. Transport Technologies and Policy Scenarios to 2050. World EnergyCouncil (WEC), London, UK.
Weiss, M., Bonnel, P., Kühlwein, J., Provenza, A., Lambrecht, U., Alessandrini, S.,Carriero, M., Colombo, R., Forni, F., Lanappe, G., Le Lijour, P., Manfredi, U.,Montigny, F., Sculati, M., 2012. Will Euro 6 reduce the NOx emissions of newdiesel cars? – Insights from on-road tests with Portable Emissions Measure-ment Systems (PEMS). Atmos. Environ. 62, 657–665.
WHO, 2016. Burden of disease from ambient and household air pollution. WHO,Copenhagen ⟨http://www.who.int/phe/health_topics/outdoorair/databases/en/⟩ (last accessed 21.01.16).
Woodcock, J., Edwards, P., Tonne, C., Armstrong, B.G., Ashiru, O., Banister, D., Be-evers, S., Chalabi, Z., Chowdhury, Z., Cohen, A., Franco, O.H., Haines, A., Hick-man, R., Lindsay, G., Mittal, I., Mohan, D., Tiwari, G., Woodward, A., Roberts, I.,2009. Public health benefits of strategies to reduce greenhouse-gas emissions:urban land transport. Lancet 374, 1930–1943.
Yeomans, J., 2015. VW Scandal Latest: Volkswagen Prepares to Fix 11 MillionEmissions-Cheating Cars. The Telegraph, London ⟨http://www.telegraph.co.uk/finance/newsbysector/industry/11898128/VW-scandal-2-million-emissions-cheating-cars-built-in-Hungary-as-investigations-widen.html⟩ (lastaccessed 30.09.15).
http://www.smmt.co.uk/2016/02/uk-new-car-market-starts-2016-on-a-high-with-best-january-in-11-years/