Beyond 40 Acres & A Mule Marketing to the African American Community.
35
Beyond 40 Acres & A Mule Marketing to the African American Community
-
Upload
aldous-hutchinson -
Category
Documents
-
view
212 -
download
0
Transcript of Beyond 40 Acres & A Mule Marketing to the African American Community.

Today’s agenda1. Background & Demographics
2. Understanding the Culture
3. Key Strategy: Education
4. Branding
5. Moving Forward

U.S. Population
U.S. Population: 301,668,896
African American: 38,521,431 (12.87%)
Source: U.S. Bureau of the Census, February 2007

Buying Power
The African American buying power will rise from $316 billion in 1990 to $723 billion in 2007, to 965 billion in 2009.
A 203% increase over 19 years

African AmericanDemographics Quick Facts
African Americans are the 3rd largest ethnic group in the U.S. behind the Hispanic populations
39.2 M African Americans currently in the U.S.
Estimated African American Population
15% of total U.S. population by 2050
Education 1.1 M had advanced degrees in 2004 (a 62% increase since 1994)
Buying Power $921 Billion by 2008 and will exceed $1 Trillion by 2010
Median age for first-time homebuyers
36
Homeownership 48% of African Americans own their own homes
94% of the African American population is ‘native to the U.S.’ (Born in the U.S.)

Between 2000-2020 more than 80% of the US population growth will be Latino, Asian Pacific Islander or African-American.
African Americans are the 3rd largest ethnic group in the U.S.
By 2010, purchasing power within the African American Community will reach over 965 billion US dollars.
The average age of an African American homebuyer is 36, compared to 32 in Caucasians.
Key Demographics

Households by Race
2006 White Black Asian Hispanic
Households by Race 94,092,671
13,541,438
3,800,754
11,493,418
Percentage Change White Black Asian Hispanic
Households by Race 5.81% 7.90% 15.40% 16.23%
2011 White Black Asian Hispanic
Households by Race99,558,90
414,610,95
74,386,0
3513,358,85
8

White
Asian and Pacific Islander
Hispanic or Latino (of any
race)Black or African
American OthersTwo or
more races Total
Population by Race in number 2,989,235 142,535 379,034 60,985 40,553 88,416 3,700,758Percentage of population by race 80.8% 3.9% 10.2% 1.6% 1.1% 2.4% 100%
References: U.S. Census Bureau; American Factfinder 2006 Data
Oregon 2006 Population Data
3.9%10.2%
1.6% 1.1% 2.4%
80.8%
0%
10%
20%
30%
40%
50%
60%
70%
80%
90%
Races & Ethnicity
Po
pu
lati
on
in
%
White Asian and Pacific Islander Hispanic or Latino (of any race)
Black or African American Others Two or more races

White
Asian and Pacific Islander
Hispanic or Latino (of any
race)Black or African
American OthersTwo or More
Races Total
Population by Race in 2006 2,989,235 142,535 379,034 60,985 40,553 88,416 3,700,758
Population by Race in 1990 2,579,732 67,422 112,707 44,982 37,478 - 2,842,321
Population changed 409,503 75,113 266,327 16,003 3,075 - 858,437Growth % 15.9% 111.4% 236.3% 35.6% 8.2% - 30.2%
References: U.S. Census Bureau; American Factfinder 1990 & 2006 Data
Oregon Population Growth Changed 1990-2006
111.4%
35.6%
15.9%
236.3%
0%
50%
100%
150%
200%
250%
Races & Ethnicity
Po
pu
lati
on
in %
White Asian and Pacific Islander Hispanic or Latino (of any race) Black or African American

White
Asian and Pacific Islander
Hispanic or Latino (of any
race)Black or African
American OthersTwo or
more races Total
Population by Race in number 396,942 39,853 48,500 35,136 4,926 14,593 539,950Percentage of population by race 73.5% 7.4% 9.0% 6.5% 0.9% 2.7% 100%
References: U.S. Census Bureau; American Factfinder 2006 Data
Portland City, Oregon 2006 Population Data
7.4% 9.0%6.5%
0.9% 2.7%
73.5%
0%
10%
20%
30%
40%
50%
60%
70%
80%
90%
Races & Ethnicity
Po
pu
lati
on
in
%
White Asian and Pacific Islander Hispanic or Latino (of any race)
Black or African American Others Two or more races

White
Asian and Pacific Islander
Hispanic or Latino (of any
race)Black or African
American OthersTwo or
more races Total
Population by Race in 2006 396,942 39,853 48,500 35,136 4,926 14,593 539,950
Population by Race in 1990 362,503 22,641 13,874 32,842 5,459 - 437,319
Population Changed 34,439 17,212 34,626 2,294 -533 - 102,631Growth % 9.5% 76.0% 249.6% 7.0% -9.8% - 23.5%
References: U.S. Census Bureau; American Factfinder 2006 Data
Portland City, Oregon Population Changed 1990-2006
76.0%
249.6%
7.0%9.5%
0%
50%
100%
150%
200%
250%
Races & Ethnicity
Po
pu
lati
on
in %
White Asian and Pacific Islander Hispanic or Latino (of any race) Black or African American

White Alone
Asian and Pacific
Islander Alone
Hispanic or Latino (of any
race)Black or African American Alone Others
Two or more races Total
Population by Race in number 4,886,203 445,577 580,027 211,333 96,005 176,653 6,395,798Percentage of population by race 76.4% 7.0% 9.1% 3.3% 1.5% 2.8% 100%
References: U.S. Census Bureau; American Factfinder 2006 Data
Washington State 2006 Population Data
7.0% 9.1%3.3% 1.5% 2.8%
76.4%
0%
10%
20%
30%
40%
50%
60%
70%
80%
90%
Races & Ethnicity
Po
pu
lati
on
in %
White Alone Asian and Pacific Islander Alone Hispanic or Latino (of any race)
Black or African American Alone Others Two or more races

White Alone
Asian and Pacific Islander
Hispanic or Latino (of any
race)Black or African
American Others2 or more
races Total
Population by Race in 2006 4,886,203 445,577 580,027 211,333 96,005 176,653 6,219,145
Population by Race in 1990 4,221,622 203,668 214,570 146,000 80,832 - 4,866,692
Population change 664,581 241,909 365,457 65,333 15,173 - 1,352,453Growth % 15.7% 118.8% 170.3% 44.7% 18.8% - 27.8%
References: U.S. Census Bureau; American Factfinder 1990 & 2006 Data
Washington State 1990-2006 Population Data
118.8%
44.7%
15.7%
170.3%
0%
30%
60%
90%
120%
150%
180%
Races & Ethnicity
Po
pu
lati
on
in %
White Alone Asian and Pacific Islander Hispanic or Latino (of any race) Black or African American

White
Asian and Pacific Islander
Hispanic or Latino (of any
race)Black or African
American OthersTwo or
more races Total
Population by Race in number 382,282 75,400 32,970 44,871 6,187 20,396 562,106Percentage of population by race 68.0% 13.4% 5.9% 8.0% 1.1% 3.6% 100%
References: U.S. Census Bureau; American Factfinder 2006 Data
Seattle City, Washington 2006 Population Data
13.4%
5.9% 8.0%
1.1%3.6%
68.0%
0%
10%
20%
30%
40%
50%
60%
70%
80%
90%
Races & Ethnicity
Po
pu
lati
on
in %
White Asian and Pacific Islander Hispanic or Latino (of any race)
Black or African American Others Two or more races

White
Asian and Pacific Islander
Hispanic or Latino (of any
race)Black or African
American OthersTwo or
more races Total
Population by Race in 2006 382,282 75,400 32,970 44,871 6,187 20,396 562,106
Population by Race in 1990 380,423 59,141 18,349 50,918 7,428 - 516,259
Population changed 1,859 16,259 14,621 -6,047 -1,241 - 45,847Growth % 0.5% 27.5% 79.7% -11.9% -16.7% - 8.9%
References: U.S. Census Bureau; American Factfinder 1990 & 2006 Data
Seattle City, Washington Population Changed1990-2006
27.5%
79.7%
0.5%0%
10%
20%
30%
40%
50%
60%
70%
80%
90%
Races & Ethnicity
Po
pu
lati
on
in
%
White Asian and Pacific Islander Hispanic or Latino (of any race) Black or African American Others

African American Population in US
Source: U.S. Bureau of the Census, 2006
MarketTotal Population Black
% of DMA
New York 20,700,787 3,986,496 19.3%
Chicago 9,500,028 1,721,086 18.1%
Atlanta 5,803,176 1,542,549 26.6%
Philadelphia 7,720,332 1,452,845 18.8%
Washington, D.C. (Hagerstown) 6,154,393 1,416,595 23.0%
Los Angeles 17,519,792 1,363,723 7.8%
Detroit 5,012,175 1,082,065 21.6%
Miami-Ft. Lauderdale 4,243,305 1,000,807 23.6%
Houston 5,594,922 910,885 16.3%
Dallas-Ft. Worth 6,481,681 872,148 13.5%
New Orleans 1,795,837 616,793 34.3%
Orlando-Daytona Beach-Melbourne 3,313,629 473,811 14.3%
San Francisco-Oakland-San Jose 6,772,728 469,057 6.9%
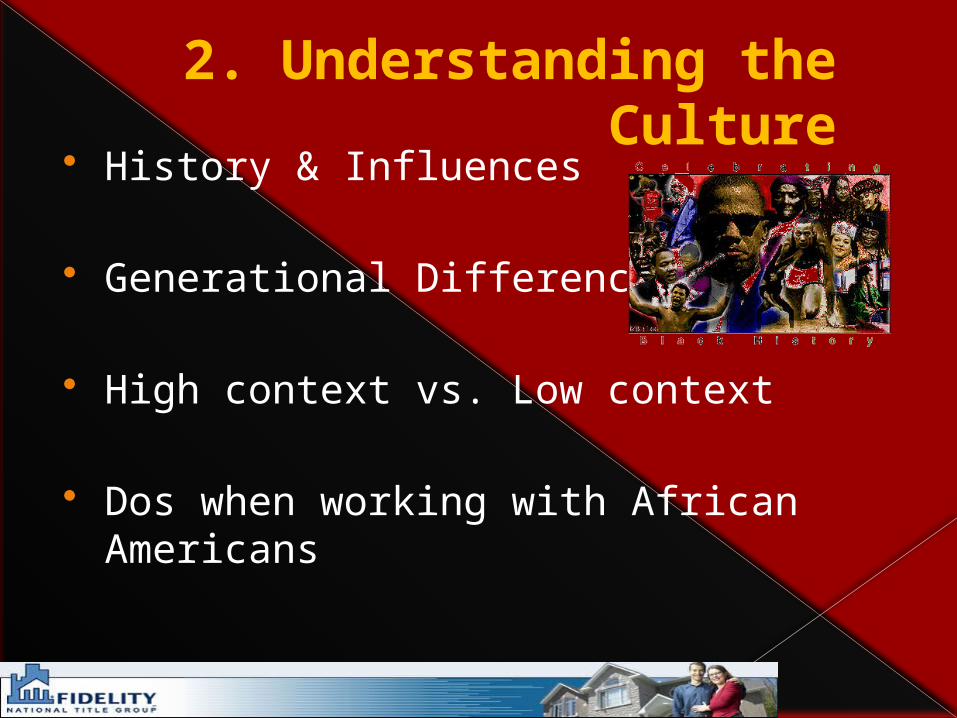
2. Understanding the Culture History & Influences
Generational Differences
High context vs. Low context
Dos when working with African Americans
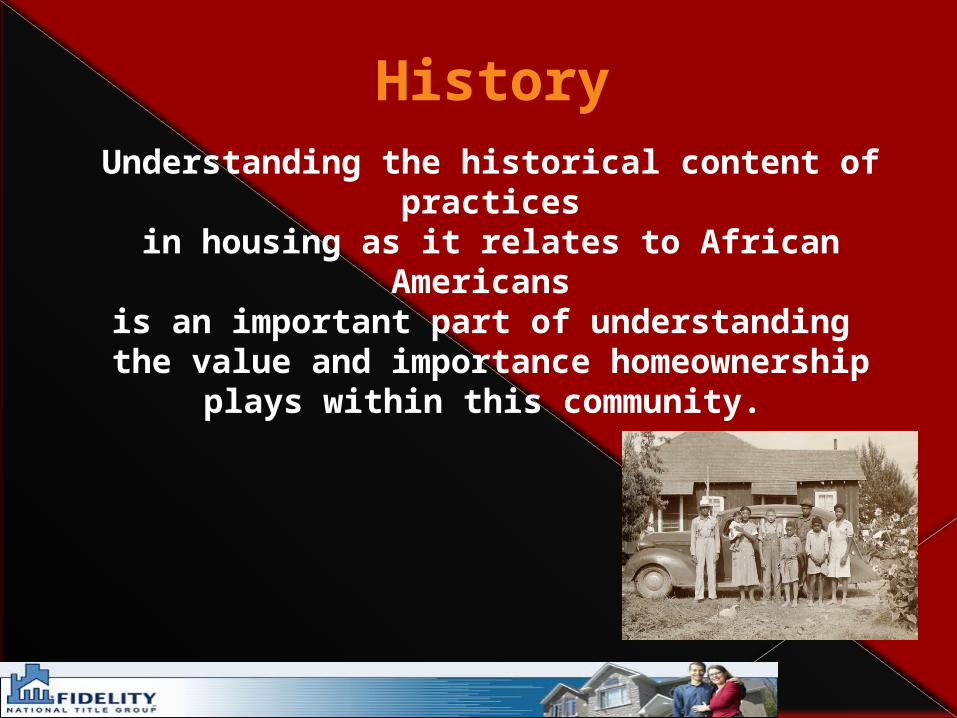
HistoryUnderstanding the historical content of
practicesin housing as it relates to African
Americans is an important part of understanding
the value and importance homeownershipplays within this community.

African American Generalizations African Americans need to feel respected:
› 72% of African Americans believe race will always be a problem.
› 66% of African Americans believe the Civil Rights Movement is extremely important to America’s future.
› 88% of African Americans believe they encounter some form of discrimination on a daily basis or are perceived as ‘unequal’.

African American Generalizations
Family Ties
Athletic and Artistic Influences
Inventors
Strong Christian Faith

Generational Differences Among African Americans
Generational Mindsets
Legacy Generation(Civil Rights Pioneers)
Learned to be Black and function successfully in a white world Pass as white to gain employment without sacrificing values of home and neighborhood
New Generation( New Black Middle Class)
Born after the Civil Rights Movement Have an understanding of who they are and the opportunities that have been afforded because of the Legacy Generation.
Next Generation(The Thrivals)
Ethnicity has value and can be a catalyst to achieving success and building wealth Driven to succeed on their own

Multicultural Consumers are Known for Being: High Context
• Less verbally explicit communication, less written/formal information
• Cognizant of emotion and body language
• More internalized and relational method in communication
Understand that Multicultural clients will be tuned into the quality of your energy, emotion, and enthusiasm.

Where African Americans look for information about buying
a home Word of Mouth Newspaper and Local Radio Community/non-profit housing
agencies Church Internet

Barriers to Homeownership?
Not knowing where to start Access to reliable information Media Down Play in the Real Estate
Market creates more fear in home buying concept

What are some Do’s?
Be authentic & genuine…key to establishing trust
Be aware of unintentional stereotypes Check for agreement, understanding or concerns
by inviting questions Avoid Assumptions

3. Education
Brochures and websites
Culture competency training
Resources to consider

Implementing Tools for Growth
Websites Title.com FNTIC.com CTIC.com Ticortitle.com Housingconnections.org AAAH.org Portlandhousingcenter.org HOWNW.com

At Fidelity National Financial, one of our key Strategy components is the implementation of
cultural competency training for all!

Culture competency training
What is that? Why?
Culture Awareness Basic Dos FNF can help you
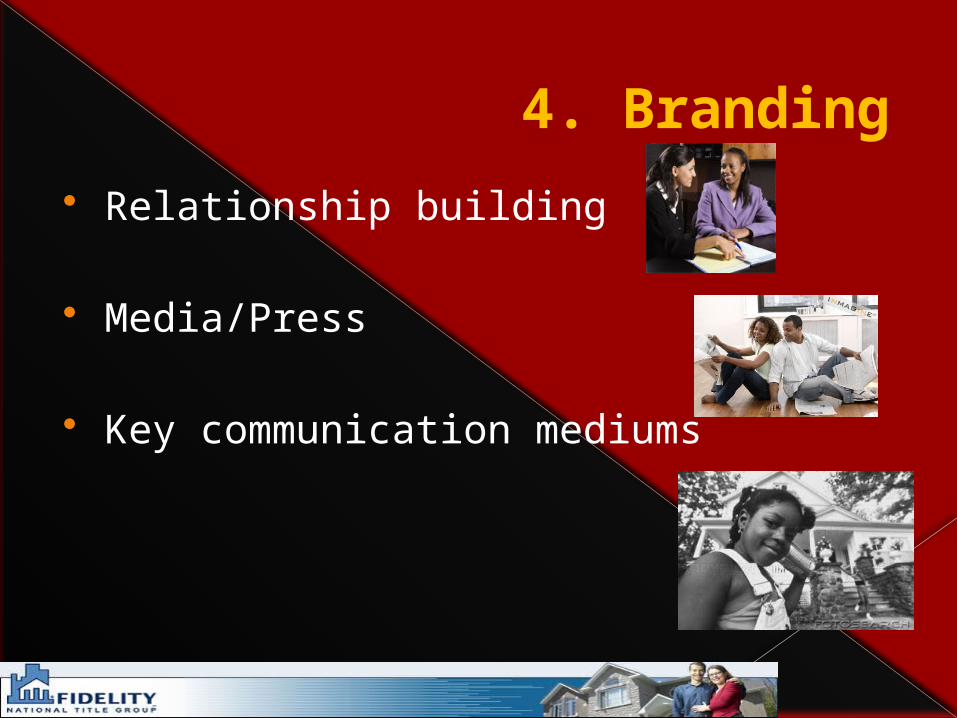
4. Branding
Relationship building
Media/Press
Key communication mediums

Trade Associations (for Information and Networking Opportunities)› NAREB – NAREB.org› NAACP- NAACP.com› Urban League- Urbanleague.com› AAAH-African American Alliance for
Homeownershipwww.aaah.org
› PMAR’s HomeOwnership Opportunities Committee› African American Chamber of Commerce › PHC-Portland Housing Center
www.portlandhousingcenter.org
Relationship Building

Media & Press
• The Skanner
• The Portland Observer
• 1480 KBMS (radio station)

5. Moving Forward
1. Identify goals and objectives (mission and purpose)
2. Develop a Self-analysis:• What do I have to offer that differentiates me from
the competition? • What are the resources I have available?
3. Market Analysis
4. Create an Action plan (including deadlines)

Partner
Fidelity National Financial is the one partner and coach that can help you succeed!
FIND A:


![Spatial and Temporal Interactions of Elk, Mule Deer and Cattle · [16 hdanimal unit]), moderate (30 acres per animal unit [12 hdanimal unit)]) and heavy (20 acres per animal unit](https://static.fdocuments.us/doc/165x107/5fd5c4f17542a017d45d764c/spatial-and-temporal-interactions-of-elk-mule-deer-and-cattle-16-hdanimal-unit.jpg)