Beyond 30% Renewable Electricity in Alberta nd Forks Creston Chetwynd Fort Nelson Fort Smith North...
40
Beyond 30% Renewable Electricity in Alberta: Supply-Mix Considerations Prepared By: Vibrant Clean Energy, LLC Dr Christopher T M Clack Prepared For: Solar Canada 2018 BMO Centre Calgary AB, Canada June 20 th , 2018 Disclaimer: This presentation has been prepared in good faith on the basis of information available at the date of publication. The analysis was produced by Vibrant Clean Energy, LLC. No guarantee or warranty of the analysis is applicable. Vibrant Clean Energy, LLC will not be held liable for any loss, damage, or cost incurred by using or relying on the information in this presentation.
Transcript of Beyond 30% Renewable Electricity in Alberta nd Forks Creston Chetwynd Fort Nelson Fort Smith North...
Beyond 30% Renewable Electricity in Alberta:Supply-Mix Considerations
Prepared By:
Vibrant Clean Energy, LLCDr Christopher T M Clack
Prepared For:
Solar Canada 2018 BMO Centre Calgary AB, Canada
June 20th, 2018
Disclaimer:
This presentation has been prepared in good faith on the basis of information available at the date of publication. The analysis was produced by
Vibrant Clean Energy, LLC. No guarantee or warranty of the analysis is applicable. Vibrant Clean Energy, LLC will not be held liable for any loss,
damage, or cost incurred by using or relying on the information in this presentation.

Purpose of Vibrant Clean Energy, LLC:
• Reduce the cost of electricity & help evolve economies to near
zero emissions;
• Co-optimize transmission, generation, storage, & distributed
resources;
• Increase the understanding of how Variable Generation impacts
& alters the electricity grid and model it more accurately;
• Agnostically determine the least-cost portfolio of generation
that will remove emissions from the economy;
• Model the electrification of industry, heating & transportation;
• License WIS:dom optimization model and/or perform studies
using the model;
• Assist clients unlock and understand the potential of high VRE
scenarios, as well as zero emission pathways.
Coal
NG CC
NG CT
Rooftop PV
Nuclear
Hydroelectric
Offshore
Geothermal
Wind
Solar
Storage
Vibrant Clean Energy
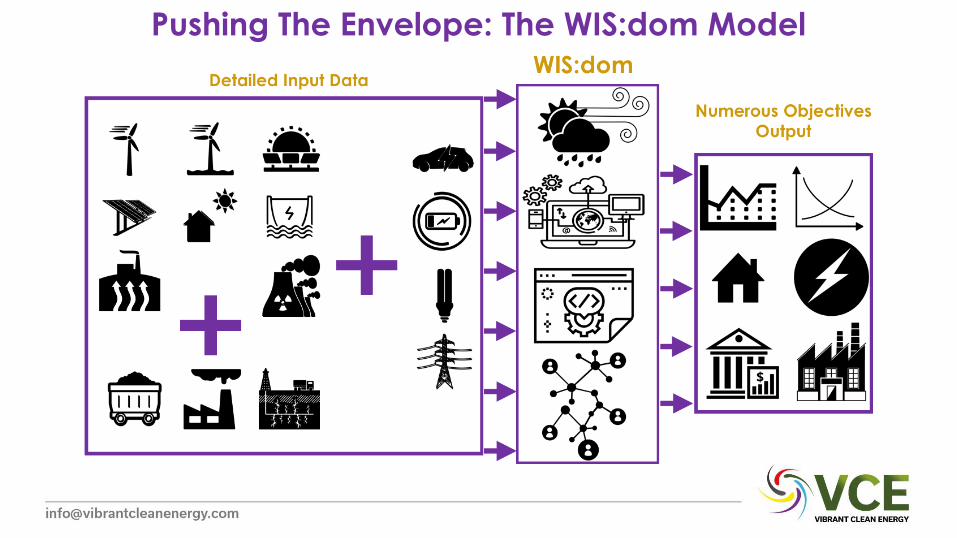
Pushing The Envelope: The WIS:dom Model
How Does Weather Work?
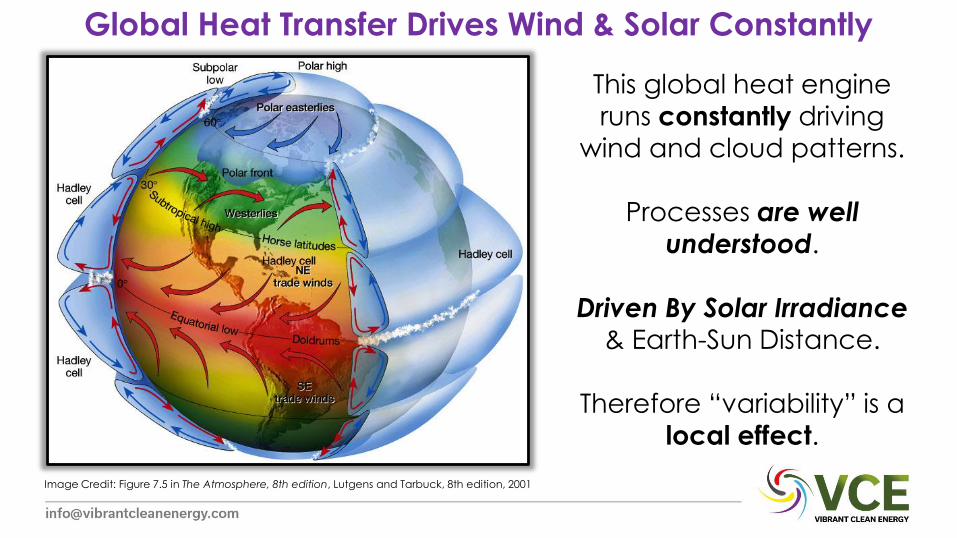
Global Heat Transfer Drives Wind & Solar Constantly
This global heat engine
runs constantly driving
wind and cloud patterns.
Processes are well
understood.
Driven By Solar Irradiance & Earth-Sun Distance.
Therefore “variability” is a
local effect.
Image Credit: Figure 7.5 in The Atmosphere, 8th edition, Lutgens and Tarbuck, 8th edition, 2001
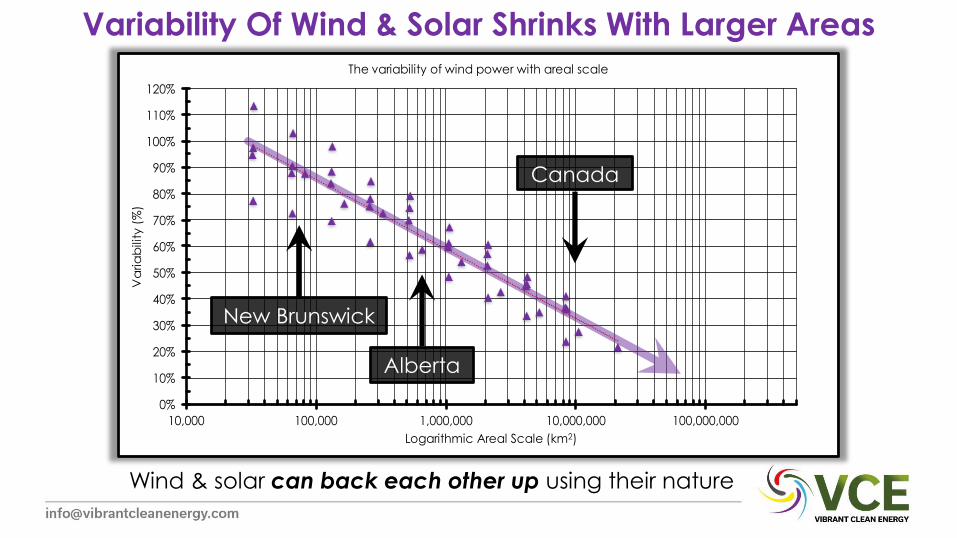
Variability Of Wind & Solar Shrinks With Larger Areas
0%
10%
20%
30%
40%
50%
60%
70%
80%
90%
100%
110%
120%
10,000 100,000 1,000,000 10,000,000 100,000,000
Va
ria
bili
ty (
%)
Logarithmic Areal Scale (km2)
The variability of wind power with areal scale
Alberta
Canada
New Brunswick
Wind & solar can back each other up using their nature
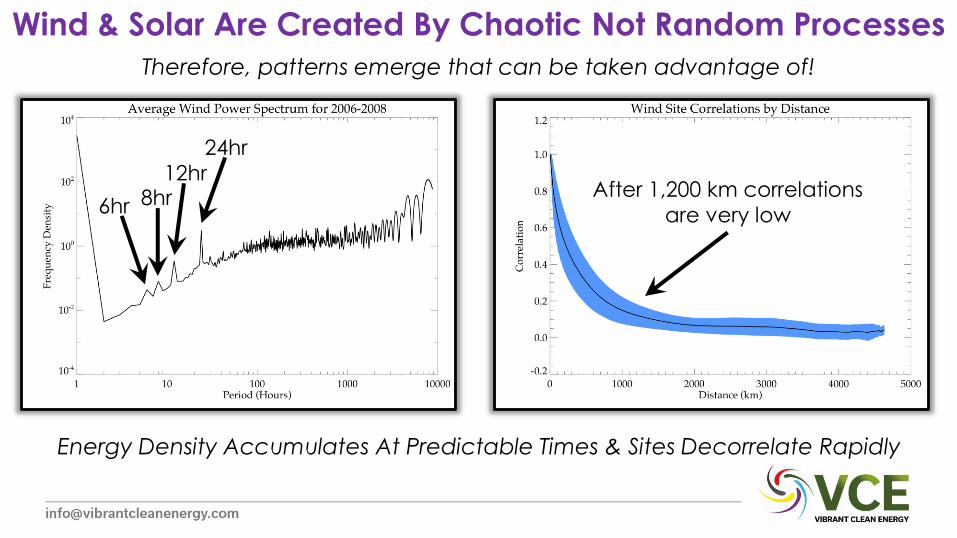
Wind & Solar Are Created By Chaotic Not Random Processes
Therefore, patterns emerge that can be taken advantage of!
Energy Density Accumulates At Predictable Times & Sites Decorrelate Rapidly
24hr
12hr8hr6hr
After 1,200 km correlations
are very low
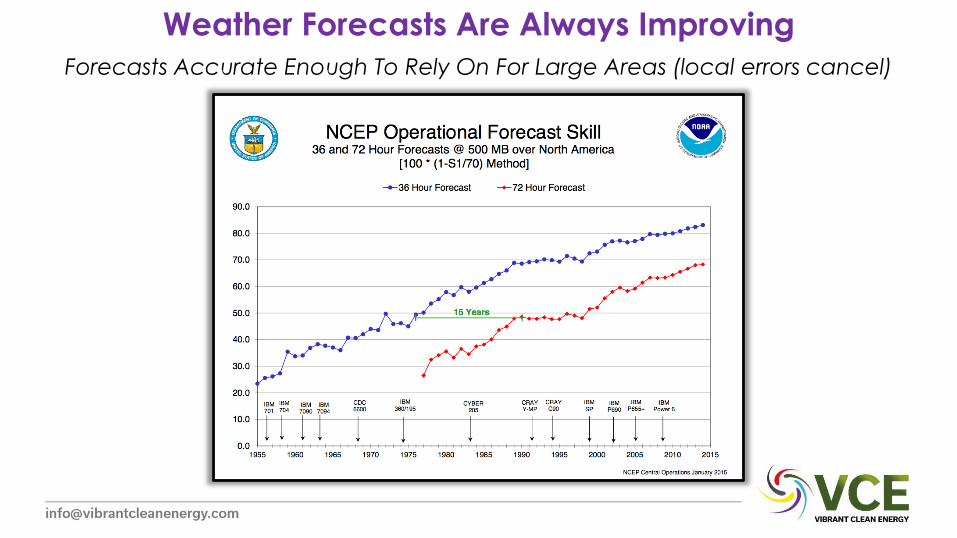
Weather Forecasts Are Always Improving
Forecasts Accurate Enough To Rely On For Large Areas (local errors cancel)
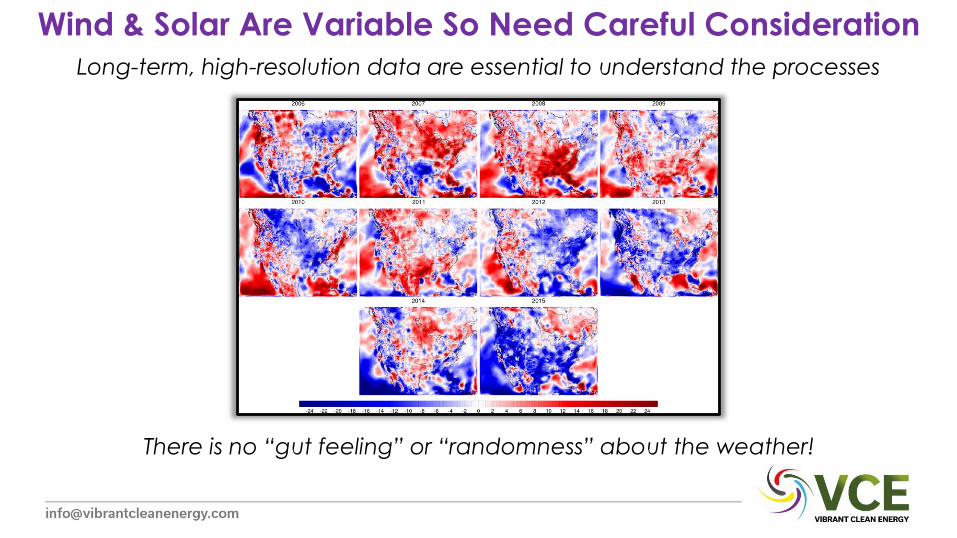
Wind & Solar Are Variable So Need Careful Consideration
Long-term, high-resolution data are essential to understand the processes
There is no “gut feeling” or “randomness” about the weather!
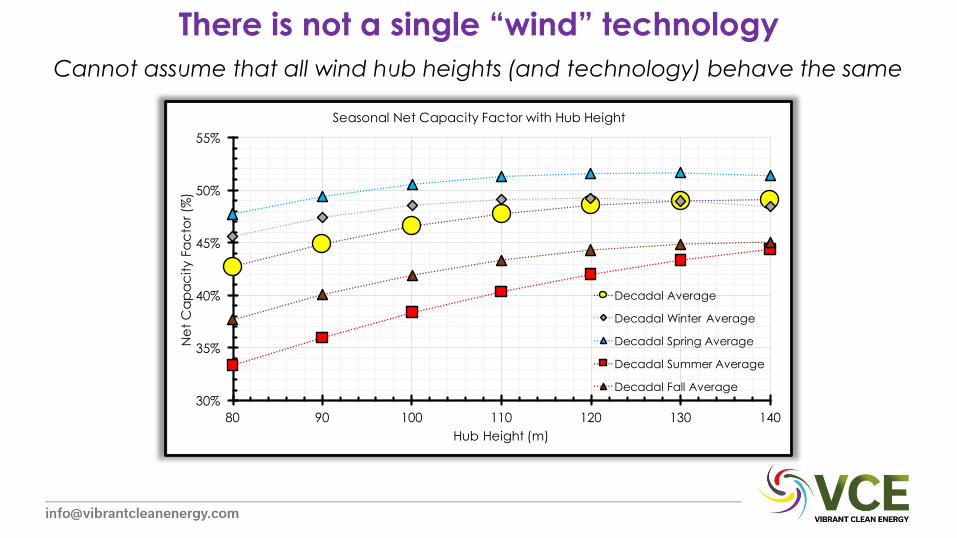
There is not a single “wind” technology
Cannot assume that all wind hub heights (and technology) behave the same
30%
35%
40%
45%
50%
55%
80 90 100 110 120 130 140
Ne
t C
ap
ac
ity
Fa
cto
r (%
)
Hub Height (m)
Seasonal Net Capacity Factor with Hub Height
Decadal Average
Decadal Winter Average
Decadal Spring Average
Decadal Summer Average
Decadal Fall Average
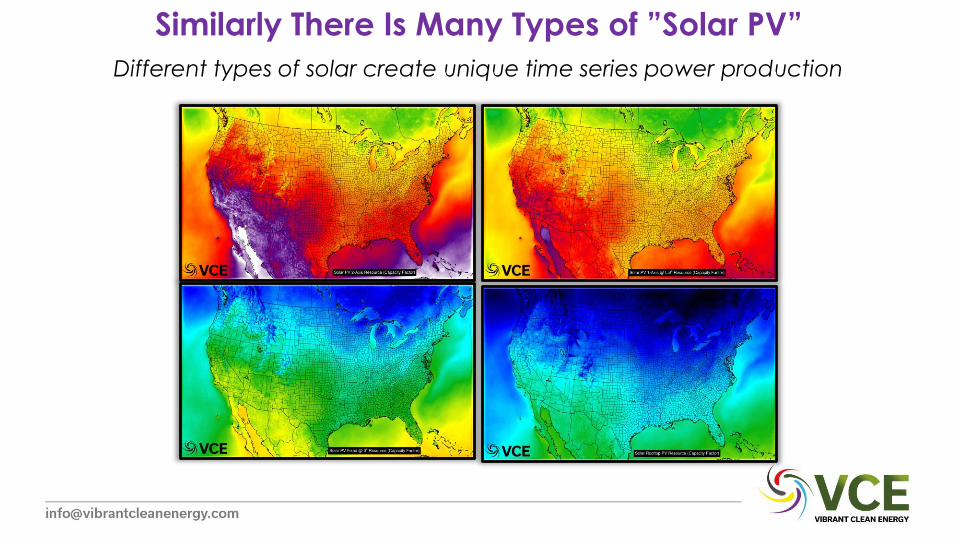
Similarly There Is Many Types of ”Solar PV”
Different types of solar create unique time series power production
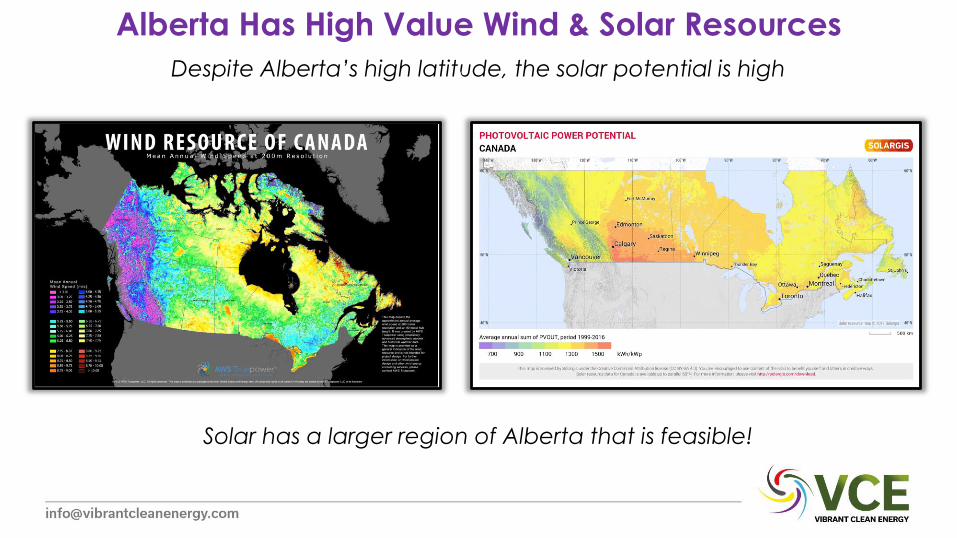
Alberta Has High Value Wind & Solar Resources
Despite Alberta’s high latitude, the solar potential is high
Solar has a larger region of Alberta that is feasible!
Important Grid Properties?
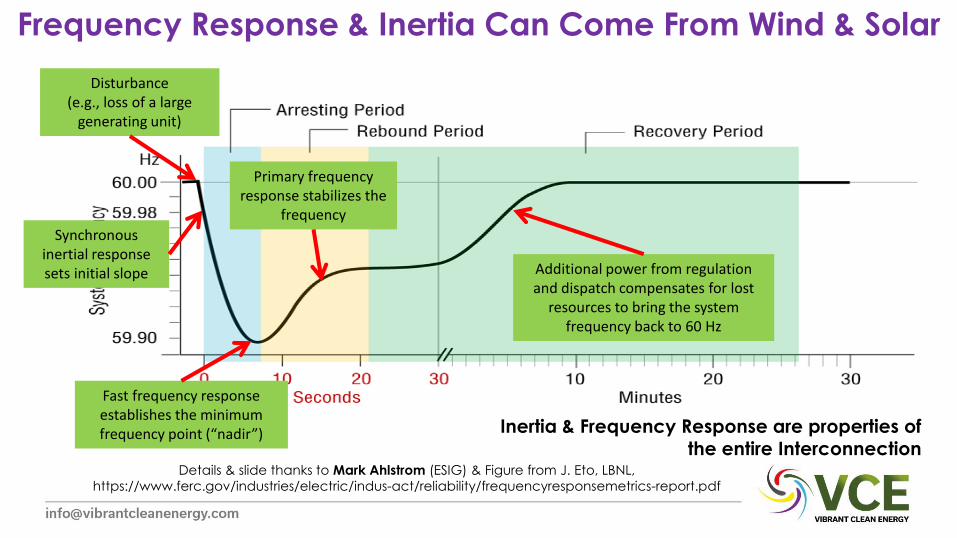
Frequency Response & Inertia Can Come From Wind & Solar
Disturbance (e.g., loss of a large
generating unit)
Fast frequency response establishes the minimum frequency point (“nadir”)
Additional power from regulation and dispatch compensates for lost
resources to bring the system frequency back to 60 Hz
Primary frequency response stabilizes the
frequency
Details & slide thanks to Mark Ahlstrom (ESIG) & Figure from J. Eto, LBNL,
https://www.ferc.gov/industries/electric/indus-act/reliability/frequencyresponsemetrics-report.pdf
Synchronous inertial response sets initial slope
Inertia & Frequency Response are properties of the entire Interconnection

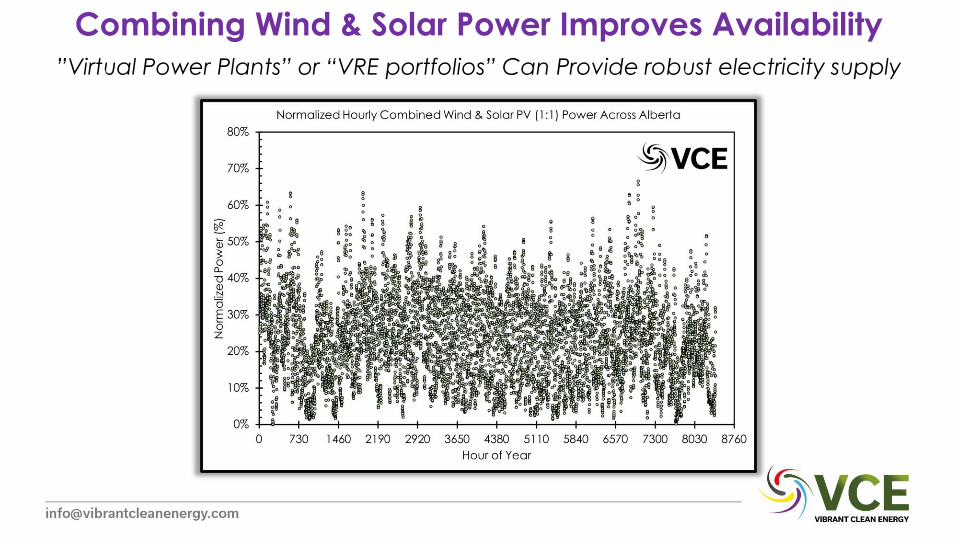
Combining Wind & Solar Power Improves Availability
”Virtual Power Plants” or “VRE portfolios” Can Provide robust electricity supply
Combining Wind & Solar Power Improves Availability
”Virtual Power Plants” or “VRE portfolios” Can Provide robust electricity supply

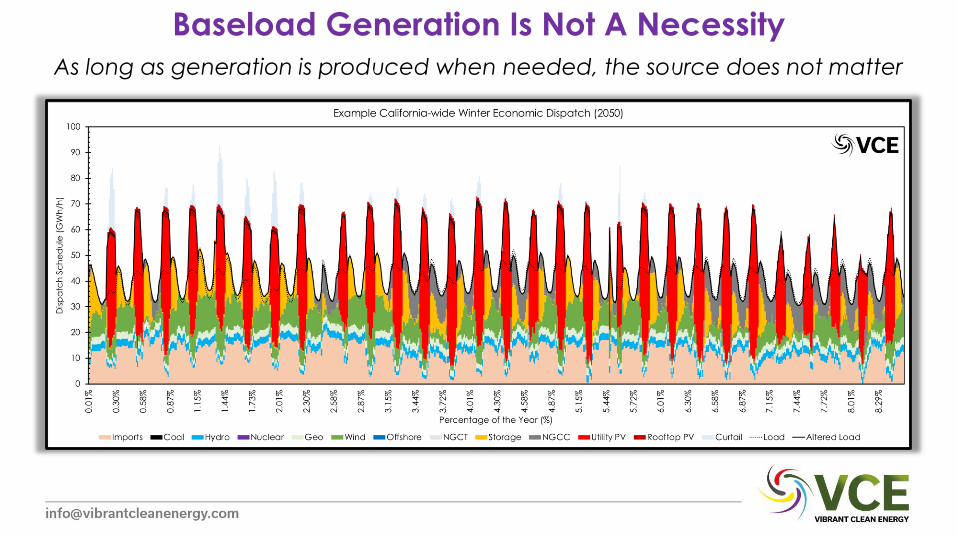
Baseload Generation Is Not A Necessity
As long as generation is produced when needed, the source does not matter
Can replace baseload generation with a combination of:
✓ Natural Gas flexible generation,
✓ Wind,✓ Solar,✓ Storage,✓ Demand Side Management,✓ Distributed Resources,✓ Electrification of Heating & Transportation,✓ Transmission Exchanges,✓ Energy Efficiency.
NOTE: All these resources are modular, and allow trajectory correction if pathway is not achieving the desired goals.
Baseload Generation Is Not A Necessity
As long as generation is produced when needed, the source does not matter

Electrification & Decarbonization
Co-Benefits

Electrification Increase Demand & Customers
0%
10%
20%
30%
40%
50%
60%
70%
80%
90%
100%
110%
120%
130%
20
17
20
18
20
19
20
20
20
21
20
22
20
23
20
24
20
25
20
26
20
27
20
28
20
29
20
30
20
31
20
32
20
33
20
34
20
35
20
36
20
37
20
38
20
39
20
40
20
41
20
42
20
43
20
44
20
45
20
46
20
47
20
48
20
49
20
50
US E
lec
tric
De
ma
nd
As
Pe
rce
nta
ge
of
20
17
Lo
ad
(%
)
US Electricity Demand To Reduce Economy Wide GHG Emissions By 80% By 2050
Standard Load Electrified Heating Load EV Load
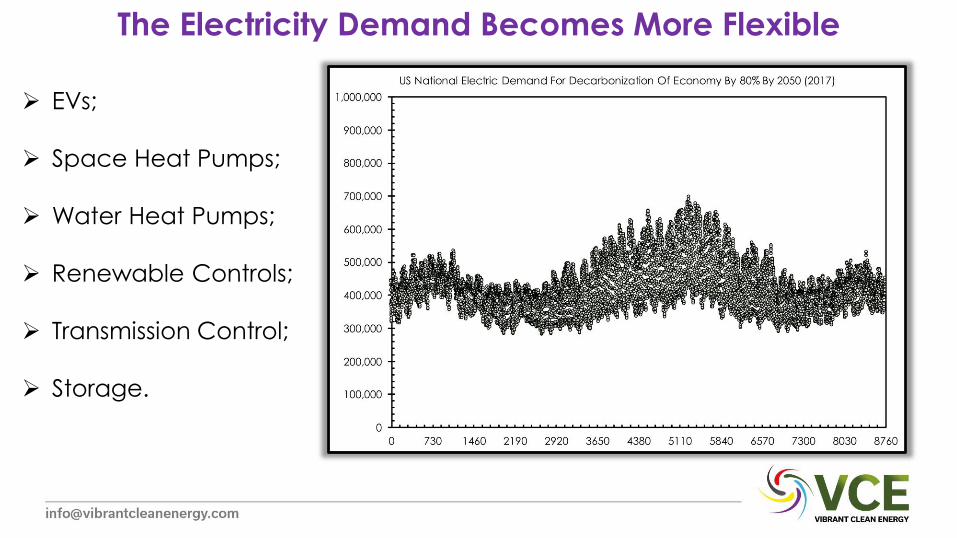
The Electricity Demand Becomes More Flexible
➢ EVs;
➢ Space Heat Pumps;
➢ Water Heat Pumps;
➢ Renewable Controls;
➢ Transmission Control;
➢ Storage.
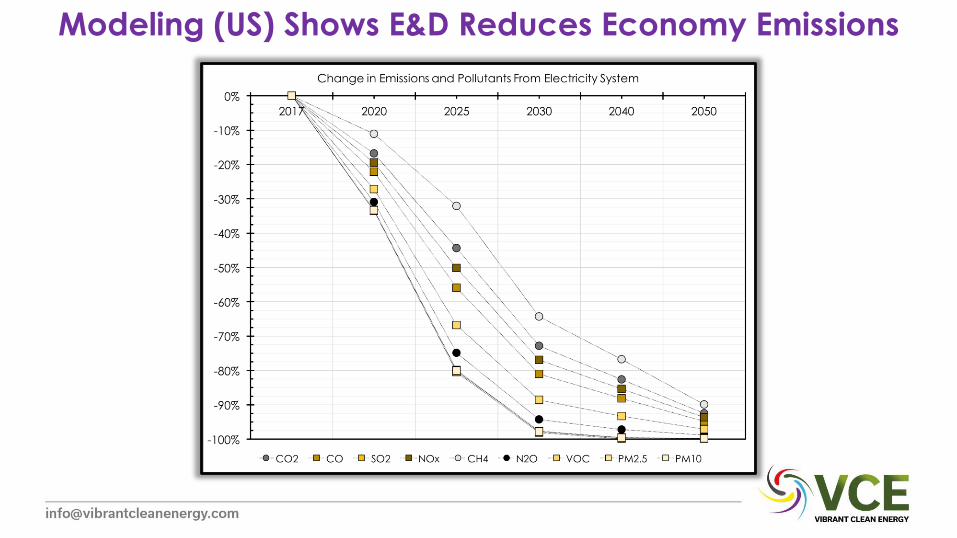
Modeling (US) Shows E&D Reduces Economy Emissions
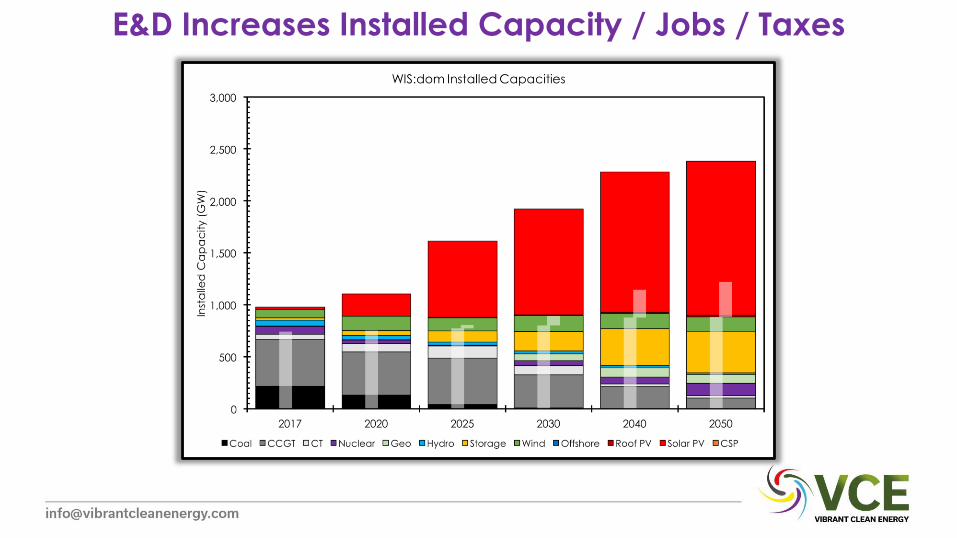
E&D Increases Installed Capacity / Jobs / Taxes

E&D Creates More Modular Grid Enabled By Transmission

Can Alberta Achieve The Same?
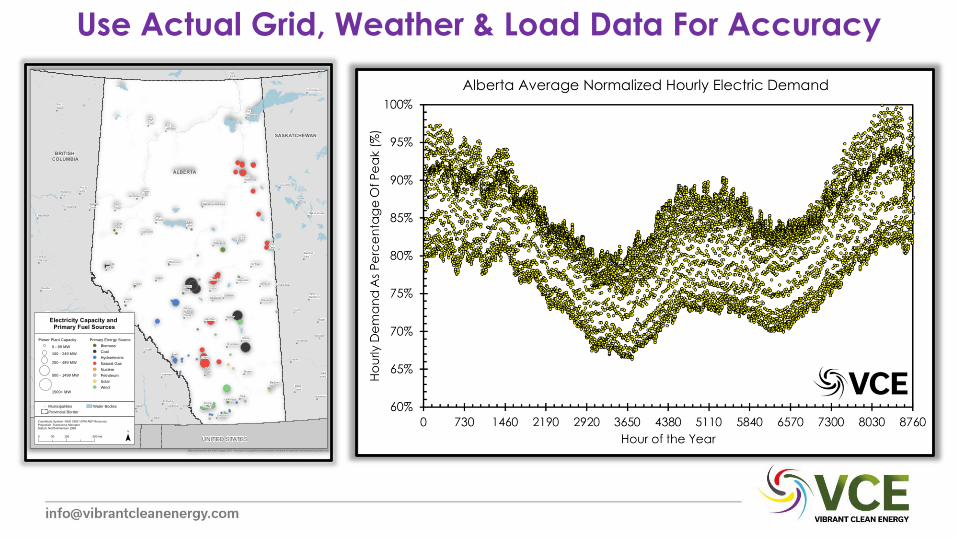
Use Actual Grid, Weather & Load Data For Accuracy
BRITISH COLUMBIA
ALBERTA
NORTHERN TERRITORIES
SASKATCHEWAN
BRITISH
COLUMBIA
UNITED STATES
Leader
Fond-du-Lac
Fort
Vermilion
Fort
Chipewyan
Hudson's
Hope
Unity
Biggar
Kindersley
Rosetown
Maple
Creek
Shaunavon
La Loche
Buffalo
Narrows
Île-à-la-Crosse
MeadowLake
Wainwright
Stettler
Hanna
Pincher
Creek
Cardston
ColdLake
St. Paul
Vermilion
Spirit
River
Grimshaw
Valleyview
High
Prairie
Wabasca-Desmarais
GrandeCache
Jasper
Athabasca
Lac La
Biche
High
Level
100 Mile
House
Lillooet
Golden
Invermere
HopePrinceton
GrandForks Creston
Chetwynd
Fort
Nelson
Fort
Smith
NorthBattleford
Swift
Current
Rocky
MountainHouse
Lloydminster
Camrose
Drumheller
High
River Brooks
Taber
Banff
Drayton
Valley
Wetaskiwin
Leduc
Peace
River
Slave
Lake
Hinton
Edson
Whitecourt
Vegreville
Merritt
Vernon
Salmon
Arm
Revelstoke
Castlegar
Nelson
Kimberley
Cranbrook Fernie
Mackenzie
Fort St.John
Dawson
Creek
Quesnel
Williams
LakeRed Deer
Medicine
Hat
Lethbridge
Grande
Prairie
FortMcMurray
Chilliwack
Penticton
Kamloops
Kelowna
Prince
George
Trail
Calgary
Edmonton
Map produced by the NEB, August 2017. The map is a graphical representation intended for general informational purposes only
Primary Energy Source
Biomass
Coal
Hydroelectric
Natural Gas
Nuclear
Petroleum
Solar
Wind
Power Plant Capacity
0 - 99 MW
100 - 249 MW
250 - 499 MW
500 - 1499 MW
1500+ MW
Electricity Capacity and Primary Fuel Sources
0 100 20050 km
Coordinate System: NAD 1983 10TM AEP Resource
Projection: Transverse MercatorDatum: North American 1983
Water Bodies
Provincial Border
Municipalities
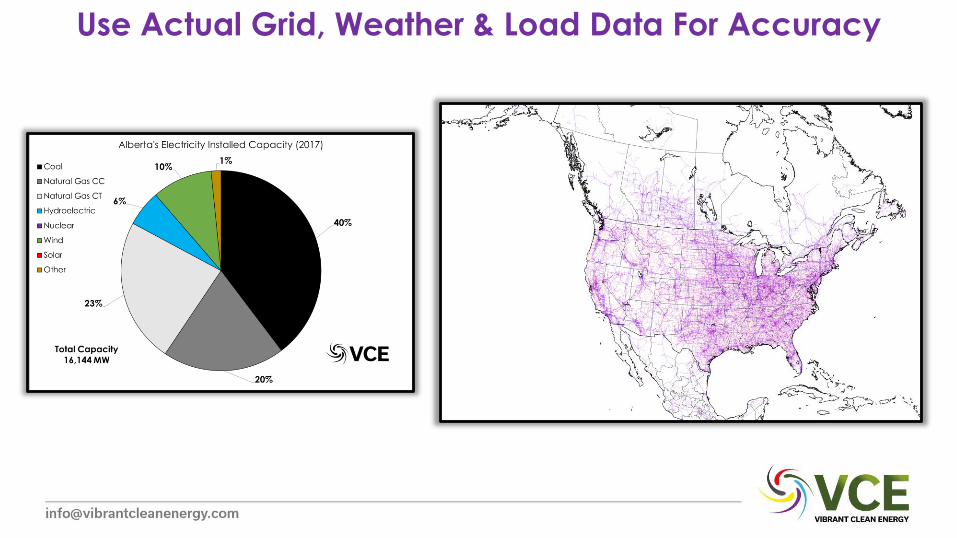
Use Actual Grid, Weather & Load Data For Accuracy

Use Actual Grid, Weather & Load Data For Accuracy
Wind
Solar PV
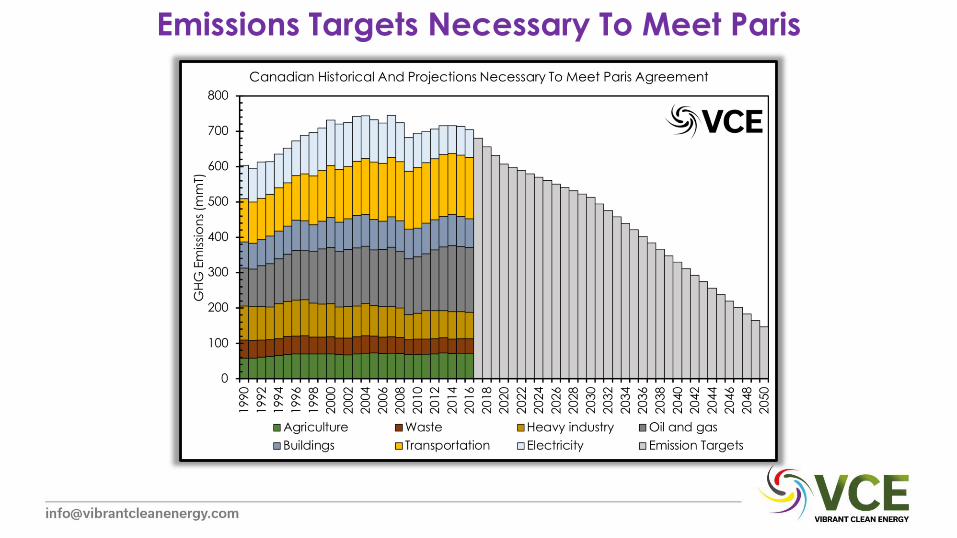
Emissions Targets Necessary To Meet Paris
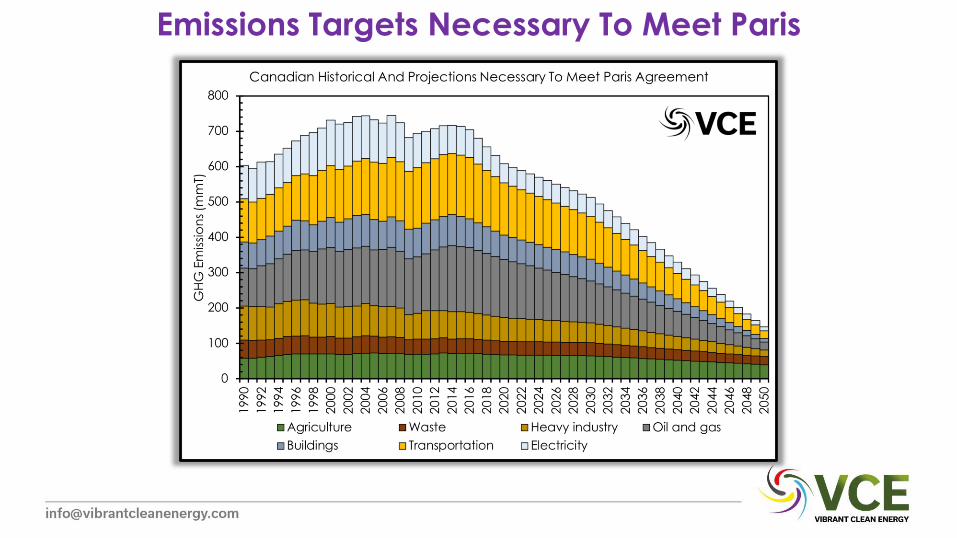
Emissions Targets Necessary To Meet Paris
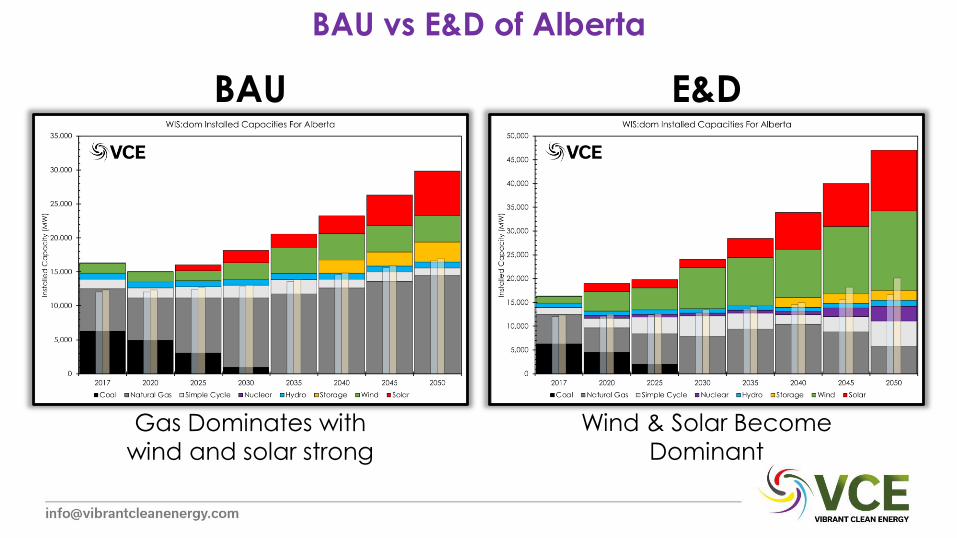
BAU vs E&D of Alberta
BAU E&D
Gas Dominates with
wind and solar strong
Wind & Solar Become
Dominant
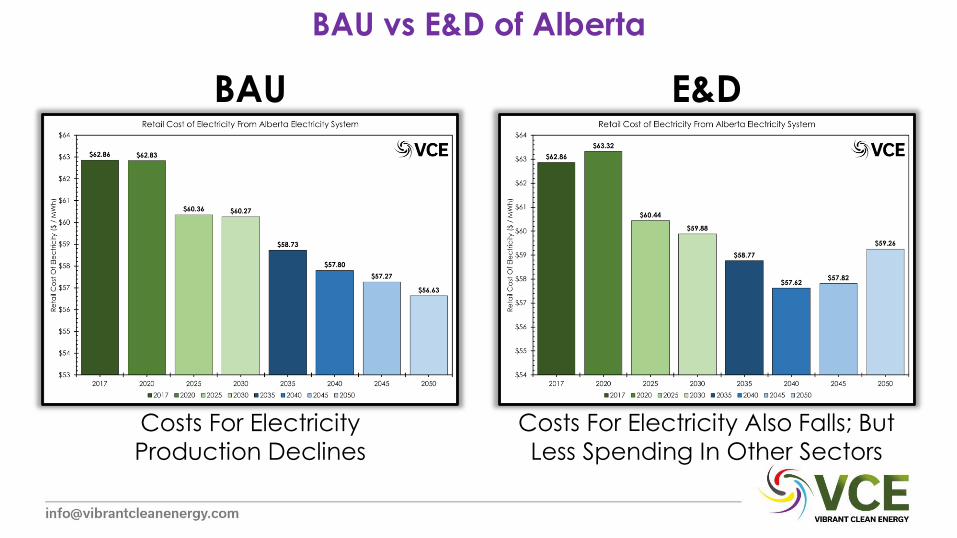
BAU vs E&D of Alberta
BAU E&D
Costs For Electricity
Production Declines
Costs For Electricity Also Falls; But
Less Spending In Other Sectors
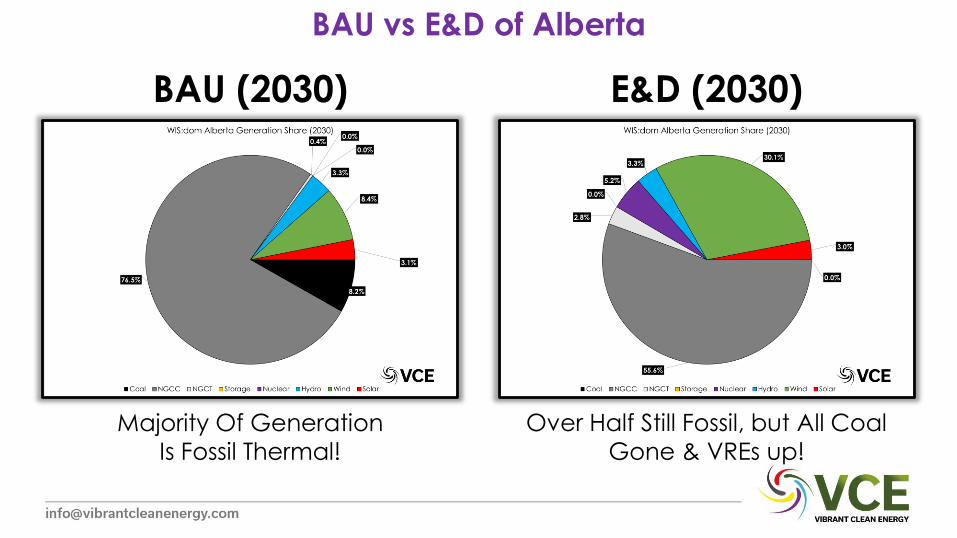
BAU vs E&D of Alberta
BAU (2030) E&D (2030)
Majority Of Generation
Is Fossil Thermal!
Over Half Still Fossil, but All Coal
Gone & VREs up!
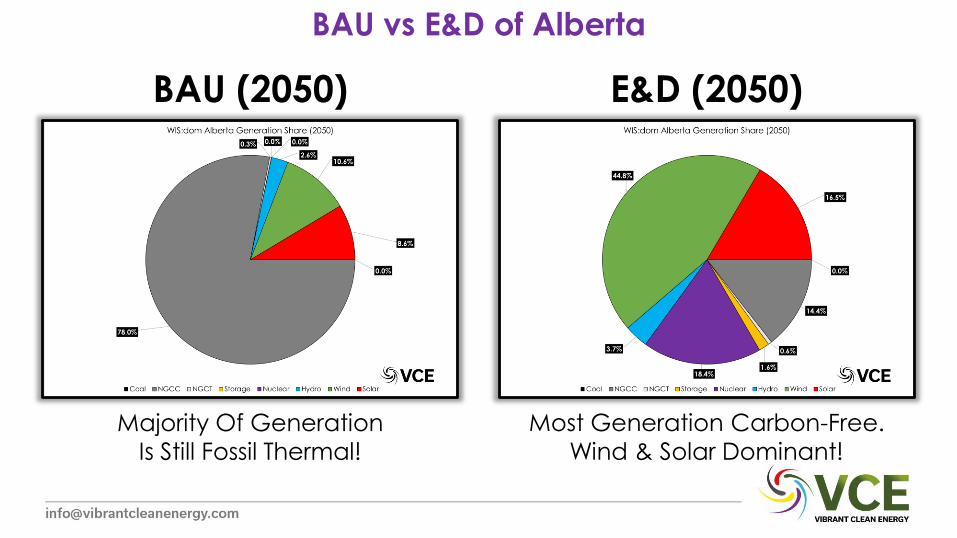
BAU vs E&D of Alberta
BAU (2050) E&D (2050)
Majority Of Generation
Is Still Fossil Thermal!
Most Generation Carbon-Free.
Wind & Solar Dominant!
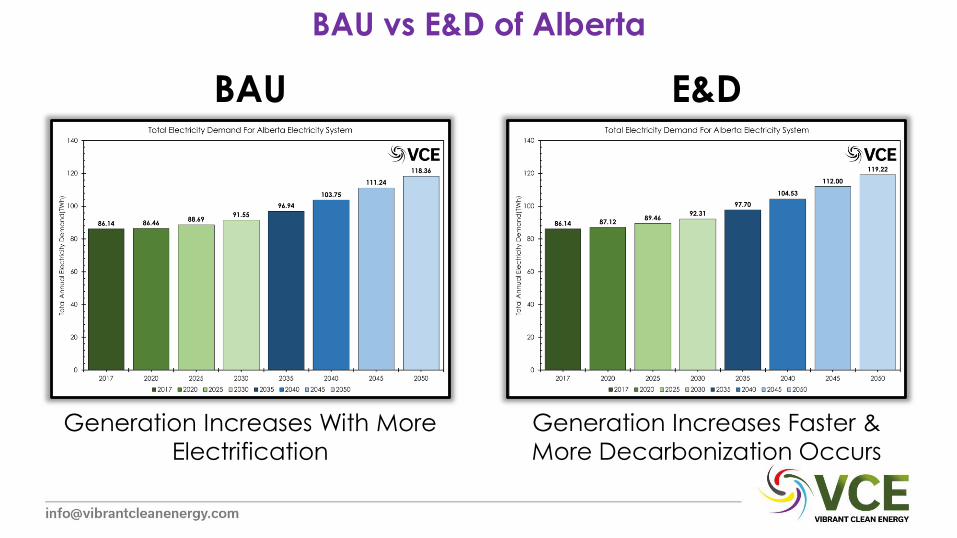
BAU vs E&D of Alberta
BAU E&D
Generation Increases With More
Electrification
Generation Increases Faster &
More Decarbonization Occurs
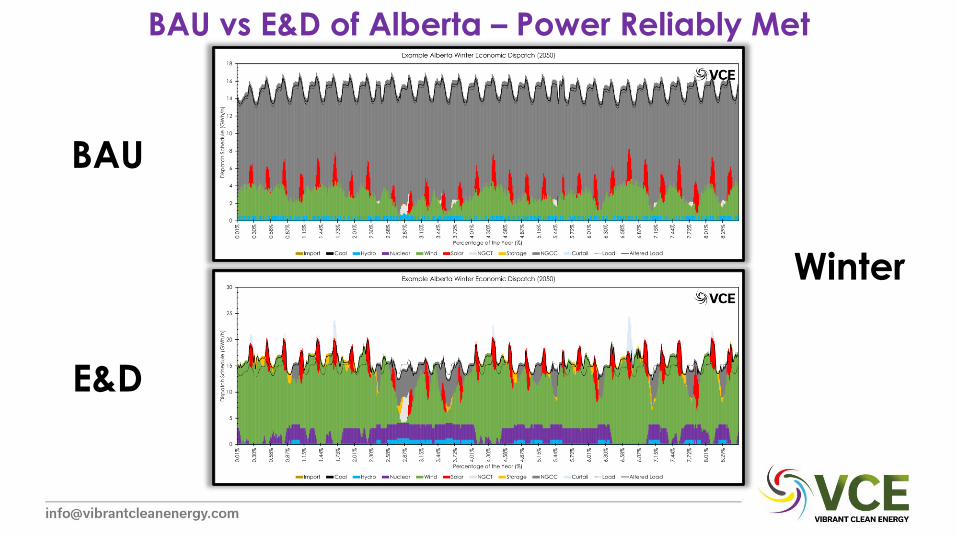
BAU vs E&D of Alberta – Power Reliably Met
BAU
E&D
Winter
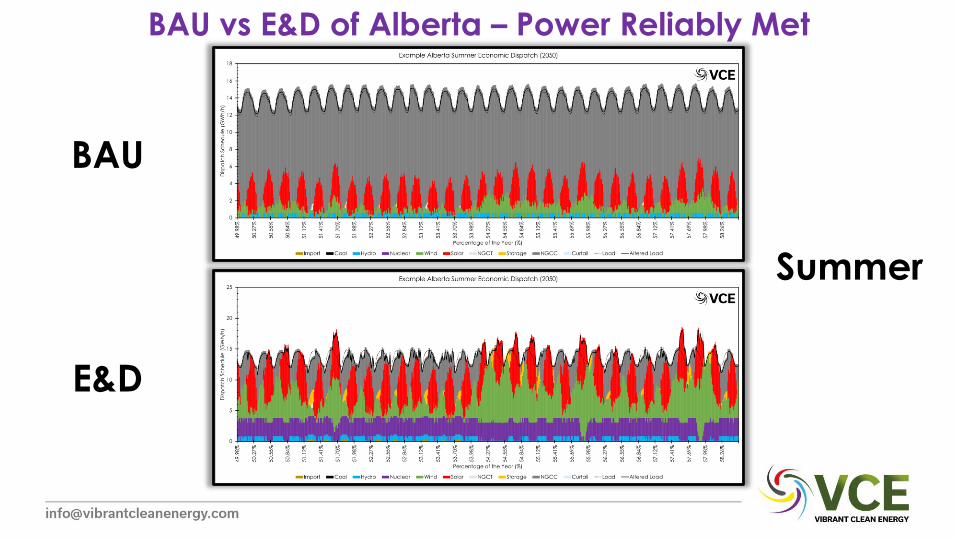
BAU vs E&D of Alberta – Power Reliably Met
BAU
E&D
Summer
How Does The Change Happen?
➢ Rapid deployment of low-emission technologies (wind, solar, storage & Nuclear);
➢ Continual market reforms in the electricity sector to adapt to new paradigms;
➢ Storage becoming a “transmission asset” in the electricity sector;
➢ Demand side management and flexibility being deployed on the consumer end;
➢ Energy efficiency and transition to EVs for light-duty vehicles;
➢ Retrofitting and adapting existing demand resources with more efficient end-use products (e.g. heat pumps, water heaters, LEDs, etc.);
➢ Deployment of VREs allowed in technical regions, without interruption from uninformed parties on the behavior & benefits of VREs.
Some Myths Challenged?✓ Wind and solar can actually provide adequate power over regions (as aggregated
assets);
✓ Peak demand can increase (and should) for a deep decarbonized economy;
✓ Inertia in the system can be provided by other assets (including wind and solar)rather than just by thermal generation;
✓ Reduction in energy use can be substantial and changes the amount necessary for
the economy;
✓ Nuclear, geothermal, wind, solar, storage and other assets are all completely fine
working together, given correct incentives;
✓ Variable renewables are not “fuel savers”, but deployed properly can become
integral energy producers providing the full range of services required for electricity markets (reserves, ancillary services, capacity).
Thank You
Dr Christopher T M ClackCEO Vibrant Clean Energy, LLC
Telephone: +1-720-668-6873
E-mail: [email protected]
Website: VibrantCleanEnergy.com
Twitter: @Clacky007