Better business outcomes through Customer Analytics
41
Better business outcomes through Customer Analytics Rajesh Shewani Technical Sales Leader – Business Analytics, India/SA [email protected]
Transcript of Better business outcomes through Customer Analytics
Better business outcomes through Customer Analytics
Rajesh Shewani
Technical Sales Leader – Business Analytics, India/SA

Agenda
The Age of the Empowered Consumer
Use of analytics to better understand and focus on customers
How organizations are using customer analytics to develop profitable relationships

Consumer Experience Framework – 10 years ago
Marketing
Sales
Support/Services
Use Product
Purchase (More) Products
Get Customer Service

Technology is changing how customers interact
• Social media changed purchaser influence; opinions viewable instantly
• Mass customization and personalization of products and services
The consumer has taken charge...
Customers have lost confidence in institutions
• 76% of customers believe companies lie in advertisements
• Growing trust gap in many consumer focused industries
Expectations have changed
• Focus is on value, transparency and accountability
• Customers want to be seen holistically across the enterprise
Institutions need to rediscover their customers
• Consumers are experiencing brands in new ways though new channels
• Micro-targeting: the move beyond 1 on 1 is accelerating
Evolving Expectations: Timely Localized Experiential Personalized Information
Sources: http//www.nae.edu/cms/Publications/The Brodge/Archives/7356/7596.aspx; Internetworldstats.com; Strategy Analytics; Informa

Customer Experience Framework today
Research Product
Marketing
Sales
Support/Services
Feedback Management
Social Intelligence Research Product
Purchase Product
Use Product
Advocate Product
Get Customer Service
Up/Cross Sell

IBM C-Suite studies
Getting closer to customer
People skills
Insight and intelligence
Enterprise model changes
Risk management
Industry model changes
Revenue model changes
88%
81%
76%
57%
55%
54%
51%
CEO Focus Over Next 5 Years
Enhance customer loyalty/advocacy 67%
Design experiences for tablet/ mobile
Use social media as a key channel
Use integrated software to manage
customers
Monitor the brand via social media
57%
56%
56%
51%
Measure ROI of digital technologies
Analyze online / offline transactions
47%
45%
CMO 5 Year Focus Toward Digital
Sources: IBM’s 2011 Global CMO Study: From Stretched to Strengthened (2011) & IBM’s 2010 Global CEO Study – Capitalizing on Complexity

Sales
Marketing
Customer Service
Finance
IT
Operations
Product Development
Human Resources
The customer experience is an enterprise responsibility
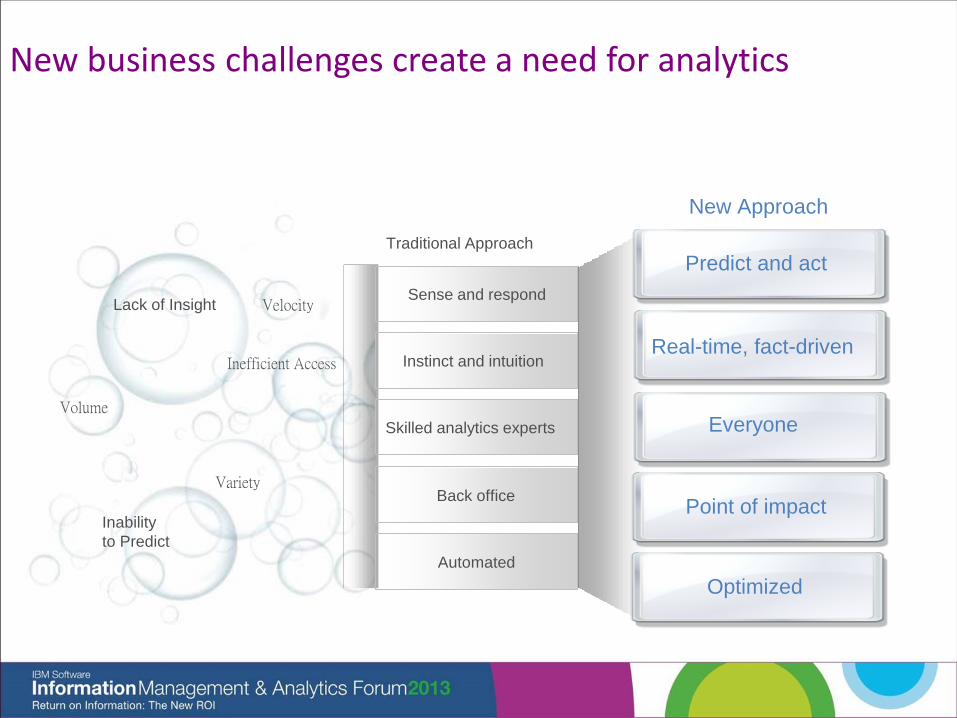
New business challenges create a need for analytics
Sense and respond
Instinct and intuition
Automated
Skilled analytics experts
Back office
Traditional Approach
Predict and act
Real-time, fact-driven
Optimized
Everyone
Point of impact
New Approach
Lack of Insight
Inability
to Predict
Inefficient Access
Variety
Volume
Velocity

Data at the heart of customer analytics
Behavioral data
• Orders
• Transactions
• Payment history
• Usage history
Descriptive data
• Attributes
• Characteristics
• Self-declared info
• (Geo)demographics
Attitudinal data
• Opinions
• Preferences
• Needs & Desires
• Market Research
• Social Media
Interaction data
• E-Mail / chat transcripts
• Call center notes
• Web Click-streams
• In person dialogues
“Traditional” – CRM Mentality
High-value, dynamic - source of competitive differentiation

Customer experience framework – From the enterprise viewpoint
Prescription/
Services
Recommendation
Up/Cross Sell
Analysis
Price
Optimization
Customer
Feedback
Analysis
Customer Loyalty/
Advocacy
Customer
Satisfaction
Market
Segmentation
Lead
Optimization
Customer
Lifetime Value
Influencer
Network
Optimization
Customer Analytics

Citizen
Employee
Patient Constituent
Student
Passenger
Member
Customer Analytics is all about the …
11

Customer insight & acquisition
Build accurate customer
segments to determine the right
offer, time, place, channel, etc…
Optimize marketing budgets aligned with goals
Measure marketing performance through reporting

Insight & acquisition – Techniques & solutions
RFM Analysis – Cheap (low overhead) way to segment a
database of customers
– Example: determine the groups of people
for a coupon marketing offer
Segmentation – Ability to find hidden clusters / groups of
people
– Example: identifying the people that are
likely to buy
Reporting & Analysis – Provide historical and current views of
business operations
– Example: provide insight into how a
current sales campaign is performing
Planning & Forecasting – What-if analysis to drive timely decision
making
– Example: determine the optimal
marketing plan based on a set budget
Customer Segmentation
Cross-Channel
Campaign Optimization
Optimal Trigger Marketing
Lead Management
Budget Optimization

Customer insight & acquisition journey
Align Anticipate Act
Customer Data • Demographics
• Channel Activity
• Information Requests
• …
Analyses Predict who is likely to
respond, based on clusters of
similar customers that have
purchased in the past
Scoring
Marketing
campaign
process
Key Performance
Predictors and
Campaign Results
Rank best 3
offers
Social Media Data • Twitter
• Discussion Forums
• Blogs
• …
Marketing list
recommendation
Sales
campaigns

Solution components:
• IBM® SPSS Statistics Standard
"IBM SPSS predictive
analytics strongly improves
the returns on our marketing
campaigns. we’re now able to
better target our direct mail
campaigns, we can identify
the best neighbourhoods,
where the response is 2.5
times higher " Jan Kamphuis, UNICEF Netherlands
data analyst —
The Need
UNICEF Netherlands needed a solution that could help it analyze and better
understand contributor behavior in order to map out long term developments
and patterns for donations and optimize the use of its fundraising channels.
The Solution
UNICEF Netherlands optimizes the results of marketing initiatives with IBM
SPSS Statistics. Performing in-depth analyses of prospect data enables it to
achieve accurate forecasts and contributor profiles and create highly
targeted prospect approach. Also handle millions of records effortlessly, and
the integration of third-party market data.
What Makes it Smarter
•. conduct highly targeted marketing campaigns yielding optimum results
• map out the donation behavior of its contributors accurately and define
clear-cut segments and profiles
• The targeted campaigns minimize the chances of public irritation, hence
enhancing UNICEF Netherlands’ image.
•Include third party data for additional insight
Unicef Uses predictive analytics to get more donations

Customer lifetime value
Personalize up-sell & cross-sell offers with social media data
Understand the factors that
influence CLV
Target customers with the
correct offer, channel, & time
Calculate, monitor & maximize
customer profitability

Customer lifetime value – Techniques & solutions
Association
• Finding the things done in tandem
• Example: market basket analysis,
students curriculums, insurance policies
that are bought together
Classification
• Identifying the attributes that are causing
something
• Example: give the cascading predictive
attributes of purchase behavior
Scorecards & Dashboards
• Translate strategy into accountability &
measure progress
• Example: monitor the continued success
of cross-sell campaigns
Market Basket Analysis
Next Best Offer
Prospect Assessment
Value pricing Optimization
Buying Process Optimization
Proactive Activation Service

Customer cross-sell journey
Align Anticipate Act
Customer Data • Demographics
• Account Activity
• Product Holdings
• Channel Activity
• Information Requests
• Complaints
• …
Campaign Data • Contact history
• Response/purchases
• Test campaigns
• …
Analyses Predict who is likely to
respond, based on their
customer profile when
receiving the campaign
Scoring
Marketing
campaign
process
Key Performance
Predictors and
Campaign Results
Rank best 3
offers
Attitudinal Data • Customer Surveys
• Discussion Forums
• Blogs
• …
Website
recommendation
engine
Sales
campaigns

Solution components:
• IBM® SPSS Predictive Analytics
Software
Real Business Results:
- Increased customer
response rates by 400 to
1,000 percent
- Increased potential
revenue by 50 to 70 percent
in certain customer groups
- Uncovered unexpected
opportunities
The Need
KPN has a portfolio of more than 30 products that it sells to over a million
business customers. The company’s business marketing intelligence team
needs to find out how best to allocate marketing budgets in order to
maximize cross- and up-selling opportunities—a task that required complex
analysis of huge volumes of data.
The Solution
By mining previously untapped customer data and developing predictive
models, KPN is discovering new insights into which of its products will most
likely appeal to which customers. Customers can be accurately segmented
and then analyzed. Creation of marketing campaigns that specifically target
certain customers, increasing the campaigns' potential effectiveness.
What Makes it Smarter
•Increases customer response rates to direct marketing campaigns
•increase revenue from certain customer groups by 50 to 70 percent
• Helps non-technical decision makers understand complex analyses and
make better business decisions through compelling graphical presentations
of data
•Identifies consumer purchasing propensity and predicts the outcomes of
marketing decisions to increase direct marketing results and increase
response rates by up to 1,000 percent.
KPN Uses predictive analytics to Target right product to the right customer

Customer satisfaction & loyalty
Retain valuable customers by identifying defection probability
Understand causal factors for
satisfaction / dissatisfaction
Incorporate sentiment from
social media, surveys, etc…
Detect & mitigate customer issues during interactions
Continually monitor & track customer service levels

Customer satisfaction & loyalty – Techniques & solutions
Net Promoter Score
• Survey technique to determine customer
satisfaction
• Example: a question to determine whether
a customer is a promoter detractor
Sentiment Analysis
• Taking unstructured data and put it into an
organized, structured format
• Example: sentiment analytics for customer
satisfaction in surveys & social media
Anomaly Detection (outliers)
• Finding data points that are statistically
significant in their difference from others
• Examples: understand the best performing
customer group / comment that doesn’t fit
/ behavior that doesn’t follow the norm
Brand Monitoring
Social Feedback Analysis
Competitive Value
Assessment
Loyalty Value Assessment
Customer Dialog Management
Retention Risk
Management

22
What are consumers hearing about our brand?
How do consumers feel about our new message/ad?
What are the most talked about product attributes in my product category? Is it good or bad?
Is there negative chatter that my PR team should respond to?
What is my competitor doing to excite the market?
What is my competitor doing to excite the
market?
Tap into Consumer generated content
Are my business partners helping or hurting my
reputation?
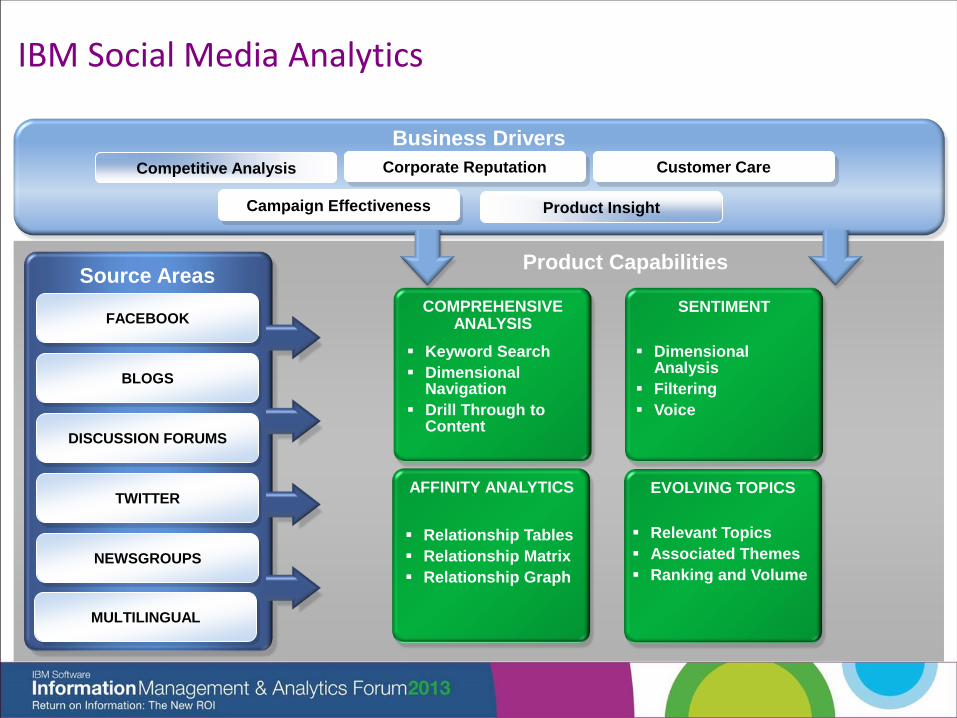
Product Capabilities
IBM Social Media Analytics
BLOGS
DISCUSSION FORUMS
NEWSGROUPS
Source Areas
Dimensional Analysis
Filtering
Voice
Keyword Search
Dimensional Navigation
Drill Through to Content
Relevant Topics
Associated Themes
Ranking and Volume
Relationship Tables
Relationship Matrix
Relationship Graph
COMPREHENSIVE ANALYSIS
SENTIMENT
EVOLVING TOPICS AFFINITY ANALYTICS
Business Drivers
Customer Care Corporate Reputation
Campaign Effectiveness
Competitive Analysis
Product Insight
MULTILINGUAL
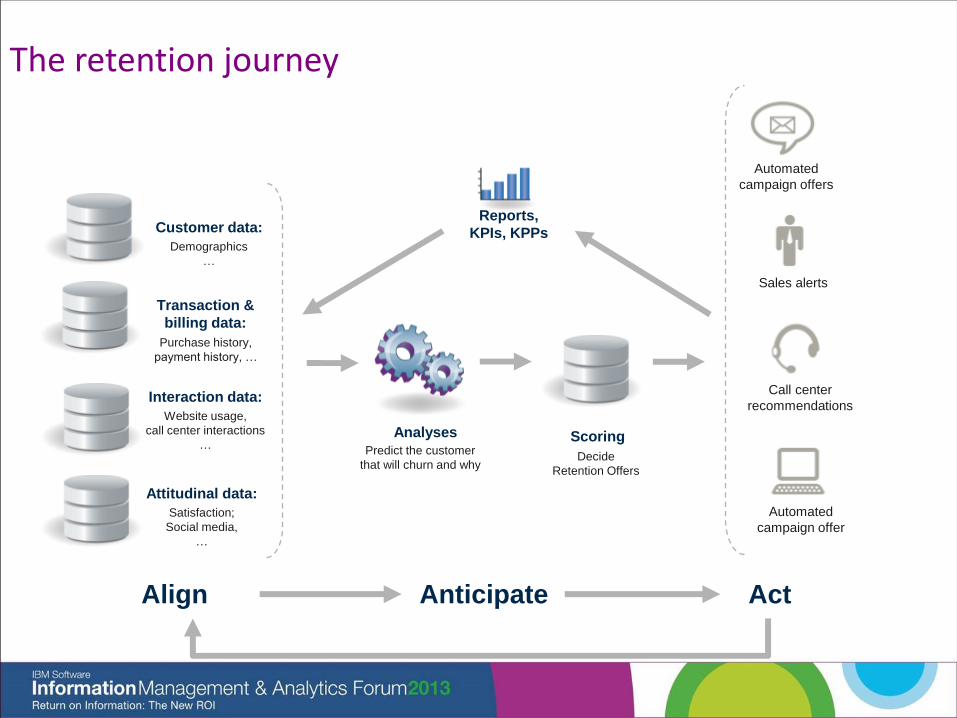
The retention journey
Align Anticipate Act
Reports,
KPIs, KPPs
Scoring Analyses
Predict the customer
that will churn and why
Customer data:
Demographics
…
Transaction &
billing data:
Purchase history,
payment history, …
Interaction data:
Website usage,
call center interactions
…
Attitudinal data:
Satisfaction;
Social media,
…
Decide
Retention Offers
Automated
campaign offers
Sales alerts
Call center
recommendations
Automated
campaign offer

Real Business Results:
- 60 percent improvement in revenue retention rates
- Realizing millions of dollars in annualized revenue protection
- Fewer client services managers are needed for the same level of risk coverage
.
XO Communications adopted IBM SPSS Statistics and
IBM SPSS Modeler software to help identify customers
who were at a high risk of moving to another service
provider.
The Solution
XO Communications
What Makes it Smarter
•Understanding critical data is key to identifying risk factors. XO Communications •Deployed an IBM SPSS predictive analytics solution that evaluates more than 500 variables for predicting customer defections within 90 days •Allowed the Customer Intelligence team at XO to build an accurate regression model keying on the 25 most relevant variables •Client service managers can then proactively prioritize outbound calls to at-risk accounts.
Real Business Results
The Need improve its small business retention rate, a U.S. telecommunications company is using predictive analytics to anticipate voluntary customer defections.
• IBM SPSS® Statistics
and Modeler
Solution Components

Customer Analytics Sales Play
Customer Acquisition
Customer Profitability &
Growth
Customer Service & Satisfaction
Banking Customer Profitability
Insurance Customer Retention & Growth
Telco Churn Prediction
Retail Market Basket Analysis
Retail Assortment Planning
Retail / CP Social Media Analytics (CCI)
Banking Marketing
Optimization
Cognos Consumer Insight
(CCI) Application
Customer Performance
Sales Analytics
Application
Industry-Led Business Analytics Solutions
Customer Analytics Industry Specific Solutions

Customer analytics maturity model
.
.
.
.
Insight for Decision Makers
The Next Best Action
Information Cost Reduction Foundational
0.2% - 2.9%
Information Sharing Competitive
6.2% - 18.7%
Information Responsiveness Differentiating
16.9% - 38.2%
Information on Demand Breakaway
24.1% - 64.3%

Build long term customer relationships that drive enterprise business results—one interaction, one decision at a time
Banking/FM Telco
Business outcomes • Communications company
reduced customer churn by 15-20 percent
• Communications company increased client retention by 20 percent in two months
• Insurance company increased agent retention by up to 40 percent
Solution overview
Deliver the most appropriate action at the right time across
channels. Personalized interactions are enabled by:
• Comprehensive view of a customer
• Real-time analytics to anticipate customer behavior
• Cross-channel delivery of best action to address
customer
need and enhance long term business revenue
Solution benefits
• Improve service delivery and customer satisfaction
• Optimize revenue generating actions such as up sell,
cross sell and retention
• Increase strategic lifetime value and loyalty
Insurance
IBM Smarter Analytics Signature Solution
Next Best Action

Next Best Action: Decision Process Flow
Decision Management
determines NBA from:
• Marketing offers (EMM)
• Service Problems
• Billing Information
• Location
• Service Issue
• Issue Resolution
• Dispute
• Satisfaction
• Account Management
• Advice
• Self Service
• Channel Match
• Agent Match etc.
4
Demographic
(DB, surveys)
Interactions
(Call center, Web)
Behavioral
(Orders, Payments)
Attitudinal
(Surveys, Social / CCI)
Cross-channel
Campaign
Management
Real Time
Marketing
Enterprise Marketing
Management
Decision
Services
IVR Chat Session Web Email Mobile
Apps Voice Call Center SMS
1 Request for Next Best
Action (NBA) from channel
5 Next Best Action delivered to the customer
through the appropriate channel
DM receives list of candidate
marketing offers from EMM 2
Optionally EMM calls out to SPSS to
help determine candidate offers 3
Big Data
Platform
Information
Integration &
Governance
Data Warehouse Hadoop Stream Computing
Core Database Enterprise Content Management
Business Rules
Text Analytics
Predictive Analytics
Entity Analytics
Optimization

Example: Next Best Action for Telecommunications
Information
Analytics
Speaking
with the
customer
Building
predictive
models
Defining the
Next Best
Action
Creating
marketing
offers
Establishes the
Information
Supply Chain
Operations
THE CALL CENTER AGENT

3
2

3
3
KPI Value
Dropped call Rate
2%
Complaint / Sentiment
Unhappy with his phone
Trend Tweet
I really want a Blackberry Bold… I still love my HTC though
Ugh, my phone keeps getting disconnected
Ok, now I’m getting really irritated. My phone dropped again! DCI
2%

3
4

A
3
5

S
3
6

3
7

3
8

3
9
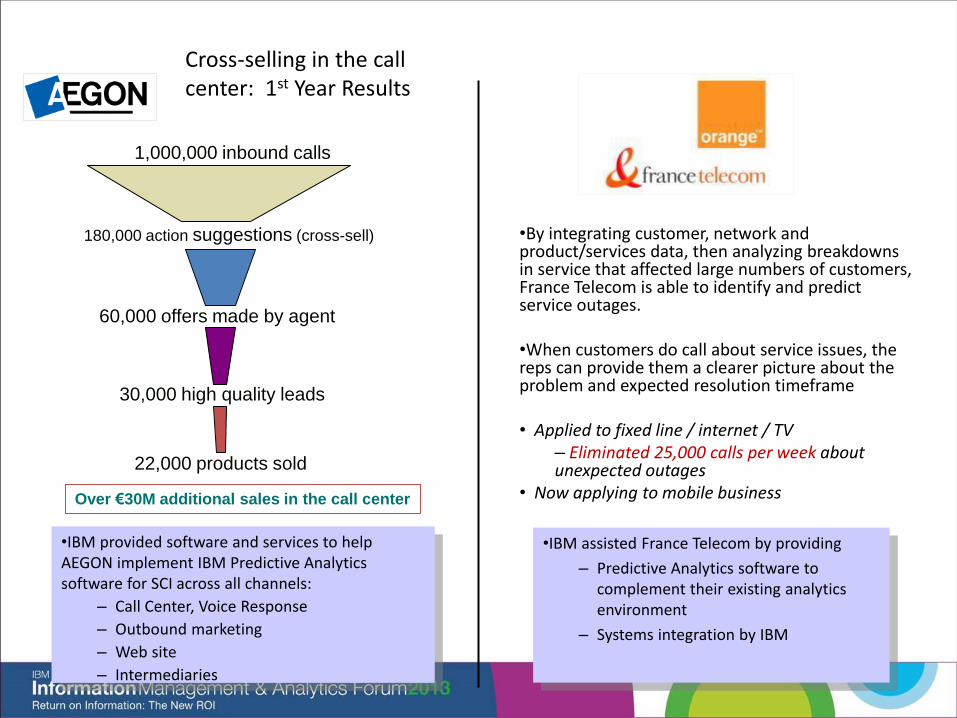
Cross-selling in the call center: 1st Year Results
1,000,000 inbound calls
180,000 action suggestions (cross-sell)
60,000 offers made by agent
30,000 high quality leads
22,000 products sold
Over €30M additional sales in the call center
•IBM provided software and services to help AEGON implement IBM Predictive Analytics software for SCI across all channels:
– Call Center, Voice Response
– Outbound marketing
– Web site
– Intermediaries
•By integrating customer, network and product/services data, then analyzing breakdowns in service that affected large numbers of customers, France Telecom is able to identify and predict service outages.
•When customers do call about service issues, the reps can provide them a clearer picture about the problem and expected resolution timeframe
• Applied to fixed line / internet / TV – Eliminated 25,000 calls per week about unexpected outages
• Now applying to mobile business
•IBM assisted France Telecom by providing
– Predictive Analytics software to complement their existing analytics environment
– Systems integration by IBM