
Bestinver
10
Página 1 “Value Investing”" MARZO 2013
description
Transcript of Bestinver

Página 1
“Value Investing”"
MARZO 2013
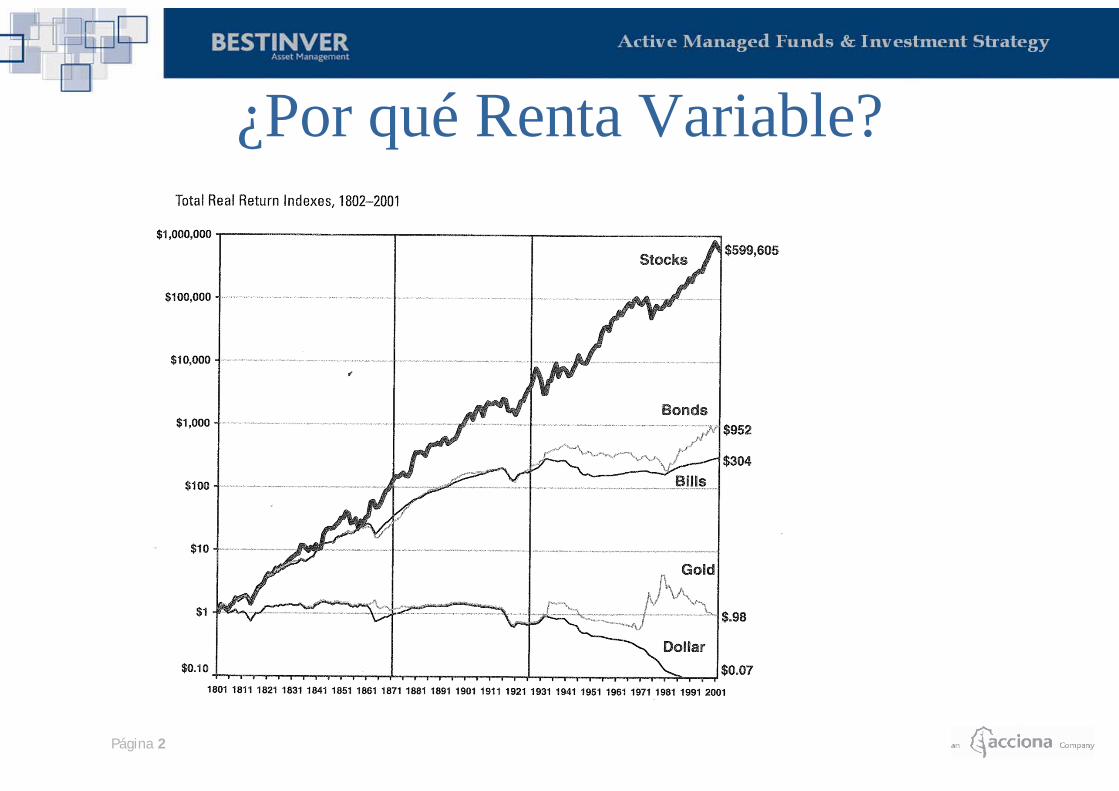
¿Por qué Renta Variable?
Página 2

¿Por qué no Renta Fija?
Página 3
BONO DEL ESTADO ARGENTINO (2000-2007) ÍNDICE BURSÁTIL MERVAL (2000-2007)
-70%
+300%

¿Por qué análisis fundamental?
Un mismo origen Intelectual (Graham and Doddsville): Características comunes a todos ellos
– Invierten a LP en acciones de empresas que entienden («círculo de competencia»)– Aplican sistemáticamente el “value investing” (inversión fundamental).– Otorga poca relevancia al análisis macroeconómico– Encuentra poco interesante el análisis técnico.– No utilizar instrumentos de cobertura.
Conclusión: Intentar aplicar técnicas similares
Página 4
GESTOR RENTABILIDAD ANUAL MEDIA
NÚMERO DE AÑOS
RENTABILIDAD ANUAL VS. ÍNDICE
WARREN BUFFETT (Berkshire) 20,30% 44 11,00%PACIFIC PARTNERS 23,60% 19 15,80%STAN PERLMETER 19,00% 18 12,00%SEQUOIA FUND 18,20% 14 9,00%
WALTER SCHLOSS 16,10% 28 8,70%TWEEDY BROWNE 16,00% 15 8,20%CHARLES MUNGER 13,70% 14 7,70%
31/12/2009

Página 5
* Returns for BESTINFOND to 31/12/1997 and B. BOLSA from 01/01/1998* BENCHMARK is a weighted average of IGBM of IGBM (70%) (Madrid Stock Exchange Index) and PSI (30%).* All Bestinver returns are expressed as net, after expenses and commissions.
BESTINVER SPANISH EQUITIES vs. BENCHMARK
COMPARATIVE PERFORMANCE
YEAR BESTINVER IBERIAN EQUITY BENCHMARK Relative perf.
1993 43,91% 46,67% -2,76%
1994 5,28% -11,70% 16,98%
1995 10,33% 12,30% -1,97%
1996 41,01% 38,96% 2,05%
1997 41,01% 42,22% -1,21%
1998 29,03% 37,19% -8,16%
1999 -10,98% 16,22% -27,20%
2000 13,91% -12,68% 26,59%
2001 21,22% -6,39% 27,61%
2002 8,25% -23,10% 31,35%
2003 38,31% 27,44% 10,87%
2004 29,97% 18,70% 11,27%
2005 27,07% 20,56% 6,51%
2006 37,36% 34,49% 2,87%
2007 4,84% 5,60% -0,76%
2008 -35,16% -40,56% 5,40%
2009 34,56% 31,37% 7,33%
2010 3,68% -15,24% 18,93%
2011 -12,66% -16,23% 3,57%
2012 14,88% -0,12% 15,00%
04/03/2013 3,94% 1,72% 2,22%
Return since 1993 1671,39% 276,53% 1394,87%
Average annual return 15,34% 6,80% 8,54%

¿Cómo lo hacemos?• Sólo dos cosas
– 1. Saber valorar un negocio– 2. Mantener una determinada actitud frente a las fluctuaciones del mercado
Algunas consideraciones adicionales• Invertir en empresas que cotizan con un descuento razonable respecto a su verdadero valor económico teniendo en
cuenta que:
• Es imprescindible distinguir entre la cotización de una empresa (influida por factores psicológicos e ineficienciasde mercado) y su valor económico (valor asociado a los activos, beneficios, deuda, perspectivas, etc).
• En el corto plazo la evolución del precio de una empresa es totalmente imprevisible ya que está influida porcircunstancias que quedan fuera del control de los inversores (factores psicológicos, manipulaciones del mercado,conflictos políticos, etc). Sin embargo, a largo plazo, las cotizaciones siempre tienden a reflejar el valor económicode las empresas.
• Intentar predecir la evolución de los mercados es una tarea complicada que precisa mucha dedicación y, aún así,las previsiones rara vez resultan acertadas. Preferimos dedicarnos a la búsqueda de buenas empresas infravaloradasya que seguramente tendrán una mejor evolución que el mercado, sea cual sea el comportamiento de éste.
Página 6

7
BUEN EQUIPO GESTOR
- Operando el negocio
- Invirtiendo la caja generada
- Apropiado sistema de incentivos
- El accionista es la primera prioridad
BUEN PRECIO
- Precio < 70% valor
- Descuento de Flujos
- Operaciones Corporativas similares
- Valor de liquidación
BUEN NEGOCIO
- Comprensible
- Ventaja competitiva
- Generador de caja
- Con crecimiento

Página 8
AUSTRIAN SCHOOL OF ECONOMICS
• Economic general structure• Human behavior• Non-predictable consequences in stocks• Euphoria / Panic
GOOD PRICE DUE TO:
• Shareholder structure (family owned)• Type of shares (preferred, non-voting, etc.)• Geographical reasons: business and shareholders in different zones • Long term projects (impatient market)• Small caps (unnoticed by the market)• Asset organization (Holdings..)
COMPANIES WITH:
• Competitive advantage:• High ROCE• Sustainable
• Correct attitude with generated cash-flow
. Economic Cycle
TIME
• Patience• Psychological preparation• Client education
Philosophy: four key cornerstones

Página 10
• This document has been prepared by Bestinver Gestión, S.A. SGIIC for informational purposes only and can be in no way considered an offerto participate in its investment funds. The information contained herein was compiled by Bestinver Gestión, S.A. SGIIC from sources itbelieves are reliable. However, while appropriate measures have been taken to verify its accuracy, Bestinver Gestión, S.A. SGIIC in no wayguarantees that it is accurate, complete or up to date.
• All opinions and estimates included in this document reflect the best judgment of Bestinver Gestión, S.A. SGIIC as of the date they refer toand may be changed without prior notification. All opinions issued herein are general in nature and do not take into consideration individualspecific investment objectives or financial circumstances.
• Under no circumstances can Bestinver Gestión, S.A. SGIIC, its managers, employees or authorized personnel be held responsible for anydamage resulting, directly or indirectly, from the use of the information contained within this document. Information regarding past returnsdoes not in any way constitute a promise or guarantee as to future performance.
• All Bestinver returns are expressed as net, after expenses and commissions. They are denominated in euros.• Share redemptions and transfers of securities held for less than one year are penalised with a commission• Source of Bestinver return and fees data: BESTINVER• Source of sector return and fees data: INVERCO• Source of national and international rankings: BESTINVER. Bestinver funds, third-party mutual funds and equity index returns (Madrid SE,
IBEX, S&P 500 and MSCI) are calculated based on the closing level on the date appearing at the bottom of this page.• Source of fund P/Es: BESTINVER• Source of market P/Es and Argentina Charts: Bloomberg• Source of Value Investors: “The Superinvestors of Graham-and-Doddsville”• Sources of Performance of diferent assets since 1800: Jeremy Siegel "Stocks for the long run" Irwin Professional