Best practices in using standardized tests for talent identification
86
David Lohman University of Iowa USA http://faculty.education.uiowa.edu/dlohman
Transcript of Best practices in using standardized tests for talent identification
David Lohman
University of Iowa
USA
http://faculty.education.uiowa.edu/dlohman
Introduction Background and disclaimers
Focus on ability testing
Especially group-administered
Screening for talent
Cognitive Abilities Test (CogAT)
www.intestcom.org

Guidelines for Adapting tests
Test use
Computer-based and internet-delivered testing
Quality control in scoring, test analysis, and reporting
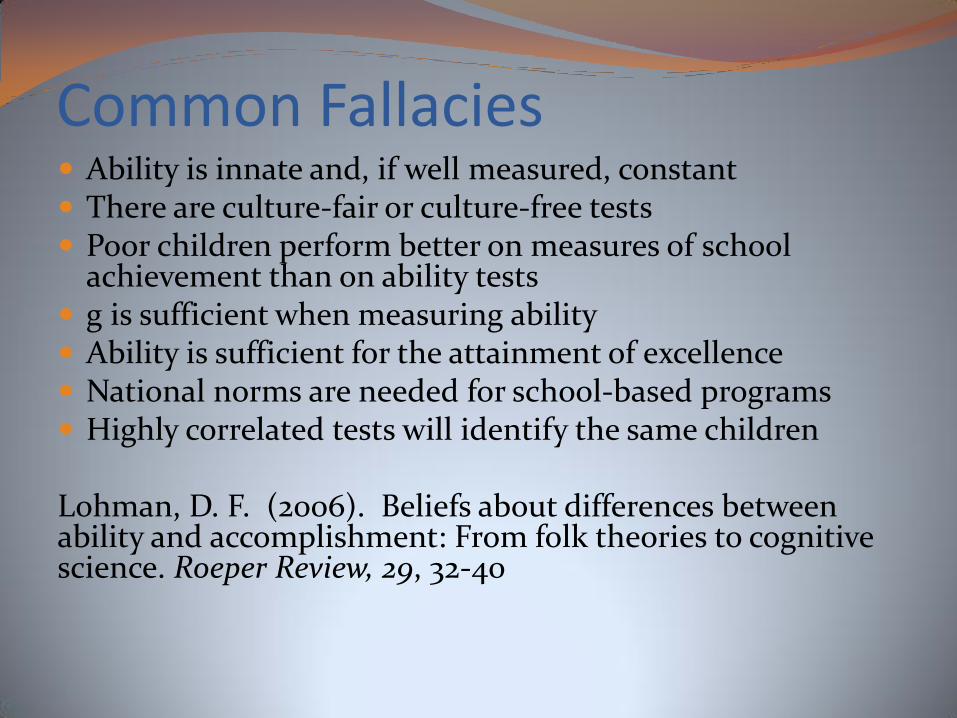
Common Fallacies Ability is innate and, if well measured, constant There are culture-fair or culture-free tests Poor children perform better on measures of school
achievement than on ability tests g is sufficient when measuring ability Ability is sufficient for the attainment of excellence National norms are needed for school-based programs Highly correlated tests will identify the same children Lohman, D. F. (2006). Beliefs about differences between ability and accomplishment: From folk theories to cognitive science. Roeper Review, 29, 32-40
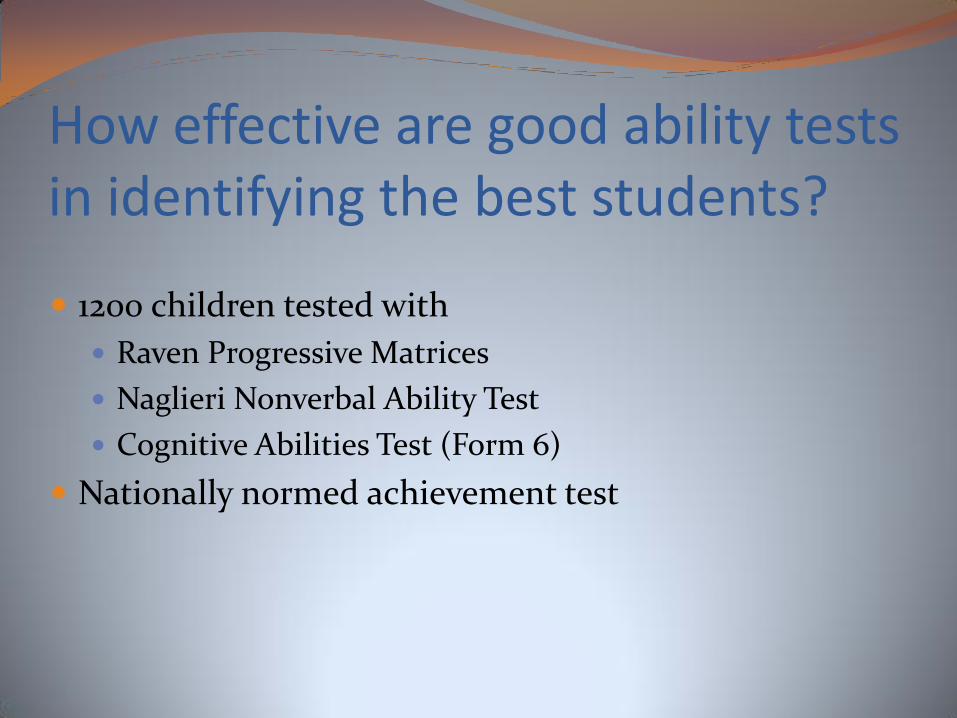
How effective are good ability tests in identifying the best students?
1200 children tested with
Raven Progressive Matrices
Naglieri Nonverbal Ability Test
Cognitive Abilities Test (Form 6)
Nationally normed achievement test

Ability Test Corr. with
Reading Ach
Percent of
students
above 90th PR
identified
CogAT
Verbal .78 54 %
Quantitative .65 43 %
Nonverbal .58 38 %
Raven .48 30 %
NNAT .40 27 %
Identifying High Achievers
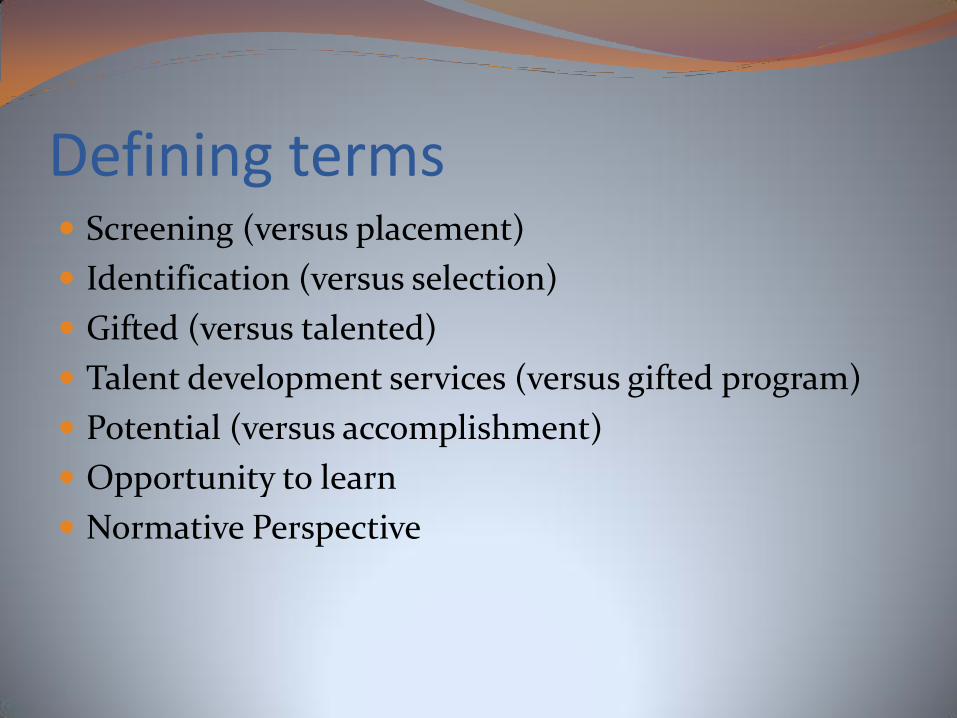
Defining terms Screening (versus placement)
Identification (versus selection)
Gifted (versus talented)
Talent development services (versus gifted program)
Potential (versus accomplishment)
Opportunity to learn
Normative Perspective
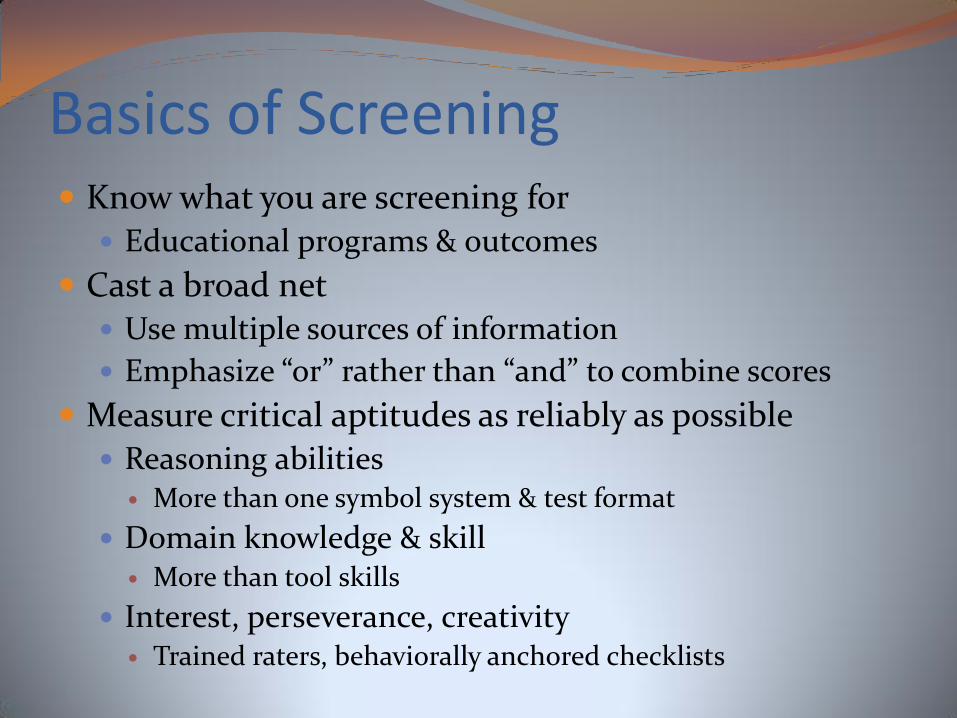
Basics of Screening Know what you are screening for
Educational programs & outcomes
Cast a broad net Use multiple sources of information
Emphasize “or” rather than “and” to combine scores
Measure critical aptitudes as reliably as possible Reasoning abilities
More than one symbol system & test format
Domain knowledge & skill More than tool skills
Interest, perseverance, creativity Trained raters, behaviorally anchored checklists

To Screen-or Not to Screen All Children “Identified” children
Multiple Ability Test Battery (Ability Profiles) to guide
both identification & placement
Short Screening Test (Single score)
Multiple Ability Test Battery (Ability Profiles) to help
guide placement
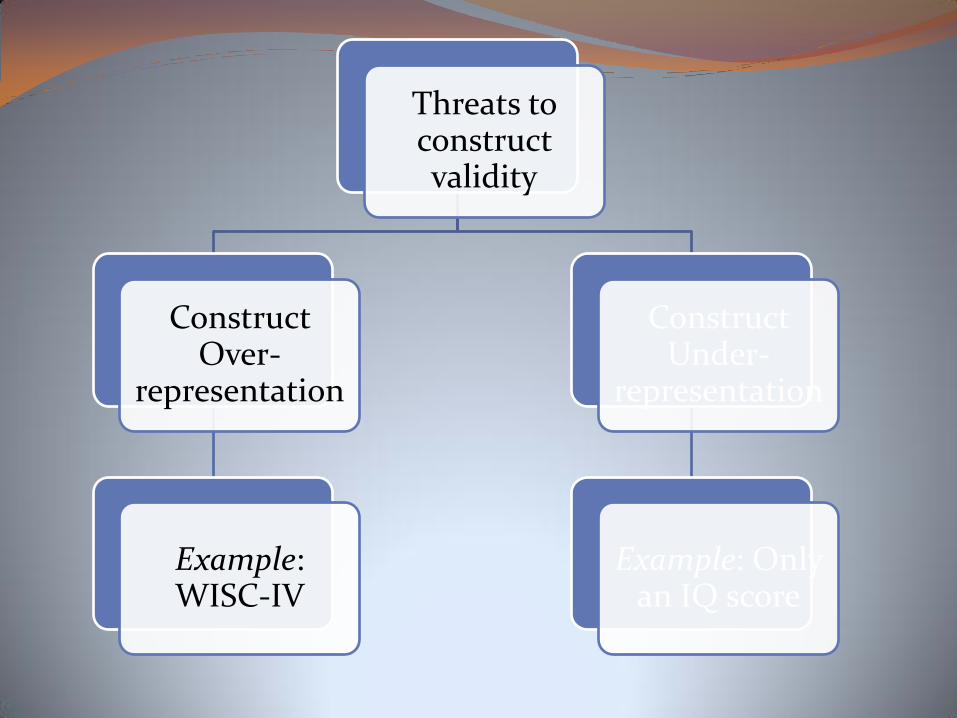
Threats to construct validity
Construct Over-
representation
Example: WISC-IV
Construct Under-
representation
Example: Only an IQ score

WISC-IV Spanish Target population: Bilingual Spanish-speaking
children in the U.S. with no more than 5 years of U.S. schooling
Translated & adapted the verbal tests
Calibrated the Spanish Verbal Scale with the normative (English) Verbal Scale
Two additional PRs that index opportunity to learn by % education in U.S.
+ Parental educational level

Language versus cultural loading WISC IV – Spanish
Language load dramatically reduced
What about cultural loading?
Reasoning Indexes
Verbal Comprehension (Vocab, Similarities, Comprehension)
Perceptual Reasoning (Block Design, Picture Concepts, Matrix Reasoning)
Which index most affected by % education received in U.S. schools?

WISC-IV Spanish Scores
by Percent Education in the U.S.
84858687888990919293949596979899
100101
Full Scale IQ Verbal Comp Perceptual
Reasoning
WISC-IV Score
Sc
ale
Sc
ore
(M
= 1
00
, S
D =
15
)
Minimal (<30%)
Most
All (100%)
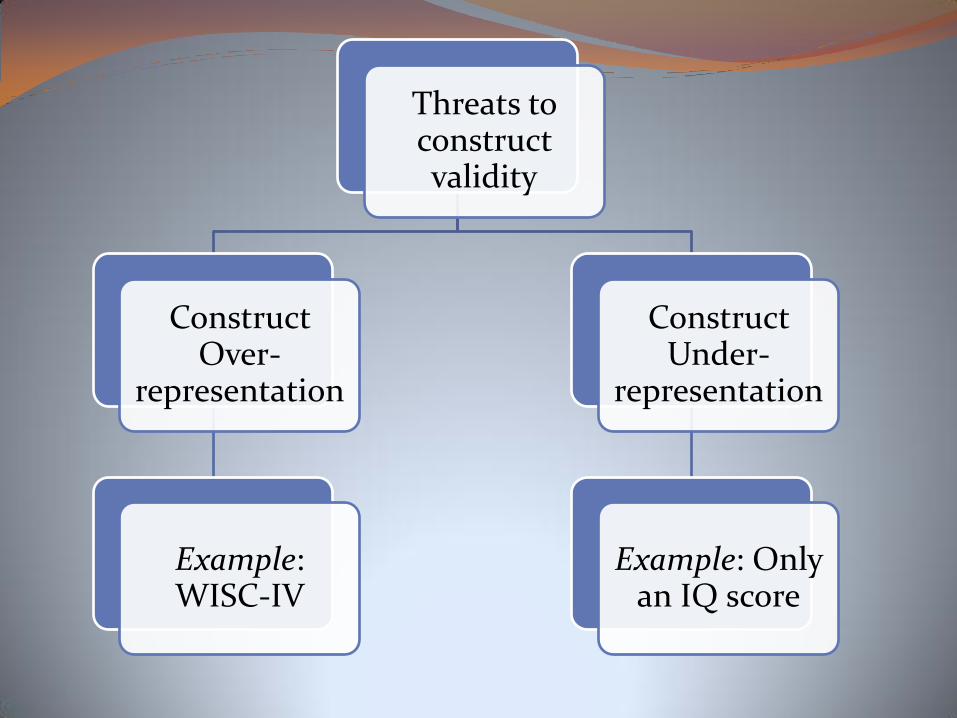
Threats to construct validity
Construct Over-
representation
Example: WISC-IV
Construct Under-
representation
Example: Only an IQ score


Stanines

CogAT Profiles Batteries
Verbal
Quantitative
Nonverbal
Pattern & level of scores capture in a profile code
“A” All three scores are at approximately the sAme level
“B” One score is aBove or Below the other scores
“E” An Extreme difference (> 24 IQ-like points)

0
5
10
15
20
25
30
35
40
45
50
1 2 3 4 5 6 7 8 9
Perc
en
t
Median Stanine
Profile Frequency by Median Stanine
Flat
Weakness
Lohman, D. F., Gambrell, J., & Lakin, J. (2008). The commonality of extreme discrepancies
in the ability profiles of academically gifted students. Psychological Science , 50, 269-282.
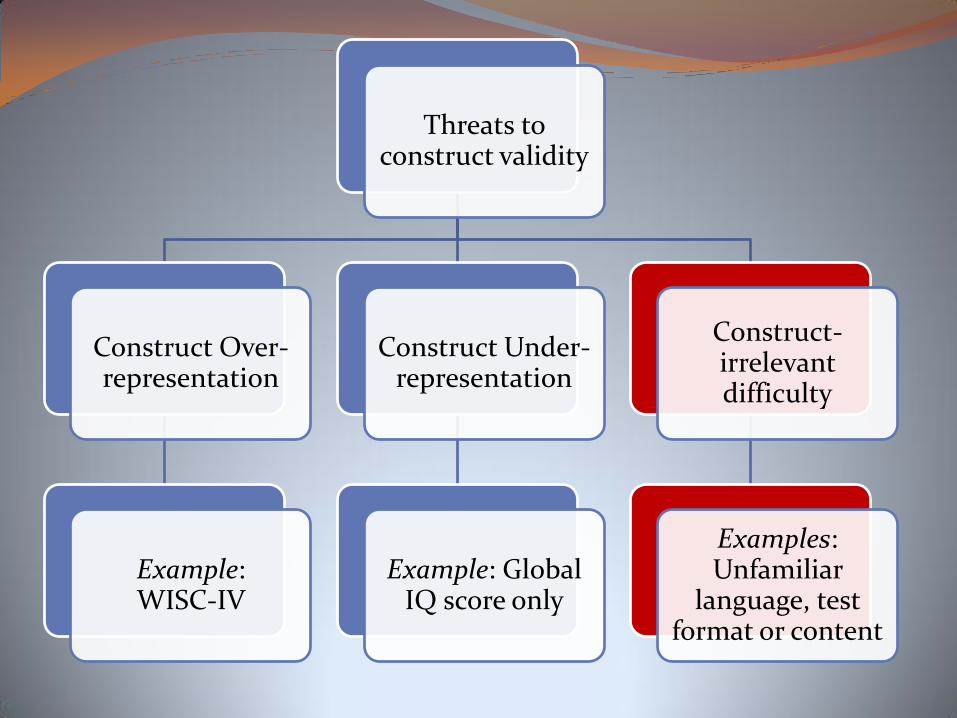
Threats to construct validity
Construct Over-representation
Example: WISC-IV
Construct Under-representation
Example: Global IQ score only
Construct-irrelevant difficulty
Examples: Unfamiliar
language, test format or content
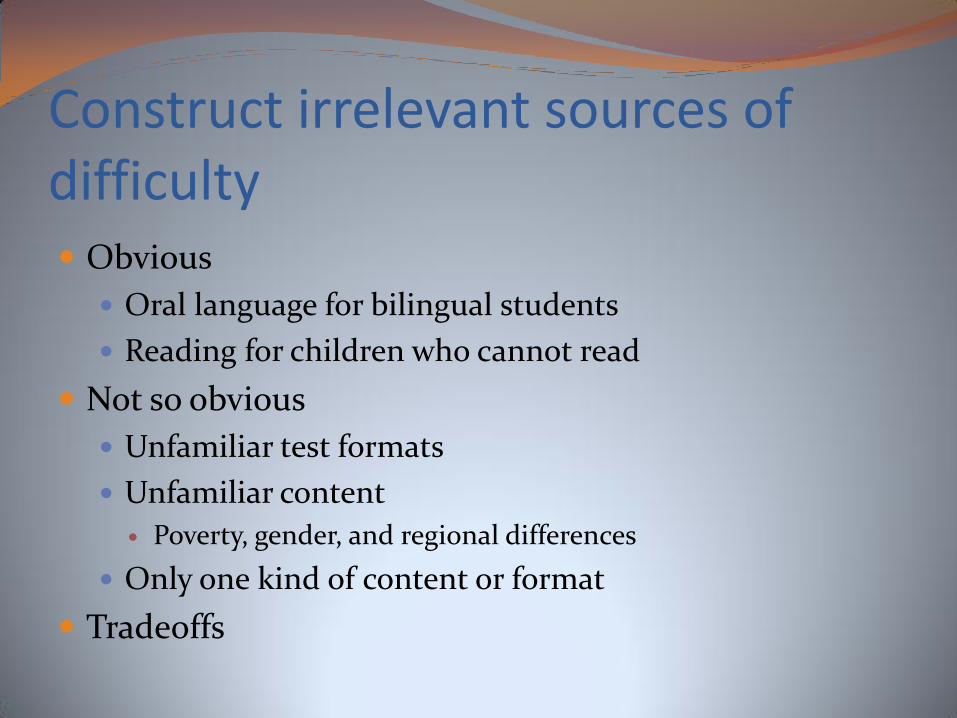
Construct irrelevant sources of difficulty Obvious
Oral language for bilingual students
Reading for children who cannot read
Not so obvious
Unfamiliar test formats
Unfamiliar content
Poverty, gender, and regional differences
Only one kind of content or format
Tradeoffs
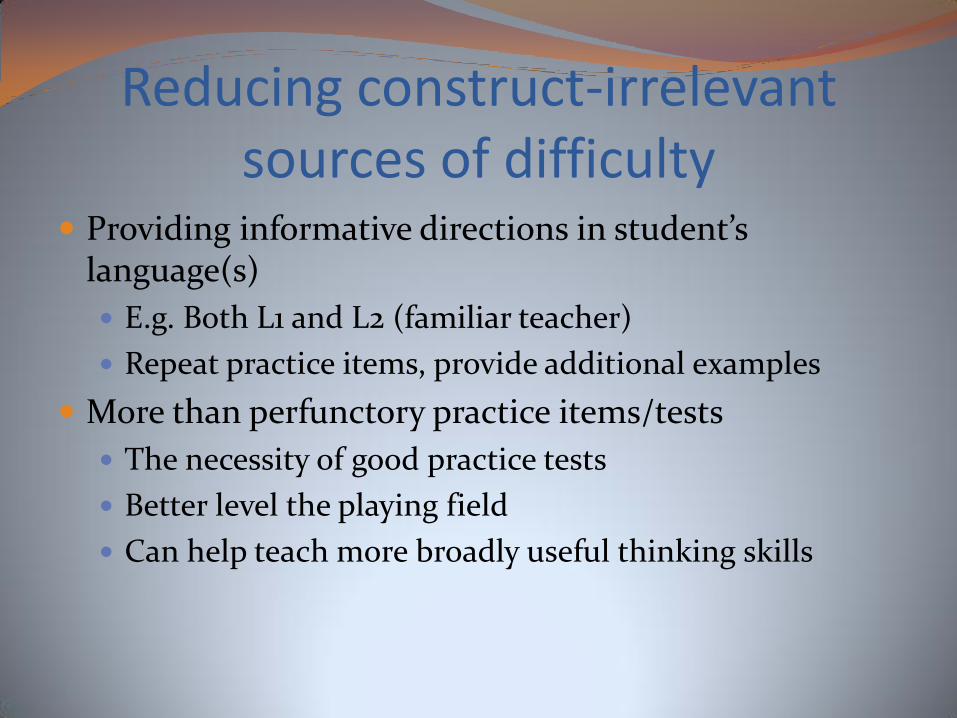
Reducing construct-irrelevant sources of difficulty
Providing informative directions in student’s language(s)
E.g. Both L1 and L2 (familiar teacher)
Repeat practice items, provide additional examples
More than perfunctory practice items/tests
The necessity of good practice tests
Better level the playing field
Can help teach more broadly useful thinking skills
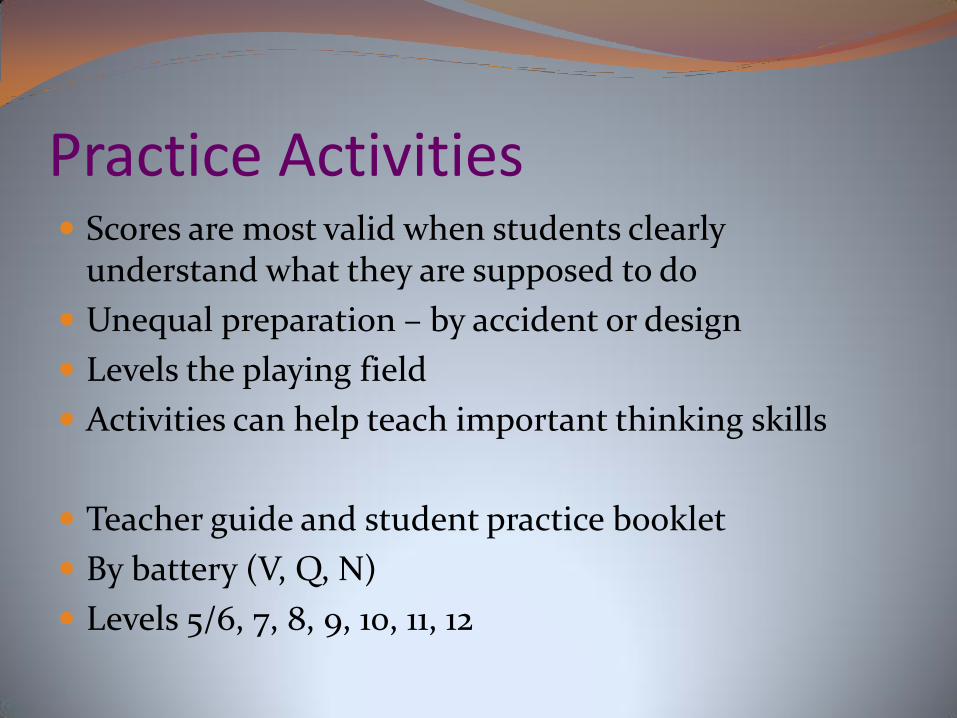
Practice Activities Scores are most valid when students clearly
understand what they are supposed to do
Unequal preparation – by accident or design
Levels the playing field
Activities can help teach important thinking skills
Teacher guide and student practice booklet
By battery (V, Q, N)
Levels 5/6, 7, 8, 9, 10, 11, 12
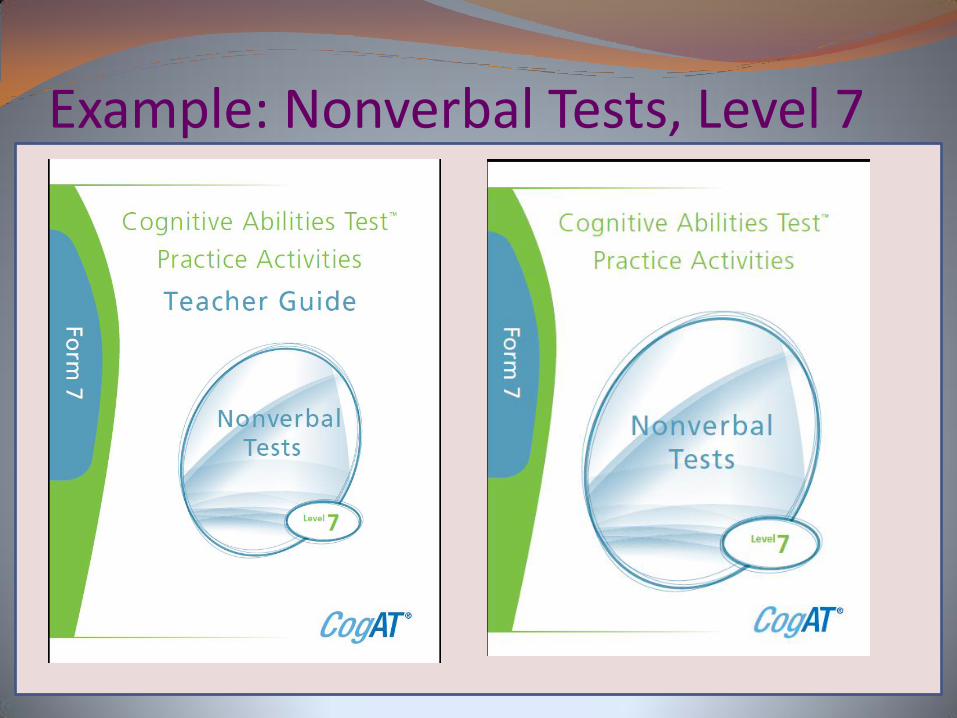
Example: Nonverbal Tests, Level 7
For inferences about ability versus inferences about achievement
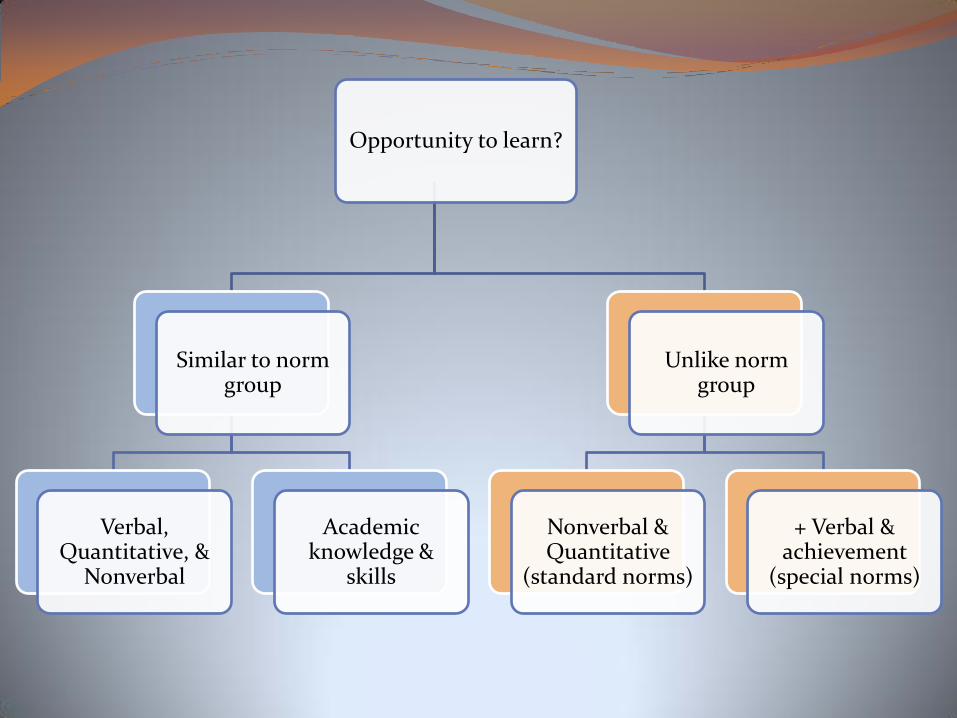
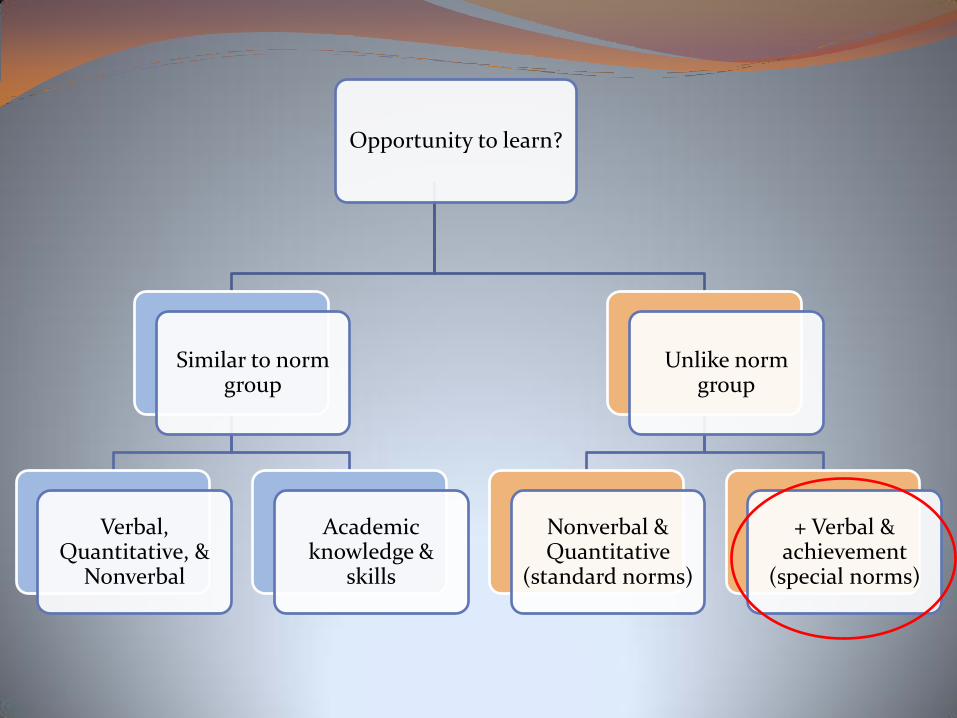
Opportunity to learn?
Similar to norm group
Verbal, Quantitative, &
Nonverbal
Academic knowledge &
skills
Unlike norm group
Nonverbal & Quantitative
(standard norms)
+ Verbal & achievement
(special norms)

Figural Reasoning tests
Reduce effects of oral language (but not culture)
Construct under-representation
Quantitative reasoning an important ally
Directly linked to instruction
Comprehensive “Nonverbal” tests
Verbal concepts/reasoning pictorially
best for young children
Quantitative reasoning pictorially and/or small integers
Unlike norm group
Option 1: “Nonverbal” tests
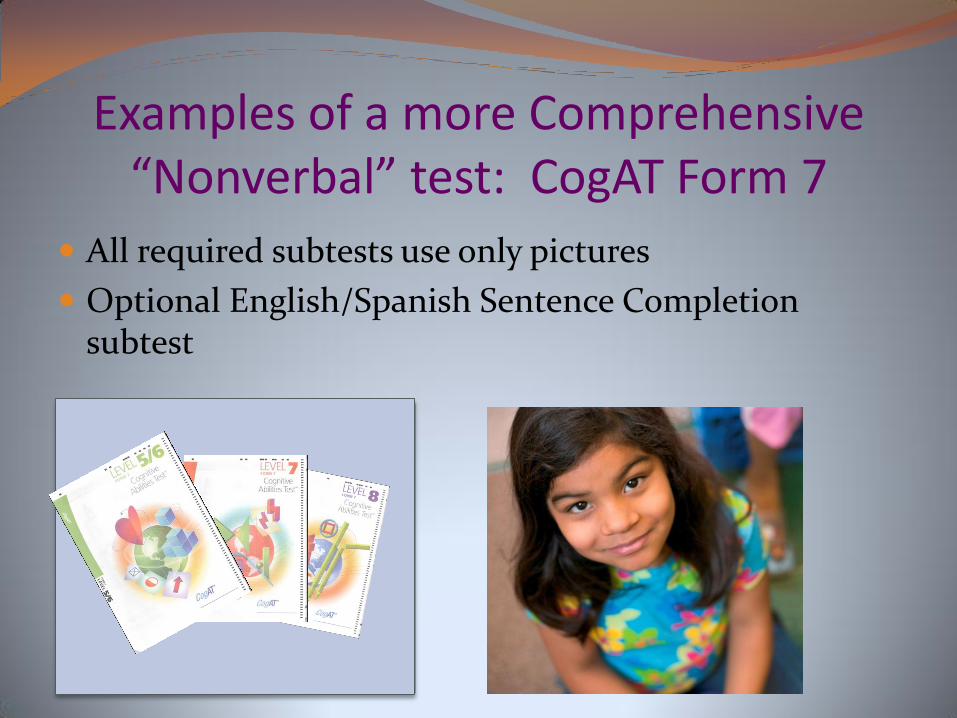
Examples of a more Comprehensive “Nonverbal” test: CogAT Form 7
All required subtests use only pictures
Optional English/Spanish Sentence Completion subtest
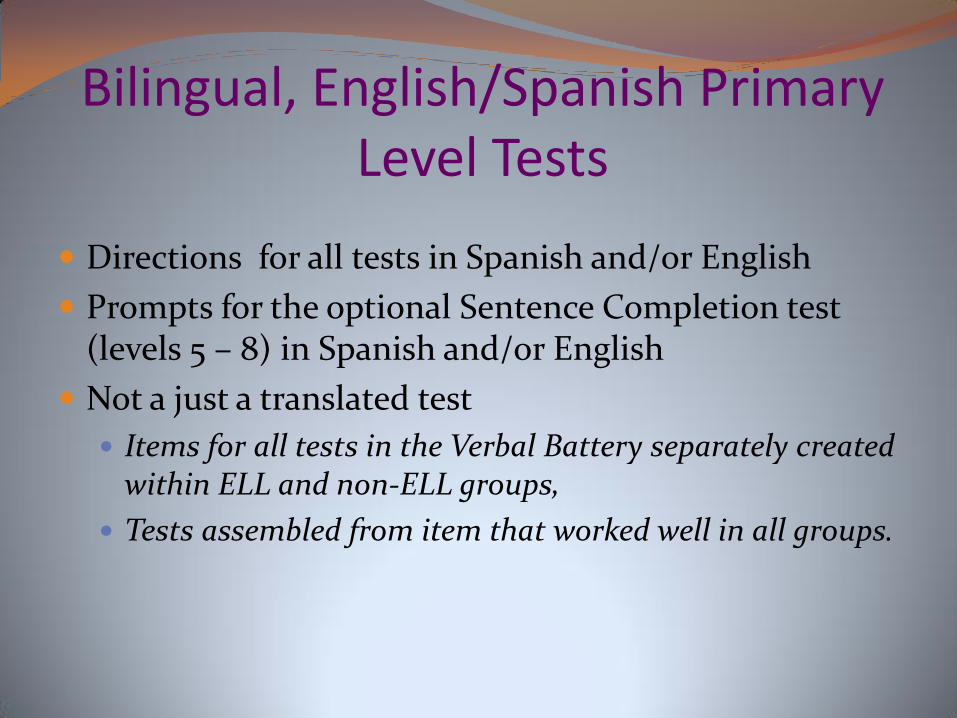
Bilingual, English/Spanish Primary Level Tests
Directions for all tests in Spanish and/or English
Prompts for the optional Sentence Completion test (levels 5 – 8) in Spanish and/or English
Not a just a translated test
Items for all tests in the Verbal Battery separately created within ELL and non-ELL groups,
Tests assembled from item that worked well in all groups.
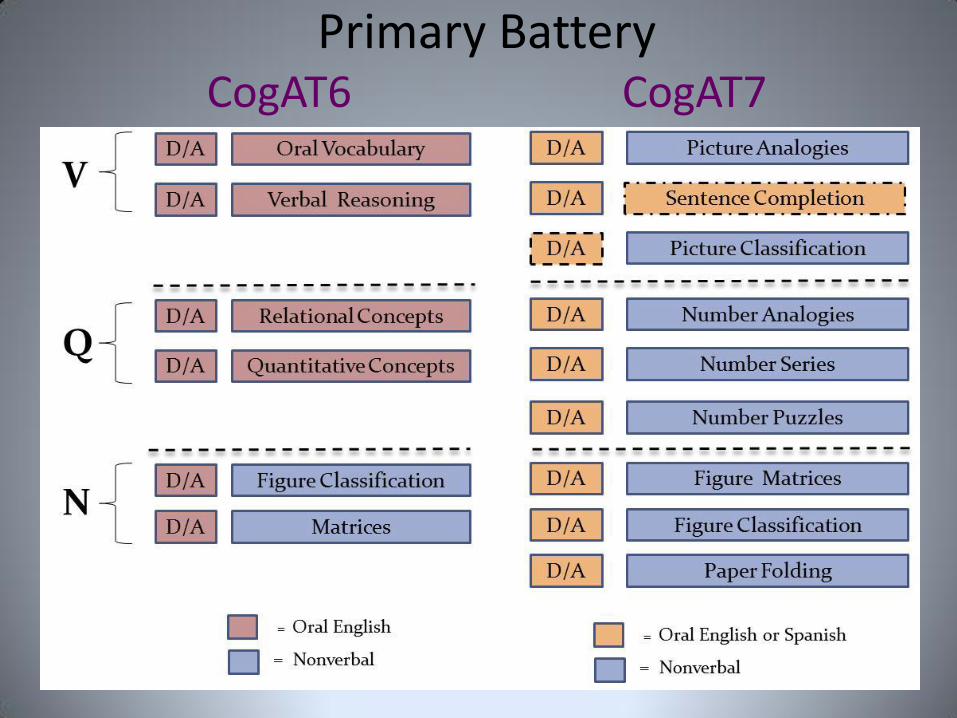
Primary Battery CogAT6 CogAT7
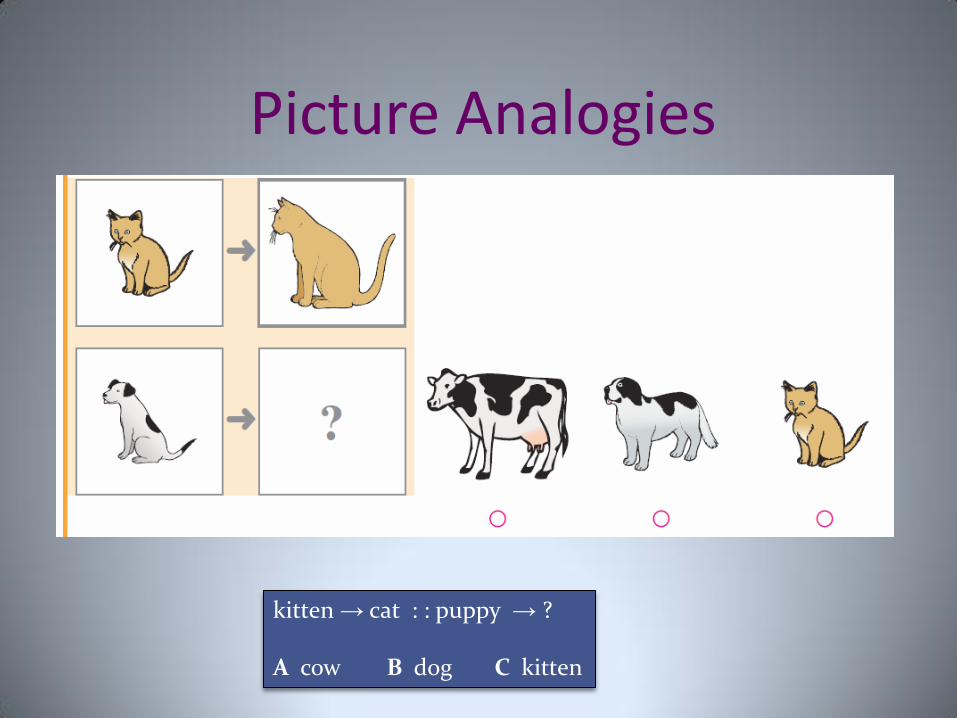
Picture Analogies
kitten → cat : : puppy → ? A cow B dog C kitten
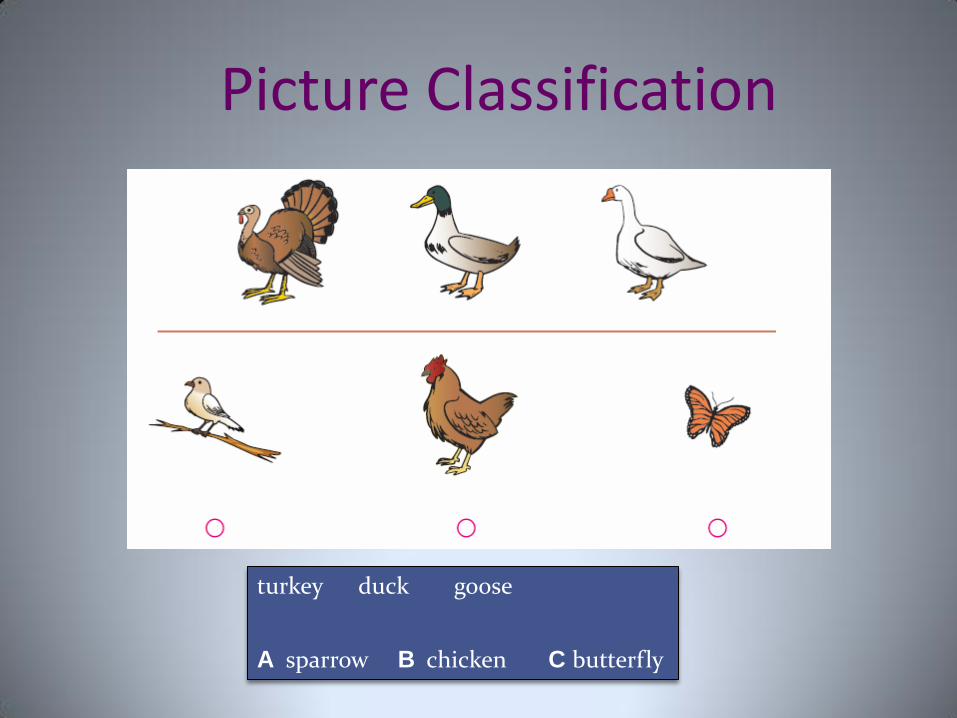
Picture Classification
turkey duck goose
A sparrow B chicken C butterfly

Sentence Completion .
Which one swims in the ocean? ¿Cuál animal nada en el océano?
A _________ swims in the ocean. A cat B shark C bird
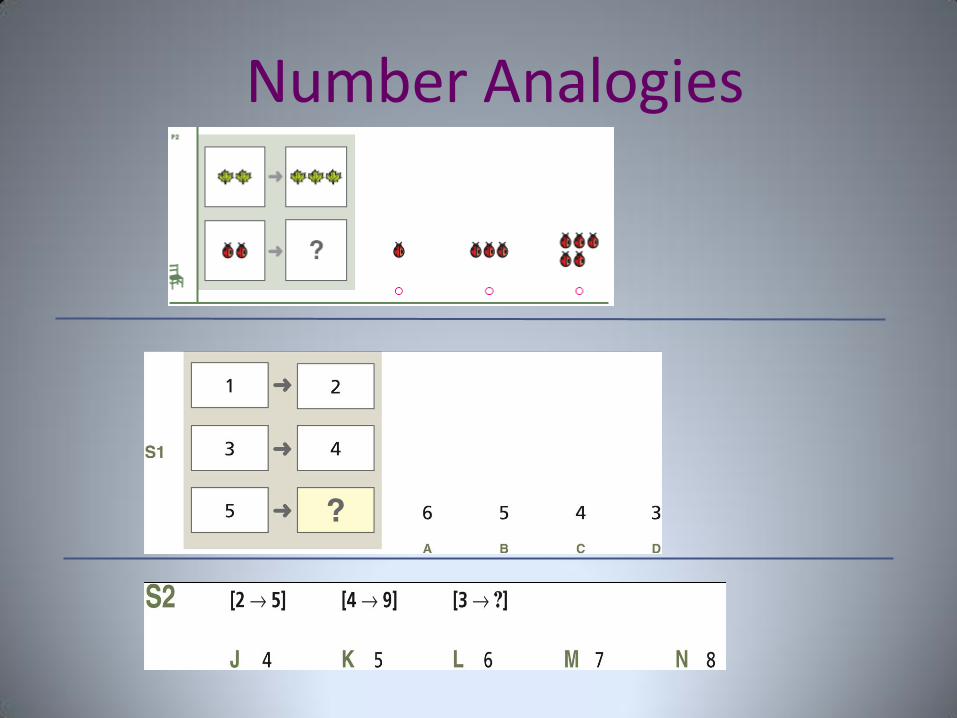
Number Analogies
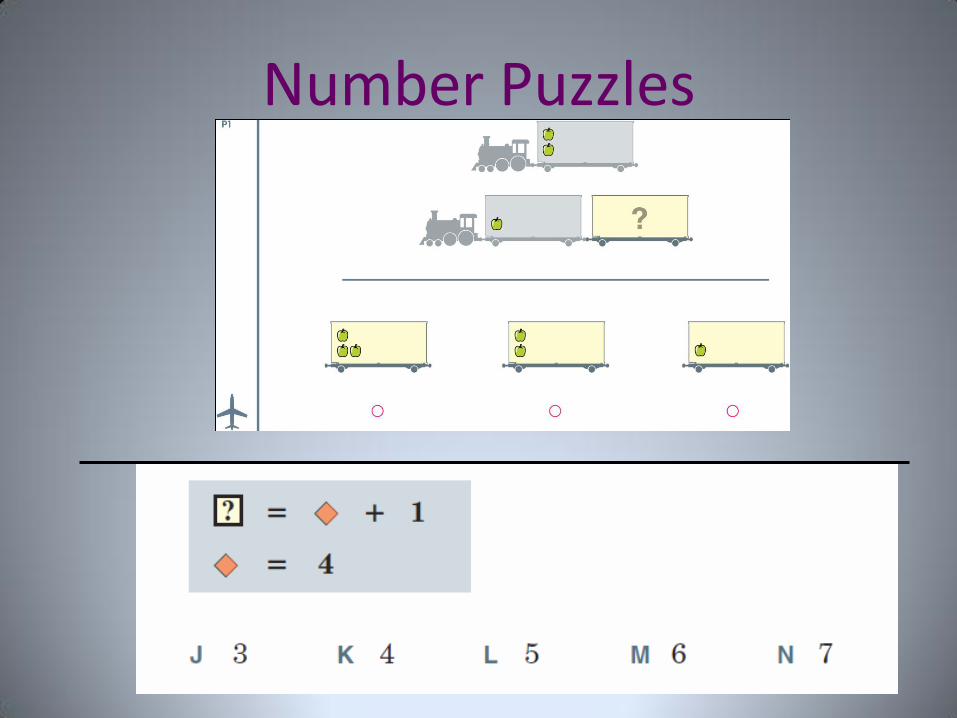
Number Puzzles

Number Series
2 4 6 2 4 ?
A 2 B 4 C 5 D 6
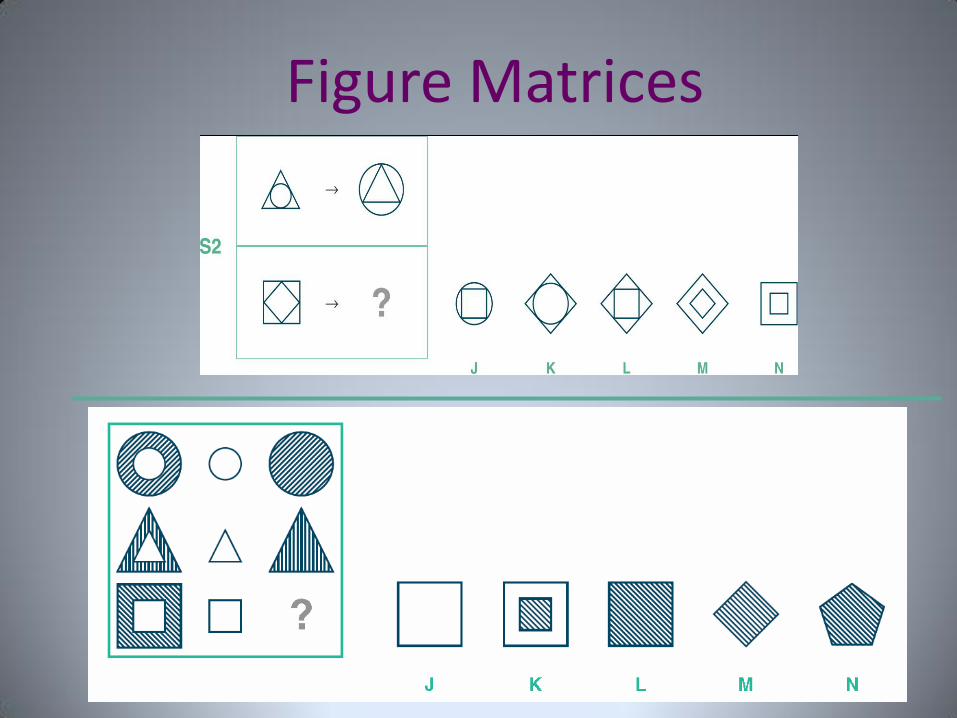
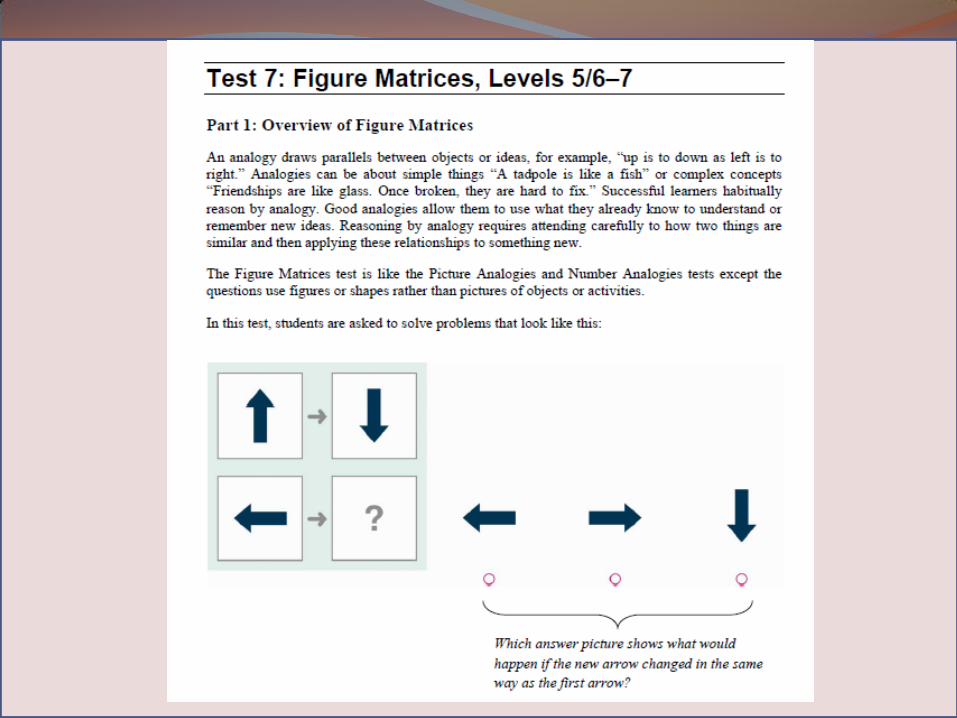
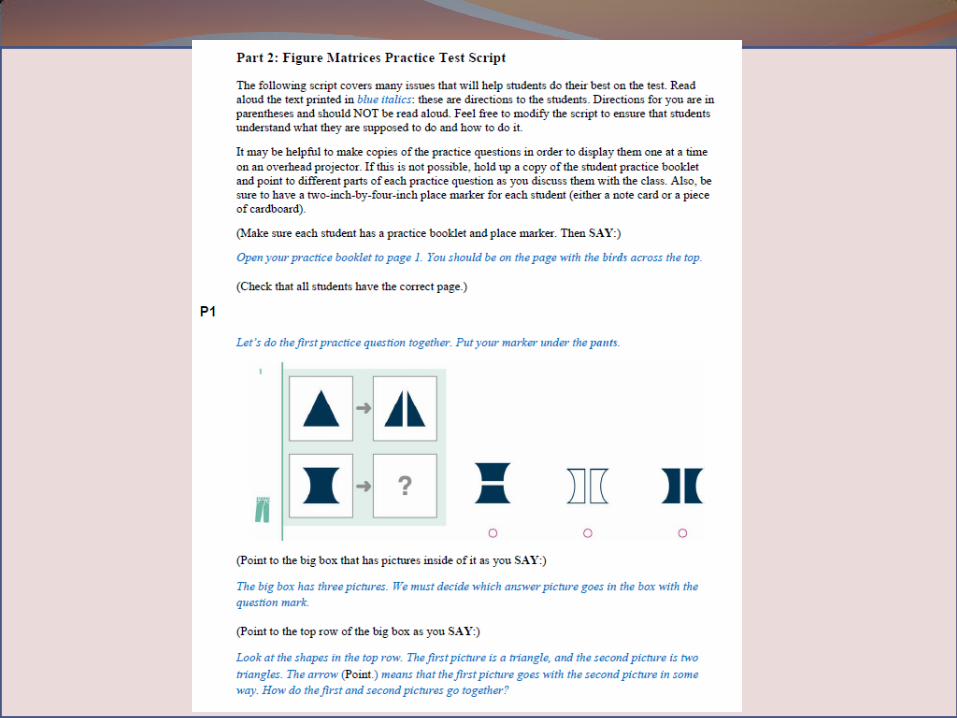
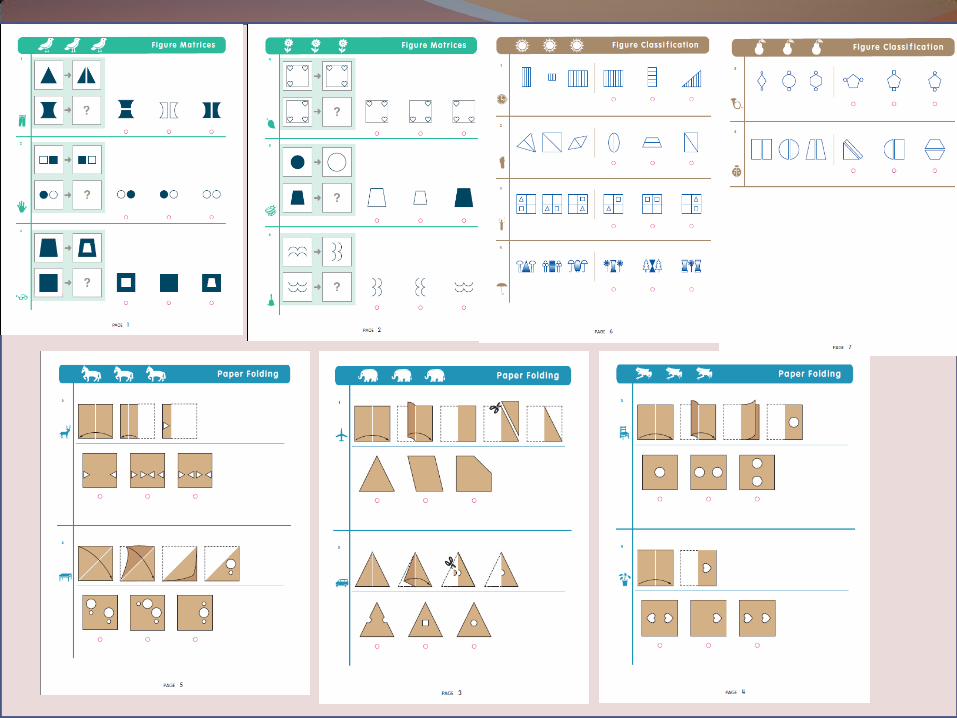
Figure Matrices
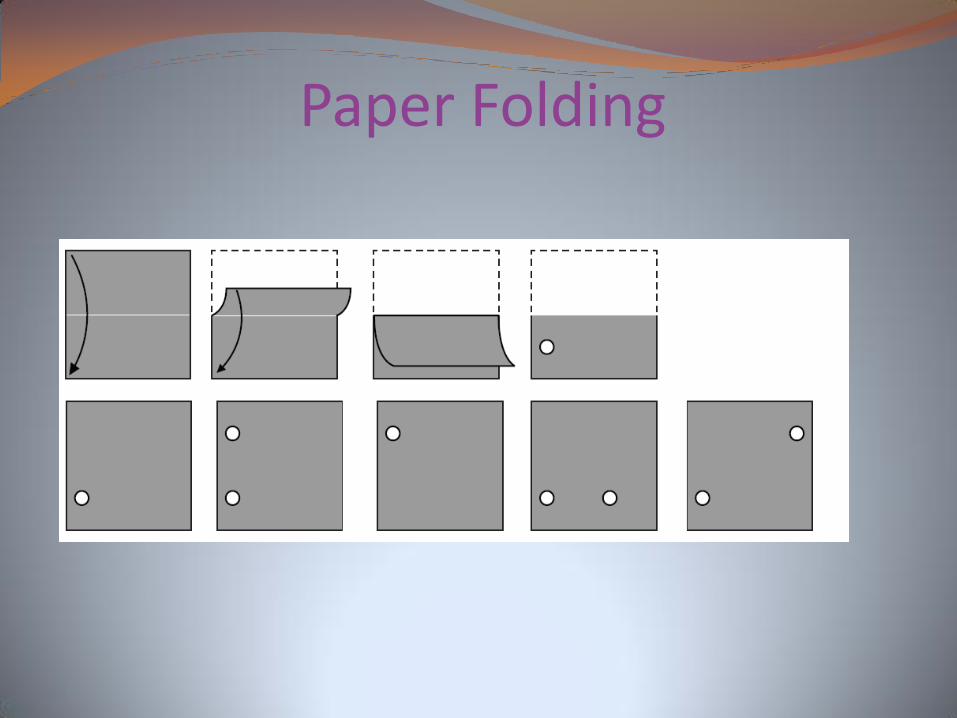
Paper Folding
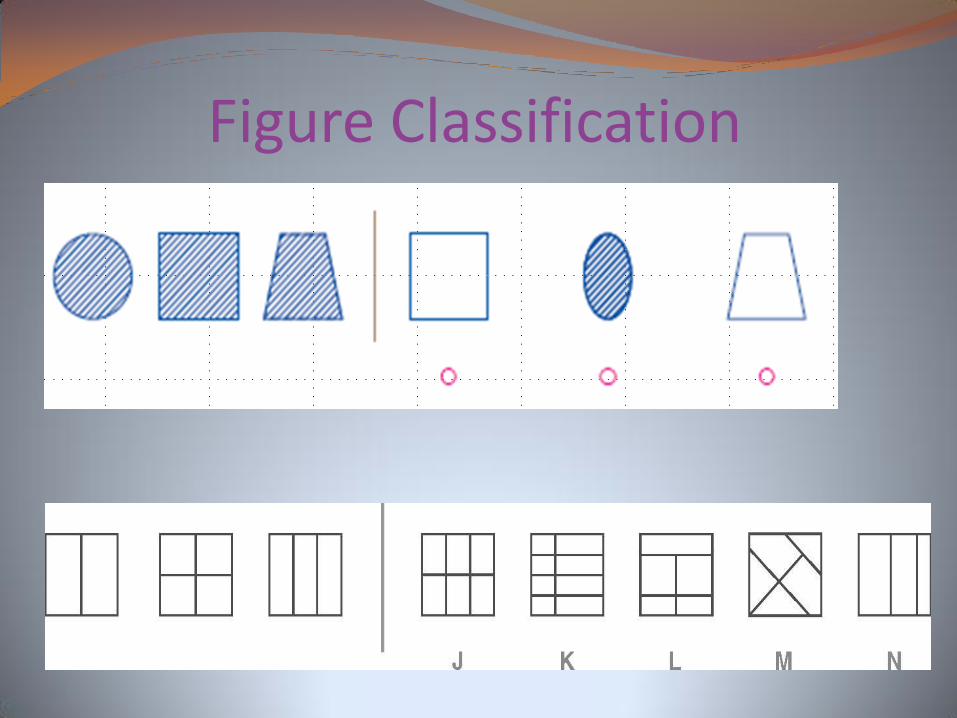
Figure Classification
Advantages of “comprehensive” picture-based tests

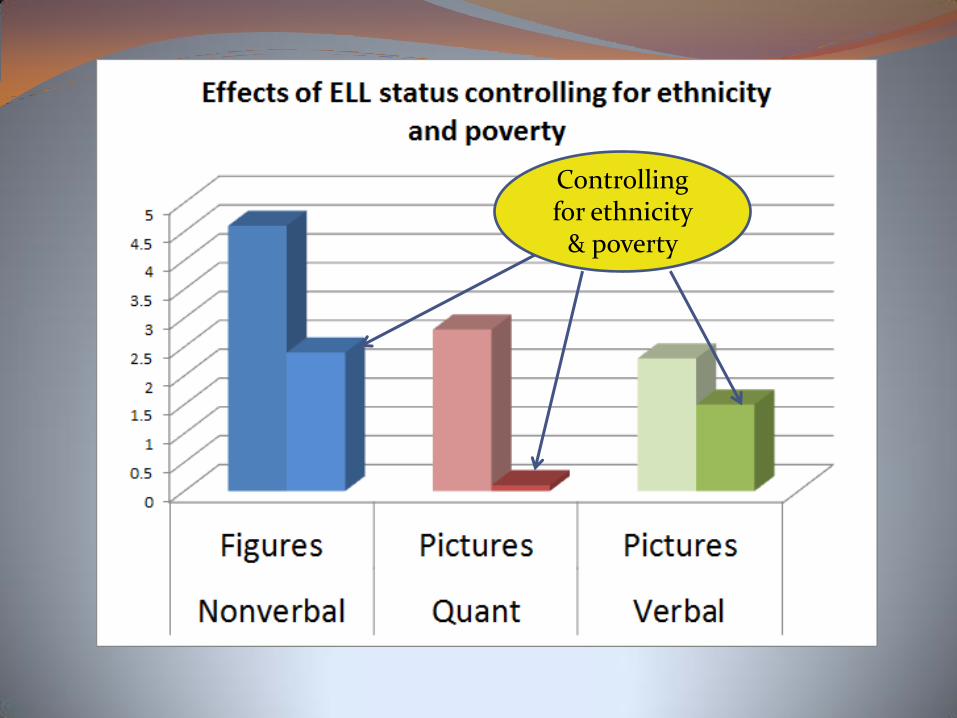
Controlling for ethnicity
& poverty
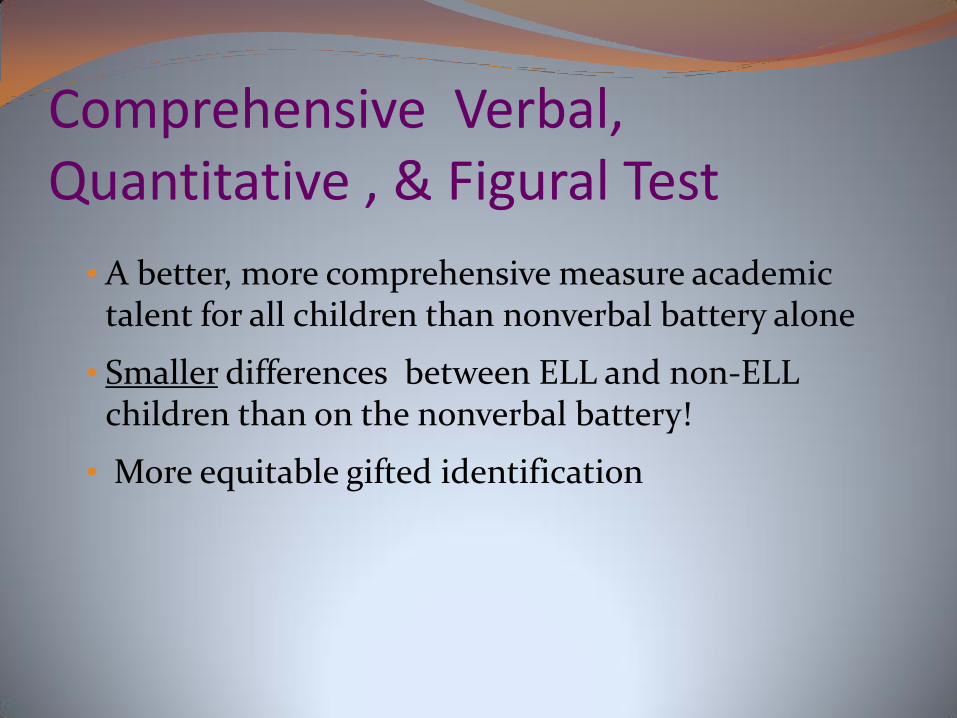
Comprehensive Verbal, Quantitative , & Figural Test
• A better, more comprehensive measure academic talent for all children than nonverbal battery alone
• Smaller differences between ELL and non-ELL children than on the nonverbal battery!
• More equitable gifted identification
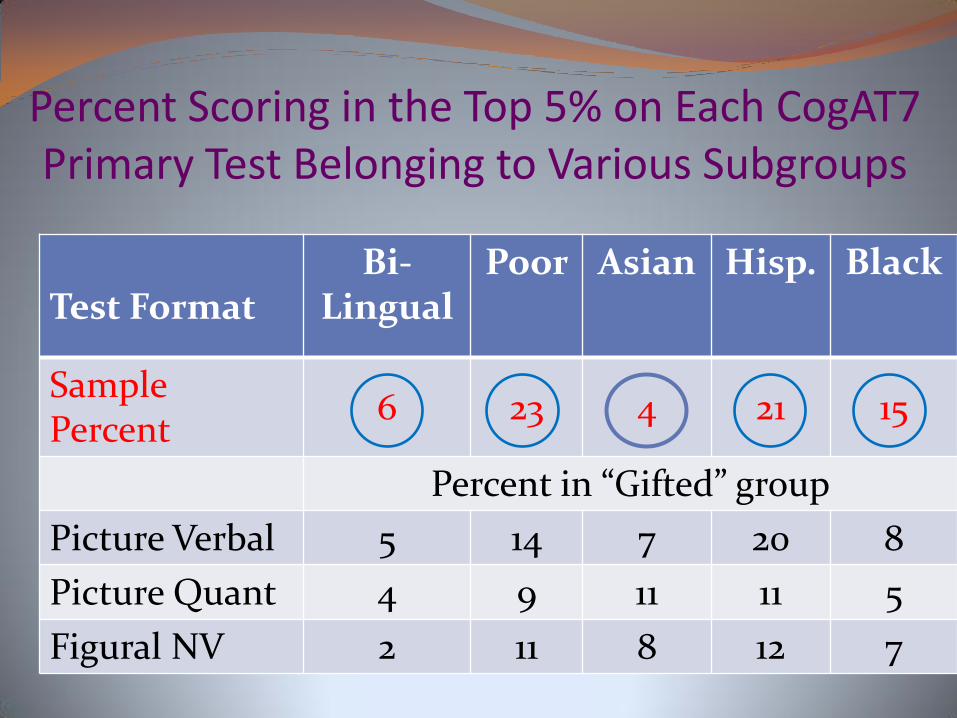
Percent Scoring in the Top 5% on Each CogAT7 Primary Test Belonging to Various Subgroups
Test Format
Bi-Lingual
Poor Asian Hisp. Black
Sample Percent
6 23 4 21 15
Percent in “Gifted” group
Picture Verbal 5 14 7 20 8
Picture Quant 4 9 11 11 5
Figural NV 2 11 8 12 7
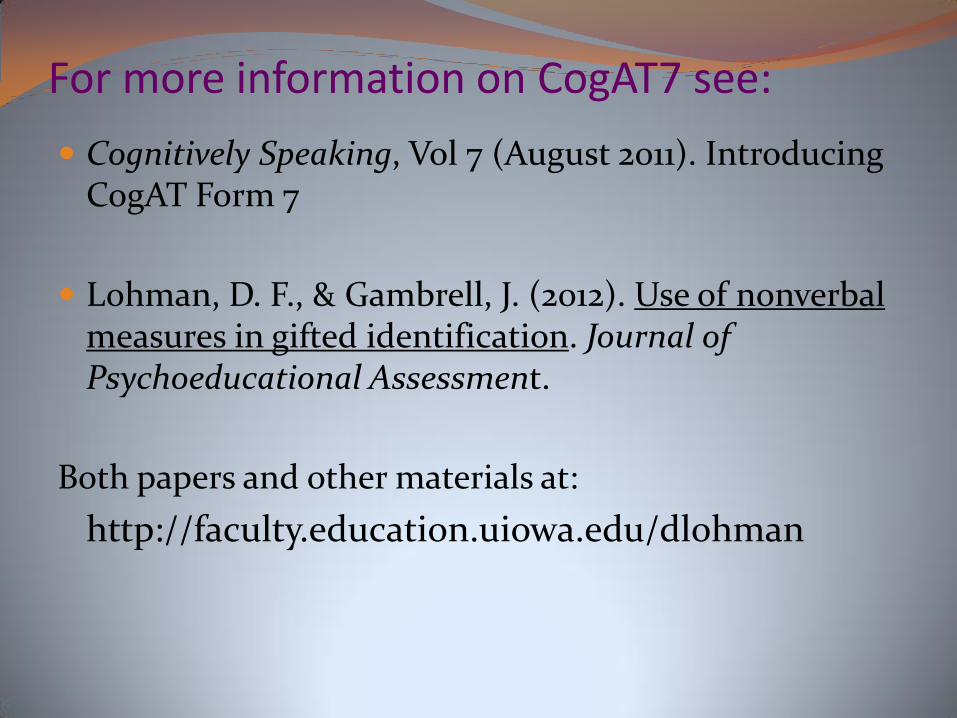
For more information on CogAT7 see:
Cognitively Speaking, Vol 7 (August 2011). Introducing CogAT Form 7
Lohman, D. F., & Gambrell, J. (2012). Use of nonverbal measures in gifted identification. Journal of Psychoeducational Assessment.
Both papers and other materials at:
http://faculty.education.uiowa.edu/dlohman


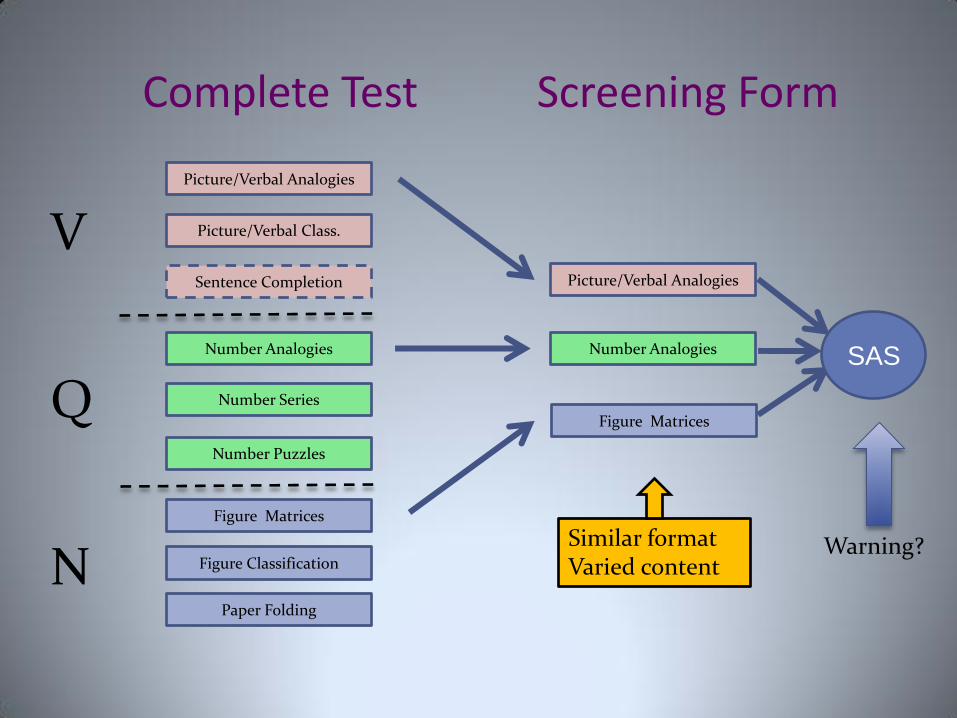
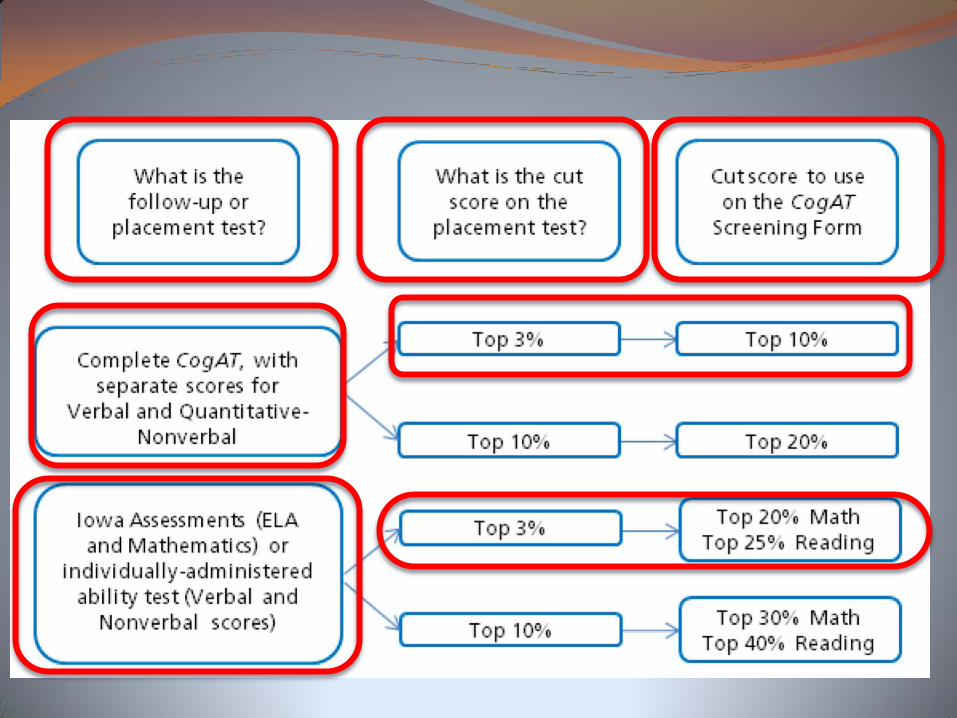
Complete Test Screening Form
Picture/Verbal Analogies
Number Analogies
Picture/Verbal Class.
Figure Matrices
Figure Classification
Number Series
Sentence Completion
Number Puzzles
Paper Folding
V
Q
N
SAS
Picture/Verbal Analogies
Number Analogies
Figure Matrices
Similar format Varied content
Warning?
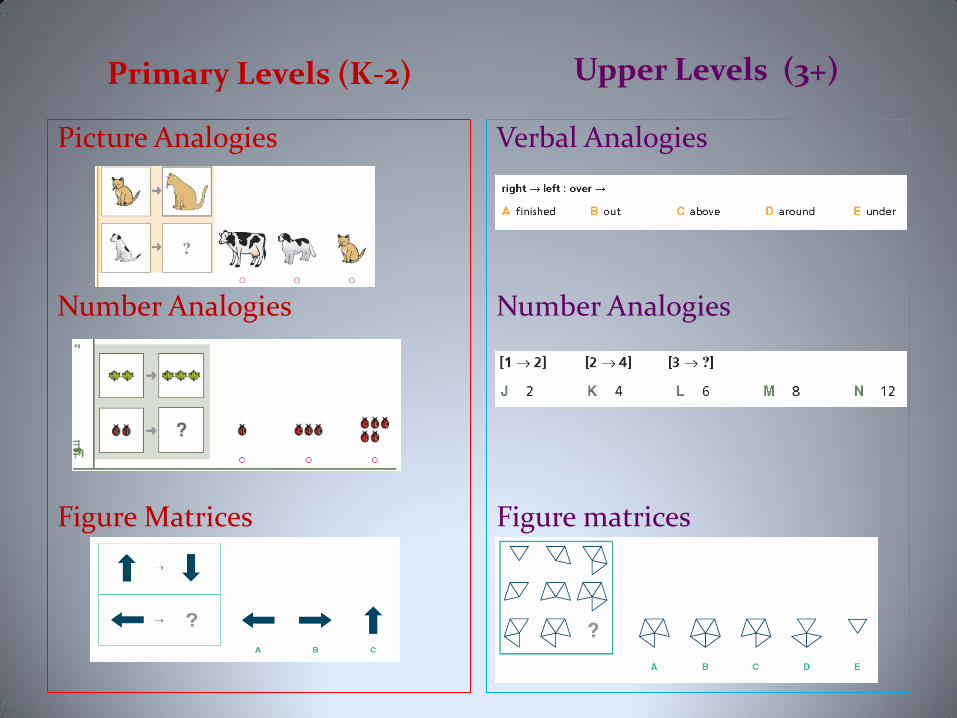
Primary Levels (K-2) Upper Levels (3+)
Picture Analogies
Number Analogies
Figure Matrices
Verbal Analogies
Number Analogies
Figure matrices
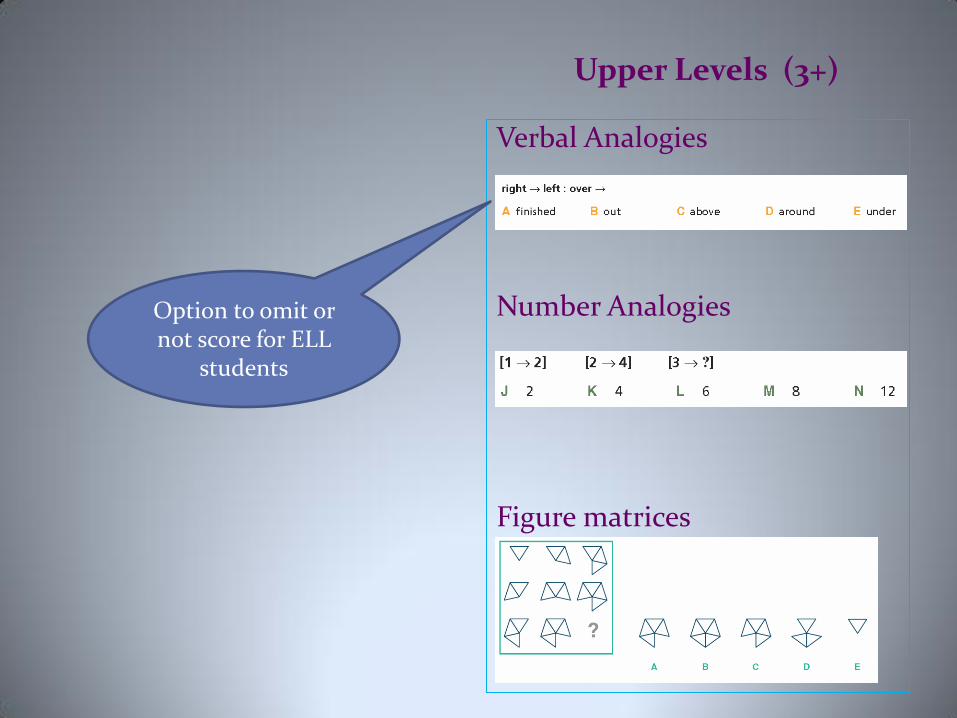
Upper Levels (3+)
Verbal Analogies
Number Analogies
Figure matrices
Option to omit or not score for ELL
students
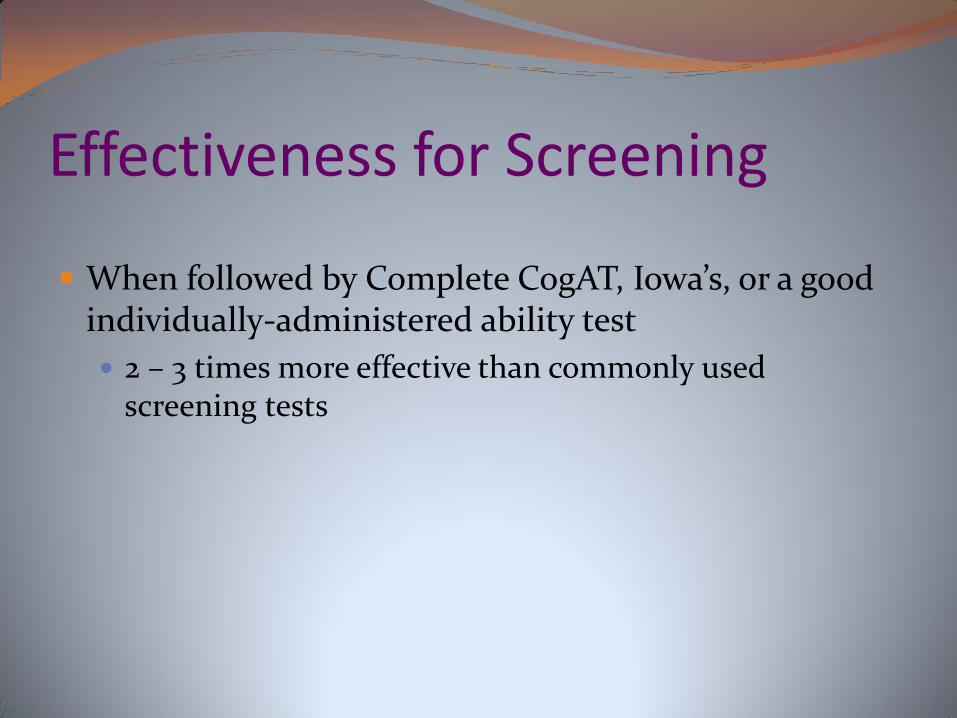
Effectiveness for Screening
When followed by Complete CogAT, Iowa’s, or a good individually-administered ability test
2 – 3 times more effective than commonly used screening tests
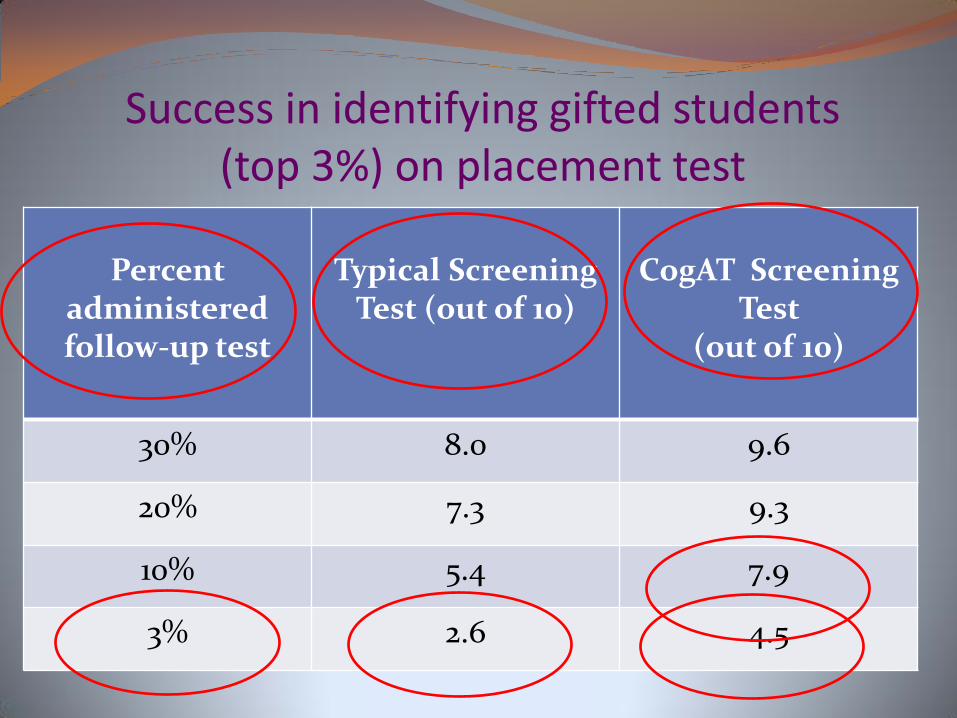
Success in identifying gifted students (top 3%) on placement test
Percent
administered follow-up test
Typical Screening
Test (out of 10)
CogAT Screening
Test (out of 10)
30% 8.0 9.6
20% 7.3 9.3
10% 5.4 7.9
3% 2.6 4.5
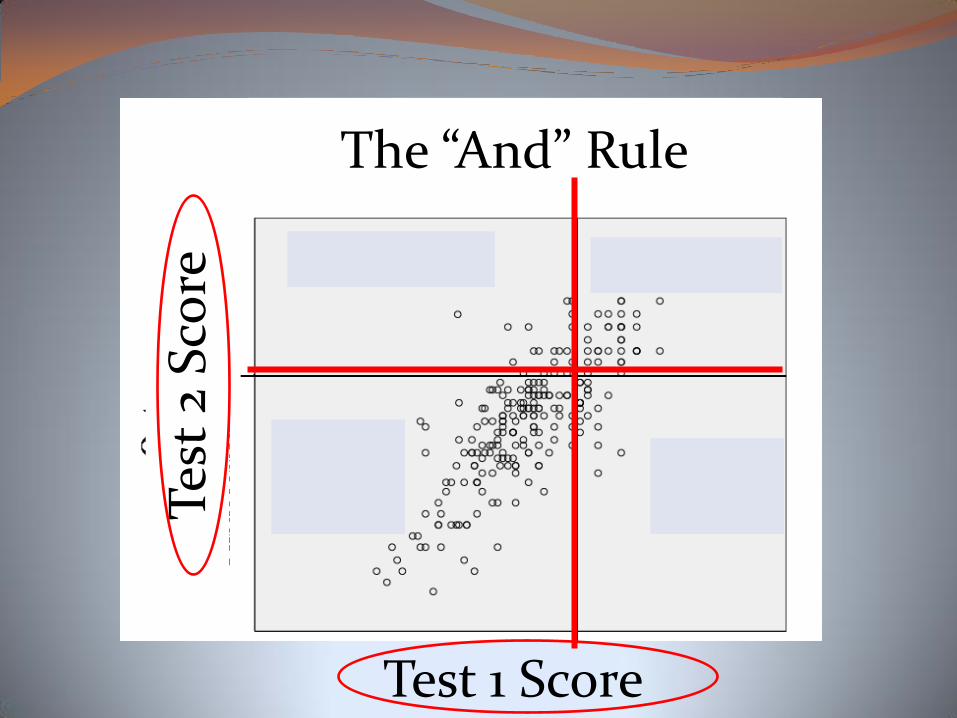
Test 1 Score
Tes
t 2
Sco
re
The “And” Rule

“And” “Or” or “Average”
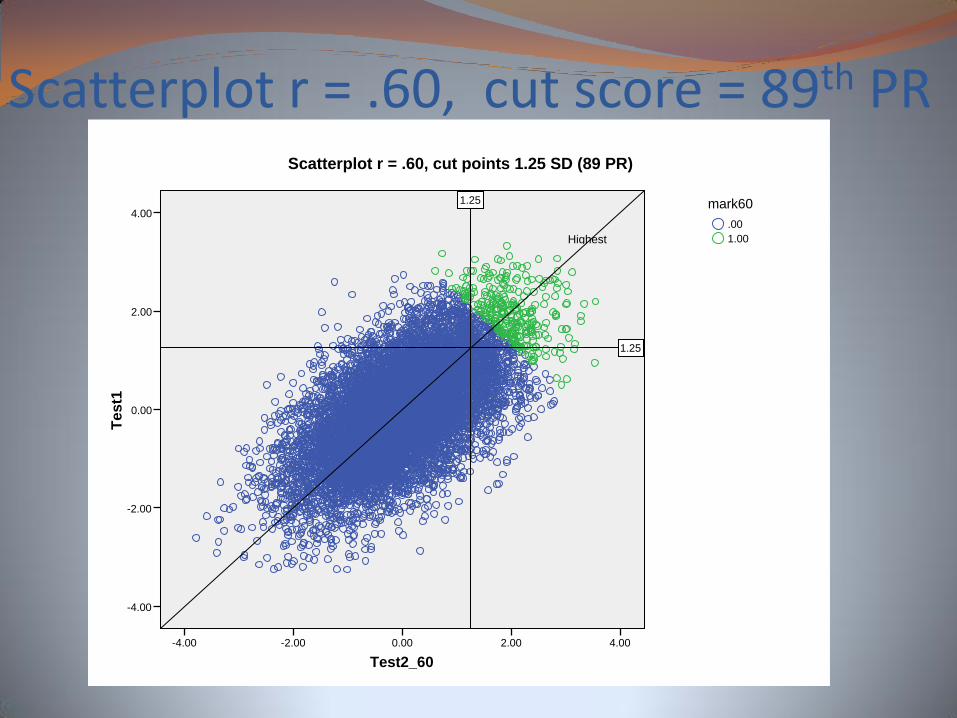
Scatterplot r = .60, cut score = 89th PR
Test2_60
4.002.000.00-2.00-4.00
Test1
4.00
2.00
0.00
-2.00
-4.00
1.25
1.25
1.00
.00
mark60
Scatterplot r = .60, cut points 1.25 SD (89 PR)
Highest
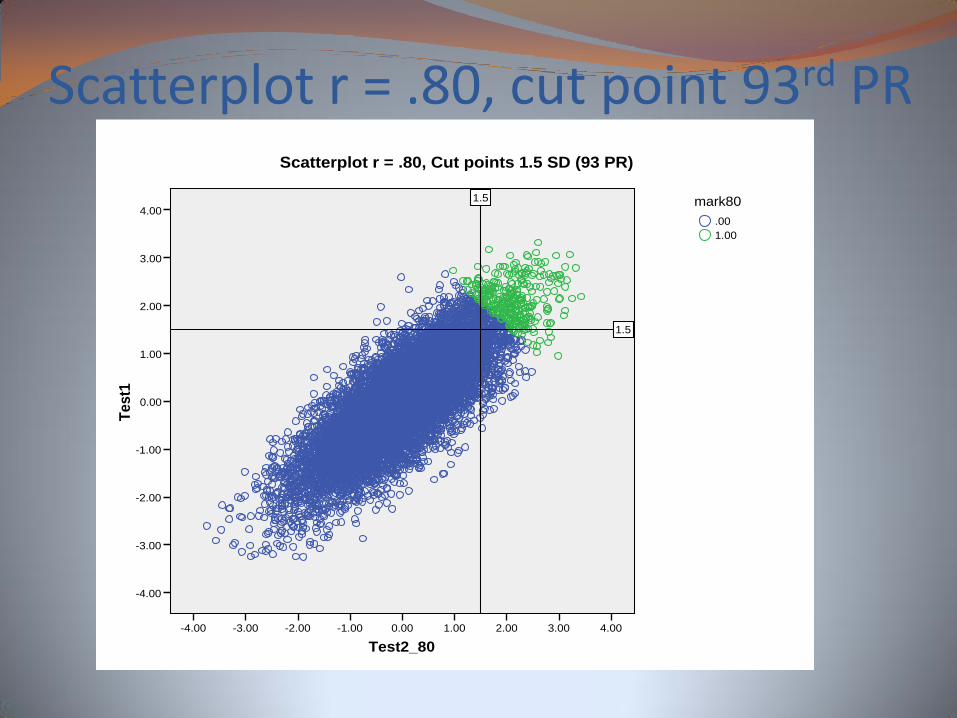
Scatterplot r = .80, cut point 93rd PR
Test2_80
4.003.002.001.000.00-1.00-2.00-3.00-4.00
Test1
4.00
3.00
2.00
1.00
0.00
-1.00
-2.00
-3.00
-4.00
1.5
1.5
1.00
.00
mark80
Scatterplot r = .80, Cut points 1.5 SD (93 PR)

Lohman-Renzulli Matrix
Teacher Rating on Learning Ability,
Motivation, or Creativity
Low teacher ratings
High teacher
ratings
CogAT Verbal
OR Quantitative-Nonverbal
( >95th PR )
II I
( 80th – 95th
PR) IV III

In screening and in placement
Opportunity to learn?
Similar to norm group
Verbal, Quantitative, &
Nonverbal
Academic knowledge &
skills
Unlike norm group
Nonverbal & Quantitative
(standard norms)
+ Verbal & achievement
(special norms)
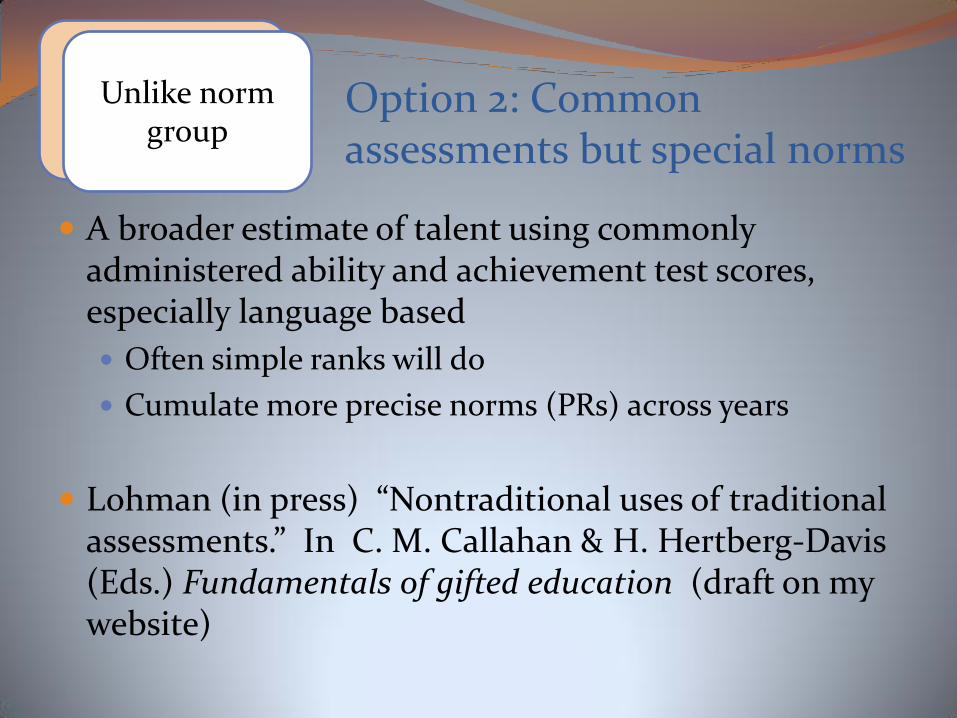
A broader estimate of talent using commonly administered ability and achievement test scores, especially language based
Often simple ranks will do
Cumulate more precise norms (PRs) across years
Lohman (in press) “Nontraditional uses of traditional assessments.” In C. M. Callahan & H. Hertberg-Davis (Eds.) Fundamentals of gifted education (draft on my website)
Unlike norm group
Option 2: Common assessments but special norms
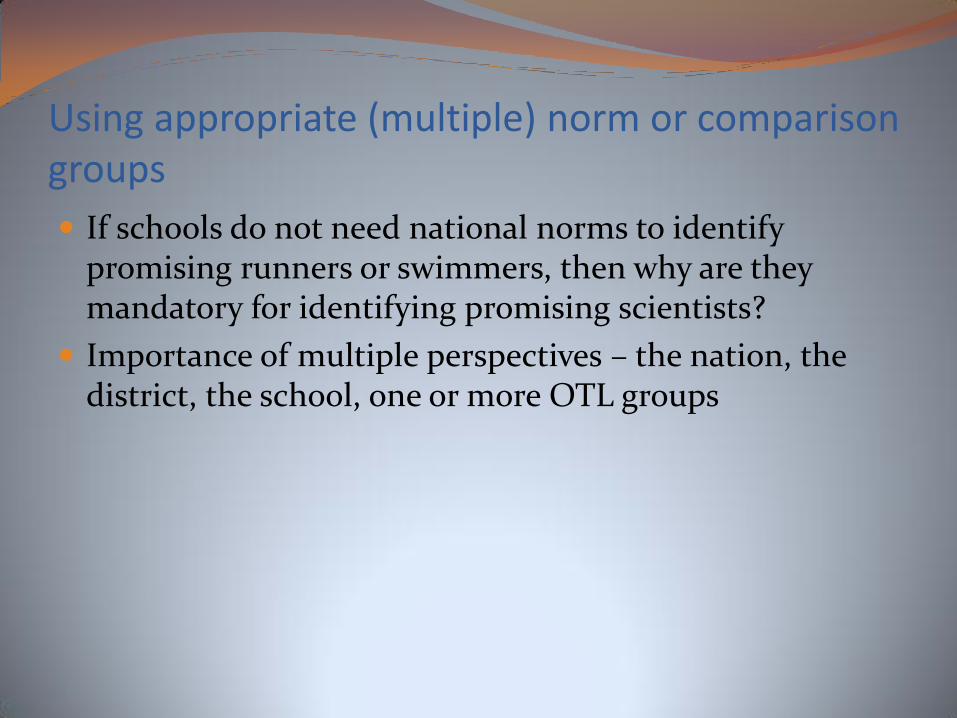
Using appropriate (multiple) norm or comparison groups
If schools do not need national norms to identify promising runners or swimmers, then why are they mandatory for identifying promising scientists?
Importance of multiple perspectives – the nation, the district, the school, one or more OTL groups
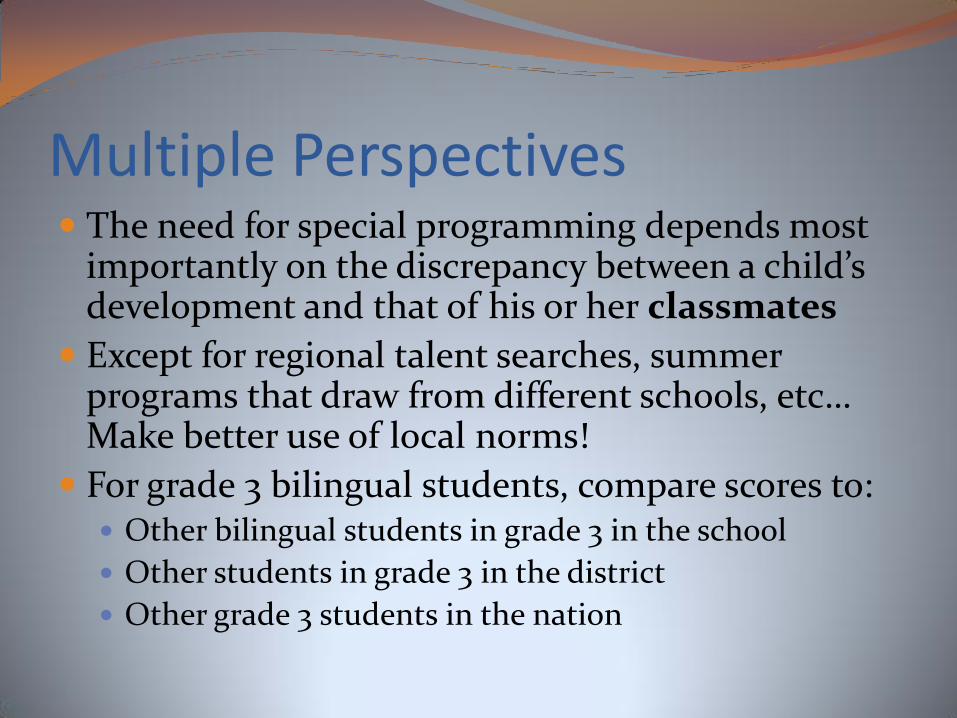
Multiple Perspectives The need for special programming depends most
importantly on the discrepancy between a child’s development and that of his or her classmates
Except for regional talent searches, summer programs that draw from different schools, etc… Make better use of local norms!
For grade 3 bilingual students, compare scores to: Other bilingual students in grade 3 in the school
Other students in grade 3 in the district
Other grade 3 students in the nation
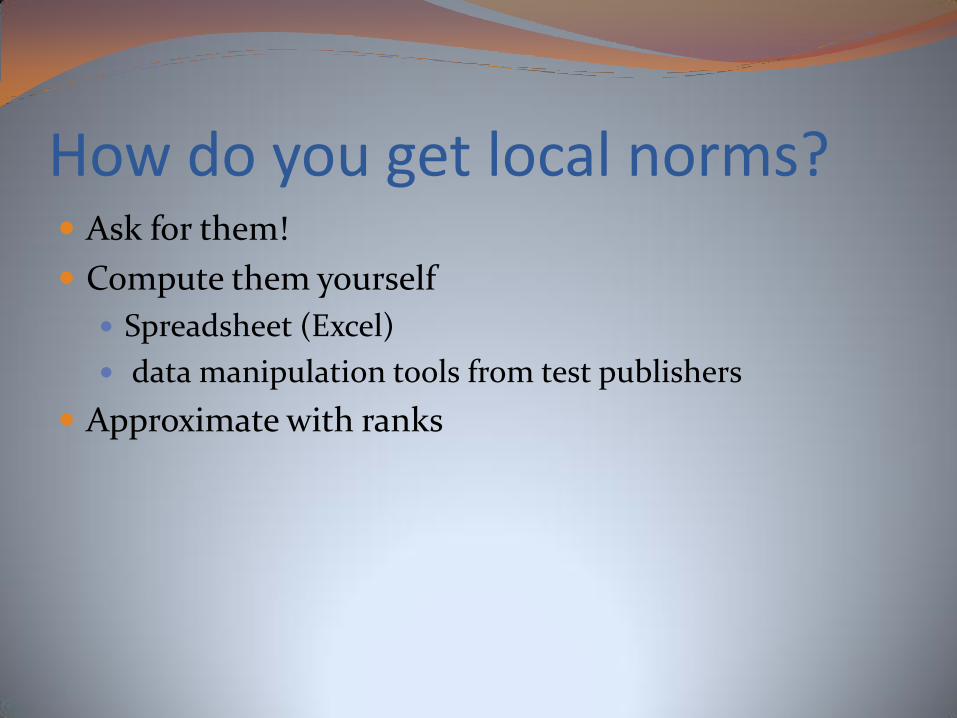
How do you get local norms? Ask for them!
Compute them yourself
Spreadsheet (Excel)
data manipulation tools from test publishers
Approximate with ranks

Getting Local Norms Ask for them!

Beyond local norms Simple rank orders (within domain)
Rank orders within OTL groups
When the goal is talent identification – not identifying the gifted

Opportunity to learn
The senator’s question, revisited
Among the poor children in your school, might there be any who might have talent in writing or mathematics or …? If so, might it be helpful to recognize and encourage that talent?
Index by eligibility for free/reduced-price lunch
Rank order scores within OTL groups

Lohman (in press) “Nontraditional uses of traditional assessments.”
In C. M. Callahan & H. Hertberg-Davis (Eds.) Fundamentals of gifted education
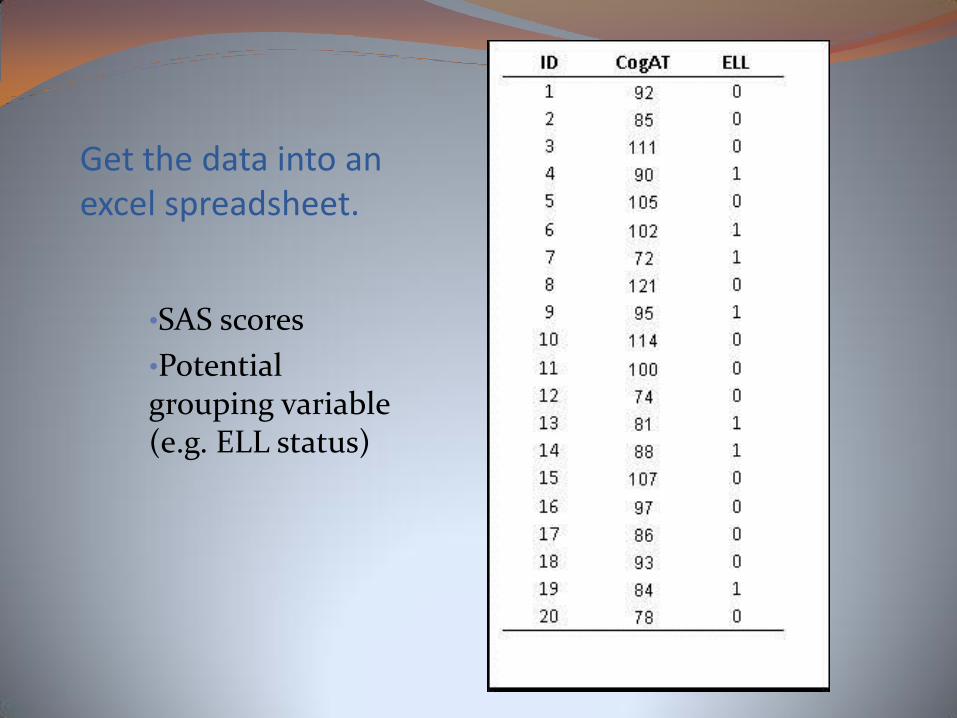
Get the data into an excel spreadsheet.
•SAS scores
•Potential grouping variable (e.g. ELL status)

To get local ranks, sort (rank order) the data by SAS scores.

To get separate ranks for each ELL group
sort by ELL
and then SAS.
Must all talented students receive the same kind of special educational programming?
Multiple Programming Options for ELL Children Current level of achievement is primary guide
Programming goal: to encourage interests and improve achievement at a rate faster than would otherwise occur
For on- and below-grade-level achievement options include: tutors, after-school or weekend classes/clubs, etc. Motivational component critical.
For achievement well in advance of peers, consider single-subject acceleration
Main Points Do not just translate test items (ITC guidelines)
Be aware of common misconceptions
Critical importance of opportunity to learn
When screening, use liberal cut scores
Value of comprehensive “nonverbal” tests
Provide informative practice
Use multiple measures of multiple constructs
Combine measures appropriately
Profiles are more important at the extremes
Value of multiple perspectives
Importance of multiple programming options

Thank you! http://faculty.education.uiowa.edu/dlohman/