Evaluation of Potential Best Management Practices Vehicle Wash ...
In the following report, Hanover Research studies best practices in designing K-12 program evaluations and disseminating evaluation results in a final report. A literature review section outlines strategies for conducting program evaluations and defining a manageable evaluation scope, and identifies essential components for program assessment reports. A second section profiles program evaluation design and reporting practices at five large public school districts and identifies essential design considerations and reporting strategies.
BEST PRACTICES IN PROGRAM EVALUATION REPORT DESIGN
July 2015
www.hanoverresearch.com
Hanover Research | July 2015
© 2015 Hanover Research 2
TABLE OF CONTENTS Executive Summary and Key Findings ............................................................................... 3
INTRODUCTION ........................................................................................................................... 3
KEY FINDINGS ............................................................................................................................. 3
Section I: Best Practices in Conducting Program Evaluations and Reporting Results .......... 5
EVALUATION DESIGN BEST PRACTICES ............................................................................................. 5
EVALUATION REPORTING BEST PRACTICES ........................................................................................ 9
Section II: Program Evaluation Reporting Practices among Peer Districts ........................ 11
OVERVIEW OF REPORTING PRACTICES AMONG PEER DISTRICTS ........................................................... 11
ESSENTIAL DESIGN CONSIDERATIONS ............................................................................................. 12
Rubrics and Research Questions ..................................................................................... 12
Single-Document and Multiple-Document Reports ........................................................ 13
FAIRFAX COUNTY PUBLIC SCHOOLS, FAIRFAX COUNTY, VA ................................................................ 14
Evaluation Process and Criteria ....................................................................................... 14
Evaluation Report Overview ............................................................................................ 16
MONTGOMERY COUNTY PUBLIC SCHOOLS, MONTGOMERY COUNTY, MD ............................................ 22
Evaluation Process and Criteria ....................................................................................... 22
Evaluation Report Overview ............................................................................................ 24
SCHOOL DISTRICT OF PALM BEACH COUNTY, PALM BEACH COUNTY, FL ............................................... 27
Evaluation Process and Criteria ....................................................................................... 27
Evaluation Report Overview ............................................................................................ 28
CHARLOTTE-MECKLENBURG SCHOOLS, CHARLOTTE, NC ................................................................... 30
Evaluation Process and Criteria ....................................................................................... 31
Evaluation Report Overview ............................................................................................ 32
PINELLAS COUNTY SCHOOLS, PINELLAS COUNTY, FL ......................................................................... 34
Evaluation Process and Criteria ....................................................................................... 34
Evaluation Report Overview ............................................................................................ 35
Hanover Research | July 2015
© 2015 Hanover Research 3
EXECUTIVE SUMMARY AND KEY FINDINGS
INTRODUCTION Schools and school districts strive to provide actionable information to constituents and improve transparency and accountability within the district. To support these efforts, Hanover Research has examined best practices in reporting findings from program evaluations. These can be formative evaluations, leading to program improvements and course corrections, or summative assessments that impact funding and resource allocations for the program or initiative in question. In either case, it is essential that the written reports generated by program evaluators offer clear, concise, evidence-based recommendations to program stakeholders. The present report uses two complementary methods to study program evaluation reporting strategies. It presents its findings in two sections. Section I contains a literature review outlining best practices in program assessment design and reporting practices. Section II builds upon this theoretical foundation by examining program evaluation processes and reporting strategies at five large public school districts and providing a detailed overview of their report lengths, contents, structures, and dissemination strategies. Below we present key findings from this research. KEY FINDINGS
An analysis of recent program evaluation reports among selected districts indicates that these documents can range from an average length of only 10.6 pages at one district to approximately 68 pages, including appendices. None of the peer reports studied in this report exceeded 100 pages in length, and districts seem to emphasize brevity as a means of ensuring their reports are easily digestible and useful to constituents. One large Florida district formats its program evaluation reports as 1-3 page policy memos supported by additional 5-15 pages of figures and methodological footnotes.
Best practices literature and examples from other districts identifies several key components that are common to all reports. While their position, importance, and format may change depending upon how the report is organized, each report contains some version of the following: o Executive summary o Introduction/program history o Statement of the evaluation’s goals, purpose, and essential research
questions o Methodology overview o Results analysis o Findings and recommendations
Hanover Research | July 2015
© 2015 Hanover Research 4
Concise, effective program evaluation reports are predicated by evaluation design practices that limit the scope of the study. Evaluation experts recommend identifying a short list of “essential research questions” that program stakeholders must answer in order to make decisions. Questions should be tailored to the report’s intended audience. For example, a formative evaluation report would likely offer program staff technical recommendations on how to improve their program, while a summative cost-benefit analysis would provide a high-level analysis that policymakers could use in budgetary decisions.
This research identified two major strategies for designing focused program evaluations and structuring their resulting reports. Each has its own advantages and drawbacks and tends to produce a certain type of report that is either shorter and summative in nature or longer, less uniformly structured, and more formative: o Evaluation Rubrics offer districts a standardized set of questions or metrics that
can be used to assess every program in a consistent way. Districts that use rubrics typically limit their program evaluation research to a few summative concerns such as program design and implementation, program efficacy, and program costs and benefits. Rubric-based reports tend to be short and policy-focused.
o Evaluation Questions are not typically as uniform as evaluation rubrics and can be customized to answer a wider variety of formative and summative questions about a program. They may also require evaluators to employ a wider variety of research methods in order to answer every question posed. As might be expected, reports based upon evaluation questions unique to each program assessment and its objectives vary more widely in terms of their form and structure. Experts recommend a maximum of 5-6 evaluation questions per report.
Some districts release multiple types of program evaluation reports or break their reports into a series of smaller, freestanding components in order to make them more accessible. For example, one district publishes a short Executive Report and a more detailed full report. Another uses a report format for larger, more comprehensive studies and issues shorter Research Briefs to highlight findings from longer reports or publicize preliminary results from an ongoing project. Some districts provide online links to specific report components such as the executive summary or appendices.
Practices for storing and cataloging reports vary widely from district to district, and a streamlined search interface is essential for organizing these documents and facilitating access. In some cases, districts do not organize their research and evaluation reports by date, type, or subject, which makes information hard to locate. The most effective means of organizing and presenting evaluation reports are making the document repository searchable by year, keyword, report type, and subject, and providing a short abstract detailing the contents of each report.
Hanover Research | July 2015
© 2015 Hanover Research 5
SECTION I: BEST PRACTICES IN CONDUCTING PROGRAM EVALUATIONS AND REPORTING RESULTS This section examines best practices in program evaluation design and reporting. It is important to note that while the two are treated separately, the design and objectives of a program evaluation will likely impact the form of the final report. As described in Section II (see Figure 2.1 for a summary), large districts with sophisticated evaluation and accountability units can differ substantially on their evaluation designs and the final reports they produce. This variation is likely compounded by the fact that there are relatively few national or state standards for program evaluation design. For example, the Institute of Education Sciences’ What Works Clearinghouse yields only two results for the search term “program evaluation.” Both of these documents are actual evaluation studies, and do not provide explicit commentary on how to construct effective program evaluations and report their findings to district stakeholders. 1 Similarly, the Florida Department of Education’s Accountability, Research, and Measurement unit focuses overwhelmingly on student performance.2 Neither its Publications and Guides resources nor its Accountability and Reporting office provide information about evaluating individual district programs.3 EVALUATION DESIGN BEST PRACTICES The evaluation unit of the Institute of Education Sciences’ National Center for Education Evaluation and Regional Assistance (NCEE) “designs evaluation studies to produce rigorous scientific evidence on the effectiveness of education programs and practices.” Its main task is to study programs that are supported through federal funding.4 The NCEE has thus far undertaken over 30 program evaluation studies, each of which is intended to answer one or more of the following questions:5
1 See: “Search the What Works Clearinghouse: ‘Program Evaluation’.” Institute of Education Sciences What Works
Clearinghouse. Search conducted July 15, 2015. http://ies.ed.gov/ncee/wwc/sitesearch.aspx?Search=%22program+evaluation%22&website=NCEE%2fWWC&x=0&y=0
2 See: “Accountability.” Florida Department of Education. http://www.fldoe.org/accountability/ 3 See: [1] “Publications & Guides.” Florida Department of Education.
http://www.fldoe.org/ACCOUNTABILITY/ACCOUNTABILITY-REPORTING/PUBLICATIONS-GUIDES [2] “Accountability & Reporting.” Florida Department of Education.
http://www.fldoe.org/accountability/accountability-reporting/ 4 “Evaluation Studies of the National Center for Education Evaluation and Regional Assistance.” Institute of Education
Sciences. http://ies.ed.gov/ncee/projects/evaluation/index.asp 5 List summarizes content from: Ibid.
Hanover Research | July 2015
© 2015 Hanover Research 6
What is the impact of the federal program on the intended outcomes? Researchers working on this question seek to determine whether federally funded programs have had a significant impact on key outcomes relating to student achievement. Typically, these studies compare student outcomes at schools receiving federal program funds with outcomes from an unfunded control group.
Is the program model effective? This question focuses on the impact of the program in question, as well as its underlying design, by observing its efficacy in a variety of settings.
Is a specific intervention (or class of interventions) effective? NCEE researchers seek to determine whether widely adopted programs or interventions are effective at improving student results.
Evaluation reports published by the NCEE may involve teams of experts from major universities and consulting firms and include several years’ worth of data collection.6 Nevertheless, the research questions that anchor these reports are also key questions in other models inform evaluations conducted by individual school districts. A 2002 report published by the U.S. Office of Special Education Programs and Elementary and Middle Schools Technical Assistance Center (EMSTAC) lists questions for measuring a program’s implementation, but additional questions focus on the program’s cost-effectiveness and reception among stakeholders and try to ascertain its impacts and unintended consequences.7 Determining an evaluation’s research focus is an important first step that can conserve resources and evaluators’ time by identifying essential questions about a program. A general-purpose guide to program and practice evaluation published in Educational Leadership warns readers to avoid becoming “data rich, but information poor.”8 The authors advocate an “essential question approach” to data collection and evaluation and focus especially on student performance. They urge readers to avoid getting bogged down in long lists of questions and instead ask no more than five or six crucial questions in each evaluation. In order to take this pared-down approach, evaluators, policymakers, and program representatives must consider what they want to know before designing their evaluation.9 Program evaluators must also decide whether their evaluation is intended to improve programs and inform program staff or assess the program’s value. With this in mind, one
6 For example, see: Wolf, Patrick, et. al. “Evaluation of the DC Opportunity Scholarship Program.” National Center for
Education Evaluation and Regional Assistance. June 2010. pp. i, xv. http://ies.ed.gov/ncee/pubs/20104018/pdf/20104018.pdf
7 See: Paulsen, Christine Andrews, and Don Dailey. “A Guide for Educational Personnel: Evaluating a Program or Intervention.” Elementary and Middles Schools Technical Assistance Center. September 27, 2002. pp. 2-3. http://www.emstac.org/resources/eval.pdf
8 Ronka, David, et. al. “Answering the Questions that Count.” Educational Leadership. December 2008-January 2009. p. 18. http://www.dodk12grants.org/docs/AnsweringTheQuestions.pdf
9 Ibid. pp. 18-19.
Hanover Research | July 2015
© 2015 Hanover Research 7
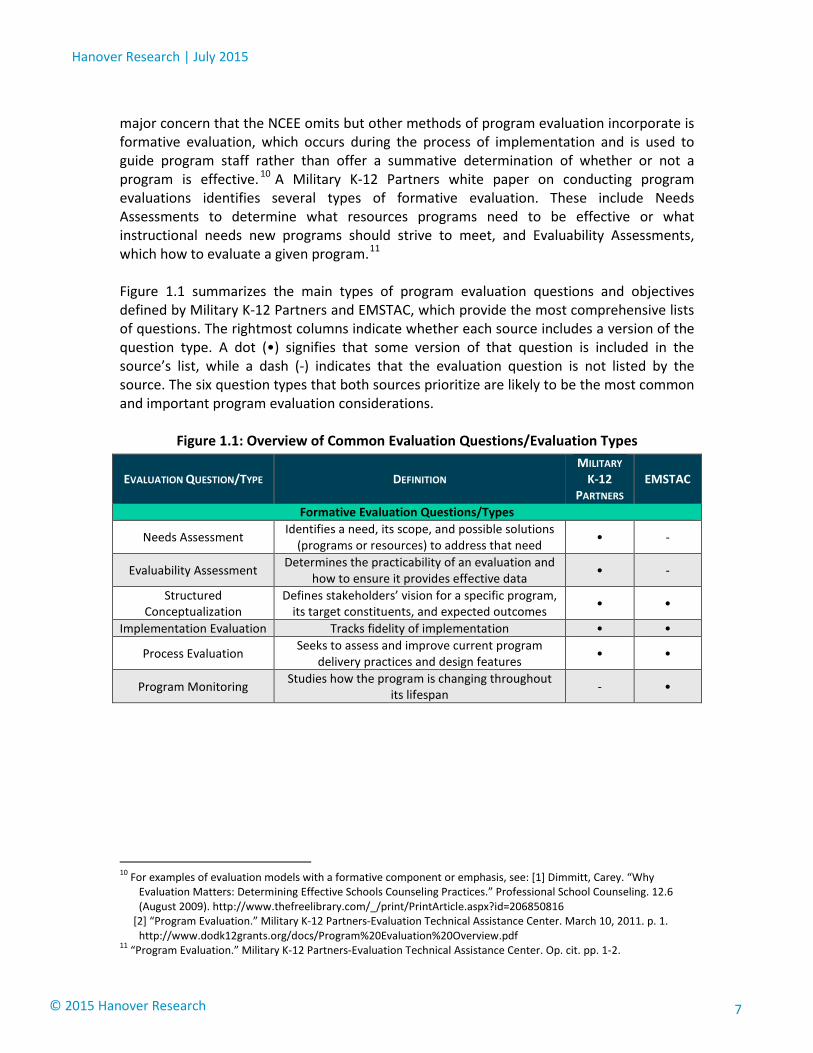
major concern that the NCEE omits but other methods of program evaluation incorporate is formative evaluation, which occurs during the process of implementation and is used to guide program staff rather than offer a summative determination of whether or not a program is effective. 10 A Military K-12 Partners white paper on conducting program evaluations identifies several types of formative evaluation. These include Needs Assessments to determine what resources programs need to be effective or what instructional needs new programs should strive to meet, and Evaluability Assessments, which how to evaluate a given program.11 Figure 1.1 summarizes the main types of program evaluation questions and objectives defined by Military K-12 Partners and EMSTAC, which provide the most comprehensive lists of questions. The rightmost columns indicate whether each source includes a version of the question type. A dot (•) signifies that some version of that question is included in the source’s list, while a dash (-) indicates that the evaluation question is not listed by the source. The six question types that both sources prioritize are likely to be the most common and important program evaluation considerations.
Figure 1.1: Overview of Common Evaluation Questions/Evaluation Types
EVALUATION QUESTION/TYPE DEFINITION MILITARY
K-12 PARTNERS
EMSTAC
Formative Evaluation Questions/Types
Needs Assessment Identifies a need, its scope, and possible solutions (programs or resources) to address that need • -
Evaluability Assessment Determines the practicability of an evaluation and how to ensure it provides effective data • -
Structured Conceptualization
Defines stakeholders’ vision for a specific program, its target constituents, and expected outcomes • •
Implementation Evaluation Tracks fidelity of implementation • •
Process Evaluation Seeks to assess and improve current program delivery practices and design features • •
Program Monitoring Studies how the program is changing throughout its lifespan - •
10 For examples of evaluation models with a formative component or emphasis, see: [1] Dimmitt, Carey. “Why
Evaluation Matters: Determining Effective Schools Counseling Practices.” Professional School Counseling. 12.6 (August 2009). http://www.thefreelibrary.com/_/print/PrintArticle.aspx?id=206850816
[2] “Program Evaluation.” Military K-12 Partners-Evaluation Technical Assistance Center. March 10, 2011. p. 1. http://www.dodk12grants.org/docs/Program%20Evaluation%20Overview.pdf
11 “Program Evaluation.” Military K-12 Partners-Evaluation Technical Assistance Center. Op. cit. pp. 1-2.
Hanover Research | July 2015
© 2015 Hanover Research 8
EVALUATION QUESTION/TYPE DEFINITION MILITARY
K-12 PARTNERS
EMSTAC
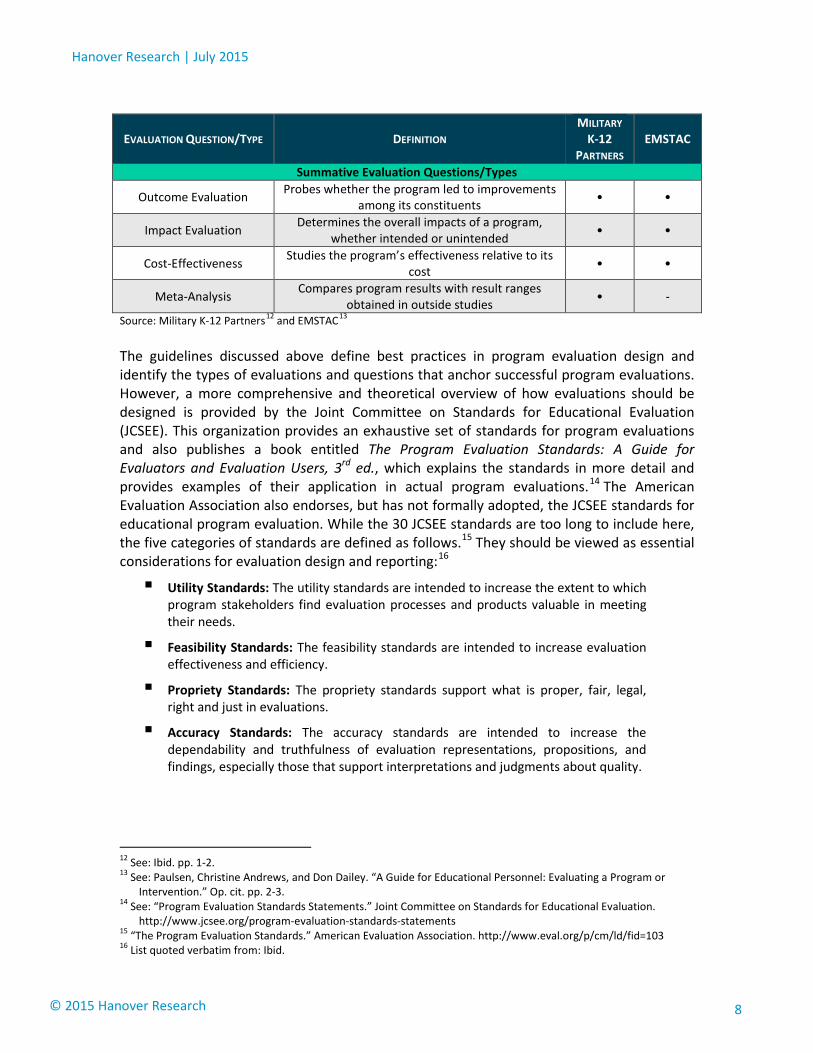
Summative Evaluation Questions/Types
Outcome Evaluation Probes whether the program led to improvements among its constituents • •
Impact Evaluation Determines the overall impacts of a program, whether intended or unintended • •
Cost-Effectiveness Studies the program’s effectiveness relative to its cost • •
Meta-Analysis Compares program results with result ranges obtained in outside studies • -
Source: Military K-12 Partners12 and EMSTAC13 The guidelines discussed above define best practices in program evaluation design and identify the types of evaluations and questions that anchor successful program evaluations. However, a more comprehensive and theoretical overview of how evaluations should be designed is provided by the Joint Committee on Standards for Educational Evaluation (JCSEE). This organization provides an exhaustive set of standards for program evaluations and also publishes a book entitled The Program Evaluation Standards: A Guide for Evaluators and Evaluation Users, 3rd ed., which explains the standards in more detail and provides examples of their application in actual program evaluations.14 The American Evaluation Association also endorses, but has not formally adopted, the JCSEE standards for educational program evaluation. While the 30 JCSEE standards are too long to include here, the five categories of standards are defined as follows.15 They should be viewed as essential considerations for evaluation design and reporting:16
Utility Standards: The utility standards are intended to increase the extent to which program stakeholders find evaluation processes and products valuable in meeting their needs.
Feasibility Standards: The feasibility standards are intended to increase evaluation effectiveness and efficiency.
Propriety Standards: The propriety standards support what is proper, fair, legal, right and just in evaluations.
Accuracy Standards: The accuracy standards are intended to increase the dependability and truthfulness of evaluation representations, propositions, and findings, especially those that support interpretations and judgments about quality.
12 See: Ibid. pp. 1-2. 13 See: Paulsen, Christine Andrews, and Don Dailey. “A Guide for Educational Personnel: Evaluating a Program or
Intervention.” Op. cit. pp. 2-3. 14 See: “Program Evaluation Standards Statements.” Joint Committee on Standards for Educational Evaluation.
http://www.jcsee.org/program-evaluation-standards-statements 15 “The Program Evaluation Standards.” American Evaluation Association. http://www.eval.org/p/cm/ld/fid=103 16 List quoted verbatim from: Ibid.
Hanover Research | July 2015
© 2015 Hanover Research 9
Evaluation Accountability Standards: The evaluation accountability standards encourage adequate documentation of evaluations and a meta-evaluative perspective focused on improvement and accountability for evaluation processes and products.
As noted below, two of the five districts profiled in Section II use the JCSEE standards as the basis for their evaluation procedures. EVALUATION REPORTING BEST PRACTICES There appears to be very little extant information outlining what program evaluation reports should look like, what sections they should contain, and how long they should be. That said, existing examples and sources generally agree about report length ranges and contents. All of the reports examined in Section II were under 100 pages in length, including appendices. A literature review conducted by Military K-12 Partners lays out a basic, widely-used report template, though it should be noted that this white paper excludes the opening Executive Summary, which appears in the vast majority of program evaluation reports studied in this report. Essential report components include the following:17
Background: Defines the problem or needs the program is designed to address, contains a literature review and list of stakeholders, states the evaluation’s goals, and expected outcomes, and provides a timeline of research activities and a list of past, present, or future documents relating to the report in question
Evaluation and Study Questions: Lists all formative and summative evaluation questions
Evaluation Methodology: Describes the evaluation plan and methodology, identifies the groups participating in the study, and lists the types of data collected and explains the instruments or methods used to obtain that data
Data Analysis: Explains how data are analyzed to produce conclusions and mentions any potential weaknesses in the data collection or analysis process that may impact those conclusions; the format of this section is likely to vary based upon the type of study being conducted.
Findings: Presents the results of the analysis, often organized by evaluation question and supplemented with charts and tables for quantitative data and summaries of qualitative findings
Conclusions: Summarizes and synthesizes the major findings and relates the results of the research questions to the goals of the program under evaluation
Recommendations: Provides specific suggestions for program changes stemming from the evaluation (and any prior evaluations) and offers general proposals about the utility, scope, or purpose of the program which are tailored to stakeholders such as program staff or policymakers
17 List summarizes content from: “Evaluation Reporting.” Military K-12 Partners. March 10, 2011. pp. 1-2.
http://www.dodk12grants.org/docs/Evaluation%20Reporting.pdf
Hanover Research | July 2015
© 2015 Hanover Research 10
As shown in Section II, most, if not all, effective program evaluation reports contain these components in some form. However, they may not all exist as independent sections, and the order in which each component is presented may vary. For example, a 2014 program evaluation completed by the NCEE contains an Introduction that summarizes the program under review, discusses the schools and student populations involved, and explains the data collection methods.18 It then offers three sections on the outcomes achieved by the program and explains the data analysis methodologies used to answer each research question as it discusses the results.19 A series of appendices elaborates on the research and data analysis methodologies used in the report, and provides a closer examination of selected findings.20
18 See: Wolf, Patrick, et. al. “Evaluation of the DC Opportunity Scholarship Program.” Op. cit. pp. 1-13. 19 See: Ibid. Chapters 2-5. 20 See: Ibid. Appendices A-H.

Hanover Research | July 2015
© 2015 Hanover Research 11
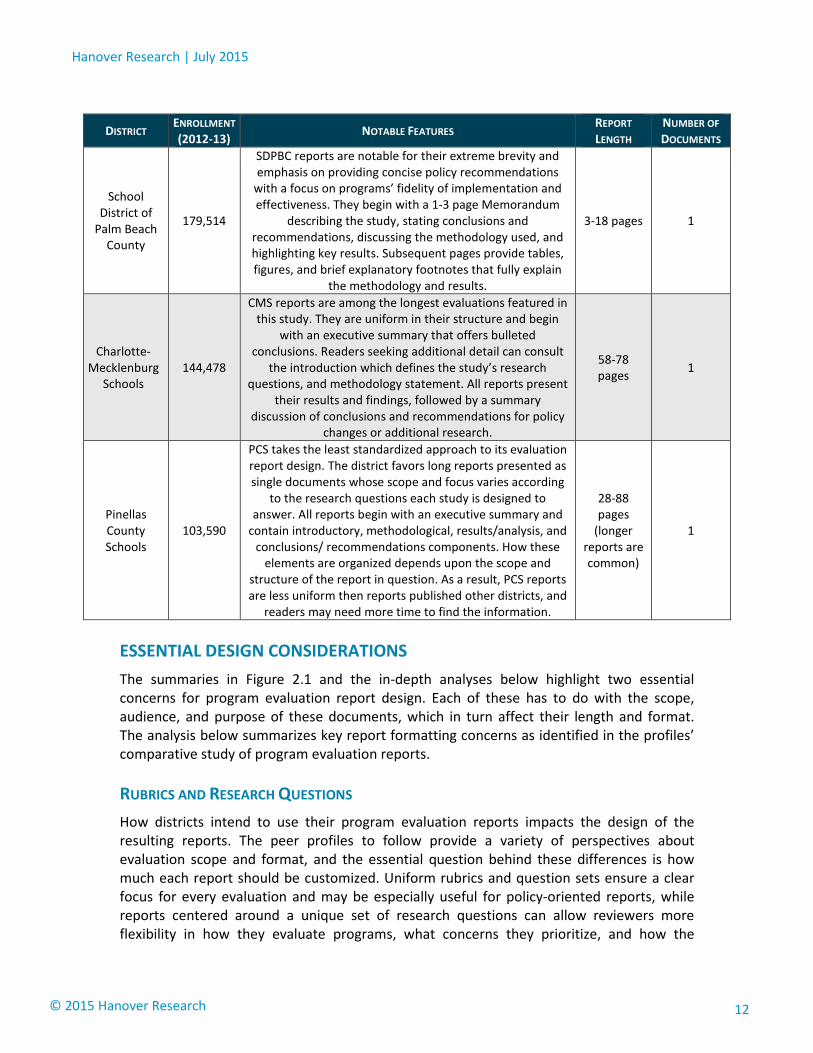
SECTION II: PROGRAM EVALUATION REPORTING PRACTICES AMONG PEER DISTRICTS This section provides detailed examples of how five large school districts conduct program evaluations and structure the resulting reports. These districts were selected because they represent a wide variety of practices when it comes to conducting program evaluations and disseminating the results. Because many of these districts have published dozens of program evaluation reports and their practices appear to evolve from year to year, the data presented below generally stems from an analysis of the five most recent program evaluation reports that each district has published. OVERVIEW OF REPORTING PRACTICES AMONG PEER DISTRICTS Figure 2.1 summarizes each district’s reporting practices, as well as its 2012-13 enrollment as reported by the National Center for Education Statistics. The “Notable Features” column discusses the most important and distinctive elements of each district’s reporting practices, while the “Report Length” and “Number of Documents” columns list the length range of the reports studied as well as the number of documents published as part of each district’s program evaluation efforts. In cases where a district publishes multiple documents as part of the same report, the page ranges refer only to the length of the main report and do not represent the combined length of all of the accompanying documents. In general, program evaluation reports by peer districts are consistently under 100 pages, and some districts regularly produce reports of less than 30 pages.
Figure 2.1: Overview of Peer Report Strategies
DISTRICT ENROLLMENT (2012-13) NOTABLE FEATURES REPORT
LENGTH NUMBER OF DOCUMENTS
Fairfax County Public
Schools
180,616
FCPS publishes its reports and supplemental documents (including an executive summary, appendices, and
department responses to the review) on its website as independent components. Each document is calibrated to
meet the needs of different stakeholders including administrators, program staff, and the public. FCPS reports
use a standard rubric to measure program design, implementation, results, and cost-effectiveness.
8-26 pages, plus additional
documents
5
Montgomery County Public
Schools 148,780
MCPS reports describe program evaluation studies and their results, while shorter research briefs focus on aspects of larger studies or present preliminary findings. An online
abstract helps readers orient themselves and identify relevant documents. Reports contain an executive
summary, a program description, a short literature review, a methodology statement, findings, recommendations,
and appendices. Unlike FCPS, MCPS reports are structured around a series of Evaluation Questions unique to each
report.
34-79 pages 3
Hanover Research | July 2015
© 2015 Hanover Research 12
DISTRICT ENROLLMENT (2012-13) NOTABLE FEATURES REPORT
LENGTH NUMBER OF DOCUMENTS
School District of
Palm Beach County
179,514
SDPBC reports are notable for their extreme brevity and emphasis on providing concise policy recommendations
with a focus on programs’ fidelity of implementation and effectiveness. They begin with a 1-3 page Memorandum
describing the study, stating conclusions and recommendations, discussing the methodology used, and highlighting key results. Subsequent pages provide tables, figures, and brief explanatory footnotes that fully explain
the methodology and results.
3-18 pages 1
Charlotte-Mecklenburg
Schools 144,478
CMS reports are among the longest evaluations featured in this study. They are uniform in their structure and begin
with an executive summary that offers bulleted conclusions. Readers seeking additional detail can consult
the introduction which defines the study’s research questions, and methodology statement. All reports present
their results and findings, followed by a summary discussion of conclusions and recommendations for policy
changes or additional research.
58-78 pages 1
Pinellas County Schools
103,590
PCS takes the least standardized approach to its evaluation report design. The district favors long reports presented as single documents whose scope and focus varies according
to the research questions each study is designed to answer. All reports begin with an executive summary and
contain introductory, methodological, results/analysis, and conclusions/ recommendations components. How these
elements are organized depends upon the scope and structure of the report in question. As a result, PCS reports are less uniform then reports published other districts, and
readers may need more time to find the information.
28-88 pages
(longer reports are common)
1
ESSENTIAL DESIGN CONSIDERATIONS The summaries in Figure 2.1 and the in-depth analyses below highlight two essential concerns for program evaluation report design. Each of these has to do with the scope, audience, and purpose of these documents, which in turn affect their length and format. The analysis below summarizes key report formatting concerns as identified in the profiles’ comparative study of program evaluation reports. RUBRICS AND RESEARCH QUESTIONS How districts intend to use their program evaluation reports impacts the design of the resulting reports. The peer profiles to follow provide a variety of perspectives about evaluation scope and format, and the essential question behind these differences is how much each report should be customized. Uniform rubrics and question sets ensure a clear focus for every evaluation and may be especially useful for policy-oriented reports, while reports centered around a unique set of research questions can allow reviewers more flexibility in how they evaluate programs, what concerns they prioritize, and how the

Hanover Research | July 2015
© 2015 Hanover Research 13
findings will be used. A related question is who the report’s intended audience is. At a minimum, this includes policymakers tasked with budgetary decisions, but it may also include the leaders of the program being evaluated, the general public, and even academic readers of scholarly journals. Districts that use formal program evaluation rubrics or the same uniform set of questions for every evaluation tend to produce more consistent evaluation reports in terms of form and content. For example, one of the profiled districts (Fairfax County Public Schools) uses an actual scoring rubric to evaluate all of its programs according to the same set of standards. As shown in Figure 2.5, the district focuses on the strength of each program’s design and the quality of its underlying evidence, fidelity of implementation, program efficacy, and cost-effectiveness. Similarly, while the School District of Palm Beach County does not have a formal rubric, it focuses its evaluations exclusively on fidelity of implementation and whether or not the program delivers its intended results. Because they seek to answer the same set of questions each time, the reports produced by these districts are very similar despite the fact that they assess a wide range of programs. Not all of the districts studied use predefined rubrics or question lists. For example, Montgomery County Schools develops a unique set of research questions that then define the scope of the evaluation report and determine its organization (see Figure 2.6 for examples). Charlotte-Mecklenburg Schools also develop a unique set of questions for each evaluation. These can have a budgetary, planning, or policy focus, or they can be intended to answer broader research questions of interest to education scholars beyond the district. For example, one of the Charlotte-Mecklenburg Schools reports discussed in this report was published in a peer-reviewed journal. A final concern for evaluation designers is what research methods the district is capable of employing. For example, evaluations focused on implementation fidelity and program efficacy may not rely as heavily on information obtained from stakeholder surveys. Thus, narrower, carefully defined research questions may reduce the range of expertise a district’s program evaluation staff needs to exhibit, though circumscribing the scope of available research questions may also limit the flexibility of the evaluation process. SINGLE-DOCUMENT AND MULTIPLE-DOCUMENT REPORTS All five of the profiled districts have at least some degree of consistency in how they format their reports, though these reports vary widely from district to district (and occasionally within districts) in terms of their overall length. Two districts—Fairfax County Public Schools and Montgomery County Public Schools—have chosen to publish their program evaluations in multiple documents or formats. At Fairfax County, all reports have five components including an executive summary, scored rubric, and a written response to the evaluation from the director of the program under review. The fact that these components are accessible as independent documents allows stakeholders to access the different parts of the report with ease. Montgomery County Public Schools uses two report formats—the longer report and the shorter research brief—to report on its program evaluations. Other
Hanover Research | July 2015
© 2015 Hanover Research 14
districts publish all of their reports as a single, comprehensive document with an initial executive summary and table of contents. FAIRFAX COUNTY PUBLIC SCHOOLS, FAIRFAX COUNTY, VA Fairfax County Public Schools (FCPS) is a large, suburban district located in Northern Virginia. It ranks as the eleventh-largest school district in the United States. 21 A 2010 report by the Eli and Edythe Broad Foundation identifies FCPS as a district in which low-income and African-American students outperformed their respective state averages on reading and math achievement tests.22 As shown below, the district is notable for producing short, highly standardized program evaluations that include five user-friendly documents. The district’s use of a one page summary rubric and infographic called a Box Score is also notable. EVALUATION PROCESS AND CRITERIA The district’s Office of Program Evaluation (OPE) serves the district staff, the School Board, and the community by producing a variety of internal and external publications.23 It conducts program evaluations for all of the district’s instructional programs and services on a biennial basis. 24 FCPS employs a staff of five program evaluation specialists, two administrative assistants, a manager, and a director.25 OPE aligns its research and services meet the JCSEE standards of utility, feasibility, propriety, accuracy, and evaluation accountability, as discussed in Section I.26 Program evaluation findings are intended for “a variety of stakeholders” including the public, the School Board, district leaders, program staff, and other school or district staff members. Regardless of the program being evaluated, OPE’s goal is to provide information that can be used to improve promising and high performing programs or recommend that the district discontinue programs or services that do not appear to be effective.27 While the review processes at some of the other districts profiled in this report vary substantially
21 Ibid. 22 “The 2010 Broad Prize.” The Broad Prize. December 2010. p. 2. http://www.broadprize.org/asset/0-
30largedistsbetterperform2010.pdf 23 “Office of Program Evaluation.” Fairfax County Public Schools. http://www.fcps.edu/pla/ope/index.shtml 24 “Processes for Biennial Review, Identification, Selection, and Assignment of Instructional Programs and Services for
Evaluation.” Fairfax County Public Schools. April 2014. pp. 1. http://www.fcps.edu/pla/ope/docs/selec_and_assign_%20nartive_and_grap_isd.pdf
25 “Staff Information-Office of Program Evaluation.” Fairfax County Public Schools. 2015. http://www.fcps.edu/pla/ope/ope_contact/ope_contact.shtml
26 “Office of Program Evaluation.” Fairfax County Public Schools. Op. cit. 27 “Program Effectiveness.” Fairfax County Public Schools.
http://www.fcps.edu/pla/ope/prog_e/program_effectiveness.shtml
Enrollment: 180,616 Total Schools: 219 National Size Ranking: 11 Program Evaluation Staff: 9 Full-time Total Expenditures per Student: $14,162
Hanover Research | July 2015
© 2015 Hanover Research 15
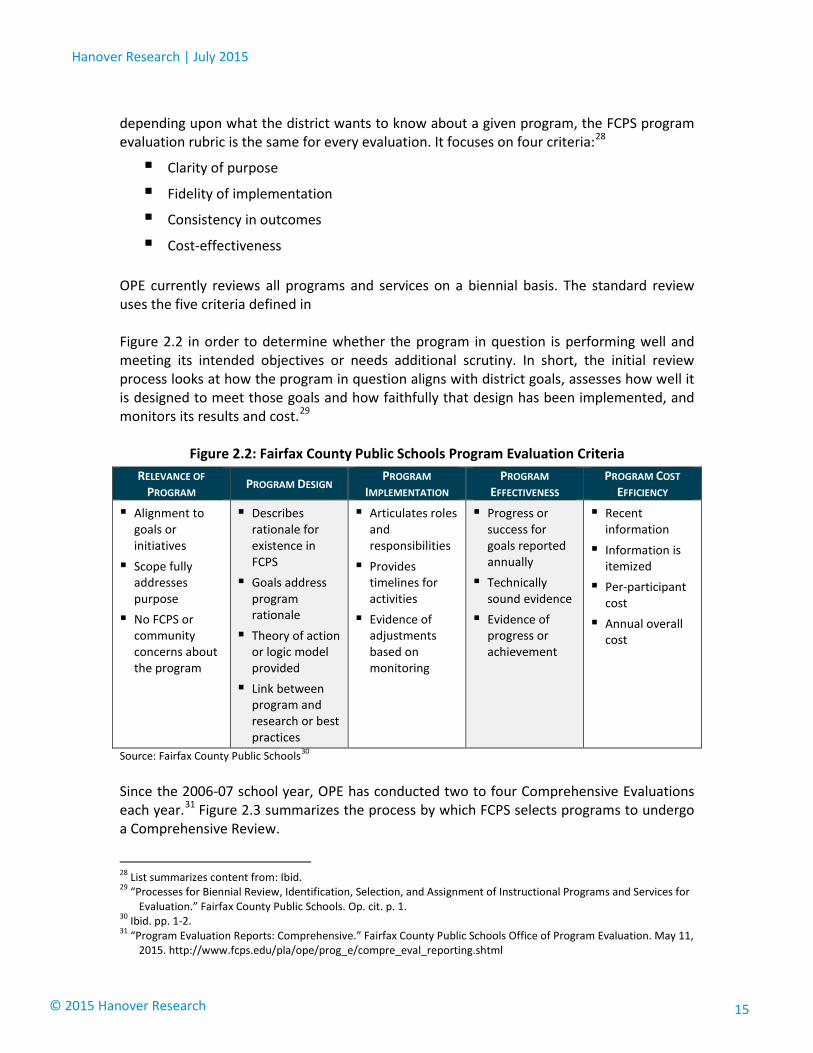
depending upon what the district wants to know about a given program, the FCPS program evaluation rubric is the same for every evaluation. It focuses on four criteria:28
Clarity of purpose Fidelity of implementation Consistency in outcomes Cost-effectiveness
OPE currently reviews all programs and services on a biennial basis. The standard review uses the five criteria defined in Figure 2.2 in order to determine whether the program in question is performing well and meeting its intended objectives or needs additional scrutiny. In short, the initial review process looks at how the program in question aligns with district goals, assesses how well it is designed to meet those goals and how faithfully that design has been implemented, and monitors its results and cost.29
Figure 2.2: Fairfax County Public Schools Program Evaluation Criteria RELEVANCE OF
PROGRAM PROGRAM DESIGN PROGRAM IMPLEMENTATION
PROGRAM EFFECTIVENESS
PROGRAM COST EFFICIENCY
Alignment to goals or initiatives
Scope fully addresses purpose
No FCPS or community concerns about the program
Describes rationale for existence in FCPS
Goals address program rationale
Theory of action or logic model provided
Link between program and research or best practices
Articulates roles and responsibilities
Provides timelines for activities
Evidence of adjustments based on monitoring
Progress or success for goals reported annually
Technically sound evidence
Evidence of progress or achievement
Recent information
Information is itemized
Per-participant cost
Annual overall cost
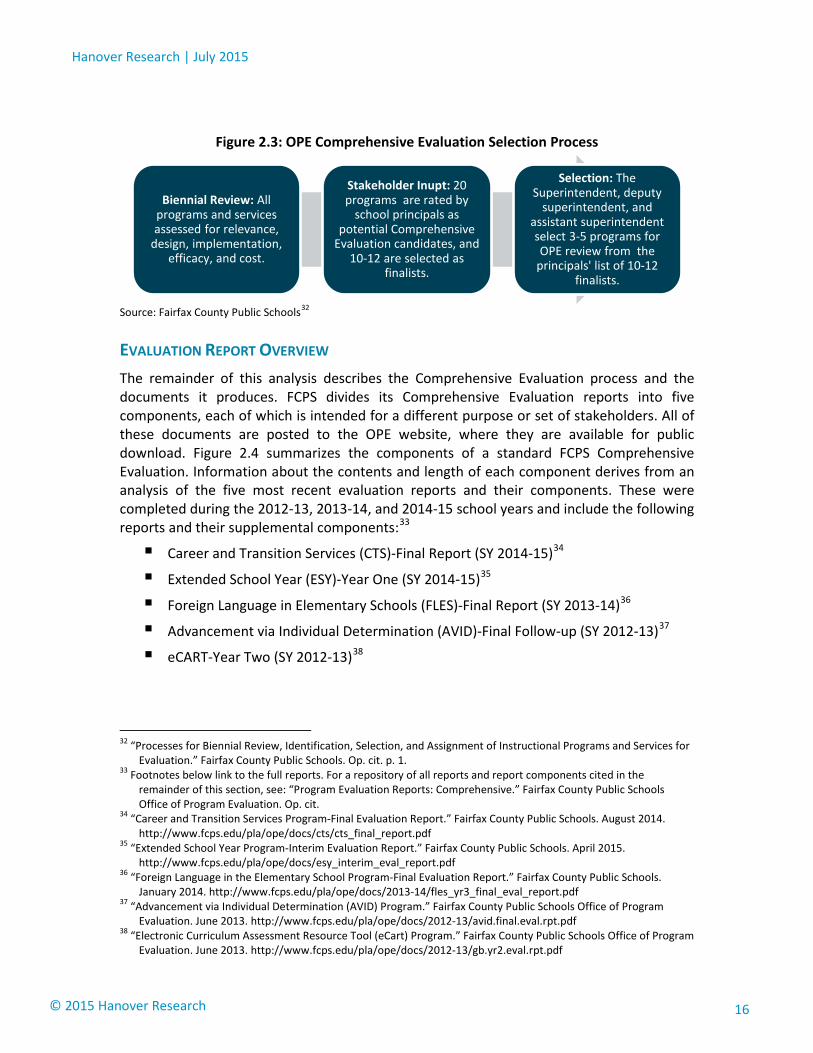
Source: Fairfax County Public Schools30 Since the 2006-07 school year, OPE has conducted two to four Comprehensive Evaluations each year.31 Figure 2.3 summarizes the process by which FCPS selects programs to undergo a Comprehensive Review.
28 List summarizes content from: Ibid. 29 “Processes for Biennial Review, Identification, Selection, and Assignment of Instructional Programs and Services for
Evaluation.” Fairfax County Public Schools. Op. cit. p. 1. 30 Ibid. pp. 1-2. 31 “Program Evaluation Reports: Comprehensive.” Fairfax County Public Schools Office of Program Evaluation. May 11,
2015. http://www.fcps.edu/pla/ope/prog_e/compre_eval_reporting.shtml
Hanover Research | July 2015
© 2015 Hanover Research 16
Figure 2.3: OPE Comprehensive Evaluation Selection Process
Source: Fairfax County Public Schools32 EVALUATION REPORT OVERVIEW The remainder of this analysis describes the Comprehensive Evaluation process and the documents it produces. FCPS divides its Comprehensive Evaluation reports into five components, each of which is intended for a different purpose or set of stakeholders. All of these documents are posted to the OPE website, where they are available for public download. Figure 2.4 summarizes the components of a standard FCPS Comprehensive Evaluation. Information about the contents and length of each component derives from an analysis of the five most recent evaluation reports and their components. These were completed during the 2012-13, 2013-14, and 2014-15 school years and include the following reports and their supplemental components:33
Career and Transition Services (CTS)-Final Report (SY 2014-15)34 Extended School Year (ESY)-Year One (SY 2014-15)35 Foreign Language in Elementary Schools (FLES)-Final Report (SY 2013-14)36 Advancement via Individual Determination (AVID)-Final Follow-up (SY 2012-13)37 eCART-Year Two (SY 2012-13)38
32 “Processes for Biennial Review, Identification, Selection, and Assignment of Instructional Programs and Services for
Evaluation.” Fairfax County Public Schools. Op. cit. p. 1. 33 Footnotes below link to the full reports. For a repository of all reports and report components cited in the
remainder of this section, see: “Program Evaluation Reports: Comprehensive.” Fairfax County Public Schools Office of Program Evaluation. Op. cit.
34 “Career and Transition Services Program-Final Evaluation Report.” Fairfax County Public Schools. August 2014. http://www.fcps.edu/pla/ope/docs/cts/cts_final_report.pdf
35 “Extended School Year Program-Interim Evaluation Report.” Fairfax County Public Schools. April 2015. http://www.fcps.edu/pla/ope/docs/esy_interim_eval_report.pdf
36 “Foreign Language in the Elementary School Program-Final Evaluation Report.” Fairfax County Public Schools. January 2014. http://www.fcps.edu/pla/ope/docs/2013-14/fles_yr3_final_eval_report.pdf
37 “Advancement via Individual Determination (AVID) Program.” Fairfax County Public Schools Office of Program Evaluation. June 2013. http://www.fcps.edu/pla/ope/docs/2012-13/avid.final.eval.rpt.pdf
38 “Electronic Curriculum Assessment Resource Tool (eCart) Program.” Fairfax County Public Schools Office of Program Evaluation. June 2013. http://www.fcps.edu/pla/ope/docs/2012-13/gb.yr2.eval.rpt.pdf
Biennial Review: All programs and services assessed for relevance,
design, implementation, efficacy, and cost.
Stakeholder Inupt: 20 programs are rated by
school principals as potential Comprehensive
Evaluation candidates, and 10-12 are selected as
finalists.
Selection: The Superintendent, deputy
superintendent, and assistant superintendent select 3-5 programs for OPE review from the
principals' list of 10-12 finalists.
Hanover Research | July 2015
© 2015 Hanover Research 17
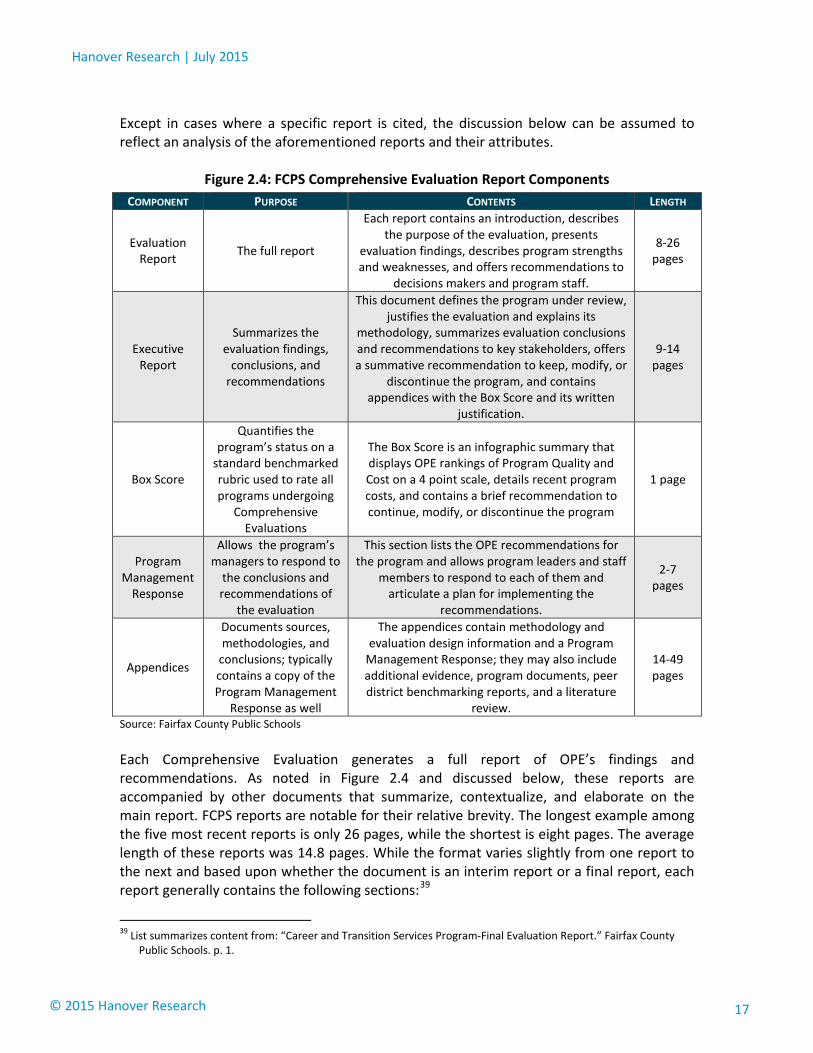
Except in cases where a specific report is cited, the discussion below can be assumed to reflect an analysis of the aforementioned reports and their attributes.
Figure 2.4: FCPS Comprehensive Evaluation Report Components COMPONENT PURPOSE CONTENTS LENGTH
Evaluation Report The full report
Each report contains an introduction, describes the purpose of the evaluation, presents
evaluation findings, describes program strengths and weaknesses, and offers recommendations to
decisions makers and program staff.
8-26 pages
Executive Report
Summarizes the evaluation findings,
conclusions, and recommendations
This document defines the program under review, justifies the evaluation and explains its
methodology, summarizes evaluation conclusions and recommendations to key stakeholders, offers a summative recommendation to keep, modify, or
discontinue the program, and contains appendices with the Box Score and its written
justification.
9-14 pages
Box Score
Quantifies the program’s status on a
standard benchmarked rubric used to rate all programs undergoing
Comprehensive Evaluations
The Box Score is an infographic summary that displays OPE rankings of Program Quality and Cost on a 4 point scale, details recent program costs, and contains a brief recommendation to continue, modify, or discontinue the program
1 page
Program Management
Response
Allows the program’s managers to respond to
the conclusions and recommendations of
the evaluation
This section lists the OPE recommendations for the program and allows program leaders and staff
members to respond to each of them and articulate a plan for implementing the
recommendations.
2-7 pages
Appendices
Documents sources, methodologies, and
conclusions; typically contains a copy of the Program Management
Response as well
The appendices contain methodology and evaluation design information and a Program
Management Response; they may also include additional evidence, program documents, peer district benchmarking reports, and a literature
review.
14-49 pages
Source: Fairfax County Public Schools Each Comprehensive Evaluation generates a full report of OPE’s findings and recommendations. As noted in Figure 2.4 and discussed below, these reports are accompanied by other documents that summarize, contextualize, and elaborate on the main report. FCPS reports are notable for their relative brevity. The longest example among the five most recent reports is only 26 pages, while the shortest is eight pages. The average length of these reports was 14.8 pages. While the format varies slightly from one report to the next and based upon whether the document is an interim report or a final report, each report generally contains the following sections:39
39 List summarizes content from: “Career and Transition Services Program-Final Evaluation Report.” Fairfax County
Public Schools. p. 1.

Hanover Research | July 2015
© 2015 Hanover Research 18
Report Overview: Describes the report’s major sections Introduction: Provides background information about the program within FCPS and
describes the program’s purpose and design
Purpose of the Evaluation: Details the context of the program evaluation request and the focus of the evaluation design
Evaluation Findings: Presents the evaluation evidence gathered during the evaluation to rate the program’s performance on the four Core Components of program functionality (Program Definition, Fidelity of Implementation, Outcomes, and Costs)
Conclusions: Synthesizes evaluation findings into a discussion of major strengths and areas of challenge for the program
Recommendations to Decision Makers: Details the OPE’s recommendations to the FCPS Leadership Team, schools, and program staff for expanding, improving, or discontinuing the program
Every Comprehensive Evaluation report is also accompanied by the documents described below. While each of these components can be accessed independently via links on the FCPS website, it should be noted that some of them may exist as a single document. For example, Executive Reports always contain a copy of the Box Score. Readers who click the link for the Box Score may be directed to the corresponding page in the Executive Report, rather than to a freestanding document that only contains the box score. EXECUTIVE REPORT This document is a general purpose summary of the evaluation report that is designed to be accessible to all stakeholders including decision makers, program leaders, the public, and program staff. Among the five most recent reports, the Executive Report has an average length of 11.2 pages. Examples range from a low of nine pages to a maximum of 14 pages. These documents typically contain an introduction defining the program or service in question, a summary of the program’s purpose and design, an overview of the evaluation’s purpose and design, a statement of conclusions, a summative recommendation to either continue the program as is, continue the program with modifications, or discontinue the program, and recommendations to program staff. Every Executive Report also contains at least two short appendices with the complete Box Score Report and a written justification of the score that OPE assigned the program. BOX SCORE Each Box Score report offers a one-page infographic that summarizes the program’s performance on a four-point scale. In the two most recent reports, the Box Score link directs readers to the Box Score component of the Executive Report, which is followed by at least one additional Appendix containing written justifications for each of the scores assigned in
Hanover Research | July 2015
© 2015 Hanover Research 19
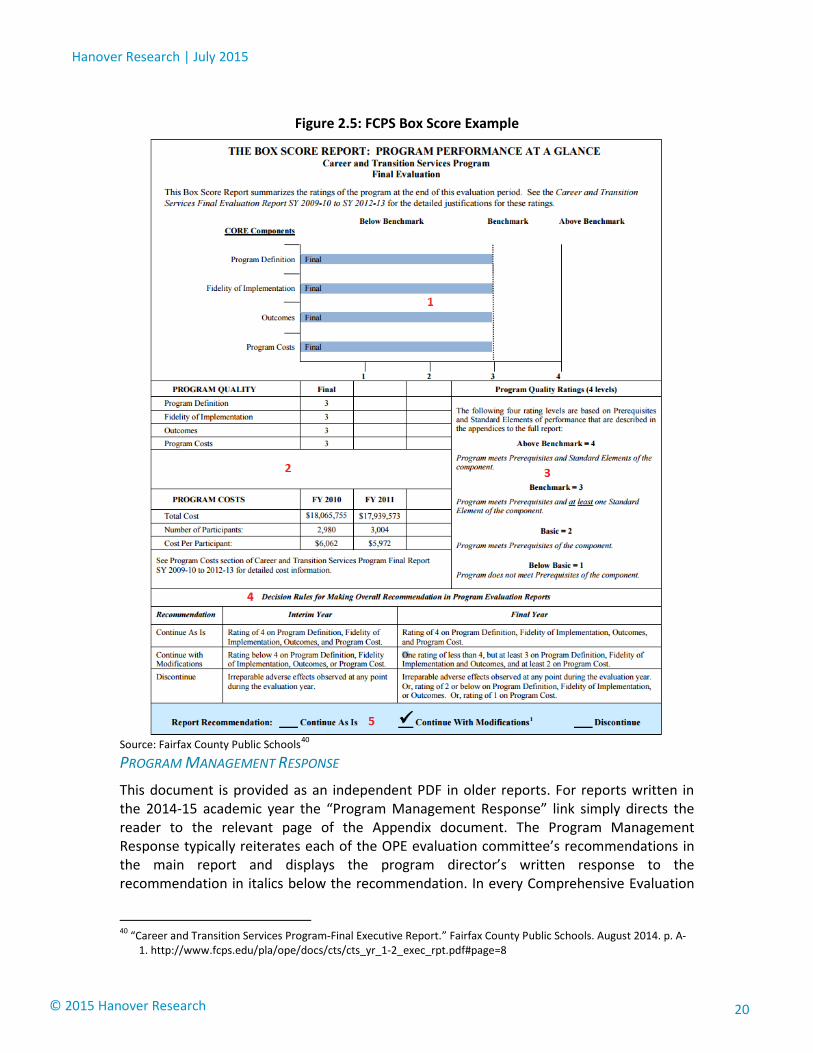
the Box Score. A sample Box Score from the district’s July 2014 report on the Career and Transition Services Program is included in Figure 2.5 (below). Numbers shown in red in correspond to the components described below:
1. CORE Component Score Graph: Displays the program’s score relative to a benchmark for success in the categories of Program Definition, Fidelity of Implementation, Outcomes, and Program Costs
2. Program Quality and Program Costs: These tables display the scores graphed in the Component Score Graph and also show program costs including the total cost of the program, the number of participants it serves, and the cost per participant over the course of 1-3 fiscal years
3. Program Quality Ratings: This section defines each score on the four-point scale used to rank program Core Components (Definition, Fidelity of Implementation, Outcomes, and Costs). Possible scores include: Above Benchmark/4, Benchmark/3, Basic/2, and Below Basic/1.
4. Decision Rules for Making Overall Recommendation in Program Evaluation Reports: Defines the Program Quality Rating scores that must be attained in order for OPE to recommend that a program be continued as-is, modified, or discontinued
5. Report Recommendation: States the outcome of the evaluation; recommendations include “Continue As Is,” “Continue with Modifications,” and “Discontinue”
Hanover Research | July 2015
© 2015 Hanover Research 20
Figure 2.5: FCPS Box Score Example
Source: Fairfax County Public Schools40
PROGRAM MANAGEMENT RESPONSE This document is provided as an independent PDF in older reports. For reports written in the 2014-15 academic year the “Program Management Response” link simply directs the reader to the relevant page of the Appendix document. The Program Management Response typically reiterates each of the OPE evaluation committee’s recommendations in the main report and displays the program director’s written response to the recommendation in italics below the recommendation. In every Comprehensive Evaluation
40 “Career and Transition Services Program-Final Executive Report.” Fairfax County Public Schools. August 2014. p. A-
1. http://www.fcps.edu/pla/ope/docs/cts/cts_yr_1-2_exec_rpt.pdf#page=8
Hanover Research | July 2015
© 2015 Hanover Research 21
OPE asks that managers “provide a written response that speaks to the program’s plans with regard to OPE’s recommendations.”41 This component ranges in length from 2-7 pages, with an average length of four pages. APPENDIXES These documents vary in length from 14 to 49 pages, with an average length of 36.6 pages for the past five reports. They can contain the following components and pieces of evidence. Not all reports contain every possible appendix:
Program Model Evaluation Design Methodology Statement (including information about data sources) Literature Review (discusses best practices in program design and findings regarding
program outcomes)
Comparison District Data (used for program benchmarking) Overview of Implementation Additional Documents (organizational charts, program rubrics, assessments,
resources, curricula, manuals, etc.)
Additional Details About Program Definition Additional Details About Fidelity of Implementation Additional Details About Outcomes Additional Details About Program Costs Program Management Response to OPE’s Recommendations (also available as a
report component)
41 “Career and Transition Services Program-Appendixes.” Fairfax County Public Schools. August 2014. p. I-7.
http://www.fcps.edu/pla/ope/docs/cts/cts_yr_1-2_append_a-i.pdf#page=42
Hanover Research | July 2015
© 2015 Hanover Research 22
MONTGOMERY COUNTY PUBLIC SCHOOLS, MONTGOMERY COUNTY, MD Located northwest of Washington, DC, Montgomery County Public Schools (MCPS) served 152,852 students during the 2014-15 academic year, which is an increase of approximately 4,000 students from the 2012-13 data tracked by the National Center for Education Statistics. The district’s graduation rate for the class of 2013 was 88.3 percent, and its largest demographic groups identify as White (31.0 percent), Hispanic (28.5 percent), and African American (21.5 percent).42 Like Fairfax County Public Schools, MCPS has been identified by the Eli and Edythe Broad Foundation as a district whose African American and low-income students outperform the state averages for these groups on standardized math and reading exams.43 Notable program evaluation reporting practices include the use of an online abstract that allows readers to find reports easily and summarizes their contents, as well as the use of Evaluation Questions to structure reports and research briefs. EVALUATION PROCESS AND CRITERIA The MCPS Office of Shared Accountability (OSA) provides analysis and information services for the district. The office is comprised of seven units including a Program Evaluation unit that “designs and conducts comprehensive implementation and outcome evaluations of [MCPS] programs and initiatives” and provides formative and summative information about them.44 This unit retains eight full-time employees.45 From the 2000-01 school year to the 2014-15 school year the unit has published 105 program evaluation reports.46 In addition to investigating programs flagged by district administrators, staff members from the Program Evaluation Unit also provide other MCPS staff members with technical assistance and consulting services, grantmaking assistance, and psychometric consultation and evaluation. The unit occasionally collaborates with higher education institutions to evaluate externally funded programs operating within the district.47 Unlike Fairfax County Public Schools, MCPS does not use a uniform rubric or set of questions to structure each of its evaluations. Rather, program assessment reports articulate one or more essential Evaluation Questions, some of which are unique to the program and its 42 “Montgomery County Public Schools-At a Glance.” Montgomery County Public Schools. December 8, 2014.
http://www.montgomeryschoolsmd.org/uploadedFiles/about/20141208AtAGlance.pdf 43 “The 2010 Broad Prize.” The Broad Prize. Op. cit. 44 “Units-Office of Shared Accountability.” Montgomery County Public Schools.
http://www.montgomeryschoolsmd.org/departments/sharedaccountability/units.aspx 45 “Program Evaluation Unit.” Montgomery County Public Schools.
http://www.montgomeryschoolsmd.org/directory/directory_Boxoffice.aspx?processlevel=62701 46 See: “Office of Shared Accountability Reports.” Montgomery County Public Schools.
http://sharedaccountability.mcpsmd.org/reports/list.php?Years=AllYrs&Level=AllLvls&Topic=Eval&Show=ReportName&keyword=None
47 “Units-Office of Shared Accountability.” Montgomery County Public Schools. Op. cit.
Enrollment: 148,780 Total Schools: 207 National Size Ranking: 16 Program Evaluation Staff: 8 Full-time Total Expenditures per Student: $17,336

Hanover Research | July 2015
© 2015 Hanover Research 23
history or objectives, and then attempt to answer them. While cost-benefit analyses and summative recommendations to modify or terminate ineffective programs may be a feature of some reports, recent reports also appear to focus on formative questions of how to make programs more effective. As shown by the representative examples in Figure 2.6, common question types focus on fidelity of implementation, program usage patterns, responses from constituents, and outcomes.
Figure 2.6: Examples of MCPS Program Assessment Report Evaluation Questions REPORT TITLE EVALUATION QUESTIONS
Formative Evaluation of ACES Program:
Findings from Surveys and Interviews, Year
One, Grades 11 and 12
How is the ACES program perceived by students and program staff? To what extent did the ACES program increase student knowledge and assist
in their participation of the college application and financial aid process?
Evaluation of the Howard Hughes
Science Grant Project, Year One
How were the [program’s professional development] activities implemented? What were the characteristics of the teacher leaders and their perceptions of
science instruction and culture? What were the immediate outcomes of the teacher leader training sessions? How were the professional development activities implemented? What were the characteristics of the participants and their perceptions of
science instruction and culture? What were the immediate outcomes of the program?
Impact of Advanced Grade 8 U.S. History on Participation and
Performance in Advanced Placement Social Studies Courses
in Grade 9
Did enrollment in an AP social studies course in Grade 9 increase over time following implementation of the Advanced Grade 8 U.S. History course in all middle schools?
How did students who took Advanced Grade 8 U.S. History perform on AP social studies exams in Grade 9 compared with students without Advanced Grade 8 U.S. History? What other explanatory factors were associated with performance in AP social studies courses in Grade 9?
How does participation and performance in AP social studies courses in Grade 9 for Black or African American and Hispanic/Latino students who took Advanced Grade 8 U.S. History compare with their peers without the course?
Source: Montgomery County Public Schools48
48 [1] Wolanin, Natalie, and Shahpar Modarresi. “Formative Evaluation of ACES Program: Findings from Surveys and
Interviews, Year One, Grades 11 and 12.” Montgomery County Public Schools. January 2015. p. v. http://montgomeryschoolsmd.org/departments/sharedaccountability/reports/2015/Evaluation%20of%20ACES%20Year%20One_Final.pdf
[2] Wolanin, Natalie, and Julie Wade. “Evaluation of the Howard Hughes Science Grant Project, Year One.” Montgomery County Public Schools. January 2015. p. v. http://montgomeryschoolsmd.org/departments/sharedaccountability/reports/2015/HH%20Grant%20Year%201%20Evaluation%20Report.pdf
[3] Maina, Nyambura. “Impact of Advanced Grade 8 U.S. History on Participation and Performance in Advanced Placement Social Studies Courses in Grade 9.” Montgomery County Public Schools. January 2015. p. v. http://montgomeryschoolsmd.org/departments/sharedaccountability/reports/2015/Advanced%20Grade%208%20US%20History%20Final_15.01.14.pdf
Hanover Research | July 2015
© 2015 Hanover Research 24
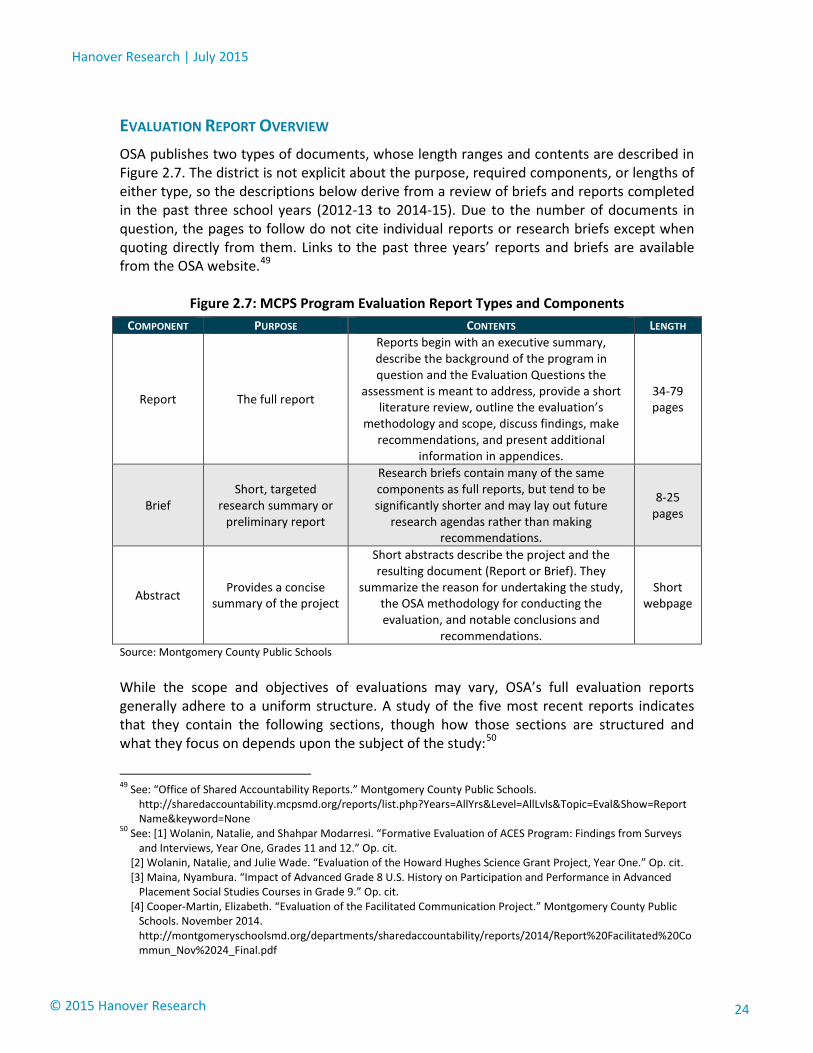
EVALUATION REPORT OVERVIEW OSA publishes two types of documents, whose length ranges and contents are described in Figure 2.7. The district is not explicit about the purpose, required components, or lengths of either type, so the descriptions below derive from a review of briefs and reports completed in the past three school years (2012-13 to 2014-15). Due to the number of documents in question, the pages to follow do not cite individual reports or research briefs except when quoting directly from them. Links to the past three years’ reports and briefs are available from the OSA website.49
Figure 2.7: MCPS Program Evaluation Report Types and Components COMPONENT PURPOSE CONTENTS LENGTH
Report The full report
Reports begin with an executive summary, describe the background of the program in question and the Evaluation Questions the
assessment is meant to address, provide a short literature review, outline the evaluation’s
methodology and scope, discuss findings, make recommendations, and present additional
information in appendices.
34-79 pages
Brief Short, targeted
research summary or preliminary report
Research briefs contain many of the same components as full reports, but tend to be significantly shorter and may lay out future
research agendas rather than making recommendations.
8-25 pages
Abstract Provides a concise summary of the project
Short abstracts describe the project and the resulting document (Report or Brief). They
summarize the reason for undertaking the study, the OSA methodology for conducting the evaluation, and notable conclusions and
recommendations.
Short webpage
Source: Montgomery County Public Schools While the scope and objectives of evaluations may vary, OSA’s full evaluation reports generally adhere to a uniform structure. A study of the five most recent reports indicates that they contain the following sections, though how those sections are structured and what they focus on depends upon the subject of the study:50
49 See: “Office of Shared Accountability Reports.” Montgomery County Public Schools.
http://sharedaccountability.mcpsmd.org/reports/list.php?Years=AllYrs&Level=AllLvls&Topic=Eval&Show=ReportName&keyword=None
50 See: [1] Wolanin, Natalie, and Shahpar Modarresi. “Formative Evaluation of ACES Program: Findings from Surveys and Interviews, Year One, Grades 11 and 12.” Op. cit.
[2] Wolanin, Natalie, and Julie Wade. “Evaluation of the Howard Hughes Science Grant Project, Year One.” Op. cit. [3] Maina, Nyambura. “Impact of Advanced Grade 8 U.S. History on Participation and Performance in Advanced
Placement Social Studies Courses in Grade 9.” Op. cit. [4] Cooper-Martin, Elizabeth. “Evaluation of the Facilitated Communication Project.” Montgomery County Public
Schools. November 2014. http://montgomeryschoolsmd.org/departments/sharedaccountability/reports/2014/Report%20Facilitated%20Commun_Nov%2024_Final.pdf
Hanover Research | July 2015
© 2015 Hanover Research 25
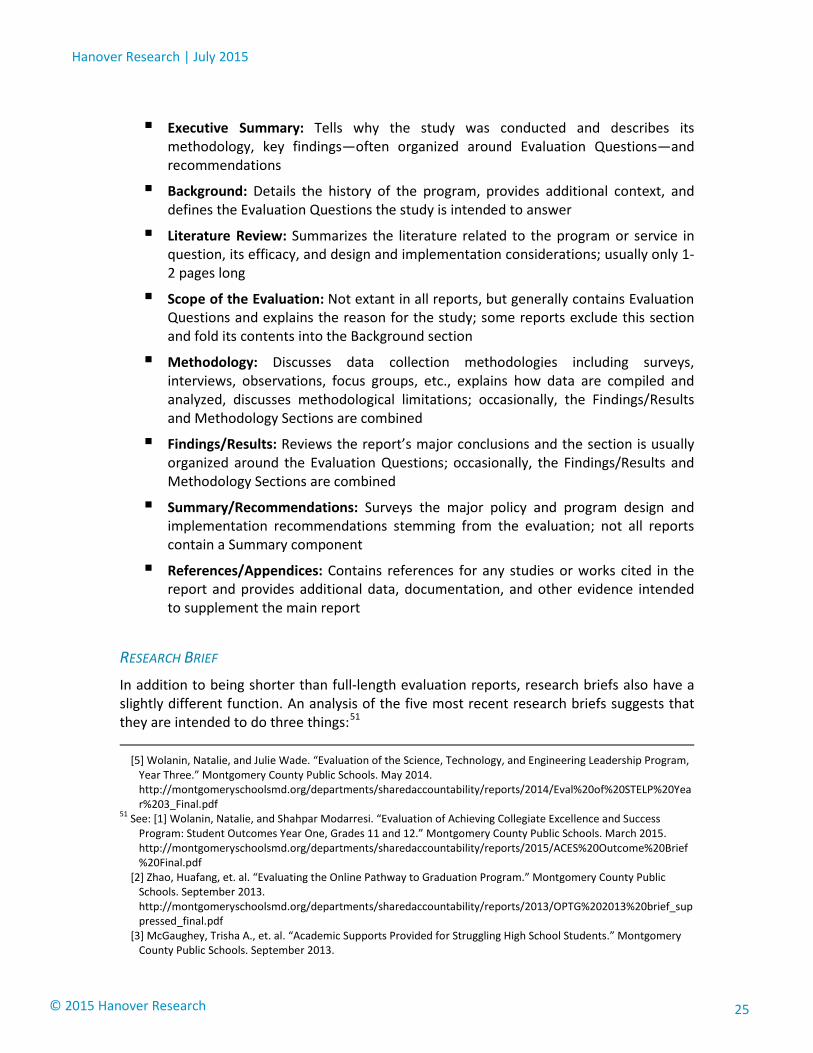
Executive Summary: Tells why the study was conducted and describes its methodology, key findings—often organized around Evaluation Questions—and recommendations
Background: Details the history of the program, provides additional context, and defines the Evaluation Questions the study is intended to answer
Literature Review: Summarizes the literature related to the program or service in question, its efficacy, and design and implementation considerations; usually only 1-2 pages long
Scope of the Evaluation: Not extant in all reports, but generally contains Evaluation Questions and explains the reason for the study; some reports exclude this section and fold its contents into the Background section
Methodology: Discusses data collection methodologies including surveys, interviews, observations, focus groups, etc., explains how data are compiled and analyzed, discusses methodological limitations; occasionally, the Findings/Results and Methodology Sections are combined
Findings/Results: Reviews the report’s major conclusions and the section is usually organized around the Evaluation Questions; occasionally, the Findings/Results and Methodology Sections are combined
Summary/Recommendations: Surveys the major policy and program design and implementation recommendations stemming from the evaluation; not all reports contain a Summary component
References/Appendices: Contains references for any studies or works cited in the report and provides additional data, documentation, and other evidence intended to supplement the main report
RESEARCH BRIEF In addition to being shorter than full-length evaluation reports, research briefs also have a slightly different function. An analysis of the five most recent research briefs suggests that they are intended to do three things:51 [5] Wolanin, Natalie, and Julie Wade. “Evaluation of the Science, Technology, and Engineering Leadership Program,
Year Three.” Montgomery County Public Schools. May 2014. http://montgomeryschoolsmd.org/departments/sharedaccountability/reports/2014/Eval%20of%20STELP%20Year%203_Final.pdf
51 See: [1] Wolanin, Natalie, and Shahpar Modarresi. “Evaluation of Achieving Collegiate Excellence and Success Program: Student Outcomes Year One, Grades 11 and 12.” Montgomery County Public Schools. March 2015. http://montgomeryschoolsmd.org/departments/sharedaccountability/reports/2015/ACES%20Outcome%20Brief%20Final.pdf
[2] Zhao, Huafang, et. al. “Evaluating the Online Pathway to Graduation Program.” Montgomery County Public Schools. September 2013. http://montgomeryschoolsmd.org/departments/sharedaccountability/reports/2013/OPTG%202013%20brief_suppressed_final.pdf
[3] McGaughey, Trisha A., et. al. “Academic Supports Provided for Struggling High School Students.” Montgomery County Public Schools. September 2013.
Hanover Research | July 2015
© 2015 Hanover Research 26
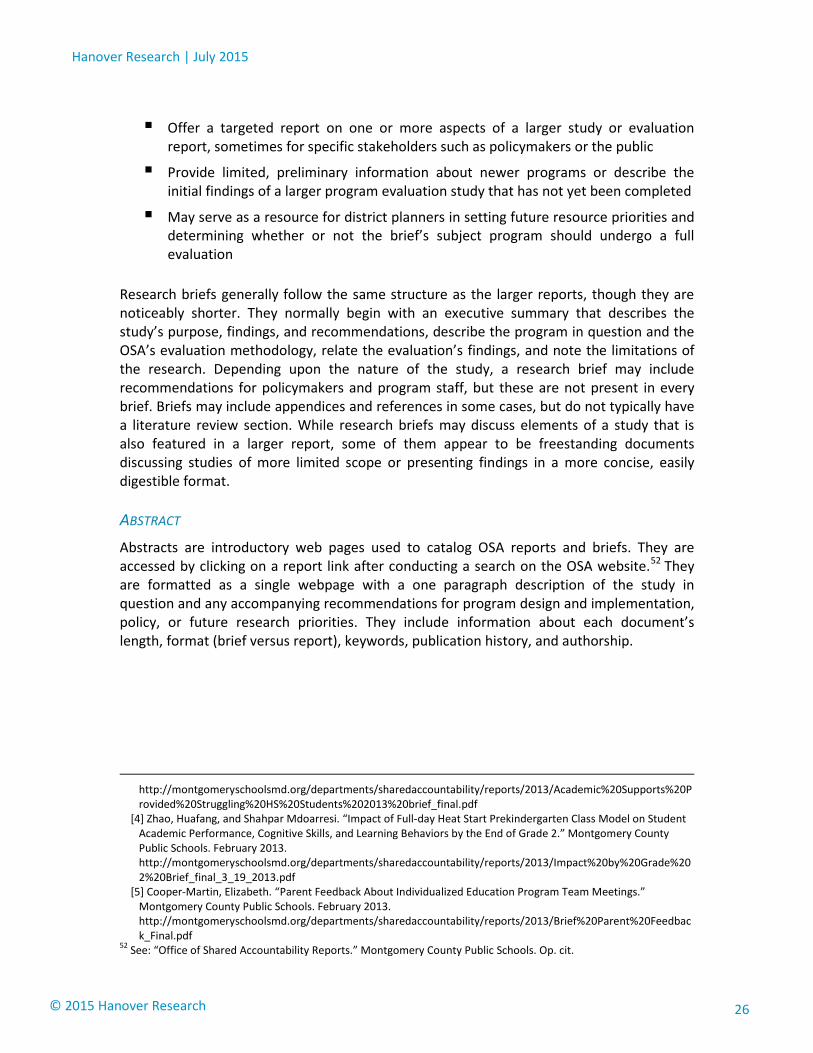
Offer a targeted report on one or more aspects of a larger study or evaluation report, sometimes for specific stakeholders such as policymakers or the public
Provide limited, preliminary information about newer programs or describe the initial findings of a larger program evaluation study that has not yet been completed
May serve as a resource for district planners in setting future resource priorities and determining whether or not the brief’s subject program should undergo a full evaluation
Research briefs generally follow the same structure as the larger reports, though they are noticeably shorter. They normally begin with an executive summary that describes the study’s purpose, findings, and recommendations, describe the program in question and the OSA’s evaluation methodology, relate the evaluation’s findings, and note the limitations of the research. Depending upon the nature of the study, a research brief may include recommendations for policymakers and program staff, but these are not present in every brief. Briefs may include appendices and references in some cases, but do not typically have a literature review section. While research briefs may discuss elements of a study that is also featured in a larger report, some of them appear to be freestanding documents discussing studies of more limited scope or presenting findings in a more concise, easily digestible format. ABSTRACT Abstracts are introductory web pages used to catalog OSA reports and briefs. They are accessed by clicking on a report link after conducting a search on the OSA website.52 They are formatted as a single webpage with a one paragraph description of the study in question and any accompanying recommendations for program design and implementation, policy, or future research priorities. They include information about each document’s length, format (brief versus report), keywords, publication history, and authorship.
http://montgomeryschoolsmd.org/departments/sharedaccountability/reports/2013/Academic%20Supports%20Provided%20Struggling%20HS%20Students%202013%20brief_final.pdf
[4] Zhao, Huafang, and Shahpar Mdoarresi. “Impact of Full-day Heat Start Prekindergarten Class Model on Student Academic Performance, Cognitive Skills, and Learning Behaviors by the End of Grade 2.” Montgomery County Public Schools. February 2013. http://montgomeryschoolsmd.org/departments/sharedaccountability/reports/2013/Impact%20by%20Grade%202%20Brief_final_3_19_2013.pdf
[5] Cooper-Martin, Elizabeth. “Parent Feedback About Individualized Education Program Team Meetings.” Montgomery County Public Schools. February 2013. http://montgomeryschoolsmd.org/departments/sharedaccountability/reports/2013/Brief%20Parent%20Feedback_Final.pdf
52 See: “Office of Shared Accountability Reports.” Montgomery County Public Schools. Op. cit.
Hanover Research | July 2015
© 2015 Hanover Research 27
SCHOOL DISTRICT OF PALM BEACH COUNTY, PALM BEACH COUNTY, FL The School District of Palm Beach County (SDPBC) is recognized as a “top performing urban school district in Florida,” and served approximately 183,000 students during the 2014-15 school year. 53 The district’s Department of Research and Evaluation (DRE) gathers, analyzes, and reports data from state and district testing, school assignments, and its own ongoing research. One of its mandates is to evaluate educational programs being tested or implemented within district schools and ensure that all constituents are being served efficiently. In addition to conducting its own research, the DRE staff also supervises outside researchers conducting studies involving district students.54 DRE maintains a staff of ten employees,55 six of whom are involved in program evaluation activities.56 As shown below, the most notable feature of the district’s program evaluation reports is their brevity and narrow scope. Reports are formatted as short policy memoranda augmented by supplemental methodological explanations and accompanied by evidence. Evaluations are also very limited in their scope and typically focus only on how well programs are implemented and how effective they are. EVALUATION PROCESS AND CRITERIA SDPBC does not publish a guide to its evaluation process or explain how programs are chosen for evaluation, but available documents define a program evaluation as “a determination of the effectiveness and value of a program.” Program effectiveness refers to “how well the program accomplishes its goals and objectives,” while value describes “the extent to which the program contributes to the goals and priorities of the School District of Palm Beach County.”57 In short, program evaluations are designed to measure two aspects of the program in question:58
Fidelity of Implementation: How well does the program conform to its design principles or the research that justifies it?
Impact on Student Performance: Does the program in question improve student performance in the way it is intended?
53 “About Us.” School District of Palm Beach County. http://www.palmbeachschools.org/Communications/aboutus/ 54 “What We Do-Department of Research and Evaluation.” School District of Palm Beach County.
http://www.palmbeachschools.org/dre/NRE/index.asp 55 Ibid. 56 “Program Evaluation Reports-Department of Research and Evaluation.” School District of Palm Beach County.
http://www.palmbeachschools.org/dre/NRE/ProgEval.asp 57 Ibid. 58 List summarizes content from: Ibid.
Enrollment: 179,514 Total Schools: 260 National Size Ranking: 12 Program Evaluation Staff: 6 Full-time Total Expenditures per Student: $10,545
Hanover Research | July 2015
© 2015 Hanover Research 28
DRE publications are careful to note that program evaluations are intended to evaluate the programs themselves, and that the department “does not evaluate the quality of instruction provided by individual teachers or by teachers as a group.”59 The district’s program evaluations are based on the national Program Evaluation Standards of the American Evaluation Association.60 As noted in Section I, these standards are the same as the standards developed by the Joint Committee on Standards for Educational Evaluation (JCSEE). The district has not published reports from the most recent evaluation years. Therefore, the analysis of reporting practices in the pages to follow is based upon the five most recent published reports. These date to the 2010-11 and 2011-12 school years. Except where a specific report is directly quoted, all conclusions about the structure and content of SDPBC program evaluation reports can be confirmed by examining the five documents consulted in this analysis.61 In the five most recent years for which reports are extant, the DRE has released a minimum of two reports (2011) and a maximum of 13 (2010). The high degree of variation in the number of reports completed each year suggests that program evaluations may be completed when district priorities require additional scrutiny, and not as a recurring, mandatory event in the life of most programs. Given that all six members of the program evaluation staff are cross listed with the DRE staff, it is likely that these researchers are also called upon to produce other types of reports as required by district priorities.62 EVALUATION REPORT OVERVIEW Evaluation reports published by the DRE are notable for the exceptional brevity—the average length for the past five reports is 10.6 pages—and the fact that they are formatted as 1-3 page memos with supplemental data and analysis pages to justify the memo’s conclusions. The longest report is 18 pages, while the shortest is only three pages including the memo and two pages of supporting documents. There are no publically available supplemental documents or longer reports, though it is possible that departments undergoing evaluation receive such documents. However, the emphasis on short report 59 Ibid. 60 Ibid. 61 See: [1] Howard, Mark. “FY 2011 Analysis of Graduation Rate in Career and Technical Education Program
Concentrators.” School District of Palm Beach County. March 6, 2012. http://www.palmbeachschools.org/dre/documents/FY2011_CTE_Concentrators_Memo_v1.pdf
[2] Howard, Mark. “FY 2011 Analysis of Charter Schools.” School District of Palm Beach County. April 20, 2012. http://www.palmbeachschools.org/dre/documents/FY2011_Charter_Schools_v2.pdf
[3] Howard, Mark. “FY 2011 Analysis of Specific ESE Programs.” School District of Palm Beach County. August 17, 2011. http://www.palmbeachschools.org/dre/documents/FY2011_ESE_Analysis_Memo_v2.pdf
[4] Howard, Mark. “FY 2011 Analysis of the New Teacher Center Program.” School District of Palm Beach County. November 7, 2011. http://www.palmbeachschools.org/dre/documents/FY2011_MetLife_NTC_Program_Memo_v7.pdf
[5] Howard, Mark. “FY 2010 Analysis of the SECME Program.” School District of Palm Beach County. August 10, 2011. http://www.palmbeachschools.org/dre/documents/FY2010_SECME_Program_Memo_v7.pdf
62 See: [1] “What We Do-Department of Research and Evaluation.” School District of Palm Beach County. Op. cit. [2] “Program Evaluation Reports-Department of Research and Evaluation.” School District of Palm Beach County.
Op. cit.
Hanover Research | July 2015
© 2015 Hanover Research 29
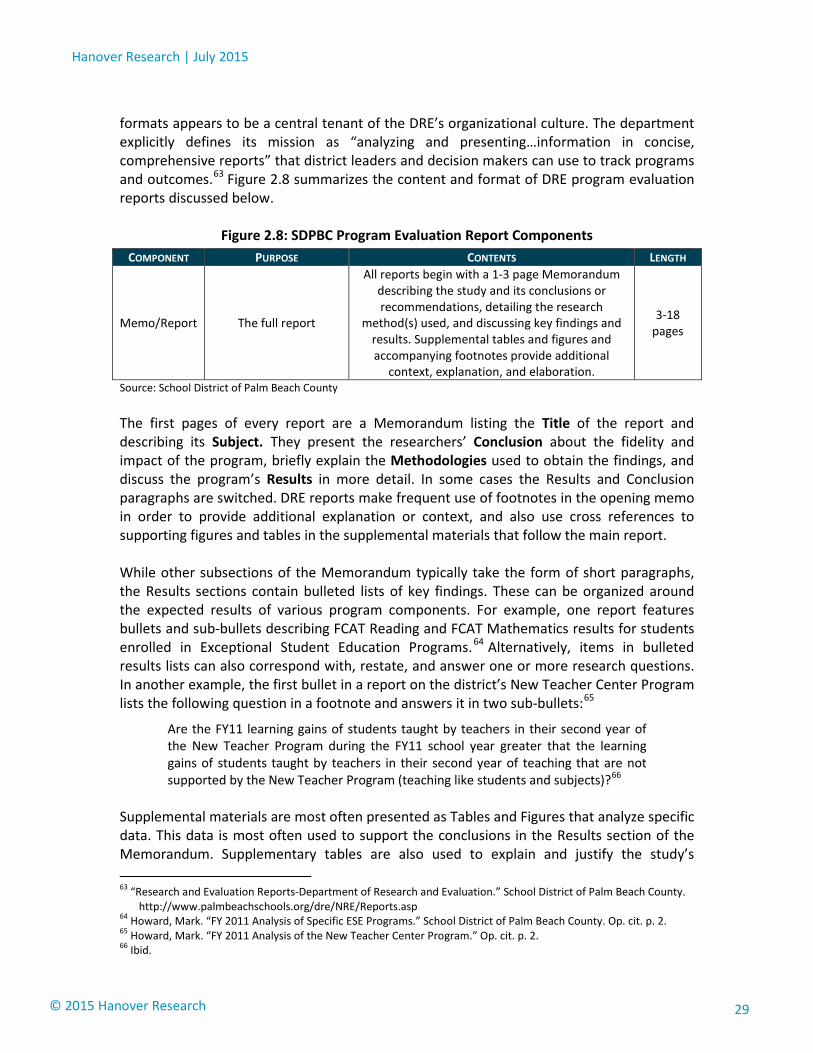
formats appears to be a central tenant of the DRE’s organizational culture. The department explicitly defines its mission as “analyzing and presenting…information in concise, comprehensive reports” that district leaders and decision makers can use to track programs and outcomes.63 Figure 2.8 summarizes the content and format of DRE program evaluation reports discussed below.
Figure 2.8: SDPBC Program Evaluation Report Components COMPONENT PURPOSE CONTENTS LENGTH
Memo/Report The full report
All reports begin with a 1-3 page Memorandum describing the study and its conclusions or recommendations, detailing the research
method(s) used, and discussing key findings and results. Supplemental tables and figures and accompanying footnotes provide additional
context, explanation, and elaboration.
3-18 pages
Source: School District of Palm Beach County The first pages of every report are a Memorandum listing the Title of the report and describing its Subject. They present the researchers’ Conclusion about the fidelity and impact of the program, briefly explain the Methodologies used to obtain the findings, and discuss the program’s Results in more detail. In some cases the Results and Conclusion paragraphs are switched. DRE reports make frequent use of footnotes in the opening memo in order to provide additional explanation or context, and also use cross references to supporting figures and tables in the supplemental materials that follow the main report. While other subsections of the Memorandum typically take the form of short paragraphs, the Results sections contain bulleted lists of key findings. These can be organized around the expected results of various program components. For example, one report features bullets and sub-bullets describing FCAT Reading and FCAT Mathematics results for students enrolled in Exceptional Student Education Programs.64 Alternatively, items in bulleted results lists can also correspond with, restate, and answer one or more research questions. In another example, the first bullet in a report on the district’s New Teacher Center Program lists the following question in a footnote and answers it in two sub-bullets:65
Are the FY11 learning gains of students taught by teachers in their second year of the New Teacher Program during the FY11 school year greater that the learning gains of students taught by teachers in their second year of teaching that are not supported by the New Teacher Program (teaching like students and subjects)?66
Supplemental materials are most often presented as Tables and Figures that analyze specific data. This data is most often used to support the conclusions in the Results section of the Memorandum. Supplementary tables are also used to explain and justify the study’s 63 “Research and Evaluation Reports-Department of Research and Evaluation.” School District of Palm Beach County.
http://www.palmbeachschools.org/dre/NRE/Reports.asp 64 Howard, Mark. “FY 2011 Analysis of Specific ESE Programs.” School District of Palm Beach County. Op. cit. p. 2. 65 Howard, Mark. “FY 2011 Analysis of the New Teacher Center Program.” Op. cit. p. 2. 66 Ibid.

Hanover Research | July 2015
© 2015 Hanover Research 30
methodology and scope and provide a detailed breakdown of results. For example, a short (3 pages) report on graduation rates among students in the district’s Care and Technical Education (CTE) program concentrators includes only two tables. The first describes the CTE student group and the comparison group selected by the DRE researchers using demographic, socioeconomic, and academic characteristics. The second table shows the percentage of students in the CTE group and the control group who gradated during the years studied and itemizes the data so that student groups of particular academic abilities can be studied independently.67 Explanatory tables are often further explained and contextualized with footnotes elaborating on methodological decisions, describing limitations and factors that could impact the quality of the data, and discussing and highlighting findings. The district’s use of a short memorandum-style report augmented by tables, explanatory footnotes, and cross references allows it to keep its program evaluation reports exceedingly short. CHARLOTTE-MECKLENBURG SCHOOLS, CHARLOTTE, NC Charlotte-Mecklenburg Schools (CMS) serves the city of Charlotte and Mecklenburg County, North Carolina. District publications, which provide a more recent snapshot of enrollment and school numbers than the NCES data cited above, indicate that the district enrolled 145,363 students in 164 schools during the 2014-15 school year. The school’s largest student demographic groups include African American (42 percent), White (32 percent), and Hispanic (18 percent) students.68 The CMS Office of Accountability works to improve student performance by providing decision makers, employees, and educators with timely data, research, and information. Projects include strategic planning and policy documents, data analysis and reporting, state testing and reporting, grant seeking activities, and research, evaluation, and analytics.69 Staffing levels for the Office of Accountability could not be determined because the district only lists Executive Director and Director-level positions.70 In general, CMS is notable for producing longer, in-depth reports with a uniform structure. As noted below, these comprehensive documents are used for policy and pedagogical decisions within the district and may also be published in academic journals. 67 See: Howard, Mark. “FY 2011 Analysis of Graduation Rate in Career and Technical Education Program
Concentrators.” Op. cit. pp. 2-3. 68 “CMS Fast Facts.” Charlotte-Mecklenburg Schools. February 2015.
http://www.cms.k12.nc.us/mediaroom/aboutus/Documents/Fast%20Facts_Fact%20Sheet_2015.pdf 69 “Office of Accountability.” Charlotte-Mecklenburg Schools.
http://www.cms.k12.nc.us/cmsdepartments/accountability/Pages/default.aspx 70 See: “Contact Information-Office of Accountability.” Charlotte-Mecklenburg Schools.
http://www.cms.k12.nc.us/cmsdepartments/accountability/Pages/contacts.aspx
Enrollment: 144,478 Total Schools: 175 National Size Ranking: 18 Program Evaluation Staff: Not available Total Expenditures per Student: $9,782
Hanover Research | July 2015
© 2015 Hanover Research 31
EVALUATION PROCESS AND CRITERIA The Office of Accountability’s Research, Evaluation, and Analytics department “conducts and reviews research to inform district decision-making about the efficacy of programs and initiatives designed to increase and support student achievement.”71 It administers surveys to collect parent, student, and teacher feedback, reviews external research project proposals, and supports the district’s comprehensive accountability system by designing and implementing performance management tools. One of the department’s main functions is writing research and evaluation reports for district programs.72 These program assessments are conducted by the Center for Research, Evaluation, and Analytics. They are intended to “determine ‘what works’ and inform stakeholders who shape district policies.” Depending upon the needs of individual projects, evaluations can contain literature reviews and original research.73 There does not appear to be an established procedure for deciding which programs undergo an evaluation at any given time.74 The district’s repository of research and evaluation reports contains a variety of research studies, program evaluations, and policy documents. None of these appear to be organized thematically or chronologically.75 The findings below derive from an analysis of the five research and evaluation reports and interim reports that are listed at the top of the department’s list of available reports as of this writing.76 Note that two of these documents are interim reports, published at least a year in advance of the final report, and that the
71 “Research, Evaluation, and Analytics.” Charlotte-Mecklenburg Schools.
http://www.cms.k12.nc.us/cmsdepartments/accountability/REA/Pages/default.aspx 72 Ibid. 73 “Evaluation-Research, Evaluation, and Analytics.” Charlotte-Mecklenburg Schools.
http://www.cms.k12.nc.us/cmsdepartments/accountability/REA/Pages/Evaluation.aspx 74 See: “Research and Evaluation Reports.” Charlotte-Mecklenburg Schools.
http://www.cms.k12.nc.us/cmsdepartments/accountability/REA/Pages/ResearchandEvaluationReports.aspx 75 See: Ibid. 76 See: [1] Schoeneberger, Jason A. et. al. “Evaluation of Teach for America in Charlotte-Mecklenburg Schools.”
Charlotte-Mecklenburg Schools. August 15, 2009. http://www.cms.k12.nc.us/cmsdepartments/accountability/REA/Documents/TFA_Evaluation_Report.pdf
[2] Pulliam, Cheryl L. et. al. “Effectiveness of Strategic Staffing Schools: Year 1-Interim Report.” Charlotte-Mecklenburg Schools. March 2010. http://www.cms.k12.nc.us/cmsdepartments/accountability/REA/Documents/Strategic%20Staffing%20Interim%20Report.pdf
[3] Schoeneberger, Jason A. et. al. “Evaluation of the Strategic Staffing Initiative in Charlotte-Mecklenburg Schools.” January 2011. http://www.cms.k12.nc.us/cmsdepartments/accountability/REA/Documents/Stategic%20Staffing%20Evaluation%20Report%20January%202011.pdf
[4] Schoeneberger, Jason A. et. al. “Evaluation of Teach for America in Charlotte-Mecklenburg Schools.” Charlotte-Mecklenburg Schools. May 30, 2011. http://www.cms.k12.nc.us/cmsdepartments/accountability/REA/Documents/TeachForAmerica_Evaluation_Report_2011.pdf
[5] Dever, Kelly A. et. al. “Small Schools Interim Report: Academic Achievement.” Charlotte-Mecklenburg Schools. March 2010. http://www.cms.k12.nc.us/cmsdepartments/accountability/REA/Documents/Small%20Schools%20Interim%20Quantitative%20Report.pdf
Hanover Research | July 2015
© 2015 Hanover Research 32
district releases multiple full reports on the same subject (e.g. Teach for America) over the course of several years. While all reports have at least one investigator from the district’s Center for Research and Evaluation, CMS regularly enlists specialists referred to as Research and Evaluation Contractors, as well as faculty members from nearby universities, to augment its in-house research capabilities.77 EVALUATION REPORT OVERVIEW Regardless of whether they are final or interim reports, CMS program evaluation reports tend to be longer than those released by most other school districts in this study. The average length of the five reports studied is 68 pages and the shortest and longest reports are 58 and 78 pages, respectively. There does not appear to be any difference in length between interim and final reports. Unlike Fairfax County Public Schools and Montgomery County Public Schools, CMS does not produce any supplemental documents to accompany its main reports (see Figure 2.9). Although the main reports are long, the fact that they are uniformly structured and offer readers an executive summary, introduction, and conclusion section makes them easier to interpret for stakeholders who lack the time to read the entire document. Additionally, CMS reports tend to define and focus on a limited number of key research questions. As a result, their scope remains fairly precise as they strive to answer these questions. It is unclear which stakeholders, including program staff, administrators and policymakers, and the researchers themselves, are responsible for choosing research questions, or whether there is a governing set of priorities (e.g. ensuring fidelity of implementation or cost-effectiveness) for the district’s program evaluation research. At least some of the district’s research appears to be intended for publication in scholarly journals. For example, the 2011 report on Teach for America at CMS notes that the 2009 report on the subject was published in a peer-reviewed journal, and that the follow-up report was meant to “better understand the impact TFA teachers have on student achievement” and study perceptions of the program among district stakeholders.78
77 See: [1] Pulliam, Cheryl L. et. al. “Effectiveness of Strategic Staffing Schools: Year 1-Interim Report.” Op. cit. p. iii. [2] ] Schoeneberger, Jason A. et. al. “Evaluation of Teach for America in Charlotte-Mecklenburg Schools.” August
2009. Op. cit. p. iii. 78 Schoeneberger, Jason A. et. al. “Evaluation of Teach for America in Charlotte-Mecklenburg Schools.” May 30, 2011.
pp. 4-5.

Hanover Research | July 2015
© 2015 Hanover Research 33
Figure 2.9: CMS Program Evaluation Report Components COMPONENT PURPOSE CONTENTS LENGTH
Report The full report
Every report contains an executive summary with bulleted conclusions, introduction and definition of research questions, methodology statement, presentation of results, summary discussion of conclusions and recommendations for policy
changes or additional research, and a works cited section. Some reports also supplement these
components with appendices.
58-78 pages
Source: Charlotte-Mecklenburg Schools While the structure and contents of individual reports varies slightly between documents, most CMS interim and final research reports share a uniform structure. They contain the following components:
Executive Summary: This section ranges from two to four pages in length and contains a short paragraph defining the program under review and detailing the goals and methods of the evaluation. Most summaries state key findings and results in bulleted lists, which are occasionally organized under topical or methodological (e.g. qualitative versus quantitative results) subheadings.
Introduction: The introduction provides a more in-depth explanation of the program in question and the review process. This section ranges from 1-8 pages in the examples studied, with longer examples containing short literature review sections, program histories, and lists of research questions.
Method: This component explains the method(s) used to conduct the program evaluation. In one older example, the method section is a component of a “Study Rationale” section that contains methodological explanations and the research question driving the study.79 Newer examples appear to define their research questions in the Introduction, however.
Results: Results sections present findings and evidence. They are often organized so that individual results discussions correspond with specific research questions, data sources, or methodologies. For example, the March 2010 Interim Report entitled Effectiveness of Strategic Staffing Schools breaks down its results by presenting conclusions drawn from student achievement, attendance, and discipline data and concludes with qualitative and quantitative findings from teacher surveys and interviews.80 In most cases this is the longest section of each report due to the need to present and discuss extensive evidence.
79 Schoeneberger, Jason A. et. al. “Evaluation of Teach for America in Charlotte-Mecklenburg Schools.” August 15,
2009. Op. cit. pp. 4-16. 80 See: Pulliam, Cheryl L. et. al. “Effectiveness of Strategic Staffing Schools: Year 1-Interim Report.” March 2010. Op.
cit. pp. 11-48.

Hanover Research | July 2015
© 2015 Hanover Research 34
Discussion: This short concluding section synthesizes findings presented in the Results section in order to generate key findings about the program or initiative in question. One of the featured reports calls this section “Summary and Conclusions” instead,81 while another includes additional subsections entitled “Overall Study Findings” and “Limitations and Future Research.”82
References: This section contains citations for all sources discussed in the literature review or used elsewhere in the report.
Appendices: Some reports contain appendices that present additional evidence or information as needed.
There is no indication that the department(s) or programs under review are asked to compose a formal response to their evaluation. PINELLAS COUNTY SCHOOLS, PINELLAS COUNTY, FL Pinellas County Schools (PCS) reports its most current enrollment as 116,305. Recent strategic initiatives by the district have led to universal improvements in its students’ FCAT scores in 2013 and improved Advanced Placement offerings, participation rates, and student outcomes. The district is pursuing Southern Association of Colleges and Schools accreditation to “provide a national model of standards for the district to follow, improve its systems and processes, drive student achievement, and align and focus its priorities, goals, and actions.”83 PCS produces long, comprehensive program evaluation reports that are packaged as a single document. As discussed below, the district is also notable for its flexible report structures, which may be an advantage for researchers seeking to customize their research questions and findings for specific objectives. This lack of uniformity may hinder readers who must consult more than one document, however. EVALUATION PROCESS AND CRITERIA The Department of Assessment, Accountability, and Research (AAR) provides the evaluation, testing, and research services needed to support the district’s strategic initiatives. Its stated purpose is to “enhance the quality of educational decisions that affect students” and provide reports to constituents throughout the district. In addition to
81 Ibid. p. 49. 82 Schoeneberger, Jason A. et. al. “Evaluation of Teach for America in Charlotte-Mecklenburg Schools.” August 15,
2009. Op. cit. pp. 42-46. 83 “About Us.” Pinellas County Schools. http://www.pcsb.org/domain/6
Enrollment: 103,590 Total Schools: 175 National Size Ranking: 26 Program Evaluation Staff: Up to 16 Full-time Total Expenditures per Student: $10,276

Hanover Research | July 2015
© 2015 Hanover Research 35
Assessment and Accountability, Planning and Policy, and Testing units, AAR also administers a Program Evaluation unit.84 The Program Evaluation Unit is responsible for conducting all of the district’s program evaluations and also oversees research and evaluations being conducted within district schools by outside evaluators and researchers.85 AAR maintains a staff of 16, but it is unclear from the information provided how many of these employees are part of the Program Evaluation unit.86 The district explicitly states that not all of its reports and analyses are released to the public.87 Moreover, the most recent publically available program evaluation reports were published in 2012.88 As a result, it is not entirely clear that the available documents are a representative sample of the district’s most recent or widespread program evaluation reporting practices. PCS also incorporates school climate surveys into its annual lists of evaluation reports.89 However, this report draws its findings from a study of the five most recent reports in the Evaluation Reports category that are clearly assessments of specific programs or initiatives within the district. The overview of district program evaluation practices offered below stems from a careful analysis of how these representative examples are structured. Programs and initiatives evaluated in the reports in question include Race to the Top, an intensive math program, the PCS art education program, charter schools within the district, and Response to Intervention (RtI) implementation.90 EVALUATION REPORT OVERVIEW PCS program evaluation reports are among the longest reports published by the districts profiled in this report. While one of the five evaluation reports is only 28 pages long, the remainder range from 63 to 88 pages. The average length is 66.2 pages. Each report appears to be a freestanding document, and there is no indication that different groups of stakeholders receive different versions of the evaluation report. Program evaluations published by PCS are the least uniform examples featured in this report. While some components like the opening executive summary remain the same across all examples studied, other sections are included, positioned, subordinated to one another, and highlighted as needed. For example, the 2011 Problem Solving/Response to 84 “Assessment, Accountability, and Research.” Pinellas County Schools. http://www.pcsb.org/Domain/170 85 “Program Evaluation.” Pinellas County Schools. http://www.pcsb.org/Page/2785 86 “Assessment, Accountability, and Research Staff.” Pinellas County Schools. http://www.pcsb.org/Page/15244 87 “Assessment, Accountability, and Research.” Pinellas County Schools. Op. cit. 88 “Evaluation Reports.” Pinellas County Schools. http://www.pcsb.org//site/Default.aspx?PageID=5343 89 “Evaluation Reports, 2012.” Pinellas County Schools. http://www.pcsb.org/Page/4980 90 See: [1] “Evaluation of Race to the Top Program.” Pinellas County Schools. December 2011.
file:///C:/Users/aneff/Downloads/Evaluation_Of_Race_To_The_Top_Program__2010-11.pdf [2] “Voyager Math Program Evaluation Report.” Pinellas County Schools. April 2012.
file:///C:/Users/aneff/Downloads/VOYAGER_MATH_-_EVALUATION_.pdf [3] “Evaluation of Art Instruction in Pinellas County Schools.” Pinellas County Schools. September 6, 2011.
file:///C:/Users/aneff/Downloads/Evaluation_of_Art_Instruction_in_Pinellas_County_Schools.pdf [4] “Charter Schools Evaluation.” Pinellas County Schools. 2011.
file:///C:/Users/aneff/Downloads/2011_CHARTER_SCHOOLS_EVALUATION_2010_2011_Final_9_21_11.pdf [5] “Pinellas County Schools Problem-Solving/Response to Intervention (PS/RtI) Evaluation.” Pinellas County
Schools. 2011. file:///C:/Users/aneff/Downloads/2011_PSRTI_Evaluation_SAPSI_Analysis_RSL.pdf
Hanover Research | July 2015
© 2015 Hanover Research 36
Intervention report discusses findings from a 43 question survey designed to measure the program’s fidelity of implementation. The study seeks to answer five evaluation questions. These include 1) whether or not fidelity of implementation had improved from prior years, 2) how consistent schools were with one another in their implementation practices, 3) how much implementation practices vary at different types of schools and 4) at different grade levels, and 5) what implementation goals should be a focus in upcoming school years.91 The report has very short (½ page) introductory sections discussing RtI in district schools and defining the method used to study the program’s implementation, while pages 6-74 discuss the results from the questionnaire.92 On the other hand, the district’s comprehensive report on Race to the Top (RTTT) studies the program’s 1) efficacy and 2) implementation, as well as 3) the process used to evaluate teachers and 4) the district’s provision of RTTT-related professional development.93 Each of these four questions receives its own section, complete with a methodology overview and explanation of the section’s key research questions, as well as any required background information.94 Unlike the RtI report, which focuses exclusively on various aspects of the program’s implementation, the RTTT report is essentially four distinct reports combined into one comprehensive document. As a result, its organization and component sections and subsections differ substantially from reports with a more limited scope. While this comparatively high degree of variation is not necessarily a disadvantage, the lack of consistency between evaluation reports means that readers of more than one report will likely need to invest more time in order to understand the report’s scope and research questions than they would if reading multiple reports with uniform structures. Figure 2.10 summarizes the components and structural practices common to most PCS program evaluation reports.
91 “Pinellas County Schools Problem-Solving/Response to Intervention (PS/RtI) Evaluation.” Pinellas County Schools.
Op. cit. p. 4. 92 See: Ibid. p. 5. 93 “Evaluation of Race to the Top Program.” Pinellas County Schools. Op. cit. p. i. 94 For an example, see: Ibid. p. 9.
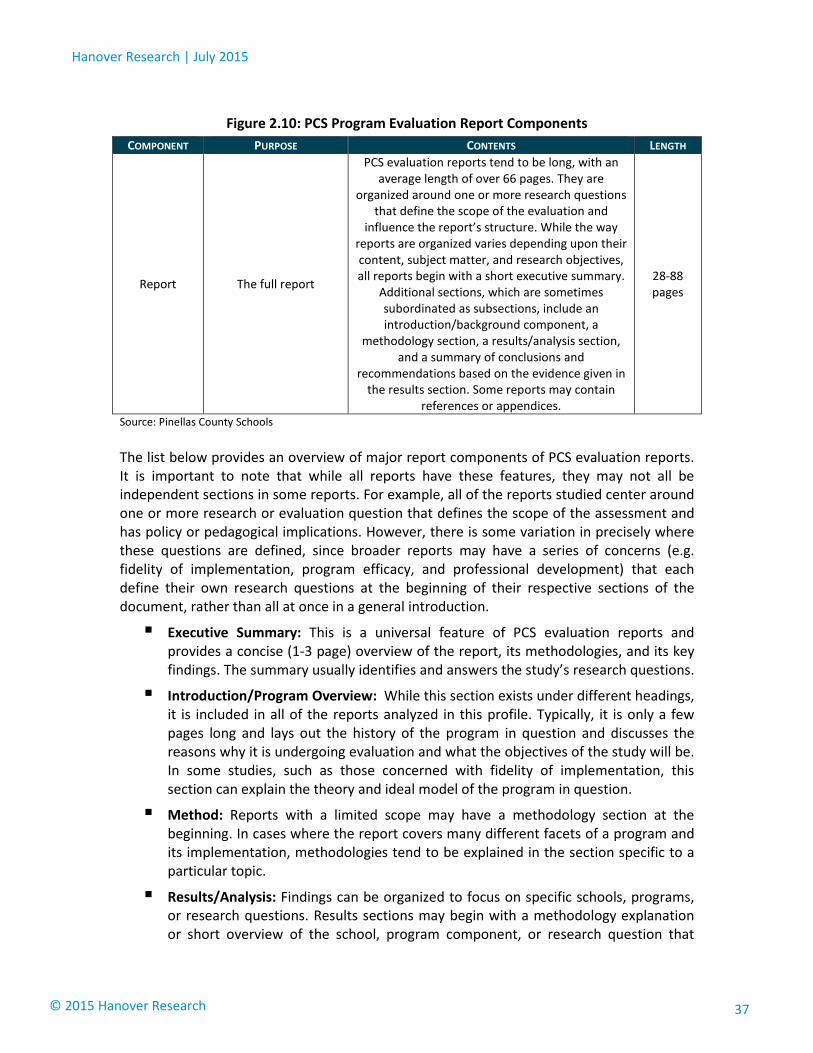
Hanover Research | July 2015
© 2015 Hanover Research 37
Figure 2.10: PCS Program Evaluation Report Components COMPONENT PURPOSE CONTENTS LENGTH
Report The full report
PCS evaluation reports tend to be long, with an average length of over 66 pages. They are
organized around one or more research questions that define the scope of the evaluation and
influence the report’s structure. While the way reports are organized varies depending upon their content, subject matter, and research objectives, all reports begin with a short executive summary.
Additional sections, which are sometimes subordinated as subsections, include an introduction/background component, a
methodology section, a results/analysis section, and a summary of conclusions and
recommendations based on the evidence given in the results section. Some reports may contain
references or appendices.
28-88 pages
Source: Pinellas County Schools The list below provides an overview of major report components of PCS evaluation reports. It is important to note that while all reports have these features, they may not all be independent sections in some reports. For example, all of the reports studied center around one or more research or evaluation question that defines the scope of the assessment and has policy or pedagogical implications. However, there is some variation in precisely where these questions are defined, since broader reports may have a series of concerns (e.g. fidelity of implementation, program efficacy, and professional development) that each define their own research questions at the beginning of their respective sections of the document, rather than all at once in a general introduction.
Executive Summary: This is a universal feature of PCS evaluation reports and provides a concise (1-3 page) overview of the report, its methodologies, and its key findings. The summary usually identifies and answers the study’s research questions.
Introduction/Program Overview: While this section exists under different headings, it is included in all of the reports analyzed in this profile. Typically, it is only a few pages long and lays out the history of the program in question and discusses the reasons why it is undergoing evaluation and what the objectives of the study will be. In some studies, such as those concerned with fidelity of implementation, this section can explain the theory and ideal model of the program in question.
Method: Reports with a limited scope may have a methodology section at the beginning. In cases where the report covers many different facets of a program and its implementation, methodologies tend to be explained in the section specific to a particular topic.
Results/Analysis: Findings can be organized to focus on specific schools, programs, or research questions. Results sections may begin with a methodology explanation or short overview of the school, program component, or research question that
Hanover Research | July 2015
© 2015 Hanover Research 38
anchors each discussion. In most cases the results section provides evidence to support the conclusions and recommendations presented immediately thereafter. As such, it is usually the longest section of a given report.
Conclusions/Recommendations: This section appears at the end of most reports with limited areas of focus and may appear at the end of school, research question, or program-specific subsections in the Results/Analysis section in reports organized around a range of varied research questions. Its purpose is to highlight the most important trends and conclusions and make policy and program design and implementation recommendations.
References/Appendices: Some reports contain a references section identifying any outside sources used in the document. Additionally, reports may also feature supplemental appendices with additional materials, evidence, or methodological explanations.

© 2015 Hanover Research 39
PROJECT EVALUATION FORM Hanover Research is committed to providing a work product that meets or exceeds partner expectations. In keeping with that goal, we would like to hear your opinions regarding our reports. Feedback is critically important and serves as the strongest mechanism by which we tailor our research to your organization. When you have had a chance to evaluate this report, please take a moment to fill out the following questionnaire. http://www.hanoverresearch.com/evaluation/index.php
CAVEAT The publisher and authors have used their best efforts in preparing this brief. The publisher and authors make no representations or warranties with respect to the accuracy or completeness of the contents of this brief and specifically disclaim any implied warranties of fitness for a particular purpose. There are no warranties that extend beyond the descriptions contained in this paragraph. No warranty may be created or extended by representatives of Hanover Research or its marketing materials. The accuracy and completeness of the information provided herein and the opinions stated herein are not guaranteed or warranted to produce any particular results, and the advice and strategies contained herein may not be suitable for every partner. Neither the publisher nor the authors shall be liable for any loss of profit or any other commercial damages, including but not limited to special, incidental, consequential, or other damages. Moreover, Hanover Research is not engaged in rendering legal, accounting, or other professional services. Partners requiring such services are advised to consult an appropriate professional.
4401 Wilson Boulevard, Suite 400 Arlington, VA 22203 P 202.559.0500 F 866.808.6585 www.hanoverresearch.com