Best Practices In Investor Presentations · 3 PRESENTATION BACKGROUND •Survey conducted to gain...
53
Best Practices In Investor Presentations
Transcript of Best Practices In Investor Presentations · 3 PRESENTATION BACKGROUND •Survey conducted to gain...
Best Practices
In Investor
Presentations

PRESENTERS
2
Yvette LokkerPresident and Chief Executive Officer
CIRI
Rebecca CorbinFounder and Managing Partner
Corbin Perception

3
PRESENTATION BACKGROUND
• Survey conducted to gain better understanding of IR and
investor alignment and disconnects
‒ “IR Survey” conducted by CIRI | n = 57, IR professionals
‒ “Investor Survey” conducted by Corbin | n = 271,
investment professionals globally (ongoing research)
• Research serves to affirm best practices and uncover high-
impact areas for further capturing investor/analyst
mindshare
• Selected examples of best-in-class slides on leading topics
of interest to the investment community provided

CIRI:
IR Membership
Survey
Findings

What are the most important communication channels for getting your story
heard?
IR SURVEY FINDINGS

6
Which of the following components do you include in your presentation?
IR SURVEY FINDINGS
Top 5
Bottom 5

7
*not financial guidance
For what timeframe do you provide
quantitative targets?*
IR SURVEY FINDINGS
What quantitative targets do you
provide?

8
What do you post to the IR section of your website?
IR SURVEY FINDINGS

9
How do you notify holders when a new presentation is posted to website?
IR SURVEY FINDINGS

10
IR SURVEY FINDINGS
80% feel the deck is
understandable
as a stand-
alone
document
without the
benefit of
commentary
6% incorporate
videos into
the deck
89% develop the
deck internally
with the
remainder
collaborating
with external
consultants

Corbin:
Research-
based Insights

Not for distribution 12
The Investor Deck Is One Of The Most Important Sources Of Information
LEADING SOURCES OF INFORMATION
Investors rank deck
as important as
meeting with
management
91% indicate it is
THE leading driver to
the IR website

Not for distribution 13
Communicate The What, The How, The Why & Most Importantly….The “So What”
MOST IMPORTANT ELEMENTS IN THE INVESTOR DECK
Not for distribution 14
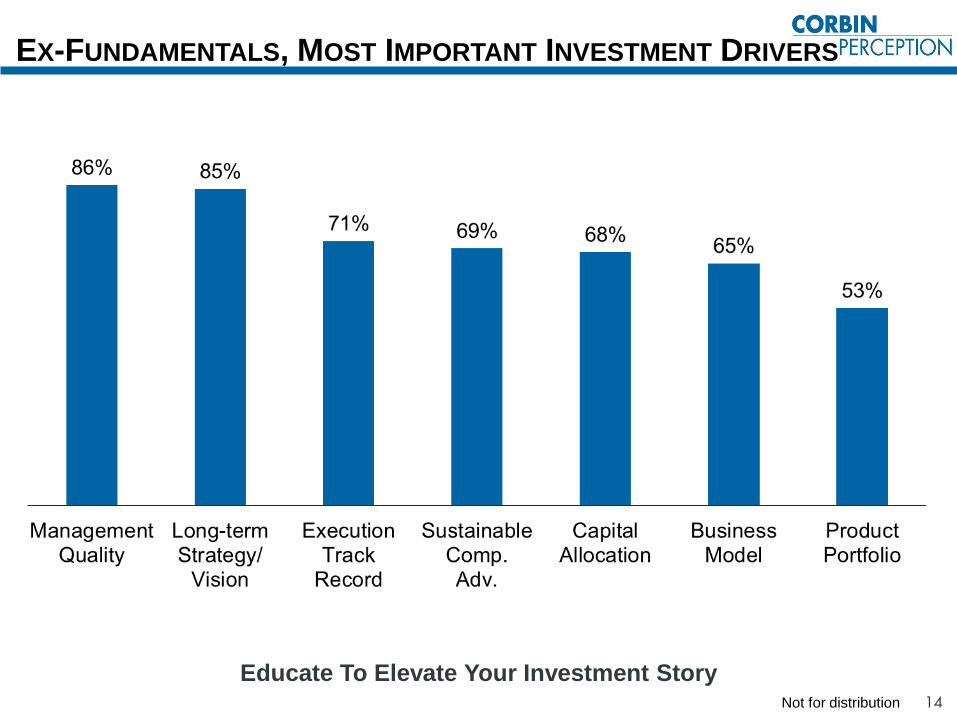
Educate To Elevate Your Investment Story
EX-FUNDAMENTALS, MOST IMPORTANT INVESTMENT DRIVERS

Strategy &
Growth
Initiatives

Not for distribution 16
DECK SHOULD HAVE A CLEARLY LABELED STRATEGY SLIDE

Not for distribution 17
CAN’T GET MUCH CLEARER THAN THIS

Not for distribution 18
PROVIDE HIGH LEVEL GOALS AND CLEAR INITIATIVES

Not for distribution 19
GREAT EXAMPLE: TRANSFORMATION & OUTCOME

Sustainable
Competitive
Differentiators

Not for distribution 21
Operational Excellence/Leading Innovation Growing Focus For Investors
MOST IMPORTANT SUSTAINABLE COMPETITIVE ADVANTAGES

Not for distribution 22
VERY CLEAR ABOUT HOW THEY ARE DIFFERENTIATED
Specific
about
what they
do not do

Not for distribution 23
CLEARLY COMMUNICATES UNIQUE APPROACH

Not for distribution 24
HIGHLIGHTS COMPETITIVE ADVANTAGES AND FOCUS
Not for distribution 25
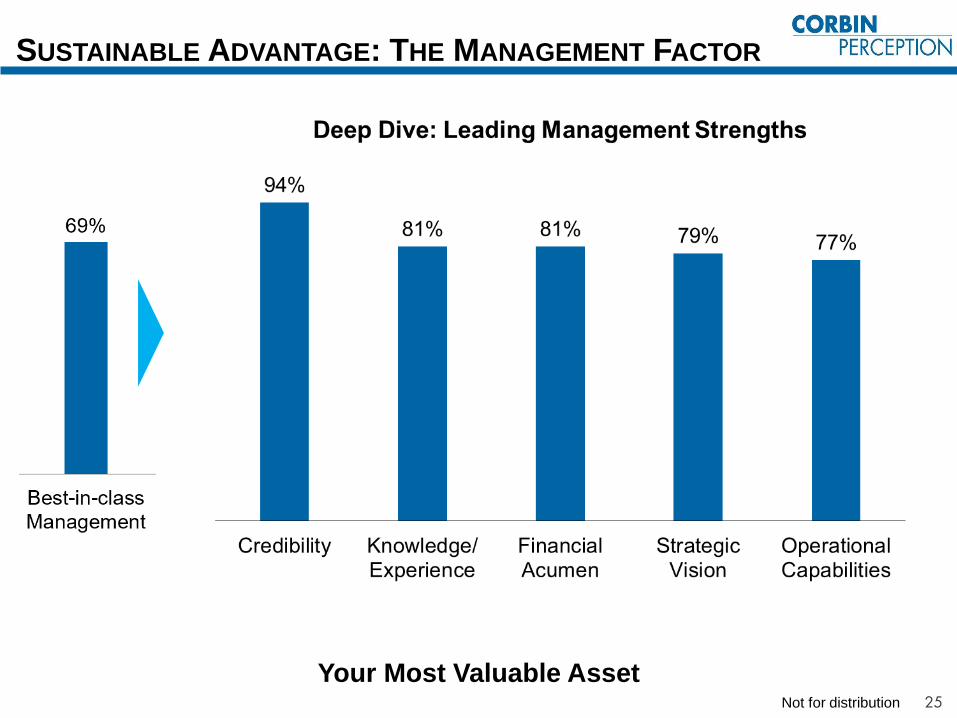
Your Most Valuable Asset
SUSTAINABLE ADVANTAGE: THE MANAGEMENT FACTOR

Not for distribution 26
CREDIBILITY-BUILDING COMMUNICATION
Don’t
See
This
Every
Day!

Not for distribution 27
A Best-in-Class Trait That Is Generally Not Well Articulated By Companies
An analysis of companies thateffectively position operational
excellence reveals:
• Business system is defined
and tangible objectives
provided
• Positioned as a sustainable
competitive differentiator
and core competency; it often
defines the culture
• Financial impact is tied to
business system
SUSTAINABLE ADVANTAGE: OPERATIONAL EXCELLENCE
PROOF POINTS
Improved working capital
turns
FCF generation, conversion
Margin outperformance
Ability to pass on cost
Top-line, organic growth
Superior M&A integration
Market share gains
Customer experience
Leadership/employee
engagement
Shareholder value delivery,
leading TSR

Not for distribution 28
FROM EXECUTING ON OPERATIONAL INITIATIVES…

Not for distribution 29
…TO CULTIVATING A CULTURE OF OUTPERFORMANCE

Not for distribution 30
CONTINUOUS IMPROVEMENT IS THE CULTURE…

Not for distribution 31
…ALWAYS EVOLVING TO DRIVE INDUSTRY-LEADING RESULTS
The next
BIG ENABLER

Not for distribution 32
ILLUSTRATING THE BUSINESS SYSTEM IMPACT

Not for distribution 33
Must Link Innovation To Financial Impact
SUSTAINABLE ADVANTAGES: LEADING INNOVATION

Not for distribution 34
INITIATIVES DRIVING ORGANIC GROWTH? CHECK!

Not for distribution 35
AND EVEN MORE POWERFUL EVIDENCE OF REINVESTMENT!

Capital
Deployment
And M&A As
Differentiators

Not for distribution 37
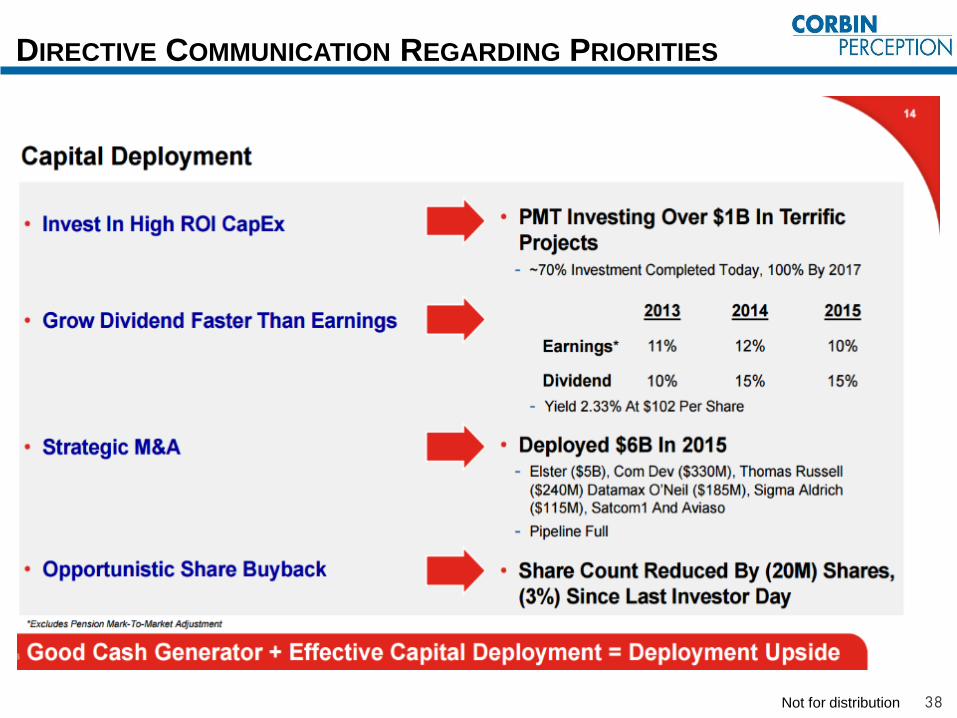
CAPITAL DEPLOYMENT: BEST IN CLASS ANALYSIS1
The Benefit of Transparency
• Investors appreciate details
• Increases management
credibility by enhancing
information flow with metrics
largely under management’s
control
• Demonstrates execution
track record
• Proactively addresses issues
that would otherwise create
an opening for “financial
investors” or activists
Disclosure In Action
• 72% | “Disciplined” acquisitions
• 68% | “Opportunistic” share repurchase
• 56% | “High ROI” capital expenditures
• 56% | Dividend growth
• 28% | Internal R&D
• 28% | Investment grade balance sheet
1Based on internal research on 50 of companies and selection of 25 that detailed capital allocation
Not for distribution 38
DIRECTIVE COMMUNICATION REGARDING PRIORITIES

Not for distribution 39
SPECIFIC GOALS DRIVING AT GROWTH

Not for distribution 40
SHOWCASES ALLOCATION OVER THE YEARS

Not for distribution 41
M&A: BEST IN CLASS ANALYSIS1
• Deployment of best
practices
• Cost synergies
• Sales synergies
• Leverage distribution
channel
• Leverage supply base
50% address benefits
Communicated Rationale
• 68% | Strategic fit: “Within the realm
of what we do”
• 55% | Technologies, products and
services
• 36% | Adjacent Markets
• 18% | “Good” industries
• 18% | Hold leading market share
• 14% | Where scale would add value
• 9% | Geographic expansion
1Based on internal research on 50 of companies and selection of 22 detailed M&A expectations

Not for distribution 42
M&A: BEST IN CLASS ANALYSIS1
1Based on internal research on 50 of companies and selection of 22 detailed M&A expectations
Communicated Metrics
• 41% |Accretive in Year One on:
‒ EPS
‒ EBITDA
‒ ROIC
• 18% | IRR > WACC
• 18% |Double-digit ROI
• 9% |At corporate OM or better
• Number of acquisitions over a
period(s)
• Amount allocated toward
acquisitions over a period(s)
and tied to sales growth
41% highlight track record

Not for distribution 43
REINFORCING M&A AS A STRENGTH

Not for distribution 44
COVERS ALL BASES AND THEN SOME

Not for distribution 45
TELLS THE M&A HISTORY AND A STORY

Not for distribution 46
M&A PROOF POINTS + ANOTHER EXAMPLE OF CREDIBILITY

Not for distribution
A RECOGNIZED COMPETITIVE ADVANTAGE FOR THIS COMPANY
47

Long-term Targets & Guidance

Not for distribution 49
Encourages Investors To Focus On Where You Are Going
LONG-TERM METRICS MOST IMPORTANT TO INVESTORS
58% prefer
3-year targets

Not for distribution 50
3-YEAR TARGETS, BOTH QUANTITATIVE AND QUALITATIVE

Not for distribution 51
4-YEAR TARGETS

Not for distribution 52
2020 TARGETS AND THE PATH TO ACHIEVE

Not for distribution 53
FINAL THOUGHTS: INVESTOR DECK BEST PRACTICES
Ensure one-click
access on IR
website
Some Pictures Are
Worth 1,000 Words
BUT Content Is
King
Content should be
robust enough so that
investor can follow
without the benefit of
speaker’s commentary
Send a proactive email
when important
updates are made;
point out whether they
are material or not
53% of investors report
update email prompts review
(almost immediately) – send
updates!