Best Practices in a Clinical Development Project ...
57
Dominican Scholar Dominican Scholar Graduate Master's Theses, Capstones, and Culminating Projects Student Scholarship 8-2018 Best Practices in a Clinical Development Project Management Best Practices in a Clinical Development Project Management Office (PMO) to Achieve a Reference Standard in the Office (PMO) to Achieve a Reference Standard in the Pharmaceutical Industry Pharmaceutical Industry Russell Guinto Dominican University of California https://doi.org/10.33015/dominican.edu/2018.bio.09 Survey: Let us know how this paper benefits you. Recommended Citation Guinto, Russell, "Best Practices in a Clinical Development Project Management Office (PMO) to Achieve a Reference Standard in the Pharmaceutical Industry" (2018). Graduate Master's Theses, Capstones, and Culminating Projects. 354. https://doi.org/10.33015/dominican.edu/2018.bio.09 This Master's Thesis is brought to you for free and open access by the Student Scholarship at Dominican Scholar. It has been accepted for inclusion in Graduate Master's Theses, Capstones, and Culminating Projects by an authorized administrator of Dominican Scholar. For more information, please contact [email protected].
Transcript of Best Practices in a Clinical Development Project ...

Dominican Scholar Dominican Scholar
Graduate Master's Theses, Capstones, and Culminating Projects Student Scholarship
8-2018
Best Practices in a Clinical Development Project Management Best Practices in a Clinical Development Project Management
Office (PMO) to Achieve a Reference Standard in the Office (PMO) to Achieve a Reference Standard in the
Pharmaceutical Industry Pharmaceutical Industry
Russell Guinto Dominican University of California
https://doi.org/10.33015/dominican.edu/2018.bio.09
Survey: Let us know how this paper benefits you.
Recommended Citation Guinto, Russell, "Best Practices in a Clinical Development Project Management Office (PMO) to Achieve a Reference Standard in the Pharmaceutical Industry" (2018). Graduate Master's Theses, Capstones, and Culminating Projects. 354. https://doi.org/10.33015/dominican.edu/2018.bio.09
This Master's Thesis is brought to you for free and open access by the Student Scholarship at Dominican Scholar. It has been accepted for inclusion in Graduate Master's Theses, Capstones, and Culminating Projects by an authorized administrator of Dominican Scholar. For more information, please contact [email protected].
i
Best Practices in a clinical development Project Management Office (PMO) to
achieve a reference standard in the pharmaceutical industry
By
Russell Guinto
A culminating thesis submitted to the faculty of Dominican University of California in
partial fulfillment of the requirements for the degree Master of Science in Biology
San Rafael, California
July, 2018
ii
This thesis, written under the direction of candidate’s thesis advisor and approved by the
thesis committee and the MS Biology program director, has been presented and
accepted by the Department of Natural Sciences and Mathematics in partial fulfillment of
the requirements for the degree of Master of Science in Biology at Dominican University
of California. The written content presented in this work represent the work of the
candidate alone.
Russell Guinto
Candidate 08/10/2018
Kathryn Davidson, MA, MS
Thesis Advisor 08/10/2018
Maggie Louie, PhD
Second Reader 08/10/2018
Meredith Protas, PhD
Graduate Program Director 08/20/2018

iii
Copyright © 2018, by Russell Guinto
All rights reserved
iv
Overview/Abstract
Medications are developed by the pharmaceutical industry starting with the discovery
phase, proceeds to preclinical trials, moves into clinical trials (progressing from Phase I
to Phase III), and if the data are positive, may lead to Food and Drug Administration
(FDA) approval. Once approved, post-marketing surveillance for safety is required as
long as the drug is marketed to consumers. This phase may also include clinical trial
Phase IV studies if additional safety testing is required. This process usually takes
between ten to fifteen years, with clinical development taking seven to ten years of that
time (1). Clinical development can be facilitated by a clinical development Project
Management Office (PMO) at pharmaceutical companies. Clinical development PMOs
provide value by establishing processes that can be universally adopted by the
pharmaceutical industry. This can help simplify product development, and as a result,
accelerate time to market. Clinical development project management is a relatively new
field in the pharmaceutical industry, and there are few publications and literary reviews
regarding standardized best practices, current best practices, and potential best
practices for clinical development.
Decreasing the time it takes a drug to reach market can help patients live longer and/or
improve their quality of life. Time to market is often driven by the time it takes to test the
product in clinical settings. This thesis is focused on analyzing the clinical development
project management practices in order to reduce the time to market. The goals of this
project were to identify best practices in clinical development project management,
compile a reference standard, develop a rubric, evaluate the rubric on a comparator
company, and make a recommendation regarding actions required for the comparator
company to achieve the reference standard.

v
Acknowledgements
Writing a thesis turned out to be more complicated than I had imagined, and it took the
combination of time and effort from many people to help through the process.
I would like to thank Kathryn E. Davidson, Senior Director at BioMarin Pharmaceutical
Inc., for the collaboration and synthesis of this thesis. Dr. Maggie Louie, from Dominican
University who served as my second reader, and for introducing me to this wonderful
program and cheering me on throughout the process. David Cornpropst, Executive
Director at BioMarin Pharmaceutical Inc., for providing tremendous assistance throughout
the entire project. Finally, to the Global Project Management team, many thanks to all of
you.
I would like to also thank the project management professionals that helped with the
methodologies and techniques described in this thesis. I am very grateful for their time
and assistance.
Finally, to my family and fiancée Christa, for their help, guidance, and patience through
this program these past two years. To my children Solee and Noah, you have made me
stronger, better, and more fulfilled than I could have ever imagined. I love you to infinity
and beyond.
Many thanks to all who have helped in this endeavor. It truly was a collaborative effort.
vi
Table of Contents
Overview/Abstract ................................................................................................ iv
Acknowledgements .............................................................................................. v
Table of Contents ................................................................................................. vi List of Tables ...................................................................................................... viii List of Figures ....................................................................................................... ix
List of Abbreviations ............................................................................................. x
1. Introduction .................................................................................................... 1
1.1 Drug Definition ......................................................................................... 1
1.2 FDA Drug Approval Process ................................................................... 3
1.3 Time to Market ........................................................................................ 5
1.4 Project Management Role in Pharma ...................................................... 7
2 Objectives and Strategy ................................................................................. 7
3 Research Design and Methods ...................................................................... 8
3.1 Study Design ........................................................................................... 8
3.2 Phase I: Reference Standard and Rubric Development .......................... 8
3.2.1 Questionnaire Development ............................................................. 8
3.2.2 Sample Group ................................................................................... 8
3.2.3 Company Metrics .............................................................................. 9
3.2.4 Data Collection.................................................................................. 9
3.2.5 Data Cleaning ................................................................................. 10
3.2.6 Data Analysis .................................................................................. 11
3.2.7 Reference Standard and Rubric Development ............................... 12
3.3 Phase II: Rubric Evaluation and Comparator Company Recommendations .......................................................................................... 12
3.3.1 Questionnaire Development ........................................................... 12
3.3.2 Sample Group ................................................................................. 13
3.3.3 Data Collection................................................................................ 13
3.3.4 Data Analysis .................................................................................. 13
4 Results ......................................................................................................... 13
4.1 Phase I: Reference Standard and Rubric Development ........................ 13
4.1.1 Response Results ........................................................................... 13
4.1.2 Company Metrics ............................................................................ 14
4.1.3 Categorization Overview ................................................................. 17

vii
4.1.4 Reference Standard Definition ........................................................ 23
4.1.5 Reference Standard Rubric ............................................................ 23
4.2 Phase II: Rubric Evaluation and Comparator Company Recommendations .......................................................................................... 24
4.2.1 Response Results ........................................................................... 24
4.2.2 Data Analysis .................................................................................. 25
5 Discussion ................................................................................................... 26
5.1.1 Phase I: Reference Standard and Rubric Development ................. 26
5.1.2 Phase II: Rubric Evaluation and Comparator Company Recommendations ....................................................................................... 28
5.1.3 Limitations and Future Research .................................................... 29
6 Conclusion ................................................................................................... 30
7 References .................................................................................................. 31
8 Appendix ...................................................................................................... 33
8.1 Reference Standard Classification Scheme .......................................... 33
8.2 Interview Questions ............................................................................... 33
8.2.1 Study Design .................................................................................. 33
8.2.2 Phase I ............................................................................................ 33
8.2.3 Phase II ........................................................................................... 34
8.3 Reference Standard and Rubric Development ...................................... 37
8.3.1 Reference Standard ........................................................................ 37
8.3.2 Rubric Development ....................................................................... 40
9 Supplementary Figures and Tables ............................................................. 43

viii
List of Tables
Table 1: Average time from discovery to market .................................................. 5
Table 2: 2014 Fastest drug developers ................................................................ 6
Table 3: Company size classification .................................................................... 9
Table 4: Participant pool, respondents, and overall percent per platform ........... 14
Table 5: Number of responses by company ....................................................... 14
Table 6: Company metrics of respondents ......................................................... 16
Table 7: Categorization overview (alphabetical) ................................................. 19
Table 8: Statistical analysis of top level category distribution by company size.. 21
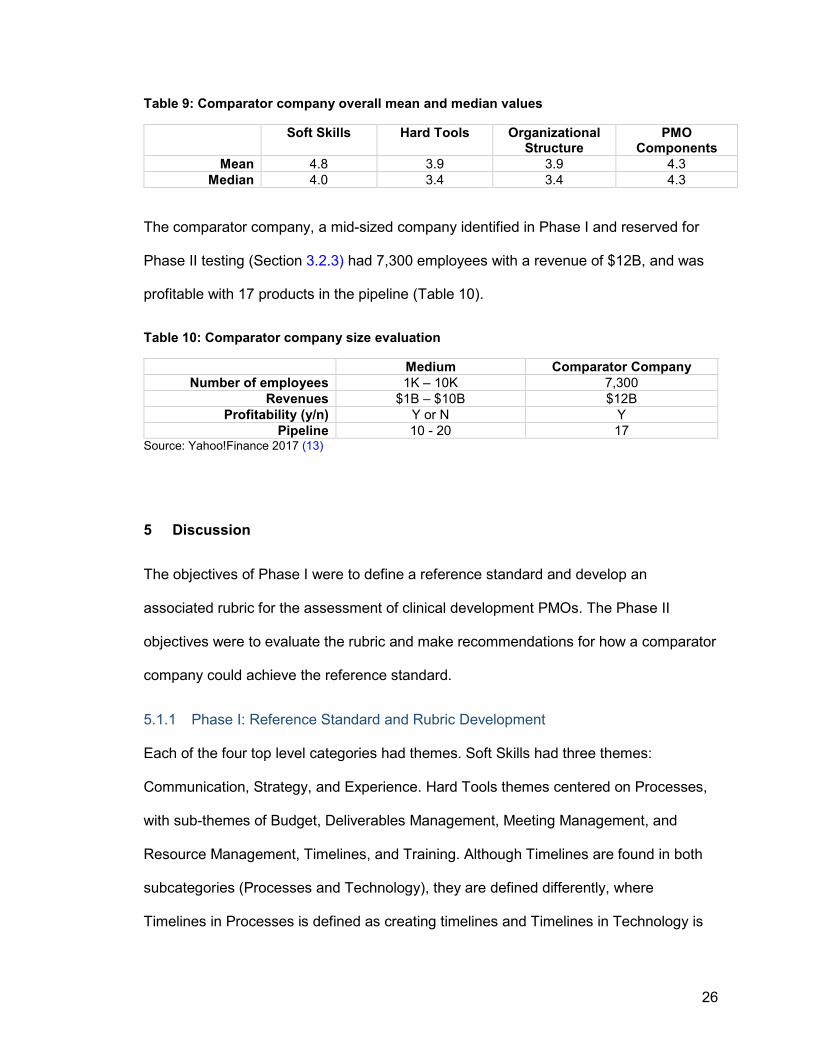
Table 9: Comparator company overall mean and median values ....................... 26
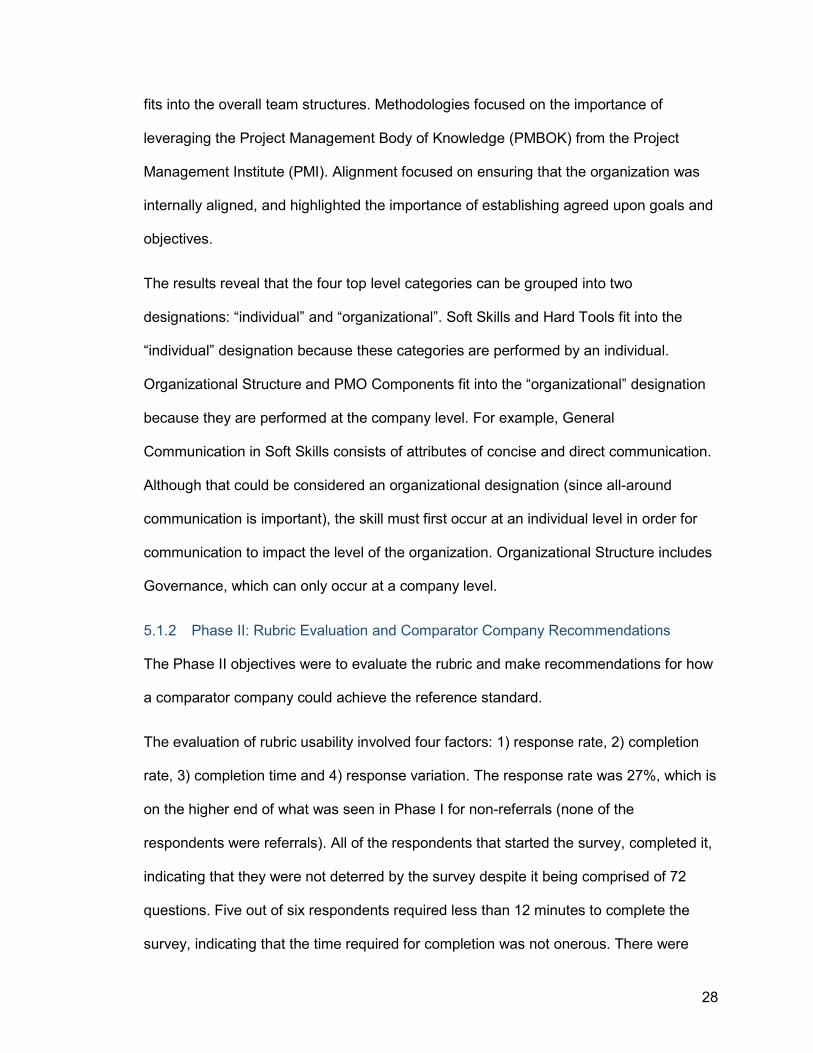
Table 10: Comparator company size evaluation................................................. 26
Table 11: Soft Skills Terms ................................................................................. 37
Table 12: Hard Tools Terms ............................................................................... 38
Table 13: Organizational Structure Terms .......................................................... 39
Table 14: PMO Components Terms ................................................................... 39
Table 15: Soft Skills Attributes ............................................................................ 40
Table 16: Hard Tools Attributes .......................................................................... 41
Table 17: Organizational Structure Attributes ..................................................... 42
Table 18: PMO Components Attributes .............................................................. 42
Table 19: Term count by company identifier and top level category ................... 43
ix
List of Figures
Figure 1: Drug development lifecycle ................................................................... 7
Figure 2: Data collection through reference standard development ................... 10
Figure 3: Data cleaning and analysis process .................................................... 11
Figure 4: Top level category distribution overall and by company size ............... 20
Figure 5: Sub-category distribution by top level category overall........................ 22
Figure 6a-d: Phase I term counts and reference standard definition cut-off ....... 44
Figure 7a-d: Phase II survey results (raw data) .................................................. 45
Figure 8a-d: Phase II survey results (mean) and evaluation cut-off.................... 46

x
List of Abbreviations
Acronym Word/Phrase
FDA Food and Drug Administration
FDCA Federal Food, Drug, and Cosmetic Act
FTE Full Time Employee
IND Investigational New Drug
IT Information Technology
JIT Just In Time
NDA New Drug Application
OTC Over-the-Counter
PM Project Management
PMBOK Project Management Body of Knowledge
PMI Project Management Institute
PMO Project Management Office
PPM Program and Portfolio Management
REMS Risk Evaluation and Mitigation Strategy
US United States
WHO World Health Organization
1
1. Introduction
The beginning of the regulation of the pharmaceutical industry can be traced back to
1938 when Congress passed the Federal Food, Drug, and Cosmetic Act (FDCA) law.
The external landscape of the pharmaceutical industry and drug regulations have made
big strides in the past 50-100 years due to various tragedies of the time. This included
one of the first mass-deaths reported of over 100 patients due to a sulfanilamide
medication used to treat streptococcal infections. The revised formulation used
diethylene glycol (antifreeze) to dissolve the drug. This forced legislation to initially
regulate safety (2). Regulations later followed regarding drug quality and efficacy. In
order to bring a product to market, companies must first seek approval for testing in
clinical trials (supported by scientific data), and if the results indicate a therapeutic
benefit that outweighs any associated risks, then the company may seek approval to
market the product.
1.1 Drug Definition
The term pharmaceutical products refers to medicines or drugs. According to the World
Health Organization (WHO), it is important that prescribed products are of good quality,
safe, effective and prescribed and used rationally (3). The Food and Drug Administration
(FDA) defines drugs as any product that is intended to affect body structure or function
for the purpose of diagnosis, treatment or prevention of disease (4).
Pharmaceutical products can be classified as small molecules (chemical compounds),
generics (non-branded version of a small molecule), biologics (produced by or part of a
living organism) or biosimilars (non-branded version of an existing biologic). These
products may also be available either as prescription only or over-the-counter (OTC),
and may vary in the formulation (e.g., liquid or tablet) and routes of administration (e.g.,

2
oral, nasal, or transdermal). Regardless of the classification or formulation, the approval
process by the FDA is the same.
The development of small molecule drugs for treating and preventing disease played an
important role in the practice of medicine. The history of small molecules spans
thousands of years with the use of naturally occurring extracts for medicinal purposes
(e.g., aspirin), to present day de novo synthetic organic molecules for drug development
(e.g., statins). This has contributed to the improvement of health and increased life
expectancy (5).
Generic drugs emerged in the United States in 1984 with the Drug Price Competition
and Patent Term Restoration Act, also known as the Hatch-Waxman Act, which changed
the pharmaceutical field by making it easier for generic drugs to enter the market (6).
The FDA states that a generic drug product must be comparable to the reference drug in
terms of strength, performance, safety, quality, method of administration, and dosage
form. It is essential that the generic drug have the same intended use as the reference
drug (7).
The regulation of biological products began with the Biologics Control Act of 1902.
Unlike traditional chemical manufacturing of drugs, biological products are isolated from
living organisms. Biological products include vaccines, blood derivatives, and gene
therapy products amongst others. Biologics are used in the treatment of cancer and
other diseases (8). The most recent development is biosimilars, which are developed
from living cells through highly complex manufacturing processes, but “similar” to
another biologic already approved by the FDA. An example of a biosimilar is Zarxio
(Filgrastim-sndz) (9) which was FDA approved in 2015 and is analogous to Neupogen
3
(Filgrastim). Both drugs are prescribed to cancer patients following chemotherapy to
help decrease the risk of developing neutropenia.
1.2 FDA Drug Approval Process
FDA ensures that the drugs on market, whether brand name or generic, are safe and
effective, and that the health benefits outweigh the risks. The process begins at the
discovery phase, proceeds to preclinical trials, moves into clinical trials (progressing
from Phase I to Phase III), and if the data are positive, may lead to FDA approval. The
life cycle management stage includes post-marketing surveillance for safety as long as
the drug is marketed to consumers. Post-marketing may also include clinical trial Phase
IV studies if additional safety testing is required. The discovery phase involves
investigation of thousands of compounds as potential drug candidates. Once a
promising compound is found, experiments are conducted to gather initial information on
a number of factors, such as how it is metabolized, the potential benefits, dosage,
administration, side effects, other drug interactions and effectiveness. Following
discovery, further information on these factors are gathered through preclinical trials,
which involve both in vitro and in vivo animal research to evaluate the new drug’s safety
(e.g., toxicity) and efficacy. Following the data obtained from these tests, an
Investigational New Drug (IND) application is submitted to the FDA that includes
information on the drug composition, manufacturing, and clinical trial plan. The FDA
reviews the IND to verify that the proposed studies, known as clinical trials, focus to
ensure clinical trial subject safety. The FDA also verifies that there is informed consent
and that human subject protections are in place prior to initiation of clinical trials. If the
FDA feels that these criteria are met, the drug under investigation then moves to the
clinical stage where the drug sponsor’s clinical trials are divided into Phases I, II, and III.
In clinical trial Phase I, the focus is evaluating the safety of the drug, and traditionally

4
involves approximately 20-80 healthy volunteers with the goal of the identifying the
drug’s side effects, and evaluating how the drug is absorbed, distributed, metabolized
and excreted from the body. If the data captured in clinical trial Phase I are positive, the
drug transitions into clinical trial Phase II, where traditionally the number of subjects
increases into the hundreds. The focus of clinical trial Phase II is learning more about
the safety of the drug, including the maximum tolerated dose, and looking for initial
efficacy signs in people who have the particular condition or disease. At the conclusion
of clinical trial Phase II, assuming the data are positive, the FDA and drug sponsors
discuss how the clinical trial Phase III studies will be designed and completed. In clinical
trial Phase III, the patient numbers traditionally move into the thousands and the primary
focus is to evaluate efficacy, along with continual assessment of safety. Following this
phase, a meeting between the FDA and drug sponsor occurs before the submission of a
New Drug Application (NDA). The NDA filing is requested by the drug sponsor to gain
approval from the FDA to market the drug in the United States, supported by all the data
gathered to date as outlined above. Following the receipt of the NDA, the FDA has 60
days to evaluate whether the applicant has provided the information required for FDA
review. If sufficiently complete, the FDA review team evaluates the sponsor’s data on
drug safety and effectiveness. As part of the review process, the FDA will inspect the
manufacturing facility(ies) and a subset of the clinical and nonclinical testing sites. If the
FDA doesn’t evaluate the drug’s benefits outweigh the risks, they will issue a “Complete
Response Letter”, which means that product cannot be sold in the US. The company
can then choose to conduct further testing or not pursue the product at all. If the FDA
deems that the benefits outweigh the risks, the FDA will negotiate the exact drug label
with the sponsor to ensure important information is communicated to health care
professionals and patients, and officially approve the product. As it is not possible to
predict what happens after the drug is on the market, post-market surveillance of safety
5
is required. Further studies (clinical trial Phase IV) may also be required to also evaluate
specific safety questions. The drug sponsor is also required to submit periodic safety
updates to the FDA throughout the drug’s marketed life. In addition to sponsor safety
reporting requirements, the FDA also provides a mechanism for physicians and patients
to voluntarily report adverse events. Should post-marketing safety analysis identify new
safety risks, product availability can be restricted (e.g., through a restricted access
program, also known as Risk Evaluation and Mitigation Strategy or REMS) or in rarer
cases, the drug can be withdrawn from the market.
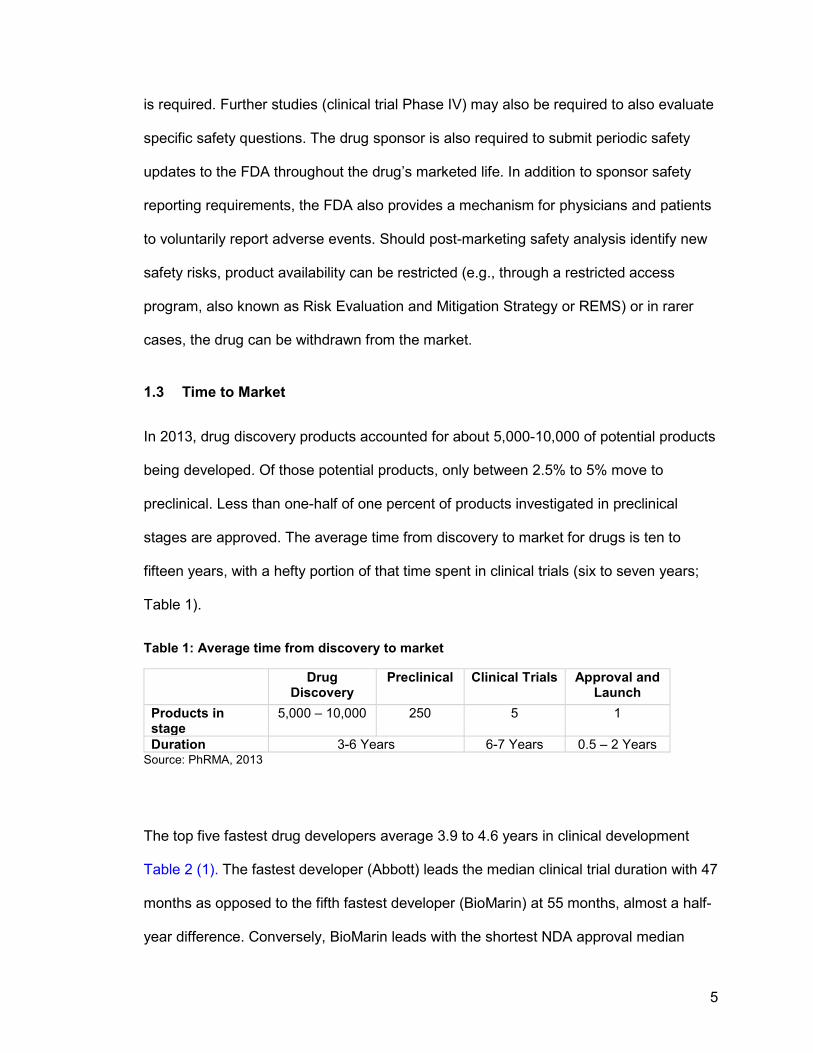
1.3 Time to Market
In 2013, drug discovery products accounted for about 5,000-10,000 of potential products
being developed. Of those potential products, only between 2.5% to 5% move to
preclinical. Less than one-half of one percent of products investigated in preclinical
stages are approved. The average time from discovery to market for drugs is ten to
fifteen years, with a hefty portion of that time spent in clinical trials (six to seven years;
Table 1).
Table 1: Average time from discovery to market
Drug Discovery
Preclinical Clinical Trials Approval and Launch
Products in stage
5,000 – 10,000 250 5 1
Duration 3-6 Years 6-7 Years 0.5 – 2 Years Source: PhRMA, 2013
The top five fastest drug developers average 3.9 to 4.6 years in clinical development
Table 2 (1). The fastest developer (Abbott) leads the median clinical trial duration with 47
months as opposed to the fifth fastest developer (BioMarin) at 55 months, almost a half-
year difference. Conversely, BioMarin leads with the shortest NDA approval median

6
duration (6 months), which is due to shorter review times for orphan drugs in comparison
to other drugs.
Table 2: 2014 Fastest drug developers
Median clinical duration (in months)
Median NDA approval duration (in months)
Total median duration (in months)
Janssen (J&J)
47 10 57
Abbott 47 9 56 Sanofi 51 13 64 Shire 55 19 73 BioMarin 55 6 61
Source: CenterWatch, 2013
Pharmaceutical companies face challenges through the lengthy drug development
process (Figure 1). Not only is a pharmaceutical company looking to deliver a product
quicker, they are often competing in a race against other companies to be the first in the
market. This requires efficiency throughout the organization. The complex product
development process from molecule to product involves the management of many
business processes such as manufacturing, regulatory strategy, and clinical
development.
The analysis of best practices in pharmaceutical industry, specifically in clinical
development, where the most time is spent, will help identify standard practices for
efficient drug development.
7
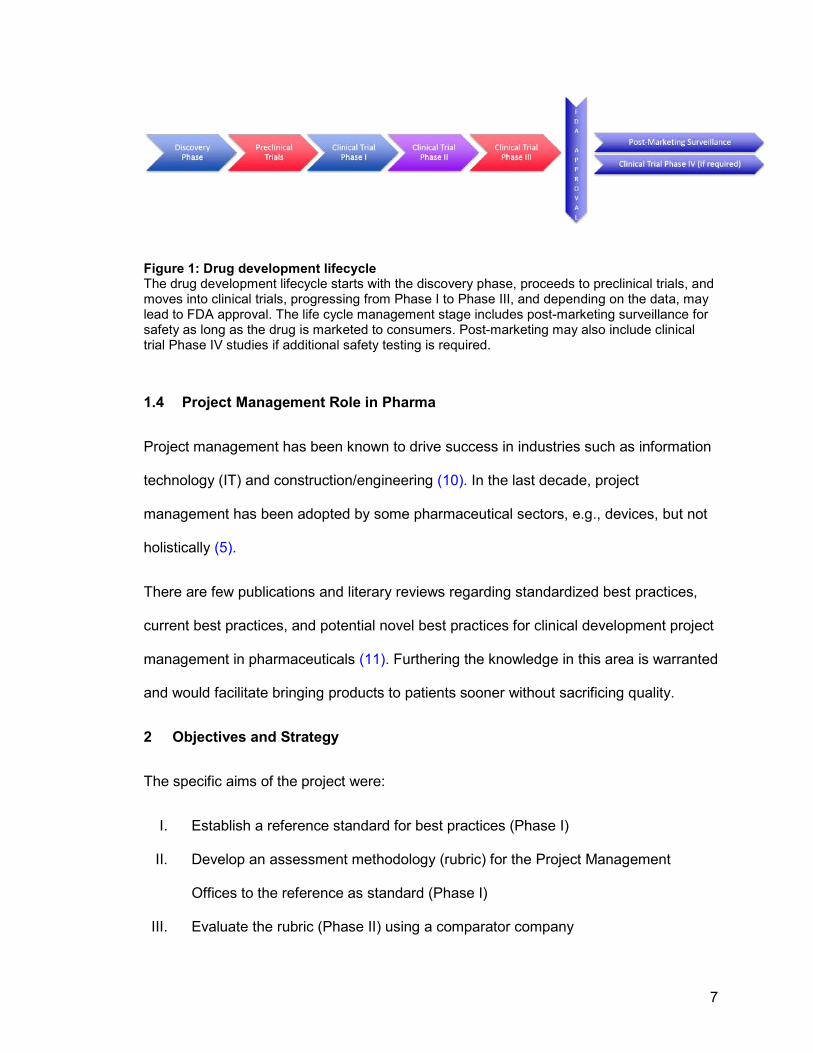
Figure 1: Drug development lifecycle The drug development lifecycle starts with the discovery phase, proceeds to preclinical trials, and moves into clinical trials, progressing from Phase I to Phase III, and depending on the data, may lead to FDA approval. The life cycle management stage includes post-marketing surveillance for safety as long as the drug is marketed to consumers. Post-marketing may also include clinical trial Phase IV studies if additional safety testing is required.
1.4 Project Management Role in Pharma
Project management has been known to drive success in industries such as information
technology (IT) and construction/engineering (10). In the last decade, project
management has been adopted by some pharmaceutical sectors, e.g., devices, but not
holistically (5).
There are few publications and literary reviews regarding standardized best practices,
current best practices, and potential novel best practices for clinical development project
management in pharmaceuticals (11). Furthering the knowledge in this area is warranted
and would facilitate bringing products to patients sooner without sacrificing quality.
2 Objectives and Strategy
The specific aims of the project were:
I. Establish a reference standard for best practices (Phase I)
II. Develop an assessment methodology (rubric) for the Project Management
Offices to the reference as standard (Phase I)
III. Evaluate the rubric (Phase II) using a comparator company

8
IV. Make recommendations for how the comparator company could achieve the
reference standard (Phase II)
This research study involved a three-fold approach: study design, qualitative exploratory
research (Phase I), and quantitative confirmatory research (Phase II).
3 Research Design and Methods
3.1 Study Design
The study design involved two phases. Phase I was qualitative and designed to define a
reference standard and develop a rubric for the assessment of clinical development
project management offices (PMOs). Phase II was quantitative and designed to perform
an initial assessment of ability of the rubric to assess a comparator company’s
conformance with the reference standard.
3.2 Phase I: Reference Standard and Rubric Development
3.2.1 Questionnaire Development
Phase I began with the development of a pilot questionnaire with six, open-ended
questions. It was tested on 10 people from Company “A” and revised for a final set of 14
open-ended questions. The final questionnaire can be found in Section 8.2.2.
3.2.2 Sample Group
Following the development of the questionnaire, a sample group of respondents were
identified from three sources: 1) LinkedIn (Sunnyvale, CA) using the search term “project
management” 2) personal network referrals through the last question of the survey (“Do
you have any network contacts you can share in assisting with this research?”), and
3) Program and Portfolio Management (PPM) (New York, NY) Conference messaging
platform Bizzabo.
9
3.2.3 Company Metrics
The companies for which the sample respondents were employed were evaluated on
four metrics to establish cutoffs for company size: 1) number of full-time employees,
2) revenue (US$), 3) profitability, and 4) drug pipeline (count). The number of
employees needed to qualify as a large company was defined as >10,000, medium as
1,000-9,999, and small as <1,000. The revenue amount needed to qualify as a large
company was defined as >$10B, medium as $1B – $10B, and small as <$1B. The
profitability size designation for a large company was defined as “Yes”, for medium was
“Either” (meaning either Yes or No), and for small was “No”. The drug pipeline needed to
qualify as a large company was defined as >20, for medium as 10 – 20, and for a small
company as <10. Company size classification criteria are provided in Table 3.
Table 3: Company size classification
Large Medium Small Number of employees >10K 1K – 10K <1K Revenues >$10B $1B – $10B <$1B Profitability (y/n) Y ? N Drug Pipeline >20 10 - 20 <10
The companies were assigned a unique identifier because permission was not
requested to use their company name for this study. To further aid maintaining
anonymity, exact metrics obtained from Yahoo! Finance (New York, NY) were rounded.
The mid-sized company with the largest number of potential respondents (41 people)
was selected as the comparator company. Personnel at the comparator company were
not contacted in Phase 1, but reserved for Phase II of the study.
3.2.4 Data Collection
An introductory e-mail message was sent to the potential pool of respondents to provide
background regarding the interviewer and the desired outcome, as well as a request to
10
schedule a meeting to conduct the interview. One-hour interviews were conducted with
the respondents from March to May 2017. Data were captured during the interviews by
handwritten notes and post-meeting transcribed into a word processing document.
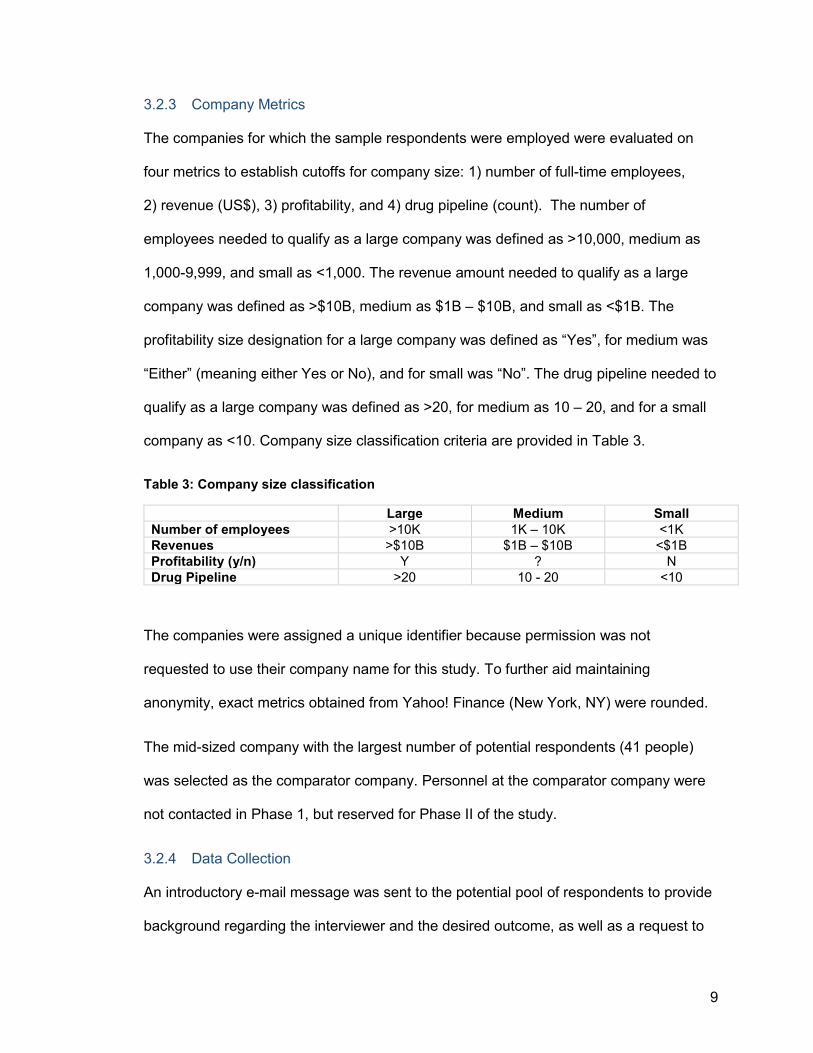
3.2.5 Data Cleaning
Raw data captured in the word processing document were converted to a spreadsheet
and subsequently cleaned by correcting spelling errors, spelling out abbreviations and
removing duplicate entries (deduplication). Following a consistency check for correct
project management context, high frequency words were identified by requiring that the
word or term must have occurred greater than 10 times in the raw data. False positives
(i.e., terms included in the results erroneously, such as “that” and “what” being returned
for the term “hat”) were removed (Figure 2 and Figure 3).
Figure 2: Data collection through reference standard development Funnel structure depicting the process for reference standard development, starting with total words from interview raw data being narrowed to high frequency words, and then classified into
11
categories and subcategories to develop the final reference standard definition (denoted by the red band).
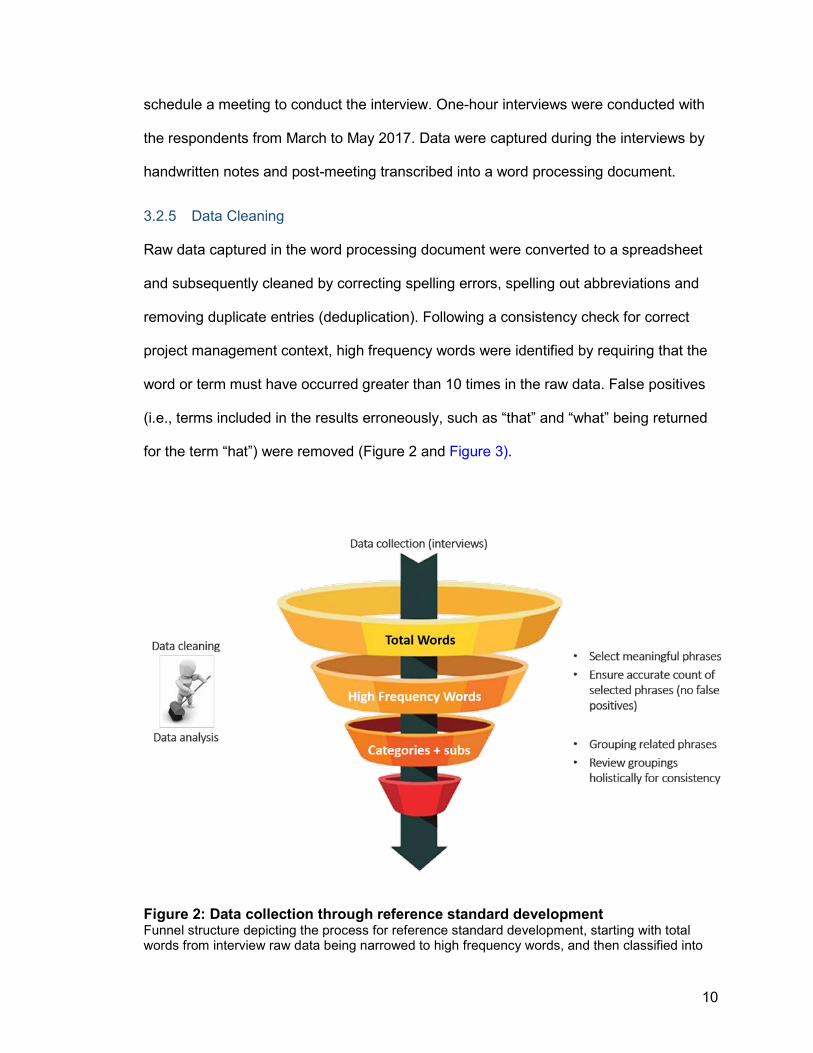
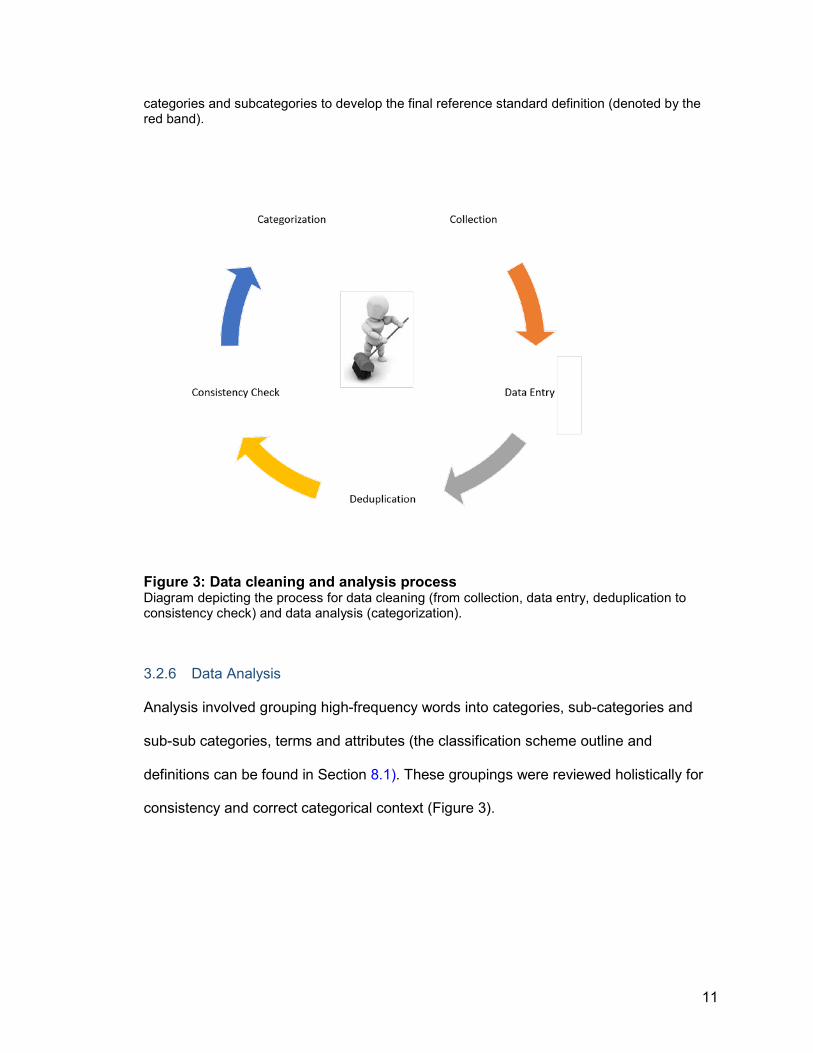
Figure 3: Data cleaning and analysis process Diagram depicting the process for data cleaning (from collection, data entry, deduplication to consistency check) and data analysis (categorization).
3.2.6 Data Analysis
Analysis involved grouping high-frequency words into categories, sub-categories and
sub-sub categories, terms and attributes (the classification scheme outline and
definitions can be found in Section 8.1). These groupings were reviewed holistically for
consistency and correct categorical context (Figure 3).
12
3.2.6.1 Statistical Analysis
To evaluate whether there was a difference in results based on company size, the data
analysis tool in Microsoft Excel 2013 (version 15.0, Redmond, WA) for an ANOVA: Two-
Factor without Replication statistical analysis was used.
3.2.7 Reference Standard and Rubric Development
The reference standard was developed by applying a cutoff to the high frequency words.
The numbers for the highest frequency word in each of the four top level categories were
totaled, then divided by four (for the number of categories), and subsequently divided by
four again to separate into quartiles, and then rounded to the nearest whole number.
This method was selected over the use of the absolute count of the term in order to filter
out terms that fell in the bottom quartile. The high frequency words meeting the cutoff
became the terms that comprised the reference standard.
The rubric was developed by creating actionable descriptions (i.e., attributes) of the
terms in the reference standard. The descriptions were taken from the Phase I
interviews.
3.3 Phase II: Rubric Evaluation and Comparator Company Recommendations
The Phase II objectives were to evaluate the rubric and make recommendations for how
a comparator company could achieve the reference standard.
3.3.1 Questionnaire Development
The rubric developed in Phase I was converted into a Likert scale questionnaire which
asked to what degree the respondent felt each attribute was being practiced at their
company on a five-point scale (Strongly Disagree [1], Disagree [2], Neither [3], Agree [4],
or Strongly Agree [5]).
13
3.3.2 Sample Group
During Phase I (Section 3.2.2), the mid-sized company with the largest potential pool of
respondents was reserved for Phase II. A mid-size company was thought to be a
suitable comparator company as it would incorporate elements of both large and small
companies.
3.3.3 Data Collection
A LinkedIn message was sent to the potential pool of respondents introducing the
objective of the study and a link to the questionnaire in SurveyMonkey® (San Mateo,
CA; Section 8.2.3). The message was sent and all responses were completed in
April 2018.
3.3.4 Data Analysis
An average company was defined as a company performing at its sizing class, which is
arbitrarily set with baselines that were neither too high nor low. To translate into a
measurable metric on the Likert scale 5-point scale, numeric results from each top level
cat average was totaled and >3.0 cutoff was set which is the mean of a 5-point scale.
The cut-off was also required to evaluate the comparator company after the survey was
conducted to set performance baselines for activities being/not being practiced.
4 Results
4.1 Phase I: Reference Standard and Rubric Development
The objectives of Phase I were to develop a reference standard and associated rubric
for the assessment of clinical development PMOs.
4.1.1 Response Results
A total potential pool of 127 respondents was identified from three sources: 1) LinkedIn
(n=79), 2) referrals (n=29), and 3) Project and Portfolio Management (PPM) conference
14
messaging platform Bizzabo (n=19). Of the 127 potential respondents contacted,
23 people expressed interest and received a copy of the final questionnaire comprised of
14 questions. Seventeen of 23 completed the questionnaire with two (3%) from LinkedIn,
eleven (38%) from referrals, and four (21%) from Bizzabo. The response rate was 12%,
65%, and 24% for LinkedIn, referrals, and Bizzabo, respectively. The overall response
rate was 13% (Table 4). This response rate was lower than what was previously
reported in a study where surveys of individuals had an average response rate of 53%,
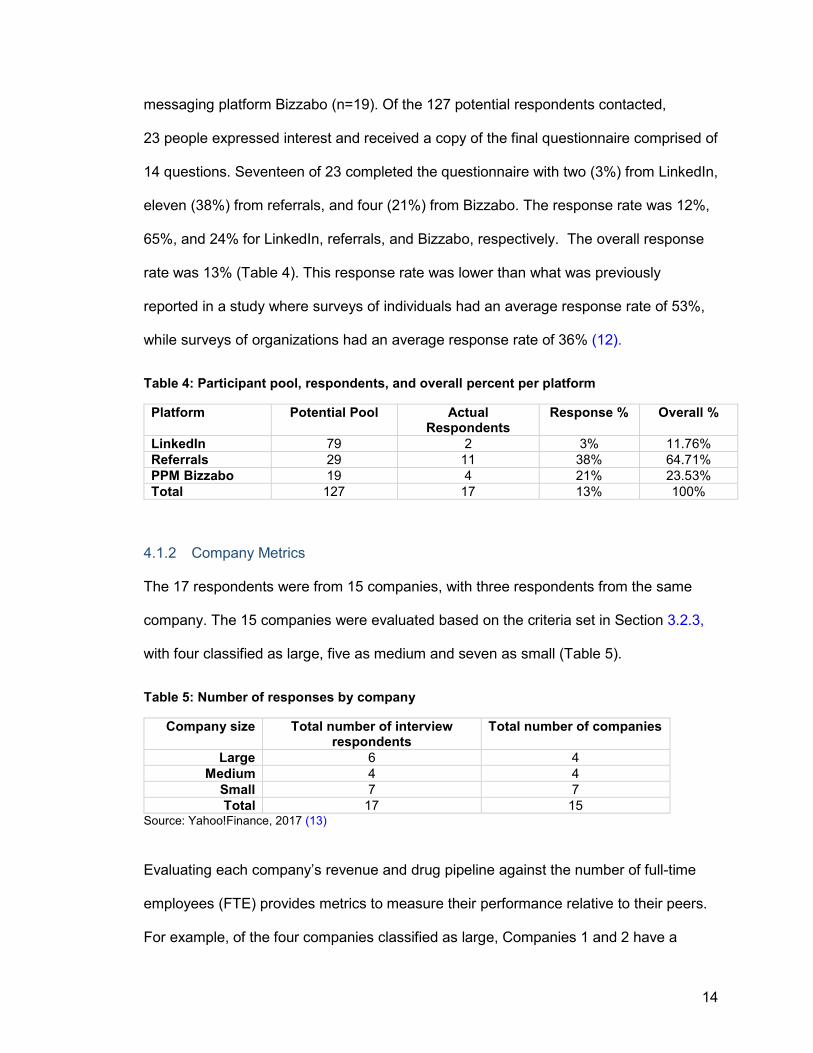
while surveys of organizations had an average response rate of 36% (12).
Table 4: Participant pool, respondents, and overall percent per platform
Platform Potential Pool Actual Respondents
Response % Overall %
LinkedIn 79 2 3% 11.76% Referrals 29 11 38% 64.71% PPM Bizzabo 19 4 21% 23.53% Total 127 17 13% 100%
4.1.2 Company Metrics
The 17 respondents were from 15 companies, with three respondents from the same
company. The 15 companies were evaluated based on the criteria set in Section 3.2.3,
with four classified as large, five as medium and seven as small (Table 5).
Table 5: Number of responses by company
Company size Total number of interview respondents
Total number of companies
Large 6 4 Medium 4 4
Small 7 7 Total 17 15
Source: Yahoo!Finance, 2017 (13)
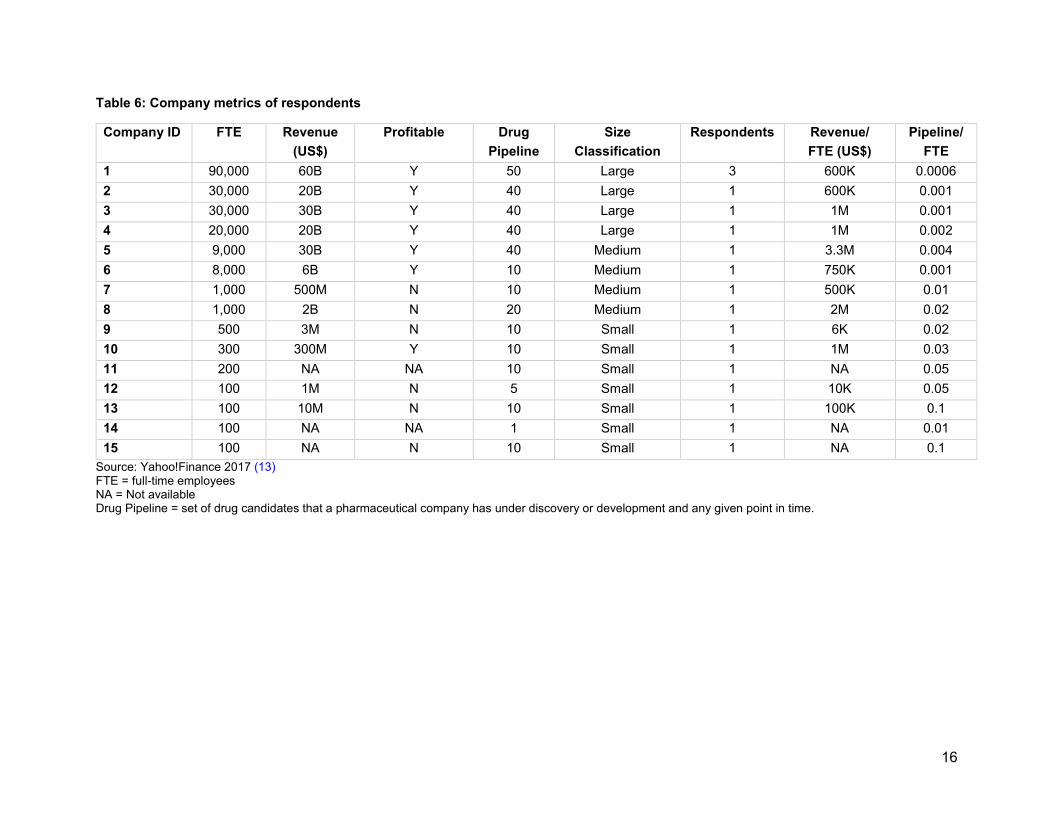
Evaluating each company’s revenue and drug pipeline against the number of full-time
employees (FTE) provides metrics to measure their performance relative to their peers.
For example, of the four companies classified as large, Companies 1 and 2 have a
15
revenue/FTE value of $600K each, while Companies 3 and 4 have a revenue/FTE value
of $1M each, implying that Companies 3 and 4 are performing better relative to
Companies 1 and 2. The pipeline/FTE ratio of Company 1 is 0.0006, for Companies 2
and 3 are 0.001, and for Company 4 is 0.002, implying that Company 4 is performing
better than the other three companies (Table 6).
16
Table 6: Company metrics of respondents
Company ID FTE Revenue (US$)
Profitable Drug Pipeline
Size Classification
Respondents Revenue/ FTE (US$)
Pipeline/ FTE
1 90,000 60B Y 50 Large 3 600K 0.0006 2 30,000 20B Y 40 Large 1 600K 0.001 3 30,000 30B Y 40 Large 1 1M 0.001 4 20,000 20B Y 40 Large 1 1M 0.002 5 9,000 30B Y 40 Medium 1 3.3M 0.004 6 8,000 6B Y 10 Medium 1 750K 0.001 7 1,000 500M N 10 Medium 1 500K 0.01 8 1,000 2B N 20 Medium 1 2M 0.02 9 500 3M N 10 Small 1 6K 0.02 10 300 300M Y 10 Small 1 1M 0.03 11 200 NA NA 10 Small 1 NA 0.05 12 100 1M N 5 Small 1 10K 0.05 13 100 10M N 10 Small 1 100K 0.1 14 100 NA NA 1 Small 1 NA 0.01 15 100 NA N 10 Small 1 NA 0.1
Source: Yahoo!Finance 2017 (13) FTE = full-time employees NA = Not available Drug Pipeline = set of drug candidates that a pharmaceutical company has under discovery or development and any given point in time.

17
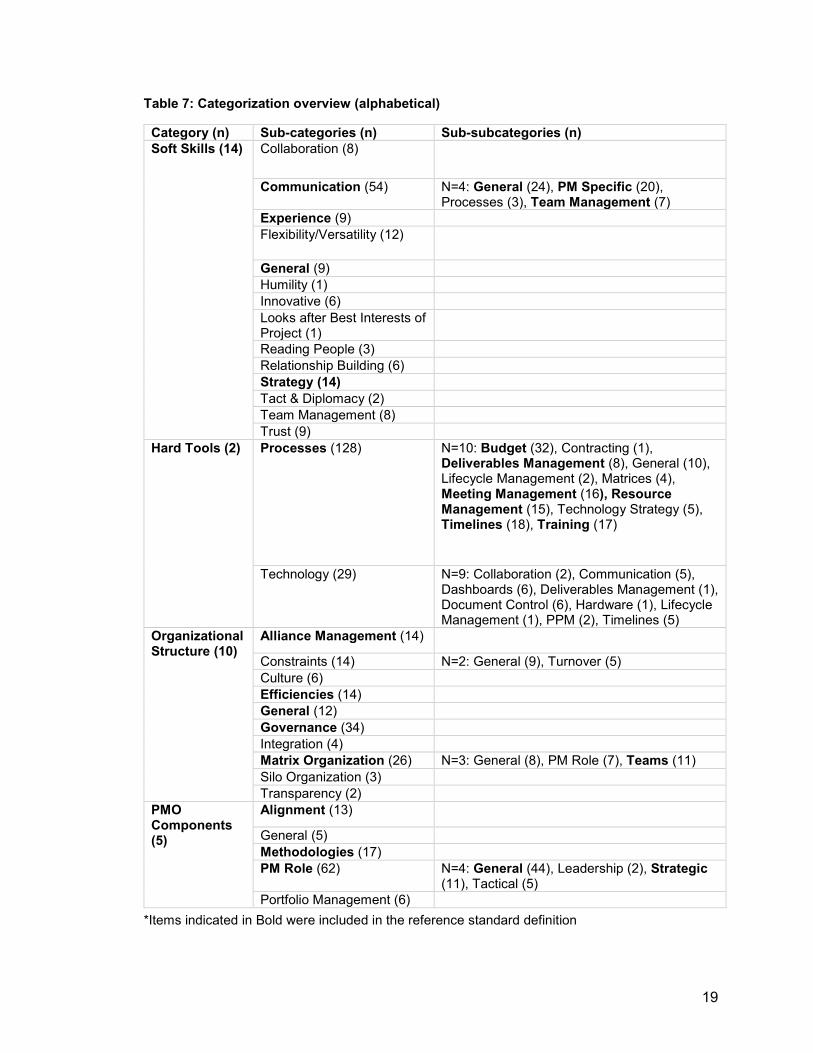
4.1.3 Categorization Overview
The 17 interviews culminated in a total of 5,712 words relevant to project management
context, which were further cleaned using the method outlined in Section 3.2.5, resulting
in 540 high frequency words. The high frequency words were then grouped into four top
level categories: 1) Soft Skills, 2) Hard Tools, 3) Organizational Structure, and 4) PMO
Components. Each of the categories had multiple sub-categories and sub-subcategories
(Table 7).
The Soft Skills category had 14 sub-categories (alphabetical, number of terms per
category indicated in parenthesis after the term): Collaboration (8), Communication (54),
Experience (9), Flexibility/Versatility (12), General (9), Humility (1), Innovative (6), Looks
after best interests of project (1), Reading People (3), Relationship Building (6), Strategy
(14), Tact and Diplomacy (2), Team Management (8), and Trust (9). The 54 terms in
Communication were divided into four sub-subcategories: General (24), Project
Management (PM) Specific (20), Processes (3) and Team Management (7). The Soft
Skills sub-categories included in the reference standard were Communication (the three
sub-subcategories of General, PM Specific and Team Management), Experience,
General and Strategy.
The Hard Tools category had two sub-categories: Processes (128) and Technology (29).
The 128 terms in Processes were divided into 10 sub-subcategories: Budget (32),
Contracting (1), Deliverables Management (8), General (10), Lifecycle Management (2),
Matrices (4), Meeting Management (16), Resource Management (15), Technology
Strategy (5), Timelines (18), and Training (17). The 29 terms in Technology were divided
into nine sub-subcategories: Collaboration (2), Communication (5), Dashboards (6),
Deliverables Management (1), Document Control (6), Hardware (1), Lifecycle
Management (1) PPM (2), and Timelines (5). Although Timelines are found in both the
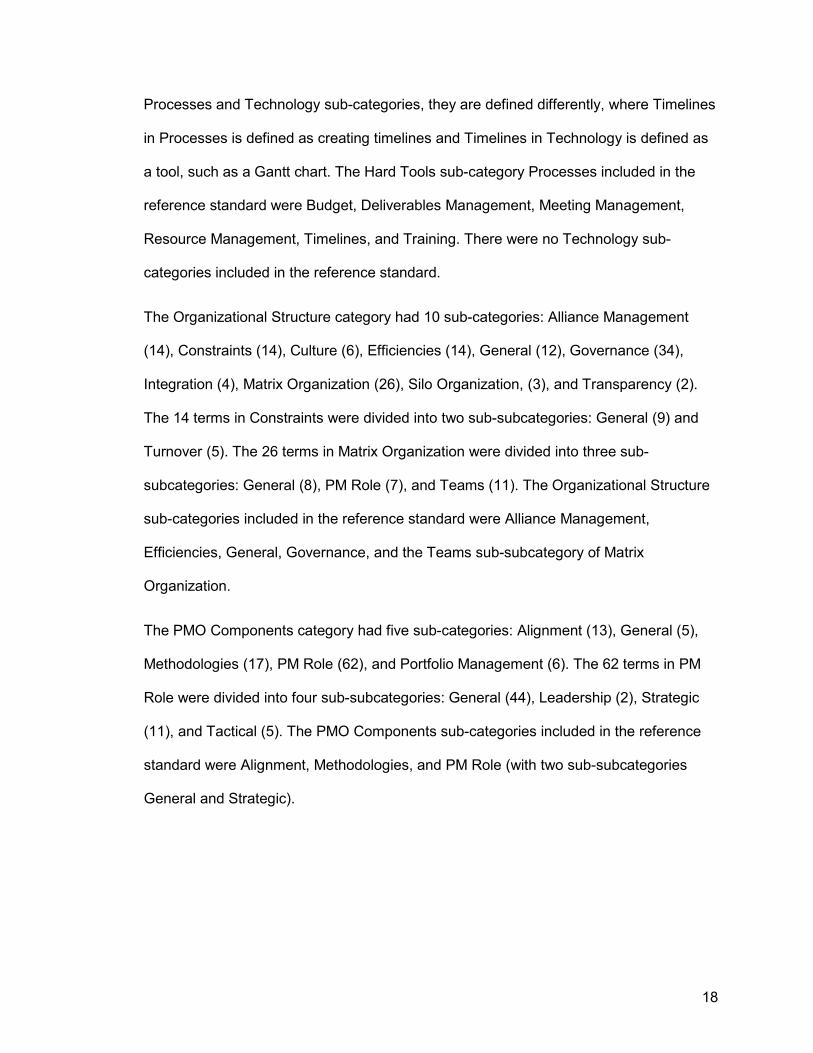
18
Processes and Technology sub-categories, they are defined differently, where Timelines
in Processes is defined as creating timelines and Timelines in Technology is defined as
a tool, such as a Gantt chart. The Hard Tools sub-category Processes included in the
reference standard were Budget, Deliverables Management, Meeting Management,
Resource Management, Timelines, and Training. There were no Technology sub-
categories included in the reference standard.
The Organizational Structure category had 10 sub-categories: Alliance Management
(14), Constraints (14), Culture (6), Efficiencies (14), General (12), Governance (34),
Integration (4), Matrix Organization (26), Silo Organization, (3), and Transparency (2).
The 14 terms in Constraints were divided into two sub-subcategories: General (9) and
Turnover (5). The 26 terms in Matrix Organization were divided into three sub-
subcategories: General (8), PM Role (7), and Teams (11). The Organizational Structure
sub-categories included in the reference standard were Alliance Management,
Efficiencies, General, Governance, and the Teams sub-subcategory of Matrix
Organization.
The PMO Components category had five sub-categories: Alignment (13), General (5),
Methodologies (17), PM Role (62), and Portfolio Management (6). The 62 terms in PM
Role were divided into four sub-subcategories: General (44), Leadership (2), Strategic
(11), and Tactical (5). The PMO Components sub-categories included in the reference
standard were Alignment, Methodologies, and PM Role (with two sub-subcategories
General and Strategic).
19
Table 7: Categorization overview (alphabetical)
Category (n) Sub-categories (n) Sub-subcategories (n) Soft Skills (14)
Collaboration (8)
Communication (54) N=4: General (24), PM Specific (20), Processes (3), Team Management (7)
Experience (9) Flexibility/Versatility (12)
General (9) Humility (1) Innovative (6) Looks after Best Interests of Project (1)
Reading People (3) Relationship Building (6) Strategy (14) Tact & Diplomacy (2) Team Management (8) Trust (9)
Hard Tools (2) Processes (128) N=10: Budget (32), Contracting (1), Deliverables Management (8), General (10), Lifecycle Management (2), Matrices (4), Meeting Management (16), Resource Management (15), Technology Strategy (5), Timelines (18), Training (17)
Technology (29) N=9: Collaboration (2), Communication (5), Dashboards (6), Deliverables Management (1), Document Control (6), Hardware (1), Lifecycle Management (1), PPM (2), Timelines (5)
Organizational Structure (10)
Alliance Management (14)
Constraints (14) N=2: General (9), Turnover (5) Culture (6) Efficiencies (14) General (12) Governance (34) Integration (4) Matrix Organization (26) N=3: General (8), PM Role (7), Teams (11) Silo Organization (3) Transparency (2)
PMO Components (5)
Alignment (13)
General (5) Methodologies (17) PM Role (62) N=4: General (44), Leadership (2), Strategic
(11), Tactical (5) Portfolio Management (6)
*Items indicated in Bold were included in the reference standard definition
20
4.1.3.1 Overview of Categories
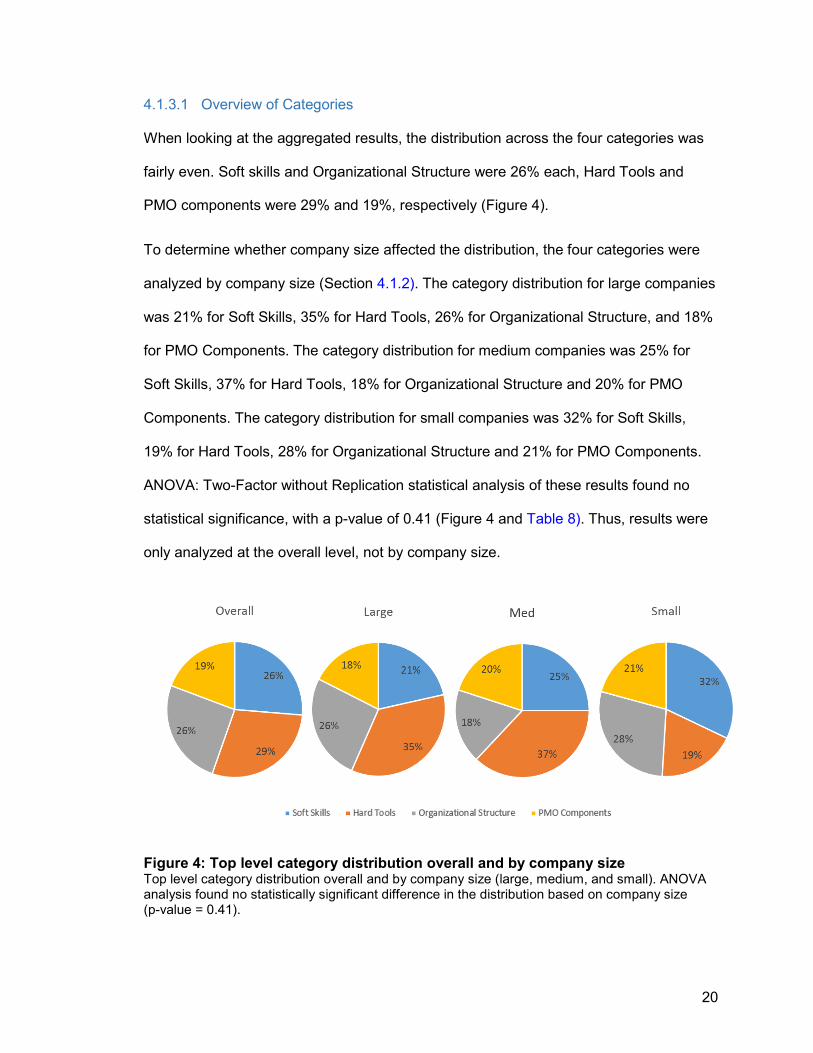
When looking at the aggregated results, the distribution across the four categories was
fairly even. Soft skills and Organizational Structure were 26% each, Hard Tools and
PMO components were 29% and 19%, respectively (Figure 4).
To determine whether company size affected the distribution, the four categories were
analyzed by company size (Section 4.1.2). The category distribution for large companies
was 21% for Soft Skills, 35% for Hard Tools, 26% for Organizational Structure, and 18%
for PMO Components. The category distribution for medium companies was 25% for
Soft Skills, 37% for Hard Tools, 18% for Organizational Structure and 20% for PMO
Components. The category distribution for small companies was 32% for Soft Skills,
19% for Hard Tools, 28% for Organizational Structure and 21% for PMO Components.
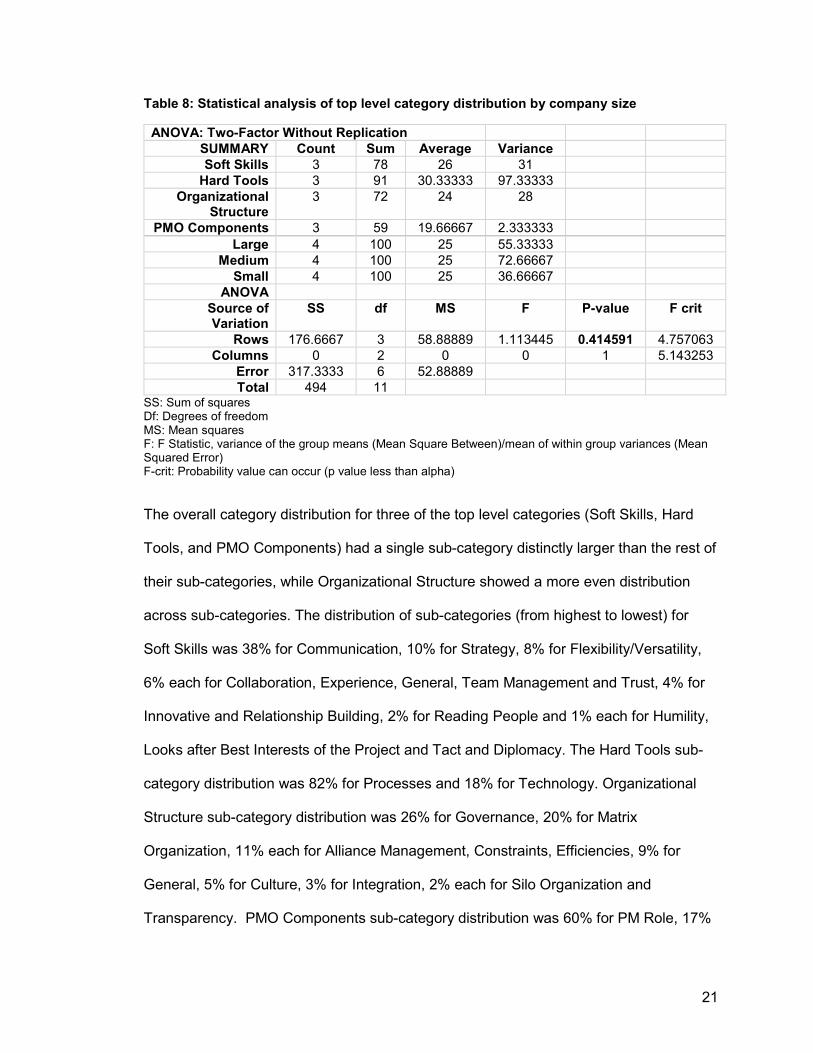
ANOVA: Two-Factor without Replication statistical analysis of these results found no
statistical significance, with a p-value of 0.41 (Figure 4 and Table 8). Thus, results were
only analyzed at the overall level, not by company size.
Figure 4: Top level category distribution overall and by company size Top level category distribution overall and by company size (large, medium, and small). ANOVA analysis found no statistically significant difference in the distribution based on company size (p-value = 0.41).
21
Table 8: Statistical analysis of top level category distribution by company size
ANOVA: Two-Factor Without Replication
SUMMARY Count Sum Average Variance
Soft Skills 3 78 26 31
Hard Tools 3 91 30.33333 97.33333
Organizational Structure
3 72 24 28
PMO Components 3 59 19.66667 2.333333
Large 4 100 25 55.33333
Medium 4 100 25 72.66667
Small 4 100 25 36.66667
ANOVA
Source of Variation
SS df MS F P-value F crit
Rows 176.6667 3 58.88889 1.113445 0.414591 4.757063 Columns 0 2 0 0 1 5.143253
Error 317.3333 6 52.88889
Total 494 11
SS: Sum of squares Df: Degrees of freedom MS: Mean squares F: F Statistic, variance of the group means (Mean Square Between)/mean of within group variances (Mean Squared Error) F-crit: Probability value can occur (p value less than alpha)
The overall category distribution for three of the top level categories (Soft Skills, Hard
Tools, and PMO Components) had a single sub-category distinctly larger than the rest of
their sub-categories, while Organizational Structure showed a more even distribution
across sub-categories. The distribution of sub-categories (from highest to lowest) for
Soft Skills was 38% for Communication, 10% for Strategy, 8% for Flexibility/Versatility,
6% each for Collaboration, Experience, General, Team Management and Trust, 4% for
Innovative and Relationship Building, 2% for Reading People and 1% each for Humility,
Looks after Best Interests of the Project and Tact and Diplomacy. The Hard Tools sub-
category distribution was 82% for Processes and 18% for Technology. Organizational
Structure sub-category distribution was 26% for Governance, 20% for Matrix
Organization, 11% each for Alliance Management, Constraints, Efficiencies, 9% for
General, 5% for Culture, 3% for Integration, 2% each for Silo Organization and
Transparency. PMO Components sub-category distribution was 60% for PM Role, 17%
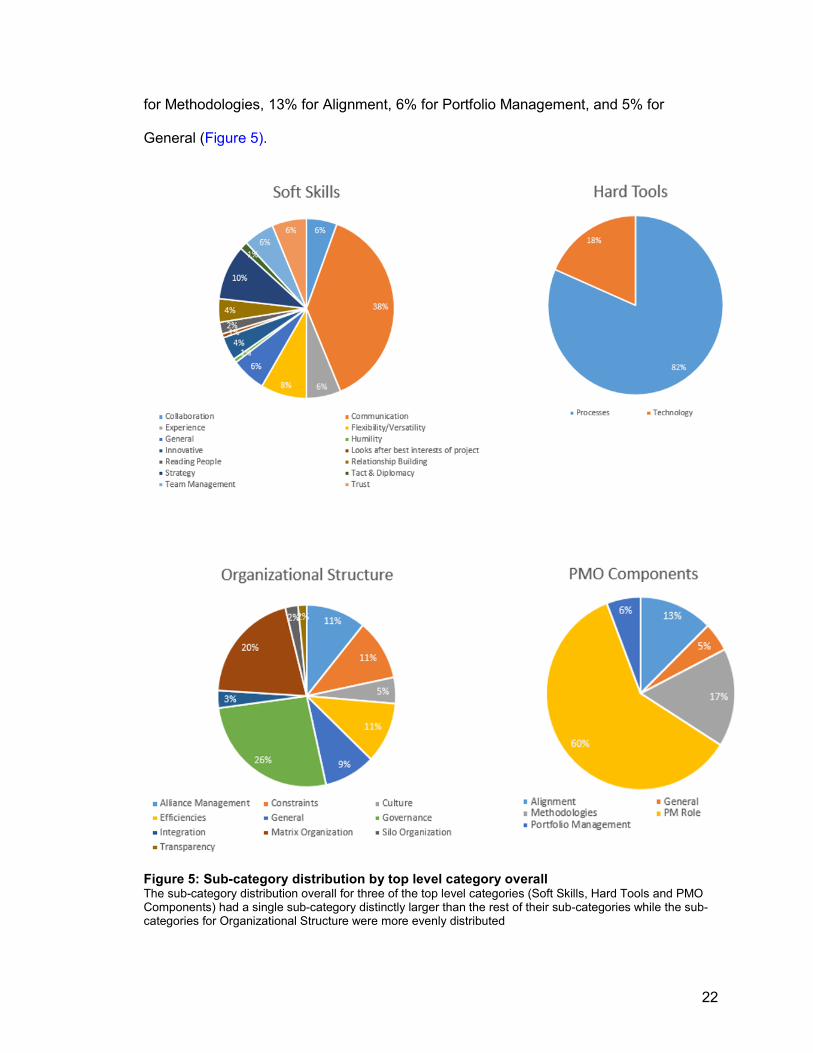
22
for Methodologies, 13% for Alignment, 6% for Portfolio Management, and 5% for
General (Figure 5).
Figure 5: Sub-category distribution by top level category overall The sub-category distribution overall for three of the top level categories (Soft Skills, Hard Tools and PMO Components) had a single sub-category distinctly larger than the rest of their sub-categories while the sub-categories for Organizational Structure were more evenly distributed
23
4.1.4 Reference Standard Definition
The objective of the reference standard definition was to create a rubric that could be
used by pharmaceutical companies to evaluate and improve clinical development project
management performance. The initial list of categories (including sub and sub-
subcategories) totaled 65. Definition of each category with three to seven attributes
would have produced a reference standard with hundreds of attributes, which was
deemed too large to be usable. To produce a more manageable reference standard, a
cutoff of ≥ 6 (Section 3.2.7) was applied resulting in 21 categories (indicated in bold in
Table 7). These categories were then defined using words taken directly from the
respondent interviews in Phase I to produce a total of 72 attributes (Section 8.3.2).
Use of the cutoff of ≥ 6 (Section 3.2.7) resulted in certain terms with higher absolute
values not being included. For example, in the Soft Skills category, Flexibility/Versatility
had a total count of 12 terms. However, when distributed by company size, they all fell
into the bottom quartile: large (5), medium (2), and small (5), and so did not reach the
cut-off (>6). Experience, on the other hand, had a total of 9 terms. The company size
distribution was large (0), medium (8), and small (1). The medium count of eight fell
above the >6 cut-off (i.e., outside the bottom quartile), so was included in the reference
standard definition. The same was applied to the remaining top level categories (Hard
Tools, Organizational Structure, and PMO Components). The individual categories had
variable number of sub-subcategories and some sub-categories with additional context
required a third level of categorization. Raw data for the word counts, organized by
category (and sub and sub-sub) and company are provided in Table 19.
4.1.5 Reference Standard Rubric
The reference standard definition (72 attributes) was then converted into 72 actionable
statements, i.e., the reference standard rubric, Section 8.3.2).
24
4.2 Phase II: Rubric Evaluation and Comparator Company Recommendations
The Phase II objectives were to evaluate the rubric and make recommendations for how
a comparator company could achieve the reference standard.
4.2.1 Response Results
Of the total potential pool of respondents of 41 people contacted via LinkedIn, 22 people
expressed interest and received a copy of the 5-point Likert scale survey comprised of
72 questions (see Section 3.3.1). Of the 22 that expressed interest, six respondents
completed the survey (27% response rate). For Soft skills, which had 22 attributes, all of
the responses were above the 3.0 cut-off, with the mean (median) of the six responses
ranging from 3.6 – 4.5 (3.5 – 4.5). None of the six respondents Strongly Disagreed.
There was one Disagree response each for three attributes (information sharing is
concise, information sharing is precise, and PMs are effective at ensuring issues are
appropriately shared across teams). Hard Tools had 24 attributes, with the mean
(median) of the six responses ranging from 2.5 – 4.0 (2.5 – 4.0). Four of the Hard Tools
attributes were below the 3.0 cut-off. Four of six respondents Strongly Disagreed with
four attributes (Organization Tracks Actuals Against Budget, Team Members are Kept to
a Minimum, PM Training Leverages Project Management Body of Knowledge [PMBOK],
and Organization Provides Just-in-Time [JIT] Training [i.e., relevant training is provided
just before needed]). There were Disagree responses for all but three attributes.
Organizational Structure had 14 attributes, with the mean (median) of the six responses
ranging from 2.8 – 3.8 (3.0 - 4.0). All of the responses for Organizational Structure
attributes were above the 3.0 cut-off. None of six respondents Strongly Disagreed.
Neither agree nor disagree responses accounted for a majority of responses. PMO
components had 11 attributes, with the mean (median) of the six responses ranging from
2.5 – 4.2 (2.5 – 4.0). All but one of the responses for PMO components attributes were

25
above the 3.0 cut-off. One of six respondents Strongly Disagreed with one attribute
(organization leverages PMBOK practices). There were four Disagree responses for
three attributes (PMs ensure portfolio and product strategies are developed, PMs help
teams to think strategically, organization leverages PMBOK practices, and PMs assist in
establishing agreed upon product development plans).
4.2.2 Data Analysis
In order to evaluate the usability of the rubric, four factors were analyzed: 1) response
rate, 2) completion rate, 3) completion time and 4) response variation. The survey
response rate was 27%, which was higher than the response rate from LinkedIn
(11.76%), lower than the response rate from referrals (64.71%) and comparable with the
response rate for the Bizzabo platform (23.53%). All of the respondents (n=6) that
started the survey, completed it. The time for completion ranged from 7:01 minutes to
51:12 minutes, with five out of six respondents’ completion times under 17 minutes. The
average completion time of all the respondents was 18 minutes, and was 11:34 minutes
if the one outlier (51:12 minutes) was excluded. Responses were varied both within each
individual respondent’s results and across respondents, i.e., no respondent answered all
statements with the same value, nor did any respondents answer all questions
identically.
In order to evaluate the performance of a comparator company relative to the
expectations of an average company (defined as a score of 3.0), the overall mean and
median values of the survey results were calculated for each of the four categories.
The mean (median) for Soft Skills was 4.8 (4.0), for Hard Tools 3.9 (3.4), Organizational
Structure 3.9 (3.4) and PMO Components 4.3 (4.3) (Table 9 and Supplementary
Table 19).
26
Table 9: Comparator company overall mean and median values
Soft Skills Hard Tools Organizational Structure
PMO Components
Mean 4.8 3.9 3.9 4.3 Median 4.0 3.4 3.4 4.3
The comparator company, a mid-sized company identified in Phase I and reserved for
Phase II testing (Section 3.2.3) had 7,300 employees with a revenue of $12B, and was
profitable with 17 products in the pipeline (Table 10).
Table 10: Comparator company size evaluation
Medium Comparator Company Number of employees 1K – 10K 7,300
Revenues $1B – $10B $12B Profitability (y/n) Y or N Y
Pipeline 10 - 20 17 Source: Yahoo!Finance 2017 (13)
5 Discussion
The objectives of Phase I were to define a reference standard and develop an
associated rubric for the assessment of clinical development PMOs. The Phase II
objectives were to evaluate the rubric and make recommendations for how a comparator
company could achieve the reference standard.
5.1.1 Phase I: Reference Standard and Rubric Development
Each of the four top level categories had themes. Soft Skills had three themes:
Communication, Strategy, and Experience. Hard Tools themes centered on Processes,
with sub-themes of Budget, Deliverables Management, Meeting Management, and
Resource Management, Timelines, and Training. Although Timelines are found in both
subcategories (Processes and Technology), they are defined differently, where
Timelines in Processes is defined as creating timelines and Timelines in Technology is

27
defined as a tool, such as a Gantt chart. Organizational Structure had themes around
Governance, Efficiencies, and Teams. PMO Components included themes around the
PM Role, Methodologies and Alignment (Figure 5).
Although Soft Skills had three themes (i.e., Communication, Strategy, and Experience),
the theme of Communication was dominant, representing more than one-third of the
attributes (38%). This reveals not only the need for good communication, but how easily
poor communication can become an issue. The reference standard provides best
practices needed to effectively communicate by specifying the attributes required, e.g.,
direct, concise, and precise.
The Hard Tools themes focused on processes, accounting for 82% of the terms for this
category, highlighting the difficulty in achieving good processes. The processes
necessarily incorporate technology (which is important to meet specific needs), however,
technology alone cannot meet all the needs. Therefore, a focus on processes for
budgeting, training, and resource management are important as best practices.
The Organizational Structure themes were Governance (26%), Efficiencies (11%) and
Teams as part of a Matrix Organization (20%). The data suggest that Governance is
important because of its role in decision making. Therefore, a focus on Governance
ensures that the organization has specific decision making and escalation pathways.
Efficiencies focused on reducing the amount of time that processes required and on
ensuring that “trains run on time”. Data on Teams as part of Matrix Organization focused
on the need for teams to manage the project (called “project teams”).
The PMO Components category had themes around the PM Role (62%), Methodologies
(17%) and Alignment (13%). The data suggest that an important component to a PMO is
the organization’s understanding of what the project manager does and how their role
28
fits into the overall team structures. Methodologies focused on the importance of
leveraging the Project Management Body of Knowledge (PMBOK) from the Project
Management Institute (PMI). Alignment focused on ensuring that the organization was
internally aligned, and highlighted the importance of establishing agreed upon goals and
objectives.
The results reveal that the four top level categories can be grouped into two
designations: “individual” and “organizational”. Soft Skills and Hard Tools fit into the
“individual” designation because these categories are performed by an individual.
Organizational Structure and PMO Components fit into the “organizational” designation
because they are performed at the company level. For example, General
Communication in Soft Skills consists of attributes of concise and direct communication.
Although that could be considered an organizational designation (since all-around
communication is important), the skill must first occur at an individual level in order for
communication to impact the level of the organization. Organizational Structure includes
Governance, which can only occur at a company level.
5.1.2 Phase II: Rubric Evaluation and Comparator Company Recommendations
The Phase II objectives were to evaluate the rubric and make recommendations for how
a comparator company could achieve the reference standard.
The evaluation of rubric usability involved four factors: 1) response rate, 2) completion
rate, 3) completion time and 4) response variation. The response rate was 27%, which is
on the higher end of what was seen in Phase I for non-referrals (none of the
respondents were referrals). All of the respondents that started the survey, completed it,
indicating that they were not deterred by the survey despite it being comprised of 72
questions. Five out of six respondents required less than 12 minutes to complete the
survey, indicating that the time required for completion was not onerous. There were
29
variations in the responses selected (both individually and across the sample group),
indicating that respondents read the statements before responding.
The rubric was used to evaluate a comparator company’s performance relative to the
reference standard and whether that aligned with its performance relative to its peers.
Based on the reference standard, the comparator company was ranked as performing
above average in all Soft Skills attributes. Four attributes in Hard Tools were identified
as needing additional work: 1) clear processes for adding resources and/or changing
priorities, 2) organization-wide timeline templates with standard durations, 3) PM training
to leverage PMBOK, and 4) organization-provided JIT training. One attribute each in
Organizational Structure (the organization has the right-sized infrastructure in place),
and PMO Components (the organization leverages PMBOK practices) were also
identified as needing additional work.
In theory, the reference standard rubric should reflect whether the performance of the
company is at, above or below its performance measures relative to its peers. Based on
the company metrics established in Section 4.1.2 and the mean and median analysis in
Section 4.2.2, the comparator company appears to be doing incrementally better than
average mid-sized companies, which is consistent with the Phase II results in Table 10.
5.1.3 Limitations and Future Research
As with all research, there are limitations to this study. One example is geographical, as
all the respondents were solely from the West coast of the United States (US).
Therefore, it is unknown whether this information will hold true for other regions of the
US and/or for other countries. Both Phase I and Phase II sample groups were small so
the findings could change with larger cohorts. For example, “Soft Skills’, Team
Management” doesn’t appear for small size companies. This might be an artifact of the
small sample size or it might be replicated in a larger cohort and thus identified as an

30
area worth further exploration. Finally, the study was not able to comprehensively
evaluate and/or validate the accuracy and precision of the rubric, company metrics
definition, and the cut-offs. As the ultimate goal is to decrease the amount of time for
clinical development in pharmaceutical companies, one way to determine whether the
reference standard is causative rather than solely correlative would be to measure
clinical development time pre- and post-implementation of the reference standard.
6 Conclusion
The objective of all projects is to be on time, on budget, and within scope. In clinical
development, that means safety and effectiveness within the intended population as
quickly as possible. Average time to market for a drug in development is ten to fifteen
years, and of that, seven to ten years are spent in clinical development. While a general
project management standard for PM methodologies and techniques is outlined in the
PMBOK by the PMI and best practices outlined for many industries, there are no current
publications supporting project management in clinical development nor current
performance measures based on clinical development project management best
practices. Hence there is a need for defining best practices for clinical development
project management. To meet this need, Phase I defined a reference standard and
actionable guide (rubric) for the assessment of clinical development PMOs. The Phase II
evaluated the usability of the rubric as a tool for identifying areas of strength and
opportunity for clinical development project management best practices. Although further
work is necessary, this research sets the foundation for more effectively leveraging
clinical development project management to expedite bringing products to patients.
31
7 References
1. PhRMA. 2013 Biopharmaceutical Research Industry Profile. Biopharm Res Ind
Phrma [Internet]. 2013;1–78. Figure 11, page 32. Available from:
http://www.phrma.org/sites/default/files/pdf/PhRMA Profile 2013.pdf
2. Ballentine C. Sulfanilamide Disaster. FDA Consum Mag [Internet]. 1981;(June
1937). Available from:
https://www.fda.gov/downloads/AboutFDA/WhatWeDo/History/ProductRegulation/
UCM593517.pdf
3. WHO | Pharmaceutical products [Internet]. World Health Organization; 2017 [cited
2017 Jun 29]. Available from:
http://www.who.int/topics/pharmaceutical_products/en/
4. FDA | Is It a Cosmetic, a Drug, or Both? (Or Is It Soap?) [Internet]. FDA, 2012
[cited 2018 Jul 8]; Available from:
https://www.fda.gov/Cosmetics/GuidanceRegulation/LawsRegulations/ucm07420
1.htm
5. Babler SD. Pharmaceutical and Biomedical Project Management in a Changing
Global Environment. Pharmaceutical and Biomedical Project Management in a
Changing Global Environment. 2010. Abstract available from:
http://www.scopus.com/inward/record.url?eid=2-s2.0-
84891570388&partnerID=40&md5=957a428c1c969190db2ef7f191c7acc5
6. Boehm G, Yao L, Han L, Zheng Q. Development of the generic drug industry in
the US after the Hatch-Waxman Act of 1984. Acta Pharm Sin B [Internet].
2013;3(5):297–311. Available from:
http://linkinghub.elsevier.com/retrieve/pii/S2211383513000762
32
7. FDA | Overview & Basics [Internet]. FDA, 2017. [cited 2018 Jul 9]; Available from:
https://www.fda.gov/Drugs/ResourcesForYou/Consumers/BuyingUsingMedicineS
afely/GenericDrugs/ucm567297.htm
8. FDA. Science and the Regulation of Biological Products: From a Rich History to a
Challenging Future. FDA. 2002;3. [cited 2018 Jul 12];Available from:
https://www.fda.gov/downloads/AboutFDA/WhatWeDo/History/FOrgsHistory/Histo
ryofFDAsCentersandOffices/UCM582569.pdf
9. Raedler LA. Zarxio (Filgrastim-sndz): First Biosimilar Approved in the United
States. Am Heal drug benefits [Internet]. 2016;9(Spec Feature):150–4. Available
from: http://www.pubmedcentral.nih.gov/articlerender.fcgi?artid=PMC5013845
10. Belassi W, Tukel OI. A new framework for determining critical success/failure
factors in projects. Int J Proj Manag. 1996;14(3):141–51. [cited 2018 Jul 12];
Available from:
https://notendur.hi.is/vio1/A%20new%20framework%20for%20determining%20crit
ical%20success_failure%20%20%20%20%20%20factors%20in%20projects%20.
11. Grove NE, Hitchner KN, Lindquist PB, Maher DP, Ward RHR, Wulf JJ, Kramer
SM. Project Management in a Biotechnology Environment. Calgary, Alberta:
Project Management Institute; 1990. Not available online. Available upon request.
12. Baruch Y, Holtom BC. Survey response rate levels and trends in organizational
research. Hum Relations. 2008;61(8):1139–60. [cited 2018 Jul 12]; Available
from: http://journals.sagepub.com/doi/10.1177/0018726708094863
13. Yahoo Finance - Business Finance, Stock Market, Quotes, News [Internet]. [cited
2017 Jun 29]. Available from: https://finance.yahoo.com/

33
8 Appendix
8.1 Reference Standard Classification Scheme
The reference standard classification scheme uses the following hierarchy:
• Category – highest level in the scheme, total of four o Sub-category – groupings within categories
� Sub-subcategory – groupings within sub-categories • Term – actual word taken from Phase I interviews.
Reference Standard at this level (subset of total items). o Attribute – Description of term created using
information taken from Phase I interviews. Rubric at this level (limited to terms in Reference Standard).
8.2 Interview Questions
8.2.1 Study Design
Questions:
1. What does the Center of Excellence mean to you? 2. What best practices/strategies do you employ to successfully complete your
tasks? 3. What pitfalls do you avoid & how? 4. Tell me a little bit about your career path, how did you move into PM? 5. Based on your current experience in the field, what have you done differently to
be more productive or to stay ahead of the game? 6. Do you have any internal or external contacts you can share in regards to
assisting with my COE Research?
8.2.2 Phase I
Questions:
1. What does a Project Management Center of Excellence mean to you? 2. What PPM best practices/strategies have you personally observed (or perhaps
used) that were helpful in teams/work streams to completing tasks and/or deliverables?
3. Are there specific pitfalls you have observed when trying to implement project/portfolio practices at companies you’ve been a part of? Some pitfalls may be situations such as: Undefined goals, scope changes, lack of accountability, lengthy decision-making processes, issues with change management, or lack of communication.
34
4. What difficulties with interpersonal interactions in team dynamics have you observed and were there specific tools and techniques you have seen project managers apply to avoid or resolve difficulties?
5. Regarding the PM’s you’ve worked with, are there certain types of backgrounds or characteristics that the most effective PM’s share?
6. Based on your current experience in the field, what have you done differently to be more productive or to stay ahead of the game?
7. What has your company done differently to be ahead in terms of innovation and creativity in PPM?
8. What best practices/strategies/toolkits does your company leverage to successfully complete tasks?
9. What are some PPM best-practices you’ve experienced with previous employers?
10. What are best-practices you noticed were different (yet positive) from standard practices at your current employer?
11. Based on your industry experience, what do you feel companies do well in regards to PPM? How do they do those things?
12. What and how would you like to do things differently in a Project Management Office if given the opportunity?
13. Do you have any internal or external PPM contacts you would be willing to share for participation in this survey?
14. What tools, best practices, systems or rules would you include in a Project Management Center of Excellence?
8.2.3 Phase II
Likert-scale Survey Questions:
Soft Skills
1. Communications in my organization are direct and to the point without being rude 2. Messages are tailored to the audience 3. Messages are conveyed with humility 4. Humor is used appropriately in communications 5. Information is shared in a timely manner 6. Information sharing is concise 7. Information sharing is precise 8. PMs are effective at communicating information internally and externally (e.g.,
teams, management, outside company, etc.) 9. PMs are effective at communicating constraints and potential solutions 10. PMs are effective at ensuring issues are appropriately shared across teams 11. PMs are able to effectively share the pros and cons of mitigations 12. PMs have real-time, high level knowledge of the project 13. PMs are able to effectively communicate bad news 14. PMs regularly check in with stakeholders
35
15. PMs leverage multiple communication methods effectively to obtain responses from team members
16. PMs check the "pulse" of the team during meetings 17. PMs are able to guide team meeting discussions so they remain constructive and
productive 18. Programs are prioritized at a portfolio level 19. Trade-off decisions factor in both program and portfolio levels 20. Competitive intelligence is used to inform portfolio and product strategy 21. Organization provides opportunities for both formal training and hands on
experience (including feedback) 22. Soft skills are highly valued
Hard Tools
23. My organization has a current annual budget and five-year plan 24. Projects are funded based on probability of success at the portfolio level 25. Organization tracks actuals against budget 26. Cost modeling & forecasting is used to inform budget and five-year plan 27. Projects have clearly identified deliverables 28. Responsibility for project deliverables is clearly identified 29. Delivery of project deliverables is tracked against internal and external
commitments 30. Clear process for escalating potential delays in meeting project deliverables per
internal and external commitments 31. Team members are kept to a minimum 32. Meeting agendas and minutes are developed and distributed in a timely manner 33. Action Item, Decision and Issues (ADI) logs are maintained 34. Risks are documented and evaluated 35. Resource needs are identified 36. Regular reviews of needed vs available resources are conducted 37. Clear process for adding resources and/or changing priorities to reduce workload
in the event there are not enough resources to meet the need 38. Timelines are developed and maintained 39. Timeline projected vs actuals tracked (particularly for critical path) 40. Clear escalation process if timelines exceed agreed upon thresholds 41. Organization has timeline templates with standard durations 42. Organization has the ability to conduct scenario planning 43. Timelines are used to decrease overall development duration 44. Organization provides training for team members including team
tools/processes/best practices, e.g., critical path understanding 45. PM training leverages Project Management Body of Knowledge (PMBOK) 46. Organization provides Just-in-Time (JIT) training (i.e., relevant training is
provided just before needed)
36
Organizational Structure
47. Organization has clear escalation pathways 48. Organization has clear decision making pathways 49. Decisions in my organization are unambiguous and specific 50. Decisions in my organization are documented and readily retrievable 51. Cross-functional teams make product development faster, cheaper, and/or higher
quality 52. Cross-functional teams in my organization have a clear purpose and scope 53. Team members have clear understanding of their role 54. Organizational best practices are established which are appropriate to the
product development phase 55. Organizational best practices are leveraged to quickly set up teams, tools, and
processes 56. Organizational best practices lead to decreased product development time 57. Organizational best practices are continuously improved through process
improvement initiatives 58. Organization effectively leverages partnerships to extend resources and/or
capabilities 59. Organization effectively leverages partnerships to share and/or reduce risks 60. Organization has the right-sized infrastructure in place to support projects
PMO Components
61. Does your organization have a formal PMO 62. Roles are clearly defined for PM and team members 63. PM's scope is cross-functional 64. PMs ensure teams meet organizational objectives/goals 65. PMs ensure portfolio and product strategies are developed 66. PMs help teams think strategically 67. Organization has and uses established methodologies, processes, tools, and
training 68. Organization leverages PMBOK practices 69. PMs assist in establishing agreed upon goals and objectives 70. PMs assist in establishing agreed upon product development plans 71. PMs track organizational progress against goals and objectives 72. PMs escalate issues as appropriate
37
8.3 Reference Standard and Rubric Development
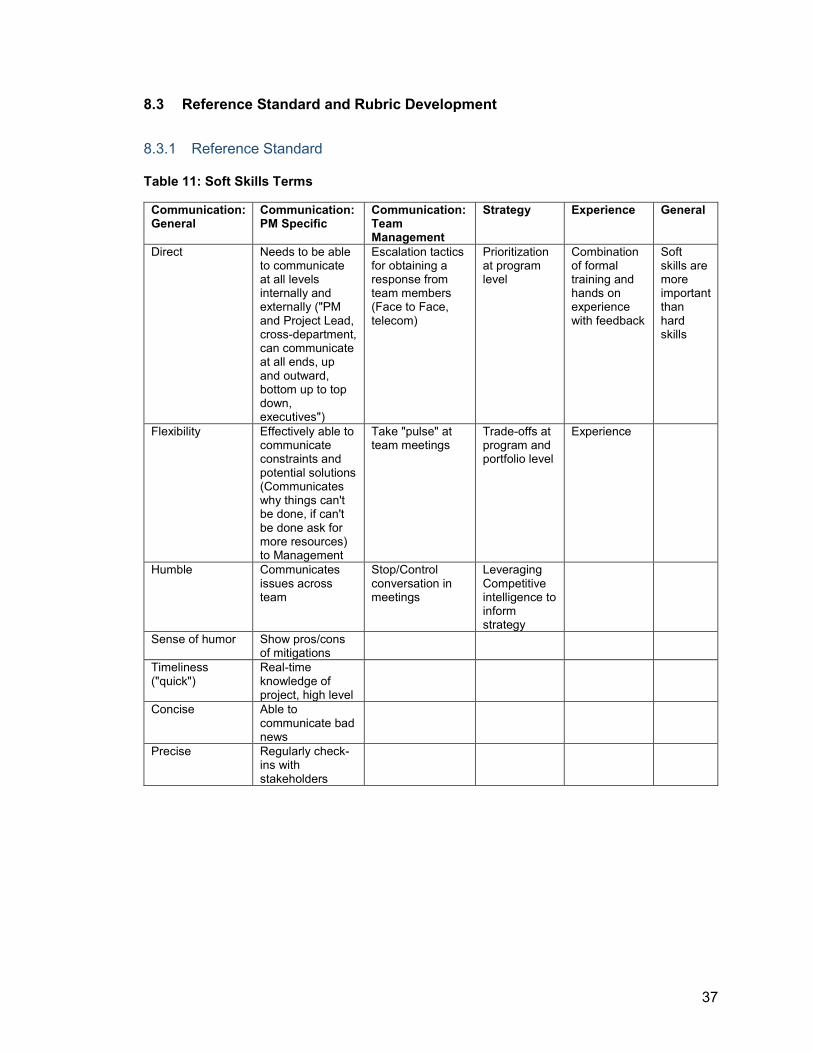
8.3.1 Reference Standard
Table 11: Soft Skills Terms
Communication: General
Communication: PM Specific
Communication: Team Management
Strategy Experience General
Direct Needs to be able to communicate at all levels internally and externally ("PM and Project Lead, cross-department, can communicate at all ends, up and outward, bottom up to top down, executives")
Escalation tactics for obtaining a response from team members (Face to Face, telecom)
Prioritization at program level
Combination of formal training and hands on experience with feedback
Soft skills are more important than hard skills
Flexibility Effectively able to communicate constraints and potential solutions (Communicates why things can't be done, if can't be done ask for more resources) to Management
Take "pulse" at team meetings
Trade-offs at program and portfolio level
Experience
Humble Communicates issues across team
Stop/Control conversation in meetings
Leveraging Competitive intelligence to inform strategy
Sense of humor Show pros/cons of mitigations
Timeliness ("quick")
Real-time knowledge of project, high level
Concise Able to communicate bad news
Precise Regularly check-ins with stakeholders
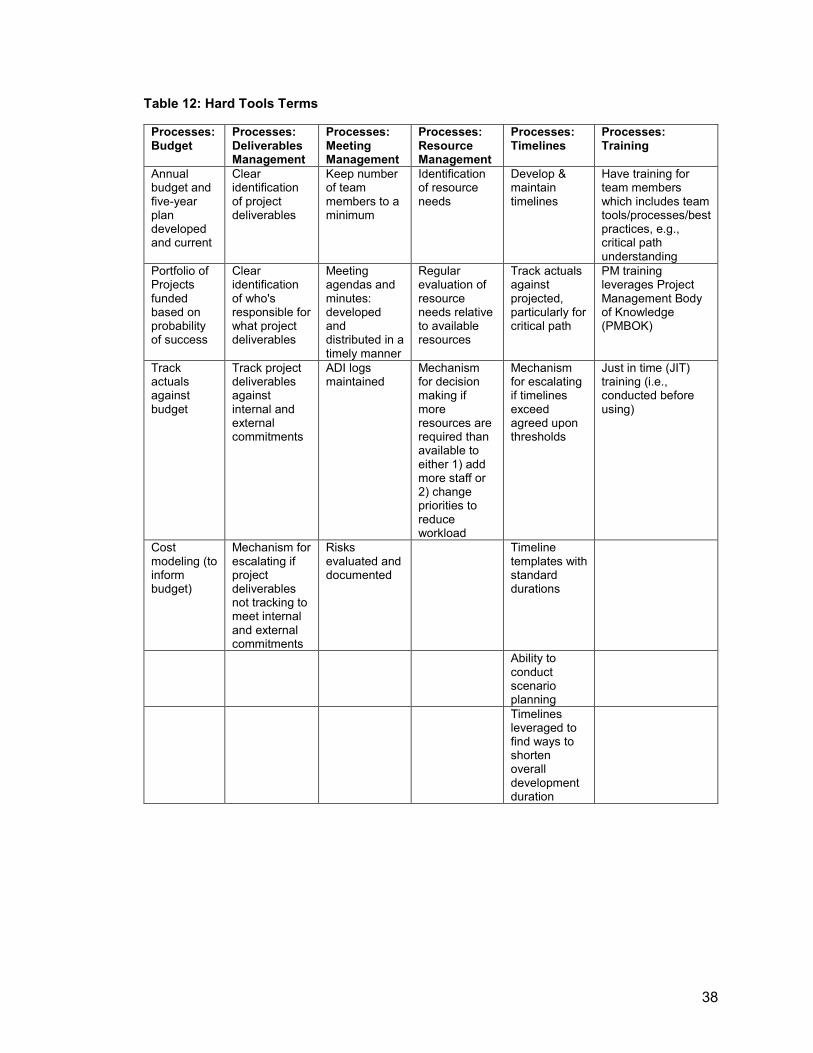
38
Table 12: Hard Tools Terms
Processes: Budget
Processes: Deliverables Management
Processes: Meeting Management
Processes: Resource Management
Processes: Timelines
Processes: Training
Annual budget and five-year plan developed and current
Clear identification of project deliverables
Keep number of team members to a minimum
Identification of resource needs
Develop & maintain timelines
Have training for team members which includes team tools/processes/best practices, e.g., critical path understanding
Portfolio of Projects funded based on probability of success
Clear identification of who's responsible for what project deliverables
Meeting agendas and minutes: developed and distributed in a timely manner
Regular evaluation of resource needs relative to available resources
Track actuals against projected, particularly for critical path
PM training leverages Project Management Body of Knowledge (PMBOK)
Track actuals against budget
Track project deliverables against internal and external commitments
ADI logs maintained
Mechanism for decision making if more resources are required than available to either 1) add more staff or 2) change priorities to reduce workload
Mechanism for escalating if timelines exceed agreed upon thresholds
Just in time (JIT) training (i.e., conducted before using)
Cost modeling (to inform budget)
Mechanism for escalating if project deliverables not tracking to meet internal and external commitments
Risks evaluated and documented
Timeline templates with standard durations
Ability to conduct scenario planning
Timelines leveraged to find ways to shorten overall development duration

39
Table 13: Organizational Structure Terms
Governance Matrix organization: Teams
Efficiencies Alliance Management
General
Clear communication pathways
Cross-functional teams make product development faster, cheaper, and/or higher quality
Have established organizational best practices which are right sized to the project phase
Effectively leverage partnerships to extend resources and/or capabilities
Right-sized infrastructure set-up and in place to support projects
Clear decision making process
Teams have a clear purpose and scope
Leverage organizational best practices to facilitate quickly setting up teams, tools and processes
Effectively leverage partnerships to share and/or reduce risks
Decisions are unambiguous and specific
Team members understand their role
Organizational best practices lead to decreased product development time
Decisions are documented & readily retrievable
Continuously improve through process improvement initiatives
Table 14: PMO Components Terms
PM Role: General PM Role: Strategic Methodologies Alignment Role is clearly defined both for PM and other roles with which the PM interacts
Ensures portfolio and product strategy developed
Established methodologies, including processes, tools and training
Help establish agreed upon goals and objectives
Scope is cross-functional
Helps teams think strategically
Methodologies appropriately leverage PMBOK practices
Helps establish agreed upon product development plan
Responsible for ensuring team meets organizational objectives/goals
Tracks progress against goals and objectives
PM Role: General Escalates issues as appropriate

40
8.3.2 Rubric Development
Table 15: Soft Skills Attributes
Communication: General
Communication: PM Specific
Communication: Team Management
Strategy Experience General
Communications in my organization are direct and to the point without being rude
PMs are effective at communicating information internally and externally (e.g., teams, management, outside company, etc.)
PMs leverage multiple communication methods effectively to obtain responses from team members
Programs are prioritized at a portfolio level
Organization provides opportunities for both formal training and hands on experience (including feedback)
Soft skills are highly valued
Messages are tailored to the audience
PMs are effective at communicating constraints and potential solutions
PMs check the "pulse" of the team during meetings
Trade-off decisions factor in both program and portfolio levels
Messages are conveyed with humility
PMs are effective at ensuring issues are appropriately shared across teams
PMs are able to guide team meeting discussions so they remain constructive and productive
Competitive intelligence is used to inform portfolio and product strategy
Humor is used appropriately in communications
PMs are able to effectively share the pros and cons of mitigations
Information is shared in a timely manner
PMs have real-time, high level knowledge of the project
Information sharing is concise
PMs are able to effectively communicate bad news
Information sharing is precise
PMs regularly check in with stakeholders
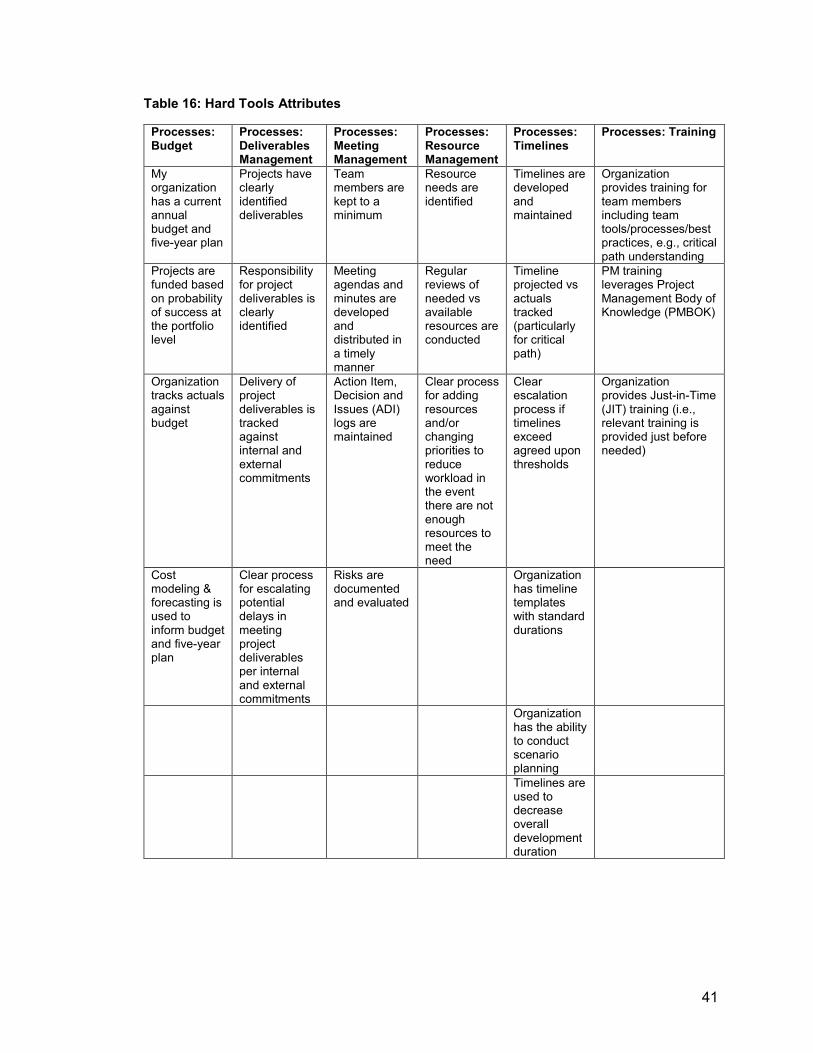
41
Table 16: Hard Tools Attributes
Processes: Budget
Processes: Deliverables Management
Processes: Meeting Management
Processes: Resource Management
Processes: Timelines
Processes: Training
My organization has a current annual budget and five-year plan
Projects have clearly identified deliverables
Team members are kept to a minimum
Resource needs are identified
Timelines are developed and maintained
Organization provides training for team members including team tools/processes/best practices, e.g., critical path understanding
Projects are funded based on probability of success at the portfolio level
Responsibility for project deliverables is clearly identified
Meeting agendas and minutes are developed and distributed in a timely manner
Regular reviews of needed vs available resources are conducted
Timeline projected vs actuals tracked (particularly for critical path)
PM training leverages Project Management Body of Knowledge (PMBOK)
Organization tracks actuals against budget
Delivery of project deliverables is tracked against internal and external commitments
Action Item, Decision and Issues (ADI) logs are maintained
Clear process for adding resources and/or changing priorities to reduce workload in the event there are not enough resources to meet the need
Clear escalation process if timelines exceed agreed upon thresholds
Organization provides Just-in-Time (JIT) training (i.e., relevant training is provided just before needed)
Cost modeling & forecasting is used to inform budget and five-year plan
Clear process for escalating potential delays in meeting project deliverables per internal and external commitments
Risks are documented and evaluated
Organization has timeline templates with standard durations
Organization has the ability to conduct scenario planning
Timelines are used to decrease overall development duration

42
Table 17: Organizational Structure Attributes
Governance Matrix organization: Teams
Efficiencies Alliance Management
General
Organization has clear escalation pathways
Cross-functional teams make product development faster, cheaper, and/or higher quality
Organizational best practices are established which are appropriate to the development phase
Organization effectively leverages partnerships to extend resources and/or capabilities
Organization has the right-sized infrastructure in place to support projects
Organization has clear decision making pathways
Cross-functional teams in my organization have a clear purpose and scope
Organizational best practices are leveraged to quickly set up teams, tools, and processes
Organization effectively leverages partnerships to share and/or reduce risks
Decisions in my organization are unambiguous and specific
Team members have clear understanding of their role
Organizational best practices lead to decreased product development time
Decisions in my organization are documented and readily retrievable
Organizational best practices are continuously improved through process improvement initiatives
Table 18: PMO Components Attributes
PM Role: General PM Role: Strategic Methodologies Alignment Roles are clearly defined for PM and team members
PMs ensure portfolio and product strategies are developed
Organization has and uses established methodologies, processes, tools, and training
PMs assist in establishing agreed upon goals and objectives
PM's scope is cross-functional
PMs help teams think strategically
Organization leverages PMBOK practices
PMs assist in establishing agreed upon product development plans
PMs ensure teams meet organizational objectives/goals
PMs track organizational progress against goals and objectives
PMs escalate issues as appropriate
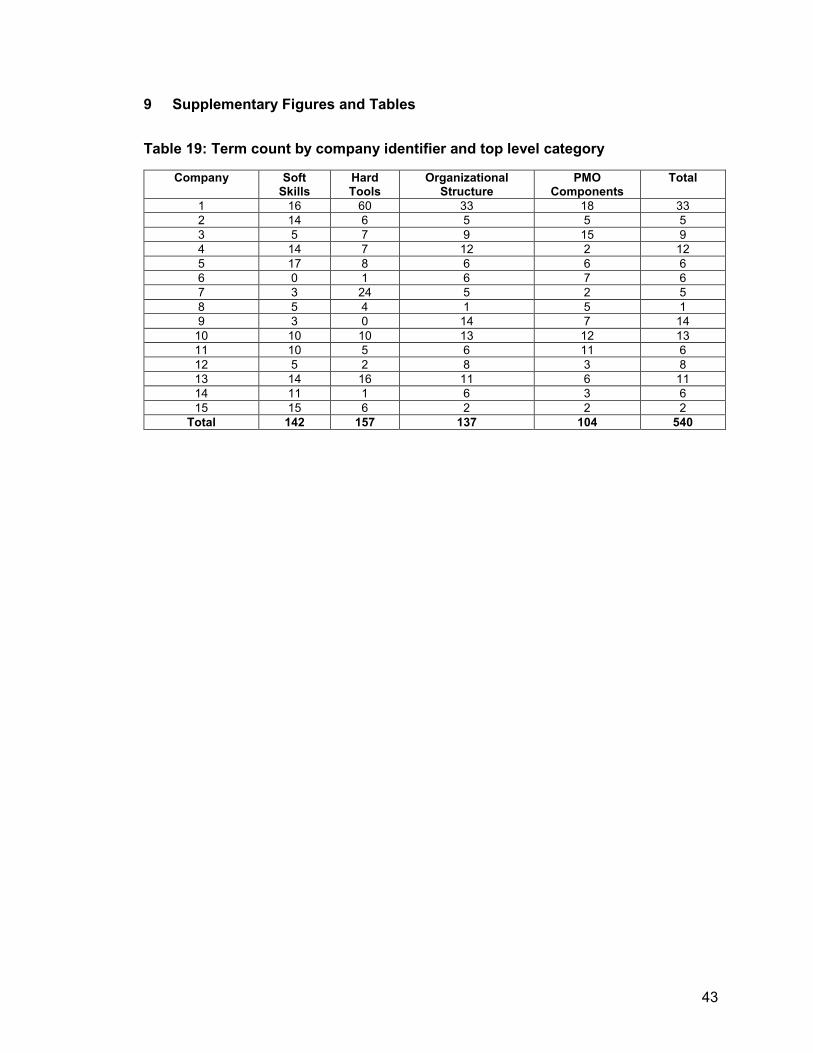
43
9 Supplementary Figures and Tables
Table 19: Term count by company identifier and top level category
Company Soft Skills
Hard Tools
Organizational Structure
PMO Components
Total
1 16 60 33 18 33 2 14 6 5 5 5 3 5 7 9 15 9 4 14 7 12 2 12 5 17 8 6 6 6 6 0 1 6 7 6 7 3 24 5 2 5 8 5 4 1 5 1 9 3 0 14 7 14
10 10 10 13 12 13 11 10 5 6 11 6 12 5 2 8 3 8 13 14 16 11 6 11 14 11 1 6 3 6 15 15 6 2 2 2
Total 142 157 137 104 540
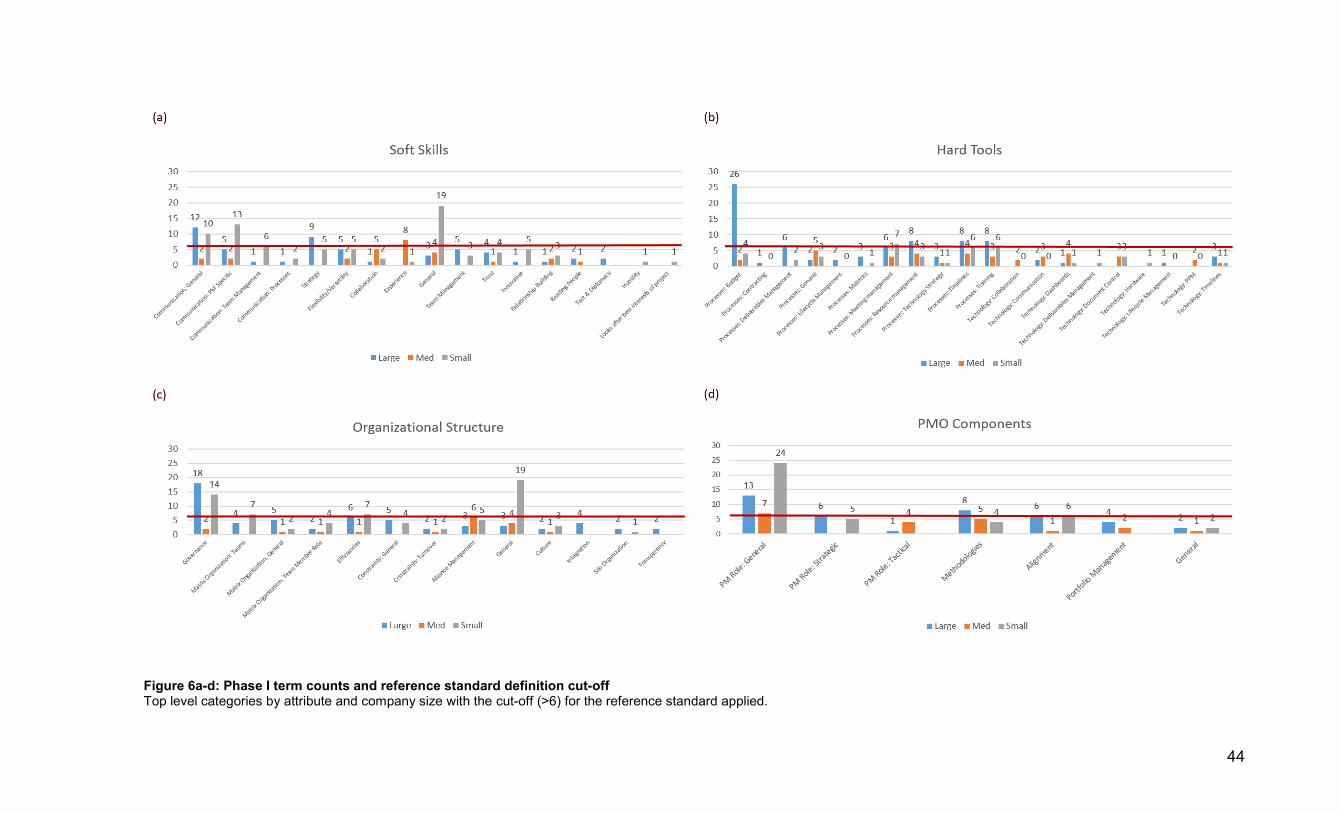
44
Figure 6a-d: Phase I term counts and reference standard definition cut-off Top level categories by attribute and company size with the cut-off (>6) for the reference standard applied.
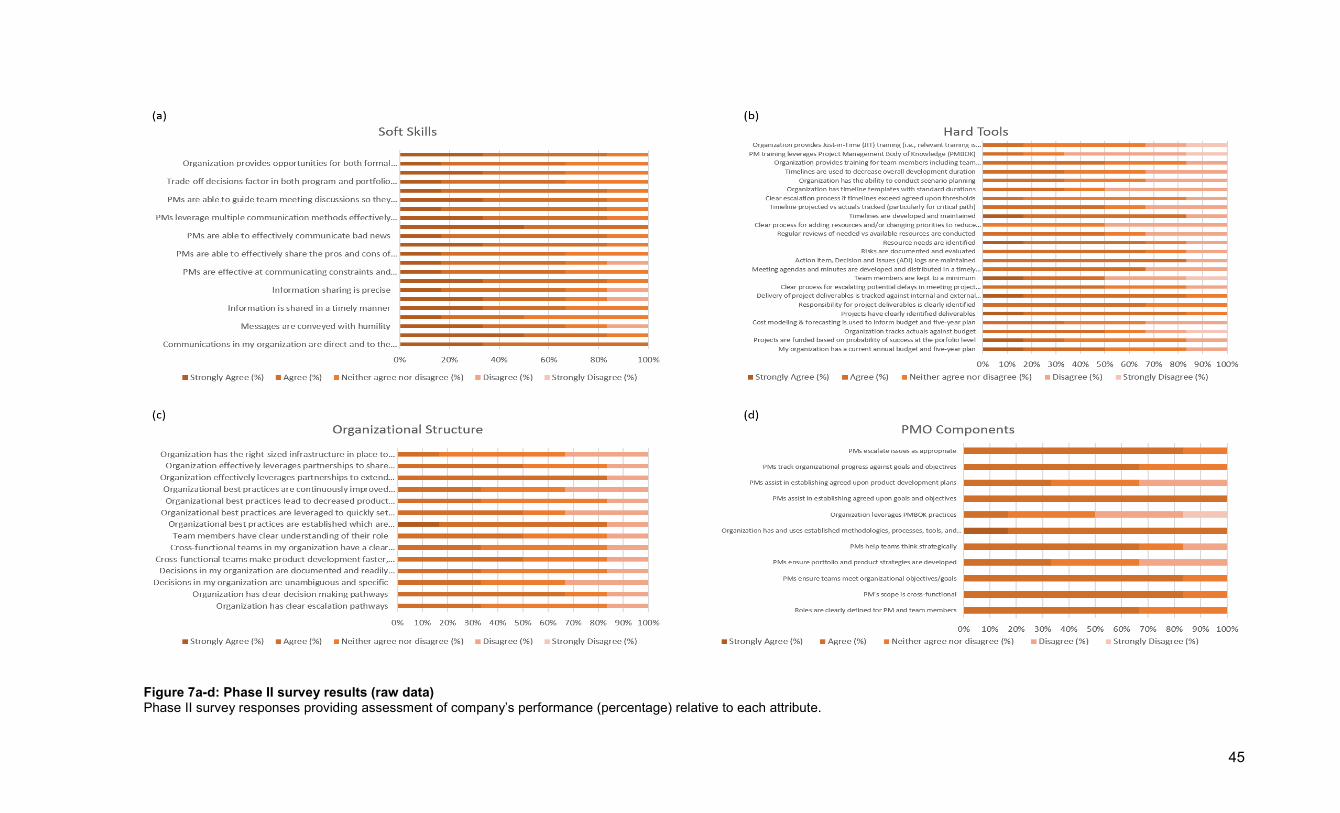
45
Figure 7a-d: Phase II survey results (raw data) Phase II survey responses providing assessment of company’s performance (percentage) relative to each attribute.

46
Figure 8a-d: Phase II survey results (mean) and evaluation cut-off Phase II comparator company survey results by top level categories relative to evaluation cut-off (>3.0 as indicated by the red line).