Best Practices for Virtualizing Exchange Server 2010 With Windows Server
Upload
vuongkhuongCategory
view
225download
2
Share:
© 2013, SolarWinds Worldwide, LLC. All rights reserved.
Best Practices for Web
Server Monitoring: Top 4
Performance Metrics for Windows
Servers
Share: 2
Why Monitor Windows® Servers?
Windows server monitoring is essential because it ensures maximum end-user productivity by keeping Windows
servers up and running at all times. Monitoring helps you identify issues with the operating system or applications
running on the servers.
If there’s an underlying problem with the hardware, the application may not function correctly. An unforeseen
hardware failure (hard drive, fan) can take down your application without warning.
A server monitoring tool will keep an eye on the hardware of your Windows servers.
Some of the challenges you may face if you do not use a server monitoring tool include:
Unknown server availability
Limited access to resources
Inadequate visibility into server performance metrics and statistics
Inability to monitor virtual machines running within the server
Top 4 Performance Metrics to Monitor on Your Windows Servers
Regardless of the server’s role, there are basic performance metrics that you should monitor. Look at the following
performance metrics in your Windows server to identify what issues might be occurring.
CPU Utilization
When experiencing an application or server performance issue in your environment, the metric you would
consider first is the affected server’s CPU utilization. This metric provides insights into how large a load is being
placed on the servers’ processor at any given time. A high sustained CPU utilization may be indicative of
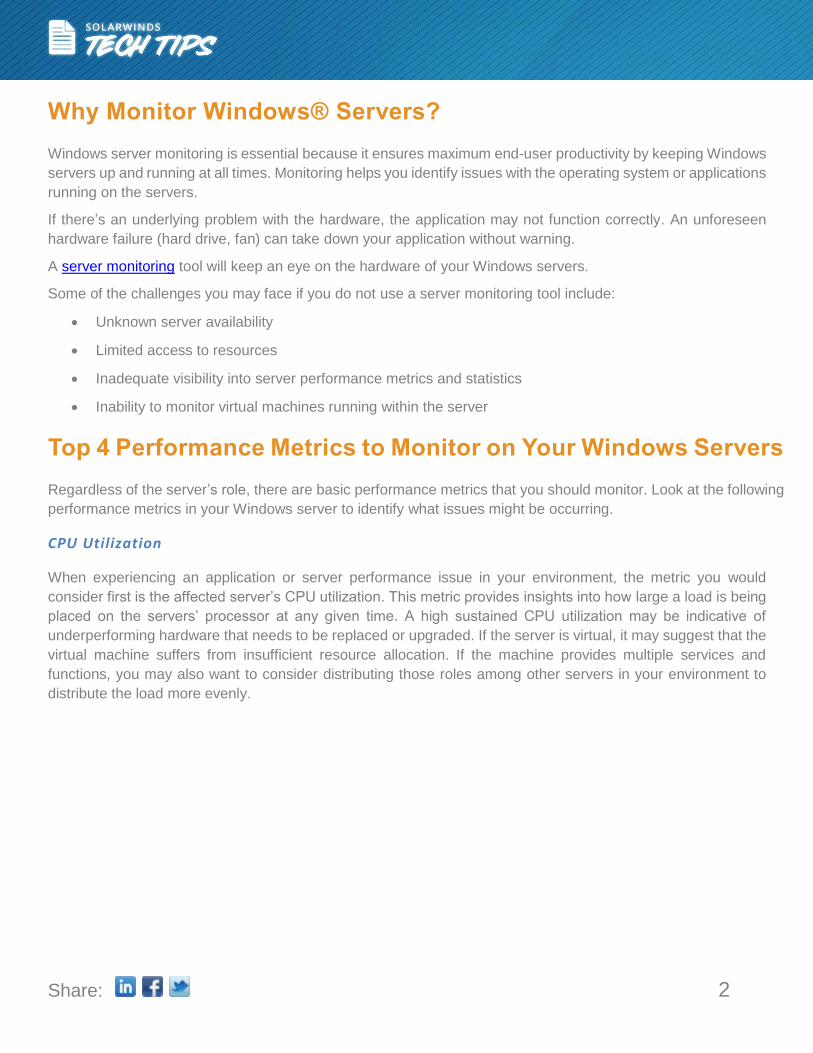
underperforming hardware that needs to be replaced or upgraded. If the server is virtual, it may suggest that the
virtual machine suffers from insufficient resource allocation. If the machine provides multiple services and
functions, you may also want to consider distributing those roles among other servers in your environment to
distribute the load more evenly.
Share: 3
Distribute the server load evenly among other servers in your environment
Physical Memory Consumption
Another likely culprit of poorly performing applications and sluggish servers is the machine’s physical memory
consumption. RAM is where the operating system stores information it uses to service applications that are
actively running on the host. When a server has an inadequate amount of memory to run both the operating
system and applications, the OS begins to temporarily move infrequently used blocks of memory to virtual
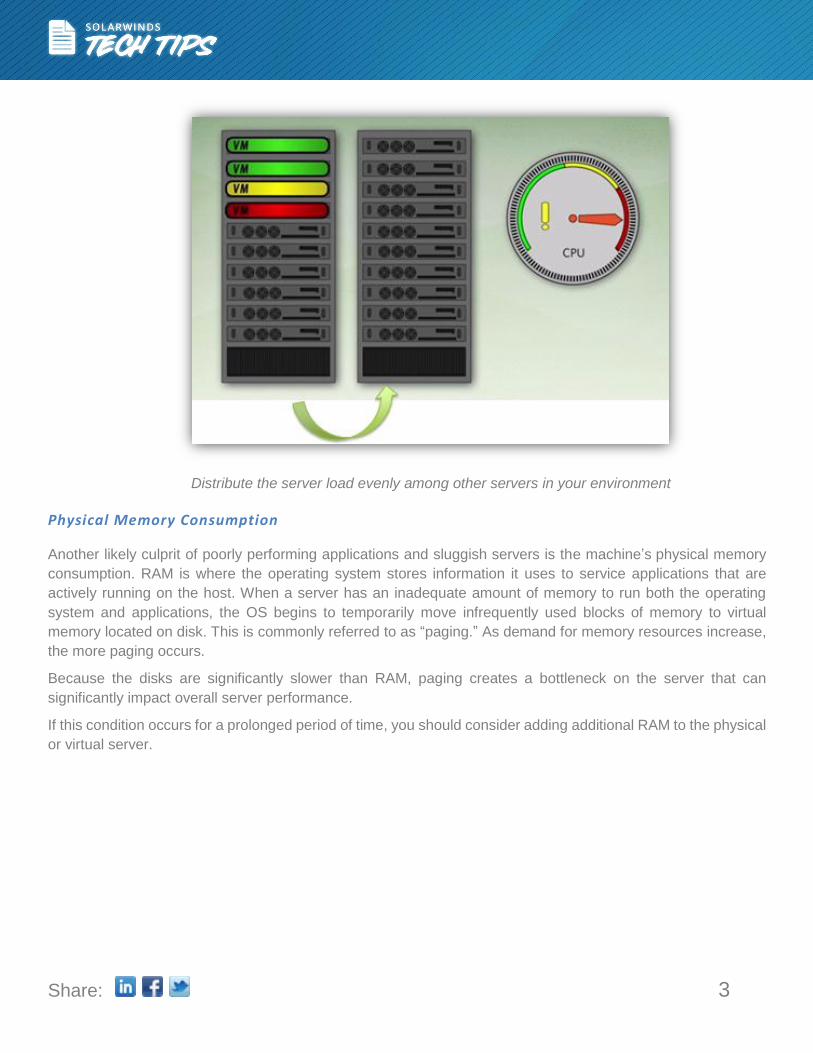
memory located on disk. This is commonly referred to as “paging.” As demand for memory resources increase,
the more paging occurs.
Because the disks are significantly slower than RAM, paging creates a bottleneck on the server that can
significantly impact overall server performance.
If this condition occurs for a prolonged period of time, you should consider adding additional RAM to the physical
or virtual server.
Share: 4
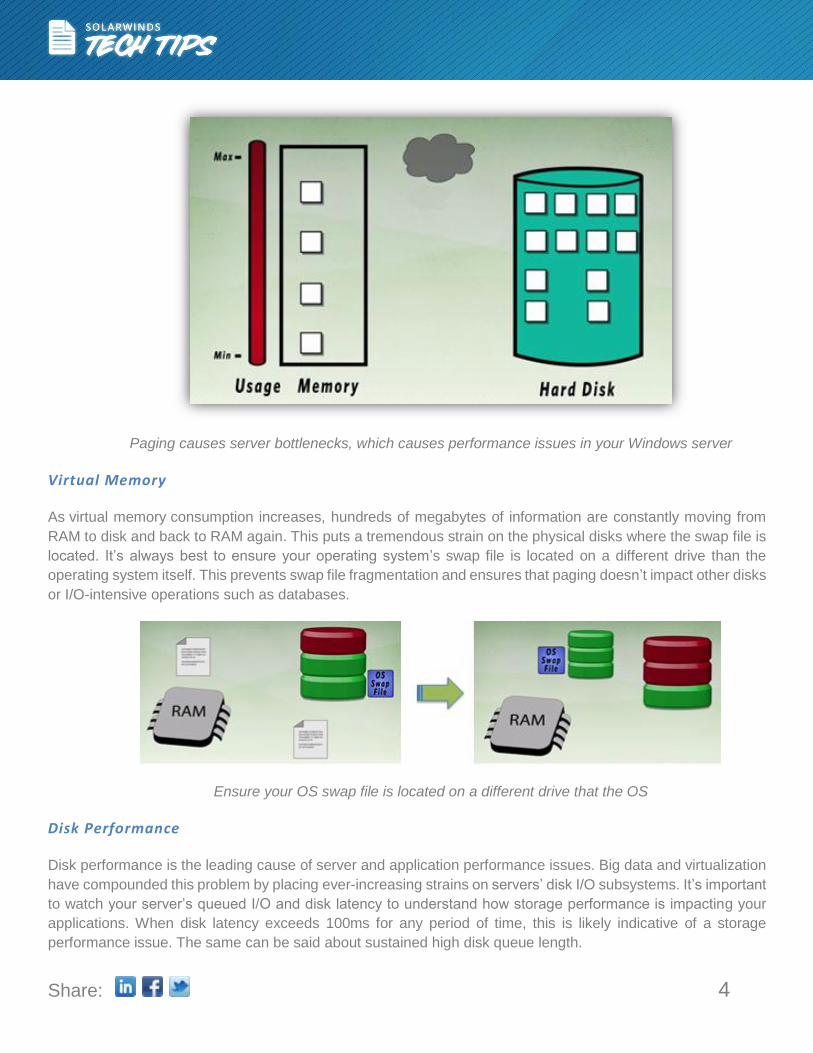
Paging causes server bottlenecks, which causes performance issues in your Windows server
Virtual Memory
As virtual memory consumption increases, hundreds of megabytes of information are constantly moving from
RAM to disk and back to RAM again. This puts a tremendous strain on the physical disks where the swap file is
located. It’s always best to ensure your operating system’s swap file is located on a different drive than the
operating system itself. This prevents swap file fragmentation and ensures that paging doesn’t impact other disks
or I/O-intensive operations such as databases.
Ensure your OS swap file is located on a different drive that the OS
Disk Performance
Disk performance is the leading cause of server and application performance issues. Big data and virtualization
have compounded this problem by placing ever-increasing strains on servers’ disk I/O subsystems. It’s important
to watch your server’s queued I/O and disk latency to understand how storage performance is impacting your
applications. When disk latency exceeds 100ms for any period of time, this is likely indicative of a storage
performance issue. The same can be said about sustained high disk queue length.
Share: 5
If your server is suffering from poor storage I/O performance, consider changing your RAID type, adding more
physical disks to your array, upgrading your storage controller to one with a larger cache, or replacing older,
slower disks with solid state or 15K SAS drives. Alternatively, you may be able to more evenly distribute your
application’s disk I/O load by moving databases, applications, and temp files across multiple disks.
SolarWinds® Server & Application Monitor
SolarWinds Server & Application Monitor (SAM) is an agentless server and application monitoring tool. SAM
monitors over 150 applications in a given IT environment. With SAM, you can discover applications and gain
visibility into the performance of your servers.
Gain visibility into the Microsoft® Windows® server performance metrics and statistics
o Leverage out-of-the-box monitors to view and manage various components of your servers and
applications
Remotely monitor WMI performance counters with SAM
o Monitor performance counters such as disk queue length, Windows page writes, and more
Keep an eye out for specific Windows server events
o Monitor Windows event log components to scan for recent events
Visualize key process statistics for your entire server farm using SAM’s real-time process explorer
Ensure ample availability of your servers using SAM’s real-time performance monitoring dashboards
Availability & Performance Monitoring of Windows Servers
To gain deeper insight into the performance statistics of your Windows server, choose the server node where
your Windows server is installed. Then drill down to the Application Details page that displays key performance
statistics and metrics of the Windows server.
SAM displays all performance metrics in the form of interactive charts and graphs. You can see the availability
status of each component within the server. You can further explore and retrieve the actual metrics and monitoring
results.
Share: 6
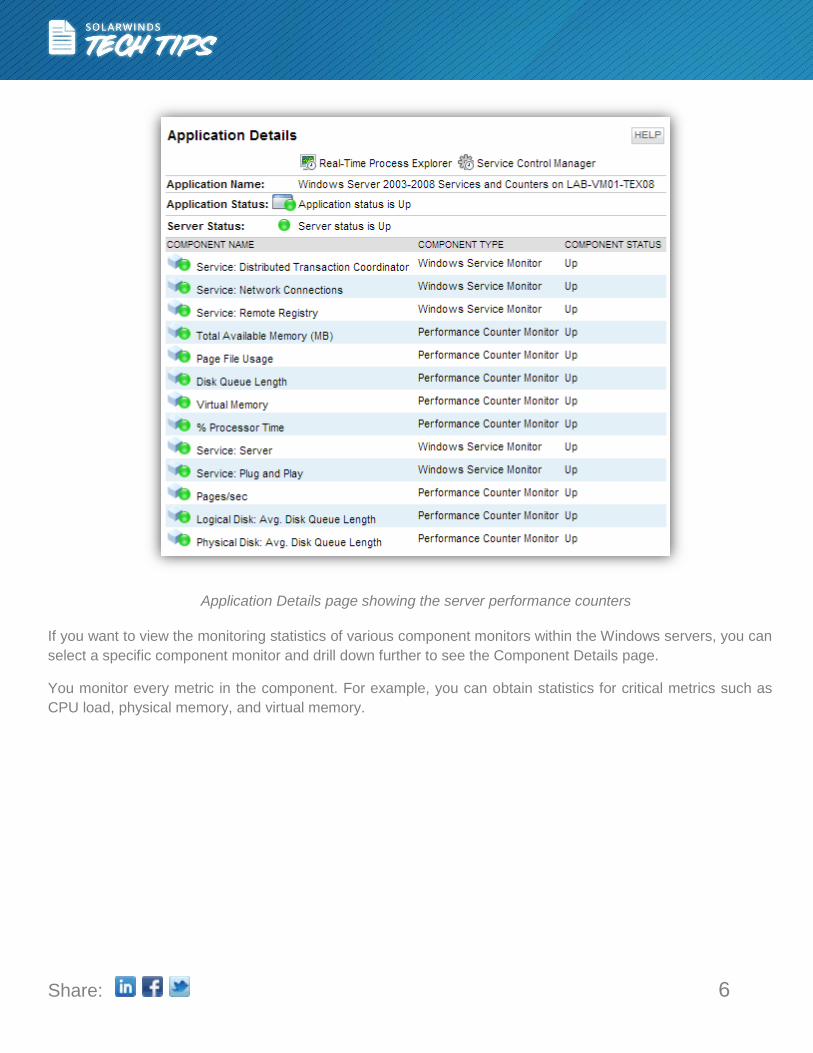
Application Details page showing the server performance counters
If you want to view the monitoring statistics of various component monitors within the Windows servers, you can
select a specific component monitor and drill down further to see the Component Details page.
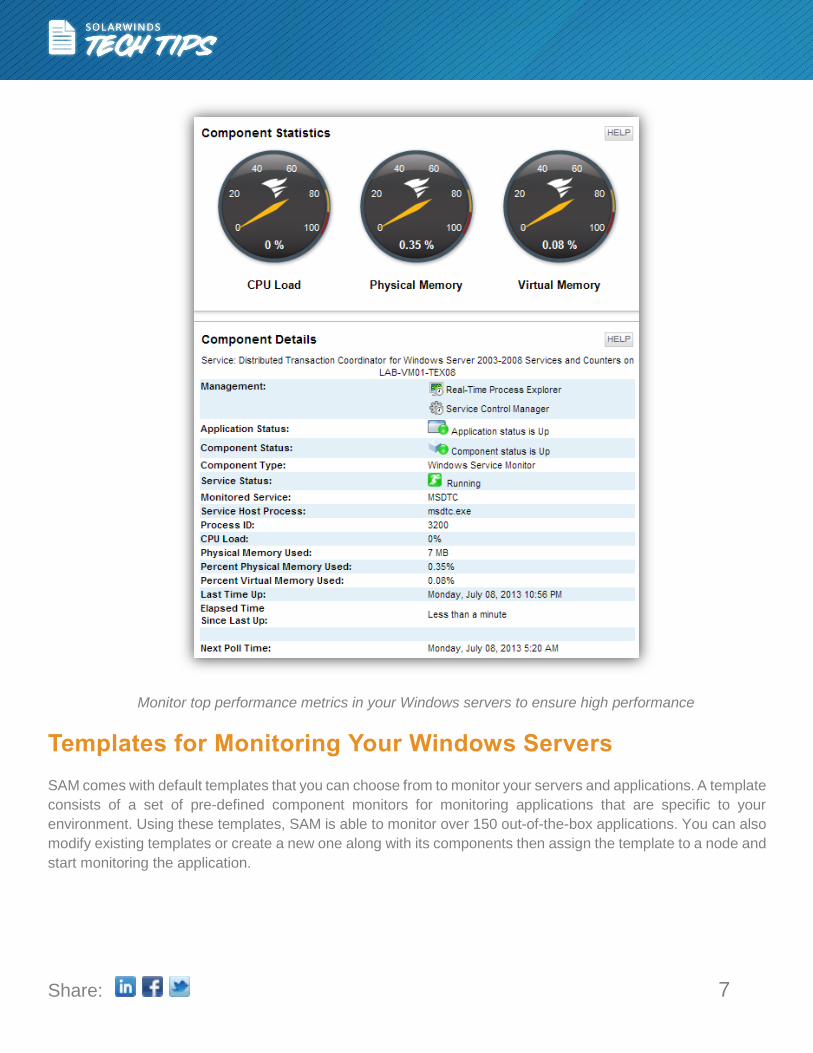
You monitor every metric in the component. For example, you can obtain statistics for critical metrics such as
CPU load, physical memory, and virtual memory.
Share: 7
Monitor top performance metrics in your Windows servers to ensure high performance
Templates for Monitoring Your Windows Servers
SAM comes with default templates that you can choose from to monitor your servers and applications. A template
consists of a set of pre-defined component monitors for monitoring applications that are specific to your
environment. Using these templates, SAM is able to monitor over 150 out-of-the-box applications. You can also
modify existing templates or create a new one along with its components then assign the template to a node and
start monitoring the application.
Share: 8
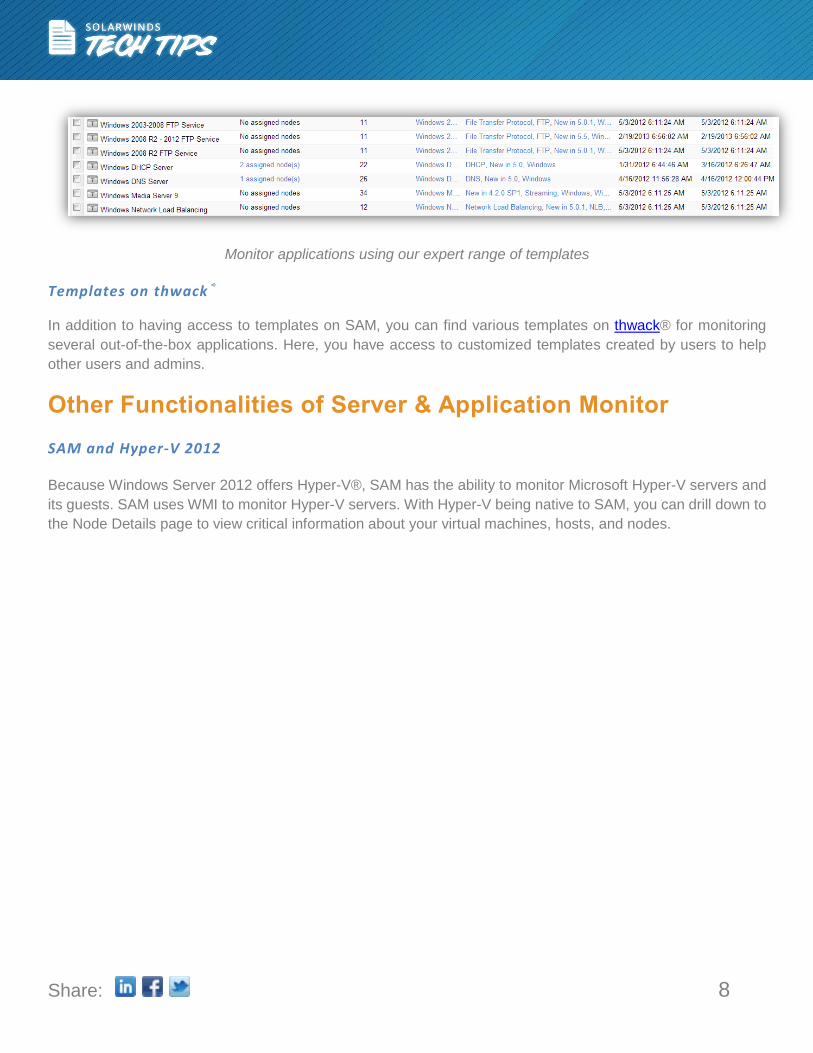
Monitor applications using our expert range of templates
Templates on thwack®
In addition to having access to templates on SAM, you can find various templates on thwack® for monitoring
several out-of-the-box applications. Here, you have access to customized templates created by users to help
other users and admins.
Other Functionalities of Server & Application Monitor
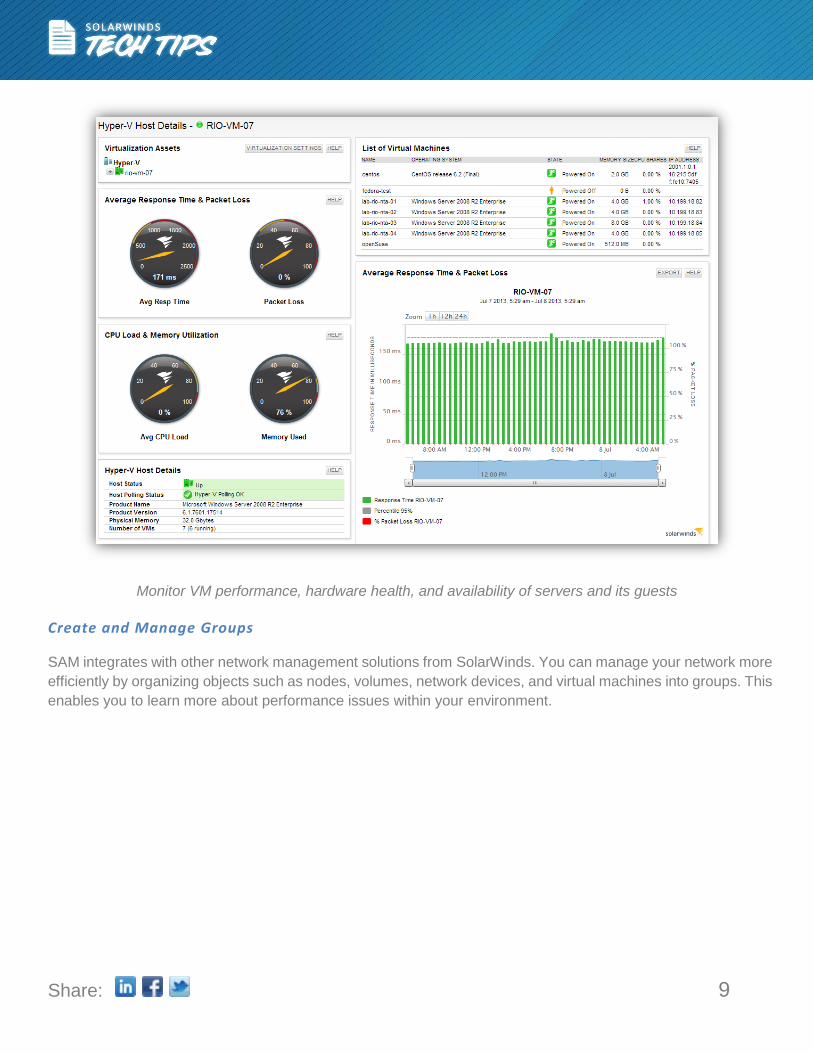
SAM and Hyper-V 2012
Because Windows Server 2012 offers Hyper-V®, SAM has the ability to monitor Microsoft Hyper-V servers and
its guests. SAM uses WMI to monitor Hyper-V servers. With Hyper-V being native to SAM, you can drill down to
the Node Details page to view critical information about your virtual machines, hosts, and nodes.
Share: 9
Monitor VM performance, hardware health, and availability of servers and its guests
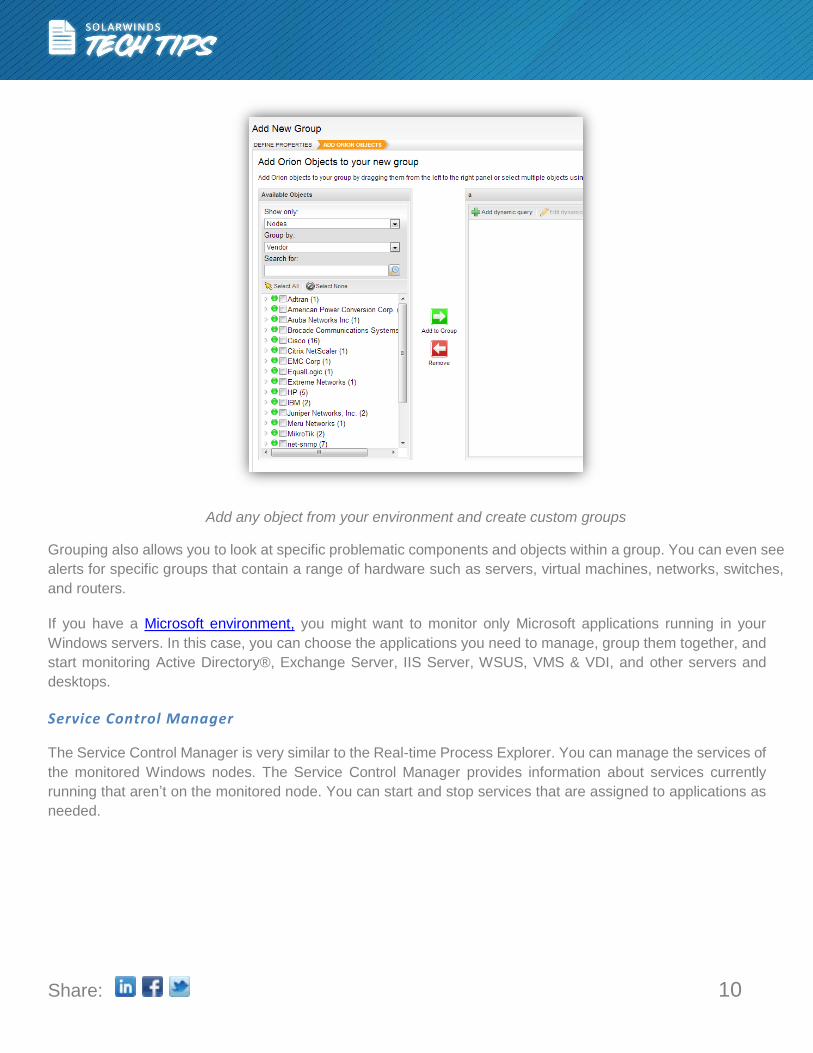
Create and Manage Groups
SAM integrates with other network management solutions from SolarWinds. You can manage your network more
efficiently by organizing objects such as nodes, volumes, network devices, and virtual machines into groups. This
enables you to learn more about performance issues within your environment.
Share: 10
Add any object from your environment and create custom groups
Grouping also allows you to look at specific problematic components and objects within a group. You can even see
alerts for specific groups that contain a range of hardware such as servers, virtual machines, networks, switches,
and routers.
If you have a Microsoft environment, you might want to monitor only Microsoft applications running in your
Windows servers. In this case, you can choose the applications you need to manage, group them together, and
start monitoring Active Directory®, Exchange Server, IIS Server, WSUS, VMS & VDI, and other servers and
desktops.
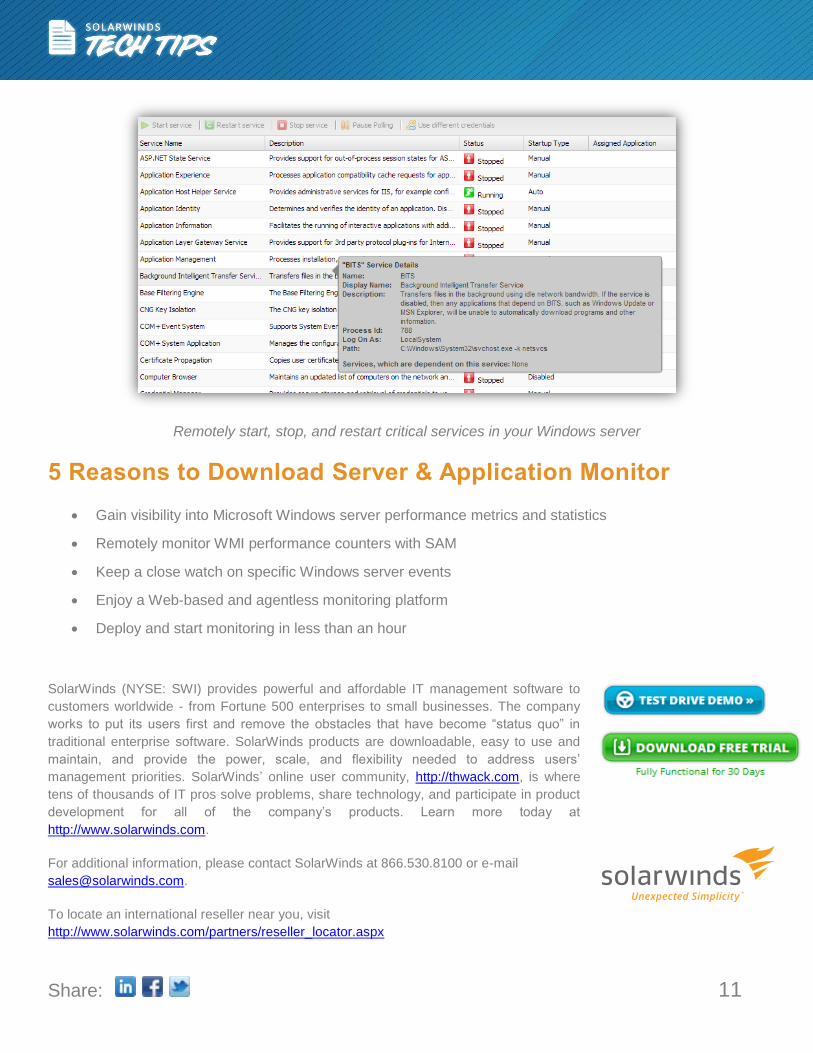
Service Control Manager
The Service Control Manager is very similar to the Real-time Process Explorer. You can manage the services of
the monitored Windows nodes. The Service Control Manager provides information about services currently
running that aren’t on the monitored node. You can start and stop services that are assigned to applications as
needed.
Share: 11
Remotely start, stop, and restart critical services in your Windows server
5 Reasons to Download Server & Application Monitor
Gain visibility into Microsoft Windows server performance metrics and statistics
Remotely monitor WMI performance counters with SAM
Keep a close watch on specific Windows server events
Enjoy a Web-based and agentless monitoring platform
Deploy and start monitoring in less than an hour
SolarWinds (NYSE: SWI) provides powerful and affordable IT management software to
customers worldwide - from Fortune 500 enterprises to small businesses. The company
works to put its users first and remove the obstacles that have become “status quo” in
traditional enterprise software. SolarWinds products are downloadable, easy to use and
maintain, and provide the power, scale, and flexibility needed to address users’
management priorities. SolarWinds’ online user community, http://thwack.com, is where
tens of thousands of IT pros solve problems, share technology, and participate in product
development for all of the company’s products. Learn more today at
http://www.solarwinds.com.
For additional information, please contact SolarWinds at 866.530.8100 or e-mail
To locate an international reseller near you, visit
http://www.solarwinds.com/partners/reseller_locator.aspx


![Websphere Server 8.5 Best Practices Oracle FLEXCUBE ... … · Websphere Server 8.5 Best Practices Oracle FLEXCUBE Universal Banking Release 14.1.0.0.0 [May] [2018]](https://static.fdocuments.us/doc/165x107/5f45cbe8fdf0580622422217/websphere-server-85-best-practices-oracle-flexcube-websphere-server-85.jpg)