Best practices and benchmarks for intact protein analysis ...
9
HAL Id: pasteur-02331018 https://hal-pasteur.archives-ouvertes.fr/pasteur-02331018 Submitted on 24 Oct 2019 HAL is a multi-disciplinary open access archive for the deposit and dissemination of sci- entific research documents, whether they are pub- lished or not. The documents may come from teaching and research institutions in France or abroad, or from public or private research centers. L’archive ouverte pluridisciplinaire HAL, est destinée au dépôt et à la diffusion de documents scientifiques de niveau recherche, publiés ou non, émanant des établissements d’enseignement et de recherche français ou étrangers, des laboratoires publics ou privés. Distributed under a Creative Commons Attribution| 4.0 International License Best practices and benchmarks for intact protein analysis for top-down mass spectrometry Daniel Donnelly, Catherine Rawlins, Caroline Dehart, Luca Fornelli, Luis Schachner, Ziqing Lin, Jennifer Lippens, Krishna Aluri, Richa Sarin, Bifan Chen, et al. To cite this version: Daniel Donnelly, Catherine Rawlins, Caroline Dehart, Luca Fornelli, Luis Schachner, et al.. Best prac- tices and benchmarks for intact protein analysis for top-down mass spectrometry. Nature Methods, Nature Publishing Group, 2019, 16 (7), pp.587-594. 10.1038/s41592-019-0457-0. pasteur-02331018
Transcript of Best practices and benchmarks for intact protein analysis ...

HAL Id: pasteur-02331018https://hal-pasteur.archives-ouvertes.fr/pasteur-02331018
Submitted on 24 Oct 2019
HAL is a multi-disciplinary open accessarchive for the deposit and dissemination of sci-entific research documents, whether they are pub-lished or not. The documents may come fromteaching and research institutions in France orabroad, or from public or private research centers.
L’archive ouverte pluridisciplinaire HAL, estdestinée au dépôt et à la diffusion de documentsscientifiques de niveau recherche, publiés ou non,émanant des établissements d’enseignement et derecherche français ou étrangers, des laboratoirespublics ou privés.
Distributed under a Creative Commons Attribution| 4.0 International License
Best practices and benchmarks for intact proteinanalysis for top-down mass spectrometry
Daniel Donnelly, Catherine Rawlins, Caroline Dehart, Luca Fornelli, LuisSchachner, Ziqing Lin, Jennifer Lippens, Krishna Aluri, Richa Sarin, Bifan
Chen, et al.
To cite this version:Daniel Donnelly, Catherine Rawlins, Caroline Dehart, Luca Fornelli, Luis Schachner, et al.. Best prac-tices and benchmarks for intact protein analysis for top-down mass spectrometry. Nature Methods,Nature Publishing Group, 2019, 16 (7), pp.587-594. �10.1038/s41592-019-0457-0�. �pasteur-02331018�
PersPectivehttps://doi.org/10.1038/s41592-019-0457-0
1Barnett Institute of Chemical and Biological Analysis and Departments of Chemistry & Chemical Biology and Pharmaceutical Sciences, Northeastern University, Boston, MA, USA. 2Departments of Chemistry and Molecular Biosciences and the Proteomics Center of Excellence, Northwestern University, Evanston, IL, USA. 3Department of Cell and Regenerative Biology, Department of Chemistry, Human Proteomics Program, University of Wisconsin-Madison, Madison, WI, USA. 4Amgen Research, Discovery Attribute Sciences, Amgen, Thousand Oaks, CA, USA. 5Alnylam Pharmaceuticals, Cambridge, MA, USA. 6Biogen, Cambridge, MA, USA. 7Department of Chemistry and Biochemistry, Department of Biological Chemistry, and UCLA/DOE Institute of Genomics and Proteomics, University of California, Los Angeles, Los Angeles, CA, USA. 8Bruker Daltonics, Billerica, MA, USA. 9Biopharmaceutical Analysis Training Laboratory, Northeastern University, Burlington, MA, USA. 10The Pasarow Mass Spectrometry Laboratory, The Jane and Terry Semel Institute for Neuroscience and Human Behavior, David Geffen School of Medicine, University of California, Los Angeles, Los Angeles, CA, USA. 11Environmental Molecular Sciences Laboratory, Pacific Northwest National Laboratory, Richland, WA, USA. 12Mass Spectrometry for Biology Unit, Institut Pasteur, USR 2000, CNRS, Paris, France. 13Eastwoods Consulting, Boylston, MA, USA. 14Department of Chemistry, Genome Center of Wisconsin, University of Wisconsin-Madison, Madison, WI, USA. 15Spectroswiss, Lausanne, Switzerland. 16These authors contributed equally: Daniel P. Donnelly, Catherine M. Rawlins. *e-mail: [email protected]
Mutations, polymorphisms, RNA processing and post-translational modifications (PTMs) such as acetylation, methylation and phosphorylation can lead to a single gene
producing many functionally distinct ‘proteoforms’1. These proteo-forms can have different effects on important biological processes, including gene regulation, cell signaling and protein activity; con-sequently, the ability to characterize these species is essential for an understanding of the biological response to disease. The identity of a proteoform can often be inferred2 from an accurate experimentally determined intact mass3. One can increase the sensitivity of intact-mass-based proteoform identification by determining the relative abundance of a particular amino acid by using isotopic labeling, by using mass similarities to cluster proteoforms into gene families and by reducing the search space using sample-specific search data-bases2. Localizing PTMs, and in some cases the definitive proteo-form identifier, requires tandem mass spectrometry (MSn) analysis. The measurement of intact protein mass followed by MSn has been coined ‘top-down’ mass spectrometry4–8, with its origins in Fenn and colleagues’ discovery that large biomolecules could be ionized9 and fragmented10–12 using electrospray ionization (ESI)-MS. Top-down MS protocols, unlike widely used bottom-up protocols13,14, do not require endoproteinase digestion before analysis, do not con-flate proteoforms and tend to complement native MS analysis.
One advantage of ESI over the alternative ‘soft’ ionization method, matrix-assisted laser desorption-ionization (MALDI), is
that ESI imparts more charge per protein. This enables the mass determination of large biomolecules using mass analyzers with moderate mass-to-charge ratio upper limits (for example, m/z ≤ 4,000), which happen to offer the highest resolving power. Higher charge per molecular mass also facilitates gas-phase fragmentation and, therefore, the characterization of primary sequence and PTMs by MSn (refs. 15,16). Because of this superior fragmentation and the ability to interface with liquid chromatography (LC) systems, ESI is used for most top-down MS experiments. Projects requiring rapid MS analysis17, the ability to analyze hundreds of proteins in a single spectrum, protein imaging capabilities, or less signal suppression by common protein buffer components18 may be better suited for MALDI-MS.
Compared to bottom-up workflows, top-down approaches pro-vide additional layers of information, including detecting modi-fications that are removed or scrambled19 during peptide sample preparation (for example, S-thiolation), elucidating functional relationships (for example, cross-talk) between PTMs on the same protein molecule, characterizing drug–target interactions, observ-ing important modifications on biopharmaceuticals, and identi-fying and quantifying distinct proteoforms that would have been convoluted by endoproteinase digestion20–24. In addition, sample preparation for intact protein MS comprises fewer steps than bot-tom-up approaches and does not require chemical modification (for example, reduction and alkylation), thereby reducing the number of
Best practices and benchmarks for intact protein analysis for top-down mass spectrometryDaniel P. Donnelly 1,16, Catherine M. Rawlins1,16, Caroline J. DeHart2, Luca Fornelli2, Luis F. Schachner 2, Ziqing Lin3, Jennifer L. Lippens 4, Krishna C. Aluri 1,5, Richa Sarin 1,6, Bifan Chen 3, Carter Lantz7, Wonhyeuk Jung7, Kendall R. Johnson1, Antonius Koller1, Jeremy J. Wolff8, Iain D. G. Campuzano 4, Jared R. Auclair 9, Alexander R. Ivanov1, Julian P. Whitelegge 10, Ljiljana Paša-Tolić 11, Julia Chamot-Rooke 12, Paul O. Danis13, Lloyd M. Smith14, Yury O. Tsybin 15, Joseph A. Loo 7, Ying Ge 3, Neil L. Kelleher 2 and Jeffrey N. Agar 1*
One gene can give rise to many functionally distinct proteoforms, each of which has a characteristic molecular mass. Top-down mass spectrometry enables the analysis of intact proteins and proteoforms. Here members of the Consortium for Top-Down Proteomics provide a decision tree that guides researchers to robust protocols for mass analysis of intact proteins (antibodies, membrane proteins and others) from mixtures of varying complexity. We also present cross-platform analytical benchmarks using a protein standard sample, to allow users to gauge their proficiency.
NATURe MeTHODS | VOL 16 | JULY 2019 | 587–594 | www.nature.com/naturemethods 587
PersPective NaTure MeTHODs
experimental artifacts25. Current top-down sample cleanup meth-ods (for example, protein precipitation26 and molecular weight cut-off (MWCO) ultrafiltration) are not applicable to all sample types or downstream MS analyses. The demand for robust, generally appli-cable methods for intact protein MS is the most common request made to members of the Consortium for Top-Down Proteomics27,28 (http://topdownproteomics.org/).
Our goal here is to address this unmet need, by providing a guide to enable users with all levels of expertise to acquire high-quality intact protein mass spectra by ESI-MS. First we discuss signal suppression associated with common buffer components and biotherapeutic excipients. This provides the rationale for most failed intact MS measurements and, in addition, a path to designing MS-compatible buffers. Then, we present a decision tree based on sample composition and experimental goals, which guides users to a best-practices protocol and corresponding benchmark data.
Origins of signal suppression and signal spreadingBiological, biochemical and biotherapeutic sample preparations usually contain numerous interfering substances (for example, salts, detergents, chaotropes and buffers) that lead to signal sup-pression during ESI-MS analysis. To provide a theoretical context, we describe the two major drivers of the quality of intact protein (positive ion) ESI-MS and how these are affected by interfering sub-stances. The first driver of quality is the formation of desolvated protein ions, which can be understood in terms of a few critical steps during the ESI process16,29,30. Interfering substances generally affect the ESI process after the formation of nanodroplets at the Rayleigh charge limit. Two salient, often opposing, processes that occur within these nanodroplets are the partitioning of net charge toward the droplet surface and the minimization of solvation energy. Polar species such as salts and native proteins partition toward the drop-let interior to optimize solvation energy; their ionization, therefore, requires evaporation of solvent molecules16. Hydrophobic species such as detergent monomers and unfolded proteins migrate to the droplet surface to optimize solvation energy and, in a faster pro-cess that requires less energy, evaporate or are ejected. Many of the techniques presented here for reducing signal suppression can be rationalized within the framework above. For example, organic sol-vents that decrease surface tension should promote the ionization of both polar and nonpolar analytes; detergents partition to the sur-face, where they can outcompete analytes for a limited number of protons; organic solvents and acids that unfold proteins should pro-mote ejection-based ionization; native MS (nMS) requires greater desolvation energy and is more sensitive to polar contaminants.
The second driver of the quality of intact protein MS is signal spreading (that is, the distribution of the signal from a single pro-teoform across multiple channels), which increases with protein mass. Each channel has its own respective noise; consequently, the cumulative noise increases proportionally to the number of chan-nels. The ESI process promotes signal spreading, via adduct forma-tion, by increasing the concentrations of interfering substances and proteins. Heavy isotopes and charge states further distribute signal intensity across multiple channels; the former can be mitigated by isotope depletion31. Here we describe experimental techniques that minimize signal spreading (increase signal-to-noise ratio, or S/N), including using nMS to reduce the number of charge states, and the use of volatile salts (for example, ammonium acetate) or purifica-tion to minimize the effects of alkaline salts.
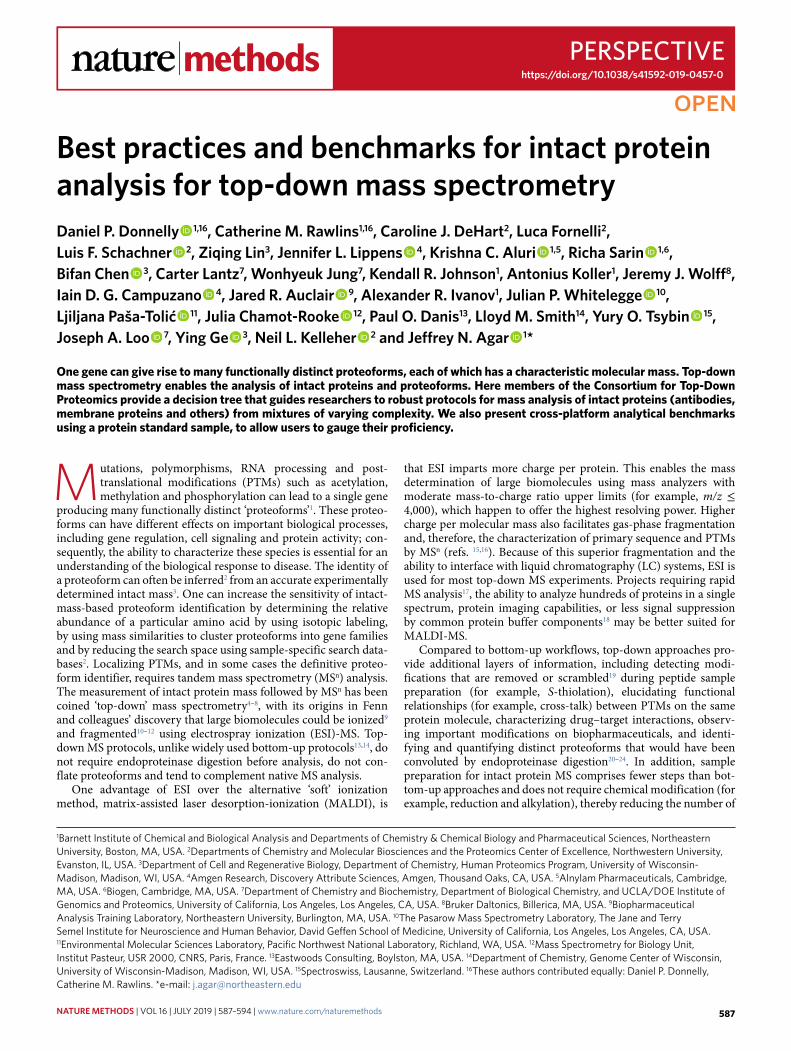
Signal suppression by common buffer componentsUsing the intact protein standard mixture (ubiquitin, myoglobin, trypsinogen and carbonic anhydrase) established by the National Resource for Translational and Developmental Proteomics (NRTDP) (http://nrtdp.northwestern.edu/protocols/), we evaluated common buffer components (Fig. 1) to quantify the concentration
required for 50% signal suppression during direct infusion ESI. By analogy to half-maximum inhibitory concentration (IC50) nomen-clature, we termed this metric the half-maximum suppression con-centration (SC50) (Fig. 1, Supplementary Fig. 1). At their typical concentrations, all common buffer additives suppressed ESI signal considerably. Consistent with the mechanisms of ESI ionization described above, detergents produced the most signal suppression,
6.0
6.0Control
a
2.5
2.5
6.0
2.5
Frac
tion
of s
igna
l los
t
1
MgCl2 (µm)
2.5 mM MgCl2
100 µM MgCl2
MgCl2 signal suppression
2,5000
b
500
c
2,4001,200600
Type
Salts
Chaotropes
Detergents*
Component
Sodium chloride
Magnesium chloride
Guanidinium chloride
Urea
Triton X-100
Tween 20
Ammonium sulfate
SDS
Tris base
HEPES
PBS
Antibody formulation
Buffers
SC50
1.5 mM
25 µm
1.1 mM
38 µm
600 µm
1.7 µm
4.2 µm
1.3 µm
91 µm
600 µm
31 µm
3.4 µm
1,800
Inte
nsity
(×
108)
m/z
Fig. 1 | Common buffer components suppress MS signal. a, MgCl2 reduces signal (and S/N) in a concentration-dependent manner. b, Fit of experimental data to determine the concentration of MgCl2 required for 50% signal suppression (SC50; black arrow), c, Table of common buffer components and the concentration threshold for 50% SC50 (experimental data curves and their fits are shown in Supplementary Fig. 1) and calculations in Supplementary Note 2. Detergents compatible with mass spectrometry are discussed in Protocol 2b. *Signal suppression by detergents is less pronounced above their critical micellar concentration (CMC) (described in Protocol 2b).
NATURe MeTHODS | VOL 16 | JULY 2019 | 587–594 | www.nature.com/naturemethods588

PersPectiveNaTure MeTHODs
less volatile (for example, metallic) salts produced intermediate sup-pression and volatile components lowest suppression. Additional details of the experimental parameters used here are provided in Supplementary Notes 1 and 2.
The SC50 values given in Fig. 1 allow users to design MS-compatible buffers. In addition, the SC50 and buffer composi-tion serve as the entry point into the decision tree outlined below, leading users to the appropriate protocol. Although the trends in SC50 values reported here should generally be consistent across MS platforms, parameter-dependent variations in the reported values are likely (in particular, flow rate, voltages, temperatures, and pres-sures that affect ionization and desolvation). Here, for example, we calculated SC50 obtained by direct infusion using a standard micro-flow ESI source (about a microliter per minute), but nano-ESI (less than a microliter per minute) is less affected by salts because of the order-of-magnitude decrease in initial droplet size32,33.
Intact protein MS (IPMS) decision treeThe IPMS decision tree (Fig. 2) directs practitioners to a protocol or a combination of protocols based on buffer composition, the number of proteins in the sample, and whether native or denaturing conditions are to be used. Consider, for example, a purified pro-tein in phosphate-buffered saline (PBS). Based on the 1.5 mM SC50 exhibited by NaCl (Fig. 1c) and the 137 mM NaCl present in PBS, a protein sample in PBS requires a 91-fold dilution to achieve 50% of the potential MS signal. Therefore, if the protein concentration is greater than 90 µM and salt adducts will not impede data analysis, the sample can be diluted following Protocol 1. Otherwise, sample cleanup by ultrafiltration using spin cartridges with a MWCO-membrane is recommended following Protocol 2.
Interest in certain PTMs (for example, metallation) or pro-tein complex quaternary structure would dictate the use of native MS methods following Protocol 4b; otherwise the denaturing MS Protocol 4a is recommended. Depending on the complexity of the sample, additional separation techniques such as GELFrEE may be required (Supplementary Fig. 2). The objective of this decision tree is to provide a proven workflow for any sample, not to rule out alternative methods. For example, depending on sample stability, user expertise and available resources, precipitation (Protocol 3), size exclusion ‘spin cartridges’, or LC (Protocol 5) could be suitable alternatives to MWCO ultrafiltration. All protocols and bench-marks referenced by the decision tree and alternative methods are summarized below and further detailed in Supplementary Notes 1−5 and Supplementary Protocols 1−5.
Protein standards and benchmarksTo promote standardization and allow users to benchmark their own data using readily available proteins, we provided represen-tative results for each protocol using the following commercially available standards: (i) the NRTDP intact protein standard mix-ture (see Supplementary Note 1 for preparation instructions), (ii) NIST monoclonal antibody reference material 8671 (NISTmAb), containing humanized IgG1ĸ in 12.5 mM L-histidine, 12.5 mM L-histidine HCl (pH 6.0), and (iii) Sigma bacteriorhodopsin from Halobacterium salinarum (B0184). Benchmarks for mass accu-racy depend upon the instrumentation platform and have been reviewed3,34–39. Rules of thumb include requiring 10 p.p.m. accuracy for modern Fourier transform MS and 20 p.p.m. accuracy for mod-ern quadrupole time-of-flight (QTOF) MS. We suggest the use of ProForma notation40 for standardized proteoform nomenclature, and note that the PeptideMass tool (https://web.expasy.org/pep-tide_mass/) can be used to calculate the mass of a given sequence or of proteoforms contained in the UniProt database.
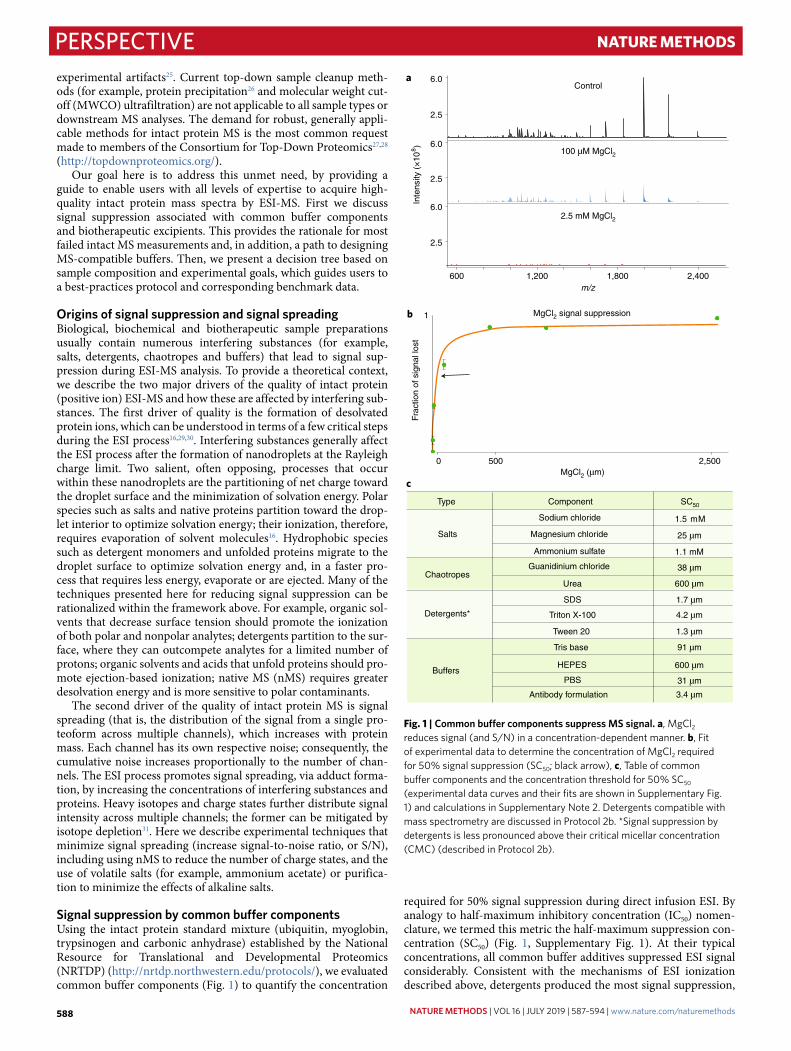
Protocol 1: sample preparation by dilution of interfering substancesConsistent with the mechanisms of ESI and signal spreading detailed above, common buffer components render proteins undetectable by MS (Fig. 3). Minimally complex, concentrated protein solutions can often be analyzed by direct infusion, following dilution to ~1 µM final protein concentration in the appropriate sample buffer. Users should consider using this protocol if dilution can decrease the con-centration of a given interfering substance below its SC50 value (Fig. 1, Supplementary Protocol 1). Assuming a practical upper limit of ~10 mM protein concentration, this protocol is potentially appli-cable to any of the components listed in Fig. 1. As detailed above, however, nMS utilizes an ESI process that is more sensitive to many interferents, including salts. Consequently, dilution is less likely to adequately improve nMS. Protocol 4 describes methods to dilute native proteins into whichever solution will be used to introduce samples to the MS. However, mass spectra obtained by this method have the lowest S/N of any of the protocols described here and may contain adducts.
Protocol 2: sample preparation using MWCO ultrafiltrationWe recommend remediating nonvolatile salt adducts by buffer exchange into a solution of volatile salts. The MWCO of the ultra-filtration device should not exceed half the molecular mass of any given protein in a sample to prevent possible sample loss. No par-ticular pH is optimal for all proteins, but pH extremes should be avoided, as should pH that is equivalent to a protein’s pI, where protein solubility is at a local minimum41. We recommend using ammonium acetate throughout these protocols owing to its volatil-ity and ability to act as a stabilizing background electrolyte during ESI42. Ammonium acetate provides maximal buffering around pH 4.75 (acetate) and 9.25 (ammonium), and results in a neutral pH
Sample
1–5proteins
5–100proteins
>100proteins
Signalsuppression
Protocol 1Dilution
MS-compatiblebuffer
Dilutioncan
rescuesignal
Contains detergents
Denatured Native
Native* Denatured
SF.22D
Protocol 3†
Precipitation
Protocol 5Reversed-phase‡
LC
Protocol 4bNative
direct infusion
Protocol 4aDenaturing
direct infusion
Protocol 2aUltrafiltration
Protocol 2b
Fig. 2 | Decision tree for intact protein sample clean-up, preparation and analysis. The red dashed line, for example, denotes the decision path for the native MS analysis of a membrane protein. *LC can also be applied at this stage in the decision tree. †Minimally complex protein samples prepared following Protocol 3 can be analyzed via denaturing direct infusion (Protocol 4a) if desired. Supplementary Fig. 2 (SF.2) shows a recommended example of 2D separation following the GELFrEE protocol. ‡Other viable alternative separation techniques include capillary zone electrophoresis, ion exchange and size exclusion chromatography.
NATURe MeTHODS | VOL 16 | JULY 2019 | 587–594 | www.nature.com/naturemethods 589
PersPective NaTure MeTHODs
upon dissolving in water (approximate pH 6.5−7). Before adding protein sample, MWCO-ultrafiltration devices should be rinsed with the appropriate buffer. Additional details for this method can be found in Supplementary Protocol 2.
Protocol 2a, soluble proteins. On the basis of the protein masses in the NRTDP intact protein standard, we recommend using a MWCO of 3 kDa according to the manufacturer’s instructions. The protein preparation should be subjected to three (1:20 dilution) buffer exchanges into 10 mM ammonium acetate (pH 6.5) using a MWCO-ultrafiltration device, followed by an additional three exchanges into 2.5 mM ammonium acetate (pH 6.5) (exemplary data in Fig. 3, Supplementary Figs. 3 and 4, see also Supplementary Protocol 2a and Supplementary Note 3). Denaturing and nonde-naturing samples can then be diluted and introduced to the MS as described below in Protocol 4a.
Protocol 2b, native membrane proteins. Membrane proteins are estimated to account for 23% of the total human proteome and rep-resent ~60% of targets for currently approved drugs43,44. The mass analysis of native, intact membrane proteins can further provide key information regarding stoichiometry, ligand binding and lipid asso-ciation. A typical analysis of a membrane protein complex requires either size-exclusion chromatography (SEC) or MWCO ultrafiltra-tion to remove alkali salt adducts while maintaining the detergent used to solubilize the protein (Supplementary Protocol 2b)45. This differs fundamentally from the MWCO ultrafiltration used during filter-aided sample preparation (FASP) to improve the bottom-up proteomics analysis of membrane proteins, which removes deter-gents46,47. For users interested in native membrane proteins, we recommend the protocols of Robinson and coworkers45. Their protocols are based on comprehensive optimization and include a complete list of non-ionic detergents compatible with MS and
893 m/z893 m/z893 m/z893 m/z
PrecipitationUltrafiltration
Dilution
In buffers
893 m/z893 m/z893 m/z893 m/z
Detergent
DetergentDetergent
In PBS
In RIPA
In antibody formulation
buffer
3,130 m/z3,130 m/z3,130 m/z3,130 m/z
3.0
1.5
1.5
3.0
6.0
2.0
a
b
c
Inte
nsity
(10
8 )
800 1,200 1,600
2,500 3,500 4,500 2,500 3,500 4,500 2,500 3,500 4,500 2,500 3,500 4,500
800 1,200 1,600 800 1,200 1,600 800 1,200 1,600
m/z
m/z
Fig. 3 | Dilution (Protocol 1), MWCO ultrafiltration (Protocol 2a) and precipitation (Protocol 3) sample preparation protocols applied to common buffers. a,b, Protein standard mixture in PBS (a) and detergent-containing RIPA buffer (b). In the buffer containing harsh detergents, protein signal is attained only with precipitation. c, NISTmAb in 12.5 mM L-histidine, 12.5 mM L-histidine HCl (pH 6.0). Mass spectra were obtained using a Fourier transform ion cyclotron resonance MS (FT-ICR) (Bruker Daltronics SolariX 9.4T MS) using denaturing direct infusion (Protocol 4a). See Supplementary Fig. 3 for additional results with ‘gentle elution’ immunoaffinity elution buffer and a second antibody buffer.
NATURe MeTHODS | VOL 16 | JULY 2019 | 587–594 | www.nature.com/naturemethods590

PersPectiveNaTure MeTHODs
detailed sample preparation considerations. We demonstrate an example application of Robinson and coworkers’ protocols for the native tetramer of Aquaporin Z (AqpZ) from Escherichia coli (Supplementary Fig. 5).
Protocol 3: sample preparation using protein precipitationCommon precipitation protocols use organic solvents to agglomer-ate proteins while leaving small molecules, including salts and deter-gents, solubilized. Whereas MWCO ultrafiltration using Protocol 2a does not rescue protein signal from a preparation containing harsh surfactants (for example, SDS and Triton), precipitation of proteins following Protocol 3 does (Fig. 3, Supplementary Protocol 3). A vol-ume ratio of 1:1:4:3 of aqueous protein sample:chloroform:methanol:water is recommended to precipitate proteins26. The supernatant is removed by aspiration, and the precipitated pellet can be further washed with one more addition and removal of methanol. Pellets are resolubilized for 15 minutes at −20 °C using a small volume of 80% (v/v) formic acid (~25% of the starting volume) and are then diluted to the starting sample volume with HPLC-grade water or a solution of volatile salts (for example, ammonium acetate)48. As an alternative method, acetone precipitation has the distinct advantage of leaving many proteins folded. This method, however, has been shown to modify proteins with +98 Da adducts49, requires longer incubation at −20 °C (at least 1 h), requires that all steps be per-formed at or below 0 °C to maximize resolubilization, and can be compromised by detergents.
Protocol 4a: denaturing direct-infusion MSDenaturing direct-infusion ESI mass spectra can usually be obtained by introducing samples to the MS in a mixture of 49.95% HPLC-grade acetonitrile, 49.95% HPLC-grade water, and 0.1% formic acid (v/v). A 60:35:5 ratio of HPLC-grade methanol:water:acetic acid may be used as an alternative and, in some cases, can improve S/N9,50. As described above, the use of these organic solvents and acids results in efficient ionization from a droplet’s surface, often allowing MS analysis to be performed using instrumentation parameters typically used for peptides. A more detailed description of instrument parameters for the Bruker SolariX FT-ICR MS used during denaturing direct infusion studies is found in Supplementary Protocol 4a.
Protocol 4b: native direct-infusion MSAlthough native MS protocols may not necessarily produce folded ions that match exactly to their in-solution structures, they can be used to achieve accurate mass measurements of native structures and complexes51. Consequently, native direct-infusion MS can pro-vide unique structural information, including the characterization of labile PTMs, metal-binding sites, noncovalent interactions with small molecules, and protein tertiary and quaternary structure. Detergent-free samples can be infused directly in aqueous 2.5 mM ammonium acetate52, the same solution used in the final stage of Protocol 2a (concentrations of ammonium acetate up to 500 mM can even be used).
Figure 4 compares mass spectra of carbonic anhydrase in dena-tured and native states, with the intensity of the base peak in the native sample being about twofold higher than that of the denatured sample. This comparison was repeated in four additional labs on six different instruments to illustrate the possible range of relative intensities (Supplementary Fig. 6, Supplementary Protocol 4b). Membrane protein complexes with MS-compatible detergents can be infused directly from the final solution described in Protocol 2b45. To observe native membrane proteins, detergent ions must be removed from the protein–micelle complex by increased colli-sional activation. This may be achieved through an increase in col-lision voltage applied to the source or the collision cell (typically 50−200 V), but it could require additional critical parameters that
are described in detail by Robinson and coworkers, and in part in Supplementary Protocol 4b45,53,54.
Protocol 5: intact protein analysis using LC-MSIonization suppression by excipients and by other proteins generally makes the analysis of multiple proteins and proteoforms by direct infusion intractable. For example, many ‘high-purity’ proteins (as judged by SDS-PAGE) contain numerous proteoforms that cannot be reliably detected and quantitatively assessed without up-front separation55,56. Liquid phase separation approaches, including LC (for example, reversed-phase (RP), size-exclusion, ion exchange, chromatofocusing) and capillary electrophoresis techniques (for example, capillary zone electrophoresis, capillary isoelectric focus-ing) can remove excipients and provide the resolving power for deep characterization of proteins. As directed in the decision tree (Fig. 2), separation of particularly complex samples (>100 proteins) requires an additional dimension of separation before LC-MS. Supplementary Fig. 2 shows the use of GELFrEE separation prior to LC, which frac-tionates samples on the basis of protein molecular weights and has resulted in the largest number of characterized proteoforms to date57.
Protocol 5a: LC-MS of soluble proteins. RP-LC is recommended for all samples containing more than five unique proteins but is also a viable option for samples with fewer proteins, provided they do not contain high salt concentrations (>1 M) or harsh detergents. The recommended reversed-phase LC protocol is described in Supplementary Protocol 5a and at http://nrtdp.northwestern.edu/protocols/.
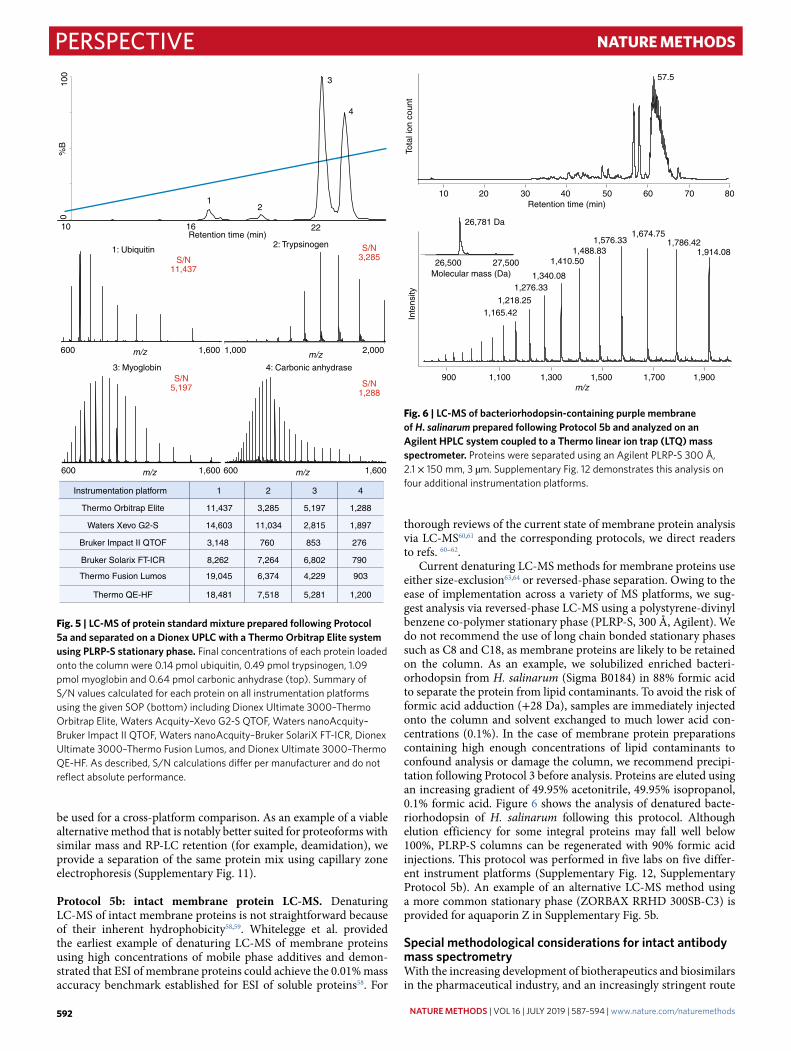
Figure 5 demonstrates that sufficient intact MS signal was attained, and four unique chromatographic peaks were observed, using Protocol 5a with a PLRP-S stationary phase (1,000-Å pore size, 5-µm particle size) on a Dionex UPLC coupled to a Thermo Orbitrap Elite. We provide benchmarks for this standard operat-ing procedure (SOP), as well as for additional data acquired using Monolithic and C4 stationary phases, for six widely used platforms (Waters Xevo G2-S QTOF, Supplementary Fig. 7; Bruker Impact II QTOF and Bruker SolariX FT-ICR, Supplementary Fig. 8; Thermo Orbitrap Elite, Thermo Orbitrap Fusion Lumos, and Thermo Orbitrap QE-HF, Supplementary Figs. 9 and 10). To allow users to compare their performance with that of experienced operators using instruments that are operating within specifications, we report S/N for the platforms used here (Fig. 5). However, instrument vendors use proprietary, non-standardized techniques to preprocess data, display data and determine S/N, and, as a result, our data cannot
1,000 2,000 3,000 4,000m/z
1,000 2,000 3,000 4,000
1.0
2.0
3.0
×109
Inte
nsity
Denatured NativeS/N = 23,270S/N = 18,409.5
2,906 2,912 2,918m/z
+10
1,262 1,263 1,264m/z
+23
Fig. 4 | Denatured versus native eSI-MS of carbonic anhydrase. Intensity is scaled to demonstrate the difference between denaturing MS (left) and native MS (right). These spectra were collected on the same instrument using the same concentration (10 µM). Native MS results in lower and fewer charge states, and thus the signals have higher intensity and appear at a higher m/z. The inset includes the most abundant charge state and the S/N.
NATURe MeTHODS | VOL 16 | JULY 2019 | 587–594 | www.nature.com/naturemethods 591
PersPective NaTure MeTHODs
be used for a cross-platform comparison. As an example of a viable alternative method that is notably better suited for proteoforms with similar mass and RP-LC retention (for example, deamidation), we provide a separation of the same protein mix using capillary zone electrophoresis (Supplementary Fig. 11).
Protocol 5b: intact membrane protein LC-MS. Denaturing LC-MS of intact membrane proteins is not straightforward because of their inherent hydrophobicity58,59. Whitelegge et al. provided the earliest example of denaturing LC-MS of membrane proteins using high concentrations of mobile phase additives and demon-strated that ESI of membrane proteins could achieve the 0.01% mass accuracy benchmark established for ESI of soluble proteins58. For
thorough reviews of the current state of membrane protein analysis via LC-MS60,61 and the corresponding protocols, we direct readers to refs. 60–62.
Current denaturing LC-MS methods for membrane proteins use either size-exclusion63,64 or reversed-phase separation. Owing to the ease of implementation across a variety of MS platforms, we sug-gest analysis via reversed-phase LC-MS using a polystyrene-divinyl benzene co-polymer stationary phase (PLRP-S, 300 Å, Agilent). We do not recommend the use of long chain bonded stationary phases such as C8 and C18, as membrane proteins are likely to be retained on the column. As an example, we solubilized enriched bacteri-orhodopsin from H. salinarum (Sigma B0184) in 88% formic acid to separate the protein from lipid contaminants. To avoid the risk of formic acid adduction (+28 Da), samples are immediately injected onto the column and solvent exchanged to much lower acid con-centrations (0.1%). In the case of membrane protein preparations containing high enough concentrations of lipid contaminants to confound analysis or damage the column, we recommend precipi-tation following Protocol 3 before analysis. Proteins are eluted using an increasing gradient of 49.95% acetonitrile, 49.95% isopropanol, 0.1% formic acid. Figure 6 shows the analysis of denatured bacte-riorhodopsin of H. salinarum following this protocol. Although elution efficiency for some integral proteins may fall well below 100%, PLRP-S columns can be regenerated with 90% formic acid injections. This protocol was performed in five labs on five differ-ent instrument platforms (Supplementary Fig. 12, Supplementary Protocol 5b). An example of an alternative LC-MS method using a more common stationary phase (ZORBAX RRHD 300SB-C3) is provided for aquaporin Z in Supplementary Fig. 5b.
Special methodological considerations for intact antibody mass spectrometryWith the increasing development of biotherapeutics and biosimilars in the pharmaceutical industry, and an increasingly stringent route
Retention time (min)
1,000 2,000m/z
21
S/N11,437
S/N5,197
S/N3,285
S/N1,288
600 1,600m/z
3
4
100
0%
B
10 16 22
1: Ubiquitin2: Trypsinogen
3: Myoglobin 4: Carbonic anhydrase
600 1,600m/z 600 1,600m/z
Instrumentation platform 1 2 3 4
Thermo Orbitrap Elite 11,437 3,285 5,197 1,288
Waters Xevo G2-S 14,603 11,034 2,815 1,897
Bruker Impact II QTOF 3,148 760 853 276
Bruker Solarix FT-ICR 8,262 7,264 6,802 790
Thermo Fusion Lumos 19,045 6,374 4,229 903
Thermo QE-HF 18,481 7,518 5,281 1,200
Fig. 5 | LC-MS of protein standard mixture prepared following Protocol 5a and separated on a Dionex UPLC with a Thermo Orbitrap elite system using PLRP-S stationary phase. Final concentrations of each protein loaded onto the column were 0.14 pmol ubiquitin, 0.49 pmol trypsinogen, 1.09 pmol myoglobin and 0.64 pmol carbonic anhydrase (top). Summary of S/N values calculated for each protein on all instrumentation platforms using the given SOP (bottom) including Dionex Ultimate 3000–Thermo Orbitrap Elite, Waters Acquity–Xevo G2-S QTOF, Waters nanoAcquity–Bruker Impact II QTOF, Waters nanoAcquity–Bruker SolariX FT-ICR, Dionex Ultimate 3000–Thermo Fusion Lumos, and Dionex Ultimate 3000–Thermo QE-HF. As described, S/N calculations differ per manufacturer and do not reflect absolute performance.
10 20 30 40 60 70 8050
Inte
nsity
m/z900 1,100 1,300 1,500 1,700 1,900
1,165.42 1,218.25
1,276.33 1,340.08
1,410.50 1,488.83
1,576.33 1,674.75
1,786.42
57.5
26,781 Da
27,50026,500Molecular mass (Da)
1,914.08
Retention time (min)
Tota
l ion
cou
nt
Fig. 6 | LC-MS of bacteriorhodopsin-containing purple membrane of H. salinarum prepared following Protocol 5b and analyzed on an Agilent HPLC system coupled to a Thermo linear ion trap (LTQ) mass spectrometer. Proteins were separated using an Agilent PLRP-S 300 Å, 2.1 × 150 mm, 3 µm. Supplementary Fig. 12 demonstrates this analysis on four additional instrumentation platforms.
NATURe MeTHODS | VOL 16 | JULY 2019 | 587–594 | www.nature.com/naturemethods592

PersPectiveNaTure MeTHODs
to regulatory approvals, there is a growing need for intact antibody MS. Every protocol presented here can be applied to the analysis of intact antibodies (Fig. 3, Supplementary Fig. 13, Supplementary Note 4). However, as antibodies are relatively large and signal spreading increases in proportion to protein size, we recommend against the use of Protocol 1 (dilution) for any regulatory filing.
DiscussionThe IPMS decision tree (Fig. 2) guides practitioners of all levels toward broadly applicable methods to obtain high-quality intact mass spectra from any protein sample. The protocols described here have been scrutinized and optimized in over ten expert intact pro-tein MS labs, and successfully applied in laboratories without expe-rience in intact protein MS. We hope that these protocols will enable any research group to adopt intact protein mass analysis.
The accurate mass measurement of an intact protein is the sine qua non of top-down mass spectrometry, which can characterize how proteoforms interact and identify PTMs that are lost in other analyses. High-throughput top-down analysis of whole proteomes has proven successful in the unambiguous identification of hun-dreds of proteins and proteoforms from a single biological sample65 and revealed prevalent yet previously uncharacterized biologically relevant modifications66. Quantitative top-down proteomics has been used to identify disease-relevant differences in protein levels, an encouraging step forward in the field of proteomics-based per-sonalized medicine67. Additionally, by using native mass spectrom-etry following the top-down workflow, one can observe previously unknown protein–protein interactions, protein–ligand binding, protein–cofactor association and protein-complex stoichiometry, and assess their relationships to important biological pathways68. We believe that by starting with intact mass analysis, using these intact protein MS protocols coupled to top-down MS analysis, and by identifying proteoforms rather than proteins, scientists can gain new insights into the human proteome. We also hope that these pro-tocols serve as a starting point for users to push, even further, the current limits of high-molecular-weight mass spectrometry.
All general protocols are available as Supplementary Protocols.
Received: 29 December 2017; Accepted: 21 May 2019; Published online: 27 June 2019
References 1. Smith, L. M. & Kelleher, N. L. Proteoform: a single term describing protein
complexity. Nat. Methods 10, 186–187 (2013). 2. Shortreed, M. R. et al. Elucidating proteoform families from proteoform
intact-mass and lysine-count measurements. J. Proteome Res. 15, 1213–1221 (2016).
3. Mann, M. & Kelleher, N. L. Precision proteomics: The case for high resolution and high mass accuracy. Proc. Natl Acad. Sci. USA 105, 18132 (2008).
4. Shaw, J. B. et al. Complete protein characterization using top-down mass spectrometry and ultraviolet photodissociation. J. Am. Chem. Soc. 135, 12646–12651 (2013).
5. Ge, Y. et al. Top down characterization of larger proteins (45 kDa) by electron capture dissociation mass spectrometry. J. Am. Chem. Soc. 124, 672–678 (2002).
6. Siuti, N. & Kelleher, N. L. Decoding protein modifications using top-down mass spectrometry. Nat. Methods 4, 817–821 (2007).
7. Ge, Y., Rybakova, I. N., Xu, Q. G. & Moss, R. L. Top-down high-resolution mass spectrometry of cardiac myosin binding protein C revealed that truncation alters protein phosphorylation state. Proc. Natl Acad. Sci. USA 106, 12658–12663 (2009).
8. Toby, T. K., Fornelli, L. & Kelleher, N. L. Progress in top-down proteomics and the analysis of proteoforms. Annu. Rev. Anal. Chem. 9, 499–519 (2016).
9. Fenn, J. B., Mann, M., Meng, C. K., Wong, S. F. & Whitehouse, C. M. Electrospray ionization for mass spectrometry of large biomolecules. Science 246, 64–71 (1989).
10. Loo, J. A., Edmonds, C. G. & Smith, R. D. Tandem mass spectrometry of very large molecules: serum albumin sequence information from multiply charged ions formed by electrospray ionization. Anal. Chem. 63, 2488–2499 (1991).
11. Reid, G. E. & McLuckey, S. A. ‘Top down’ protein characterization via tandem mass spectrometry. J. Am. Soc. Mass Spectrom. 37, 663–675 (2002).
12. Alexandrov, M. L. et al. Extraction of ions from solutions under atmospheric pressure as a method for mass spectrometric analysis of bioorganic compounds. Rapid Commun. Mass Spectrom. 22, 267–270 (2008).
13. McCormack, A. L. et al. Direct analysis and identification of proteins in mixtures by LC/MS/MS and database searching at the low-femtomole level. Anal. Chem. 69, 767–776 (1997).
14. Zhang, Y., Fonslow, B. R., Shan, B., Baek, M.-C. & Yates, J. R. Protein analysis by shotgun/bottom-up proteomics. Chem. Rev. 113, 2343–2394 (2013).
15. Kelleher, N. L. et al. Top down versus bottom up protein characterization by tandem high-resolution mass spectrometry. J. Am. Chem. Soc. 121, 806–812 (1999).
16. Konermann, L., Ahadi, E., Rodriguez, A. D. & Vahidi, S. Unraveling the mechanism of electrospray ionization. Anal. Chem. 85, 2–9 (2013).
17. Lohnes, K. et al. Combining high-throughput MALDI-TOF mass spectrometry and isoelectric focusing gel electrophoresis for virtual 2D gel-based proteomics. Methods 104, 163–169 (2016).
18. Fenselau, C. & Demirev, P. A. Characterization of intact microorganisms by MALDI mass spectrometry. Mass Spectrom. Rev. 20, 157–171 (2001).
19. Auclair, J. R. et al. Artifacts to avoid while taking advantage of top-down mass spectrometry based detection of protein S-thiolation. Proteomics 14, 1152–1157 (2014).
20. Auclair, J. R. et al. Post-translational modification by cysteine protects Cu/Zn-superoxide dismutase from oxidative damage. Biochemistry 52, 6137–6144 (2013).
21. Ayaz-Guner, S., Zhang, J., Li, L., Walker, J. W. & Ge, Y. In vivo phosphorylation site mapping in mouse cardiac troponin I by high resolution top-down electron capture dissociation mass spectrometry: Ser22/23 are the only sites basally phosphorylated. Biochemistry 48, 8161–8170 (2009).
22. Martinez-Garcia, E. et al. The MMSET histone methyl transferase switches global histone methylation and alters gene expression in t(4;14) multiple myeloma cells. Blood 117, 211–220 (2011).
23. Wu, D., Struwe, W. B., Harvey, D. J., Ferguson, M. A. J. & Robinson, C. V. N-glycan microheterogeneity regulates interactions of plasma proteins. Proc. Natl Acad. Sci. USA 115, 8763 (2018).
24. Doll, S. & Burlingame, A. L. Mass spectrometry-based detection and assignment of protein posttranslational modifications. ACS Chem. Biol. 10, 63–71 (2015).
25. Chait, B. T. Mass spectrometry: bottom-up or top-down? Science 314, 65 (2006). 26. Wessel, D. & Flügge, U. I. A method for the quantitative recovery of protein
in dilute solution in the presence of detergents and lipids. Anal. Biochem. 138, 141–143 (1984).
27. Fornelli, L. et al. Top-down proteomics: where we are, where we are going? J. Proteomics 75, 3–4 (2017).
28. Dang, X. et al. The first pilot project of the Consortium for Top-Down Proteomics: a status report. Proteomics 14, 1130–1140 (2014).
29. Cech, N. B. & Enke, C. G. Practical implications of some recent studies in electrospray ionization fundamentals. Mass Spectrom. Rev. 20, 362–387 (2001).
30. Metwally, H., McAllister, R. G. & Konermann, L. Exploring the mechanism of salt-induced signal suppression in protein electrospray mass spectrometry using experiments and molecular dynamics simulations. Anal. Chem. 87, 2434–2442 (2015).
31. Compton, P. D., Zamdborg, L., Thomas, P. M. & Kelleher, N. L. On the scalability and requirements of whole protein mass spectrometry. Anal. Chem. 83, 6868–6874 (2011).
32. Karas, M., Bahr, U. & Dülcks, T. Nano-electrospray ionization mass spectrometry: addressing analytical problems beyond routine. Fresenius J. Anal. Chem. 366, 669–676 (2000).
33. Juraschek, R., Dulcks, T. & Karas, M. Nanoelectrospray—more than just a minimized-flow electrospray ionization source. J. Am. Soc. Mass Spectrom. 10, 300–308 (1999).
34. Evershed, R. P., Robertson, D. H., Beynon, R. J. & Green, B. N. Application of electrospray ionization mass spectrometry with maximum-entropy analysis to allelic ‘fingerprinting’ of major urinary proteins. Rapid Commun. Mass Spectrom. 7, 882–886 (1993).
35. Ferrige, A. G. et al. Disentangling electrospray spectra with maximum entropy. Rapid Commun. Mass Spectrom. 6, 707–711 (1992).
36. Maquin, F., Schoot, B. M., Devaux, P. G. & Green, B. N. Molecular weight determination of recombinant interleukin 2 and interferon gamma by electrospray ionization mass spectroscopy. Rapid Commun. Mass Spectrom. 5, 299–302 (1991).
37. Loo, J. A., Udseth, H. R. & Smith, R. D. Peptide and protein analysis by electrospray ionization-mass spectrometry and capillary electrophoresis-mass spectrometry. Anal. Biochem. 179, 404–412 (1989).
38. Morris, H. R. et al. High sensitivity collisionally-activated decomposition tandem mass spectrometry on a novel quadrupole/orthogonal-acceleration time-of-flight mass spectrometer. Rapid Commun. Mass Spectrom. 10, 889–896 (1996).
NATURe MeTHODS | VOL 16 | JULY 2019 | 587–594 | www.nature.com/naturemethods 593

PersPective NaTure MeTHODs
39. Kelleher, N. L., Senko, M. W., Little, D. P., O’Connor, P. B. & McLafferty, F. W. Complete large-molecule high-resolution mass spectra from 50-femtomole microvolume injection. J. Am. Soc. Mass Spectrom. 6, 220–221 (1995).
40. LeDuc, R. D., Schwammle, V., Shortreed, M. R. & Cesnik, A. J. ProForma: a standard proteoform notation. J. Proteome Res. 17, 1321–1325 (2018).
41. Shaw, K. L., Grimsley, G. R., Yakovlev, G. I., Makarov, A. A. & Pace, C. N. The effect of net charge on the solubility, activity, and stability of ribonuclease Sa. Protein Sci. 10, 1206–1215 (2001).
42. Konermann, L. Addressing a common misconception: ammonium acetate as neutral pH “buffer” for native electrospray mass spectrometry. J. Am. Soc. Mass Spectrom. 28, 1827–1835 (2017).
43. Uhlén, M. et al. Tissue-based map of the human proteome. Science 347, 1260419 (2015).
44. Overington, J. P., Al-Lazikani, B. & Hopkins, A. L. How many drug targets are there? Nat. Rev. Drug Discov. 5, 993 (2006).
45. Laganowsky, A., Reading, E., Hopper, J. T. S. & Robinson, C. V. Mass spectrometry of intact membrane protein complexes. Nat. Protoc. 8, 639–651 (2013).
46. Wisniewski, J. R., Zougman, A., Nagaraj, N. & Mann, M. Universal sample preparation method for proteome analysis. Nat. Methods 6, 359–362 (2009).
47. Erde, J., Loo, R. R. O. & Loo, J. A. Enhanced FASP (eFASP) to increase proteome coverage and sample recovery for quantitative proteomic experiments. J. Proteome Res. 13, 1885–1895 (2014).
48. Doucette, A. A., Vieira, D. B., Orton, D. J. & Wall, M. J. Resolubilization of precipitated intact membrane proteins with cold formic acid for analysis by mass spectrometry. J. Proteome Res. 13, 6001–6012 (2014).
49. Güray, M. Z., Zheng, S. & Doucette, A. A. Mass spectrometry of intact proteins reveals +98 u chemical artifacts following precipitation in acetone. J. Proteome Res. 16, 889–897 (2017).
50. Smith, R. D., Loo, J. A., Edmonds, C. G., Barinaga, C. J. & Udseth, H. R. New developments in biochemical mass spectrometry: electrospray ionization. Anal. Chem. 62, 882–899 (1990).
51. Leney, A. C. & Heck, A. J. R. Native mass spectrometry: what is in the name? J. Am. Soc. Mass Spectrom. 28, 5–13 (2017).
52. Hernández, H. & Robinson, C. V. Determining the stoichiometry and interactions of macromolecular assemblies from mass spectrometry. Nat. Protoc. 2, 715 (2007).
53. Lössl, P., Snijder, J. & Heck, A. J. R. Boundaries of mass resolution in native mass spectrometry. J. Am. Soc. Mass Spectrom. 25, 906–917 (2014).
54. Gault, J. et al. High-resolution mass spectrometry of small molecules bound to membrane proteins. Nat. Methods 13, 333–336 (2016).
55. Belov, A. M. et al. Analysis of proteins, protein complexes, and organellar proteomes using sheathless capillary zone electrophoresis - native mass spectrometry. J. Am. Soc. Mass Spectrom. 28, 2614–2634 (2017).
56. Belov, A. M. et al. Complementary middle-down and intact monoclonal antibody proteoform characterization by capillary zone electrophoresis - mass spectrometry. Electrophoresis 39, 2069–2082 (2018).
57. Tran, J. C. & Doucette, A. A. Multiplexed size separation of intact proteins in solution phase for mass spectrometry. Anal. Chem. 81, 6201–6209 (2009).
58. Whitelegge, J. P., Gundersen, C. B. & Faull, K. F. Electrospray-ionization mass spectrometry of intact intrinsic membrane proteins. Protein Sci. 7, 1423–1430 (1998).
59. le Coutre, J. et al. Proteomics on full-length membrane proteins using mass spectrometry. Biochemistry 39, 4237–4242 (2000).
60. Whitelegge, J. P. HPLC and mass spectrometry of intrinsic membrane proteins. In HPLC of Peptides and Proteins: Methods and Protocols (ed. Aguilar, M.-I.) 323–339 (Springer, 2004).
61. Souda, P., Ryan, C. M., Cramer, W. A. & Whitelegge, J. Profiling of integral membrane proteins and their post translational modifications using high-resolution mass spectrometry. Methods 55, 330–336 (2011).
62. Whitelegge, J. P. Integral membrane proteins and bilayer proteomics. Anal. Chem. 85, 2558–2568 (2013).
63. Howery, A. E. et al. A designed inhibitor of a CLC antiporter blocks function through a unique binding mode. Chem. Biol. 19, 1460–1470 (2012).
64. Whitelegge, J. P. et al. Toward the bilayer proteome, electrospray ionization-mass spectrometry of large, intact transmembrane proteins. Proc. Natl Acad. Sci. USA 96, 10695–10698 (1999).
65. Cleland, T. P. et al. High-throughput analysis of intact human proteins using UVPD and HCD on an Orbitrap mass spectrometer. J. Proteome Res. 16, 2072–2079 (2017).
66. Ansong, C. et al. Top-down proteomics reveals a unique protein S-thiolation switch in Salmonella Typhimurium in response to infection-like conditions. Proc. Natl Acad. Sci. USA 110, 10153–10158 (2013).
67. Ntai, I. et al. Applying label-free quantitation to top down proteomics. Anal. Chem. 86, 4961–4968 (2014).
68. Skinner, O. S. et al. Top-down characterization of endogenous protein complexes with native proteomics. Nat. Chem. Biol. 14, 36 (2017).
AcknowledgementsJ.N.A. was supported in part by NIH R01 NS065263 and ALSA 18-IIA-420 in collaboration with Biopharmaceutical Analysis Training Lab at Northeastern University. Y.G. was supported by NIH R01 GM117058 and S10 OD018475 and acknowledges the UW-Madison Human Proteomics Program Mass Spectrometry Facility (initially funded by the Wisconsin Partnership Funds). A.R.I. was supported by the NIH awards 1R01GM120272 and R01CA218500 and acknowledges Thermo Fisher Scientific and SCIEX for their support. J.P.W.’s lab was supported in part by the NIH grant P30DK063491. J.A.L. acknowledges the NIH (R01 GM103479, S10 RR028893, S10 OD018504) and the US Department of Energy (DE-FC-02-02ER63421). J.L.L. acknowledges the postdoctoral program at Amgen, Inc. C.L. acknowledges support from the NIH Ruth L. Kirschstein National Research Service Award (NRSA; T32 GM007185). Work done by N.L.K. was carried out in collaboration with the National Resource for Translational and Developmental Proteomics under NIH Grant P41GM108569 from the National Institute of General Medical Sciences. The NRTDP would like to thank I. Ntai for assistance in data collection. L. Schachner is a Howard Hughes Medical Institute Gilliam Fellow. Research reported in this publication was supported by a fellowship associated with the Chemistry of Life Processes Predoctoral Training Program T32GM105538 at Northwestern University.
Author contributionsD.P.D. and C.M.R. contributed by making all the figures and writing the manuscript with J.N.A. Experiments were performed by D.P.D., C.M.R., C.J.D., L.F., L.F.S., Z.L., J.J.W., J.L.L., K.C.A, R.S., K.J., A.K., I.D.G.C., J.R.A., B.C., C. L., W.J., A.R.I. and J.P.W. who all contributed data that was incorporated into the final results. L.P., J.C., P.O.D., L.M.S., Y.O.T., J.A.L, Y.G., N.L.K. and J.N.A make up the Consortium for Top-Down Proteomics Board of Directors who designed and guided this project. All authors contributed to the editing and formatting of the manuscript.
Competing interestsAuthors with company affiliations include J.L.L. (Amgen), K.C.A. (Alnylam), R.S. (Biogen), J.J.W. (Bruker), I.D.G.C. (Amgen), P.O.D. (Eastwoods Consulting) and Y.O.T. (Spectroswiss).
Additional informationSupplementary information is available for this paper at https://doi.org/10.1038/s41592-019-0457-0.
Reprints and permissions information is available at www.nature.com/reprints.
Correspondence should be addressed to J.N.A.
Peer review information: Allison Doerr was the primary editor on this article and managed its editorial process and peer review in collaboration with the rest of the editorial team.
Publisher’s note: Springer Nature remains neutral with regard to jurisdictional claims in published maps and institutional affiliations.
© The Author(s), under exclusive licence to Springer Nature America, Inc. 2019
Open Access This article is licensed under a Creative Commons Attribution 4.0 International License, which permits use, sharing, adaptation, distribution and reproduction in any medium or format, as
long as you give appropriate credit to the original author(s) and the source, provide a link to the Creative Commons license, and indicate if changes were made. The images or other third party material in this article are included in the article’s Creative Commons license, unless indicated otherwise in a credit line to the material. If material is not included in the article’s Creative Commons license and your intended use is not permitted by statutory regulation or exceeds the permitted use, you will need to obtain permission directly from the copyright holder. To view a copy of this license, visit http://creativecommons.org/licenses/by/4.0/.
NATURe MeTHODS | VOL 16 | JULY 2019 | 587–594 | www.nature.com/naturemethods594