
Bentley's LEAP Bridge Enterprise Saves Time in Analysis and ...
14
www.bentley.com Bentley’s LEAP Bridge Enterprise Saves Time in Analysis and Design of Prestressed Concrete Box Girder Bridges Bentley’s LEAP Bridge Enterprise, the most widely used concrete bridge design software in the United States, was recently released for India, including support for Indian Road Congress (IRC) bridge design specifications. To introduce LEAP Bridge Enterprise to India, the software was used to re-create the design and analysis of the South Kasheli Bridge, and the results were then validated against the detailed calculations from the original design consultant. The South Kasheli Bridge is a 13-span prestressed concrete (post-tensioned) box girder bridge that crosses the Thane creek at Thane-Bhiwandi-Wadapa Road in Maharashtra in western India. The bridge was designed by S.N. Bhobe and Associates using Bentley’s STAAD.Pro for analysis and spreadsheets for the design, which is typical in India for bridge design. The results obtained from LEAP Bridge Enterprise matched closely with those performed by S.N. Bhobe and Associates. More importantly, using LEAP Bridge Enterprise showed a potential time savings of up to 80 percent. All-in-one Concrete Bridge Design and Analysis from Bentley For over 20 years, LEAP Bridge Enterprise has been the most popular bridge analysis and design software in the United States (U.S.). LEAP is used for analysis and design of small to medium-sized concrete bridges with low skews and mild curvatures. Analysis and design of the superstructure, substructure, and geometry is car- ried out in a single interface, using different modules that share a common interface. LEAP CONSPAN and LEAP CONBOX are used for superstructure design, while LEAP RC-PIER is used for substructure design. LEAP CONSPAN is used to analyze and design precast pre-tensioned girders of various shapes such as I-girders, box beams – adjacent or spread, open box beams, and T- beams. LEAP CONBOX is used to analyze and design complex cast-in-situ reinforced concrete/post-tensioned box girders, T-beams and slab type superstruc- ture. The bridge can be simple-span or multi-span. LEAP RC-PIER is used to analyze and design intermediate piers, abutments, and footings. The different pier types that can be analyzed and designed are drop cap, hammer head, and integral pier. Column arrangement can be a single column or multicolumn with different shapes including circular, rectangular, tapered, and more. LEAP RC-PIER also handles pile cap and stem wall abutments as well as footing types including isolated (rectan- gular and square), combined (rectangular, trapezoidal, and strap), pile, well foundation, and drill shaft foundation. LEAP Bridge Enterprise supports Indian (IRC), American (AASHTO), and Canadian (CHBDC) codes. The software is fully IRC compliant, and analysis and design are carried out against relevant clauses from the relevant design codes (IRC5, IRC6, IRC18, IRC21, and IRC78). Project Overview The Thane-Bhiwandi-Wadapa Road is an important link joining Thane and Bhiwandi and provides access to many villages. The project to construct a set of bridges (South Kasheli and North Kasheli) over the creek at Thane-Bhiwandi-Wadapa Road, was initiated to help encourage the flow of traffic in the area. Maharashtra Public Works Department (PWD) undertook the project with concessionaire Kalyan Sangam Infrastructure Ltd, who then awarded the project to Supreme Infrastruc- ture India Ltd. (Supreme Infra), one of India’s leading infrastructure companies. Supreme Infra appointed S.N. Bhobe and Associates, Navi Mumbai, as the structural consultant to design the bridge. The estimated cost of the project was INR 1.9 billion. For the South Kasheli bridge, S.N. Bhobe and Associates proposed cast-in-place prestressed (post-tensioned) concrete box girder for the superstructure, a reinforced concrete (RCC) tapered cap type pier for the substructure, and an open foundation. The 546-meter-long bridge comprised 13 42-meter simple spans, and an 11-meter width carriageway with three traffic lanes.
Transcript of Bentley's LEAP Bridge Enterprise Saves Time in Analysis and ...

CommunicationsMining
Power GenerationTransit
Cadastre
www.bentley.com
Bentley’s LEAP Bridge Enterprise Saves Time in Analysis and Design of Prestressed Concrete Box Girder Bridges
Bentley’s LEAP Bridge Enterprise, the most widely used concrete bridge design software in the United States, was recently released for India, including support for Indian Road Congress (IRC) bridge design specifications. To introduce LEAP Bridge Enterprise to India, the software was used to re-create the design and analysis of the South Kasheli Bridge, and the results were then validated against the detailed calculations from the original design consultant.
The South Kasheli Bridge is a 13-span prestressed concrete (post-tensioned) box girder bridge that crosses the Thane creek at Thane-Bhiwandi-Wadapa Road in Maharashtra in western India. The bridge was designed by S.N. Bhobe and Associates using Bentley’s STAAD.Pro for analysis and spreadsheets for the design, which is typical in India for bridge design. The results obtained from LEAP Bridge Enterprise matched closely with those performed by S.N. Bhobe and Associates. More importantly, using LEAP Bridge Enterprise showed a potential time savings of up to 80 percent.
All-in-one Concrete Bridge Design and Analysis from BentleyFor over 20 years, LEAP Bridge Enterprise has been the most popular bridge analysis and design software in the United States (U.S.). LEAP is used for analysis and design of small to medium-sized concrete bridges with low skews and mild curvatures. Analysis and design of the superstructure, substructure, and geometry is car-ried out in a single interface, using different modules that share a common interface. LEAP CONSPAN and LEAP CONBOX are used for superstructure design, while LEAP RC-PIER is used for substructure design.
LEAP CONSPAN is used to analyze and design precast pre-tensioned girders of various shapes such as I-girders, box beams – adjacent or spread, open box beams, and T- beams. LEAP CONBOX is used to analyze and design complex cast-in-situ reinforced concrete/post-tensioned box girders, T-beams and slab type superstruc-ture. The bridge can be simple-span or multi-span. LEAP RC-PIER is used to analyze and design intermediate piers, abutments, and footings. The different pier types that can be analyzed and designed are drop cap, hammer head, and integral pier. Column arrangement can be a single column or multicolumn with different shapes including circular, rectangular, tapered, and more. LEAP RC-PIER also handles pile cap and stem wall abutments as well as footing types including isolated (rectan-gular and square), combined (rectangular, trapezoidal, and strap), pile, well foundation, and drill shaft foundation.
LEAP Bridge Enterprise supports Indian (IRC), American (AASHTO), and Canadian (CHBDC) codes. The software is fully IRC compliant, and analysis and design are carried out against relevant clauses from the relevant design codes (IRC5, IRC6, IRC18, IRC21, and IRC78).
Project OverviewThe Thane-Bhiwandi-Wadapa Road is an important link joining Thane and Bhiwandi and provides access to many villages. The project to construct a set of bridges (South Kasheli and North Kasheli) over the creek at Thane-Bhiwandi-Wadapa Road, was initiated to help encourage the flow of traffic in the area. Maharashtra Public Works Department (PWD) undertook the project with concessionaire Kalyan Sangam Infrastructure Ltd, who then awarded the project to Supreme Infrastruc-ture India Ltd. (Supreme Infra), one of India’s leading infrastructure companies. Supreme Infra appointed S.N. Bhobe and Associates, Navi Mumbai, as the structural consultant to design the bridge. The estimated cost of the project was INR 1.9 billion.
For the South Kasheli bridge, S.N. Bhobe and Associates proposed cast-in-place prestressed (post-tensioned) concrete box girder for the superstructure, a reinforced concrete (RCC) tapered cap type pier for the substructure, and an open foundation. The 546-meter-long bridge comprised 13 42-meter simple spans, and an 11-meter width carriageway with three traffic lanes.

CommunicationsMining
Power GenerationTransit
Cadastre
www.bentley.com
Figure 1: Superstructure Formwork Preparation Figure 2: Preparing the Box Girder Rebar Cage for Concrete Placement
Figure 3: Preparing the Pier Cap Rebar Cage for Concrete Placement
Bridge Designers Face Real-world Design ChallengesEconomics play a very big role in any project. The high cost of materials caused designers to optimize cross-sections to reduce material cost, as in the case of the South Kasheli box girder superstructure. Figure 4 shows varying cross-sections along the span length. Varying cross-sections not only increase the complexity of modeling but also the challenge of accurately calculating areas, center of gravity, and moment of inertia, as well as the self weight of the structure for the dead load calculation.
Figure 4: Varying Box Girder Cross-Section – Consultant’s Drawing

CommunicationsMining
Power GenerationTransit
Cadastre
www.bentley.com
Calculating Moment and Shear Due to Live Load With STAAD.ProOne of the most difficult and tedious parts of bridge analysis is the calculation of moment and shear due to the movement of trucks and vehicles over the bridge in transverse and longitudinal directions. The consultants used STAAD.Pro to run the moving live load over the bridge to determine the maximum moments and shears for different live load positions in transverse and longitudinal directions. Such an analysis generates a huge amount of data, and sorting and analyzing the data to get the maximum moments and shears is a very time-consuming task. Correct interpretation and calculation of temperature stresses is also time consuming.
As the superstructure was post-tensioned, it involved calculation of jacking force; initial losses; losses due to slip, anchorage, friction and wobble; and also long-term losses due to relaxation, creep, shrinkage, and elastic shortening for the post-tensioning tendons. The complex mathematical calculations, performed using spreadsheets, are tedious and time consuming. A design spreadsheet has many tabs that are linked to one another to arrive at the results. Linking tabs is tedious for the designer, but reviewing the design is even more challenging, as the reviewer has to move between multiple tabs to check the formulas and cell references.
Input Data:
GeometryNumber of Spans 13
Typical Span Length 42 m
Bridge Overall Length 546 m
Number of Lanes 3
Bridge Overall Width 12 m
Curb to Curb Distance 11 m
Concrete Propertiesfi, initial 32 MPa
fck, strength, at 28 days 40 MPa
Unit Weight of Concrete 2500 kg/m3
Post-tensioned TendonsStrand Type 19T13, LowLax
Ultimate Tensile Strength, fp 1,860 MPa
Area 1877.2 mm2
Duct diameter 89.7 mm
Rebar PropertiesFlexure and Shear Steel Fe415, HYSD Steel
LoadsSuperimposed Dead Load Wearing Surface, 2 Crash Barriers
Live Load Number of Design lanes = 3, One Lane of Class A + One Lane of 70R or 3 Lanes of Class A Vehicles

CommunicationsMining
Power GenerationTransit
Cadastre
www.bentley.com
Recreating the Analysis and Design Using Bentley’s LEAP Bridge EnterpriseBentley colleagues worked with S.N. Bhobe engineers to understand their current practices and develop a model of the South Kasheli Bridge using LEAP Bridge Enterprise. Modeling in LEAP Bridge Enterprise is a quick, three-step process using a wizard to design physical structure geometry (Figure 5). This enabled the varying cross-sections of the consultant’s box girder design to be easily replicated.
Figure 5: Physical Structure Modeling in LEAP Bridge
Figure 6: Plan and Elevation of a Typical Span
Figure 5: Physical Structure Modeling in LEAP Bridge

CommunicationsMining
Power GenerationTransit
Cadastre
www.bentley.com
LEAP Bridge Enterprise includes an option to vary cross sections along the span (Figure 7). Using this option, the software then auto-calculated the self weight, based on the different cross sections. Diaphragms could be easily added. The superimposed barriers and wearing surface were quickly modeled and their weights added as dead loads.
Figure 7: Varying Bridge Cross Section

CommunicationsMining
Power GenerationTransit
Cadastre
www.bentley.com
LEAP Bridge Enterprise offers a vehicle library with predefined IRC vehicles (Class A, Class B, Class AA, and Class 70R) as per Section 207, IRC 6-2000. The software automatically selects the appropriate design lane configurations for Class A+70R vehicles per Table 2, IRC 6 based on carriageway width. Adding temperature load as per IRC 6-2000 was simple. Load combinations were predefined as per Table 1 in IRC 6-2000 and Section 12 as per IRC18-2000 (post-tensioned structures) (Figure 8).
Figure 8: Loads and Load Combinations in LEAP Bridge
The tendon type (19T13) and profile (parabolic) were exactly replicated in LEAP Bridge Enterprise (Figures 9, 10, and 11). While the software includes a library of different tendon types, custom tendons can be added. Tendons can be assigned at different heights of the cross section, and cables can be anchored at the blisters (Figure 11). Dummy cables can also be assigned for future stressing purposes.
LEAP Bridge Enterprise offers flexibility when creating custom tendon profile or using standard layouts. The tendons were jacked from both ends with anchor sets between 4 millimeters and 6 millimeters. The software also allows tendons to be jacked from either end. Initial losses due to anchor set, friction and wobble, and also the long-term losses due to steel relaxation, concrete creep and shrinkage, and elastic shortening were also accounted for.
Figure 9: Tendon Definition in LEAP Bridge

CommunicationsMining
Power GenerationTransit
Cadastre
www.bentley.com
Figure 10: Tendon Profile in LEAP Bridge
Figure 11: Cross-section Tendon Location in LEAP Bridge
Figure 12: Tendons Anchored at the Blisters – 3D View in LEAP Bridge
Shear reinforcement (6 legs, HY 16-Gr1- FE 415 @ 100-millimeter spacing) was exactly replicated as provided by the consultant. Design parameters, including permissible stresses in steel and concrete, and initial pull in tendons, were predefined as per the relevant clauses in IRC 18-2000.

CommunicationsMining
Power GenerationTransit
Cadastre
www.bentley.com
After performing the analysis, LEAP Bridge Enterprise displays a summary of the results (Figure 13). The software calculates the required jacking force. An asterisk (*) indicates that the provided jacking force is less than the required value. LEAP Bridge also performed detailed loss calculations as per Section 11, IRC 18-2000 for individual tendons.
Figure 13: Summary of Jacking Forces in LEAP Bridge
LEAP Bridge Enterprise can display various responses of the bridge structure, including influence lines, moments, shears, displacements from dead loads, super-imposed dead loads, and live loads. Figures 14, 15, and 16 show examples of the various responses. Design results, including concrete stresses and jacking forces, are also available.
Figure 14: Dead Load Bending Moment Diagram

CommunicationsMining
Power GenerationTransit
Cadastre
www.bentley.com
Figure 15: Live Load Bending Moment Diagram
Figure 16: Moment Influence Line Diagram
The final design report provided step-by-step information about the project, including geometry, loads analysis parameters, and response reports. Additional reports related to the design of the box girder including detailed moment capacity, shear capacity, PT loss, stresses and deflection reports can also be generated. LEAP Bridge can also export the design reports to Microsoft Word format.

CommunicationsMining
Power GenerationTransit
Cadastre
www.bentley.com
LEAP Bridge-Consultant Result Comparison
The following tables show results obtained from using LEAP Bridge Enterprise compared with those generated by the consultants (S.N. Bhobe and Associates) using their in-house Excel design spreadsheets. The data shows that the analysis and design results obtained from LEAP Bridge closely match those obtained from the consultants.
SectionDistance (m) CG-y (m) Area (m2) Izz (m4)
LEAP Bridge Consultant LEAP Bridge Consultant LEAP Bridge Consultant LEAP Bridge Consultant
End 0.5-3.6 0.5-3.6 1.287 1.320 11.670 11.868 9.525 9.700
Running 3.6-32 3.6-32 1.099 1.070 7.697 7.451 7.678 7.380
Table 1: Comparison of Cross-Section Properties
Note: The small differences in the cross-section properties are due to the fact that the section was modeled in greater detail in LEAP Bridge, whereas simplified assumptions regarding the various fillets were made in the consultants calculations.
POILocation (m) Shear (kN) Moment (kN-m) Difference
LEAP Bridge Consultant LEAP Bridge Consultant Shear Moment
Sp1.000 0 -4,327.03 -4623.93 0 -36.25 -6.9% -
Sp1.010 3.6 -3,300.77 -3435.05 13606.56 13786.27 -4.1% -1.3%
Sp1.020 8.06 -2,298.64 -2591.07 26038.94 27647.04 -12.7% -6.2%
Sp1.030 10.07 -1,925.18 -2055.13 30283.82 32293.59 -6.8% -6.6%
Sp1.040 12.09 -1,465.06 -1512.83 33612.44 35748.47 -3.3% -6.4%
Sp1.050 16.12 -755.78 -775.55 38085.63 40127.68 -2.6% -5.4%
Sp1.060 20.15 -47.68 -48.46 39704.6 41816.55 -1.6% -5.3%
Table 2: Comparison of Bending Moment and Shear Force Due to Dead Load
Note: The differences ranged from 1.3 to 12.7 percent, which are reasonable. The dead loads are slightly different because of the differences in modeling by LEAP Bridge and by the consultant. The actual cross-section variation is complex, involving variations in flange and web thicknesses and also depth. In LEAP Bridge these variations were modeled much more accurately, whereas simplified assumptions were made in consultant’s model.
POILocation (m) Shear (kN) Moment (kN-m) Difference
LEAP Bridge Consultant LEAP Bridge Consultant Shear Moment
Sp1.000 0 -764.73 -766.59 0 -4.74 -0.2% -
Sp1.010 3.6 -628.1 -629.97 2507.08 2513.81 -0.3% -0.3%
Sp1.020 8.06 -458.84 -459.2 4930.97 4946.03 -0.1% -0.3%
Sp1.030 10.07 -382.56 -383.3 5776.56 5799.25 -0.2% -0.4%
Sp1.040 12.09 -305.89 -307.4 6471.9 6494.53 -0.5% -0.3%
Sp1.050 16.12 -152.95 -155.6 7396.46 7426.69 -1.7% -0.4%
Sp1.060 20.15 0 -1.9 7704.64 7742.51 - -0.5%
Table 3: Comparison of Bending Moment and Shear Force Due to Superimposed Dead Load
Note: The differences ranged from 0.1 to 1.7 percent, which is negligible.

CommunicationsMining
Power GenerationTransit
Cadastre
www.bentley.com
POILocation (m) Shear (kN) Moment (kN-m) Difference
LEAP Bridge Consultant LEAP Bridge Consultant Shear Moment
Sp1.000 0 -1,474.64 -1415.77 0 -152.064 4.0% -
Sp1.010 3.6 -1,303.31 -1262.56 4,703.91 4558.41 3.1% 3.1%
Sp1.020 8.06 -1,109.78 -1074.91 9,487.53 8873.41 3.1% 6.5%
Sp1.030 10.07 -1,023.44 -990.27 11,092.36 10365.55 3.2% 6.6%
Sp1.040 12.09 -936.66 -905.66 12,331.22 11586.27 3.3% 6.0%
Sp1.050 16.12 -763.54 -733.7 13,897.56 13274.14 3.9% 4.5%
Sp1.060 20.15 -590.42 -564.47 14,076.62 13862.86 - 1.5%
Table 4: Comparison of Bending Moment and Shear Force Due to Live Load (Class A+70R)
Note: The differences ranged from 1.5 to 6.5 percent, which is a less than 10 percent error margin and is reasonable. The moment and shear results obtained in LEAP Bridge are accurate and are higher than the consultant’s results because the live load position increment along the span was set at every 0.1 meter in LEAP Bridge compared to the consultant’s STAAD.Pro analysis where the load increment was set at every 0.5 meter.
STAAD.Pro vs. LEAP Bridge – Live Load Analysis Results
Figure 17: Comparison of Moments Due to Class 70R W

CommunicationsMining
Power GenerationTransit
Cadastre
www.bentley.com
Figure 18: Comparison of Moments Due to Class A
As seen from the above comparison for live load analysis, results obtained from LEAP Bridge compare closely with those obtained from STAAD.Pro, with an error of less than 4 percent. LEAP Bridge, like STAAD.Pro, can also help users perform live load analysis very quickly and efficiently as per IRC specification.

CommunicationsMining
Power GenerationTransit
Cadastre
www.bentley.com
Governing Load Case Jacking Force (kN) Difference
LEAP Bridge Consultant
T1-S Service IIA Temp U Final 19940.15 21,368.54 -7.2%
T2-L Service IIA Temp U Final 5,502.74 5,342.14 2.9%
T2 Service IIA Temp U Final 5,502.74 5,342.14 2.9%
T3 Service IIA Temp U Final 5,502.74 5,342.14 2.9%
T4 Service IIA Temp U Final 5,502.74 5,342.14 2.9%
T5 Service IIA Temp U Final 0 0 0.0%
T-6 Service IIA Temp U Final 5,502.74 5,342.14 2.9%
fci (MPa) Service I Initial 17.021 32 -
fck (MPa) Service IIA Temp U Final 23.413 40 -
Table 5: Comparison of Required Jacking Force (P-Jack) for Tendons
Note: The small differences in the bending moment (BM) and shear force (SF) values were due to dead load, SIDL and live load, and also due to the fact that the section was modeled and analyzed much more accurately in LEAP Bridge whereas simplified assumptions were made in the consultant’s calculations that led to the difference in jacking forces. The differences are less than 10 percent, which is within acceptable limits.
POILocation (m) Max Compression (MPa) Difference
LEAP Bridge Consultant
Sp1.000 0 -1.86 -2.3
Sp1.010 3.6 -3.33 -3.335 -0.2%
Sp1.020 8.06 -5.84 -6.34 -8.6%
Sp1.030 10.07 -6.32 -6.393 -1.2%
Sp1.040 12.09 -6.78 -6.715 1.0%
Sp1.050 16.12 -7.54 -7.807 -3.5%
Sp1.060 20.15 -7.78 -8.122 -4.4%
Table 6: Comparison of Compressive Stresses in Concrete
Note: Because the compression stresses are critical at the center of the span, the results obtained in LEAP Bridge differ from those of the consultants by less than 10 percent, which is within acceptable limits.
LEAP Bridge Consultant
-16.48mm (Downward) -15.45 mm (Downward)
Table 7: Comparison of Deflections (at Mid-Span)
Note: The difference is less than 7 percent, which is within acceptable limits.
CommunicationsMining
Power GenerationTransit
Cadastre
www.bentley.com
© 2013 Bentley Systems, Incorporated. Bentley, the Bentley “B” logo, LEAP, LEAP CONBOX, LEAP CONSPAN, LEAP RC-PIER, and STAAD.Pro are either registered or unregistered trademarks or service marks of Bentley Systems, Incorporated or one of its direct or indirect wholly-owned subsidiaries. Other brands and product names are trademarks of their respective owners. CS9414 0113
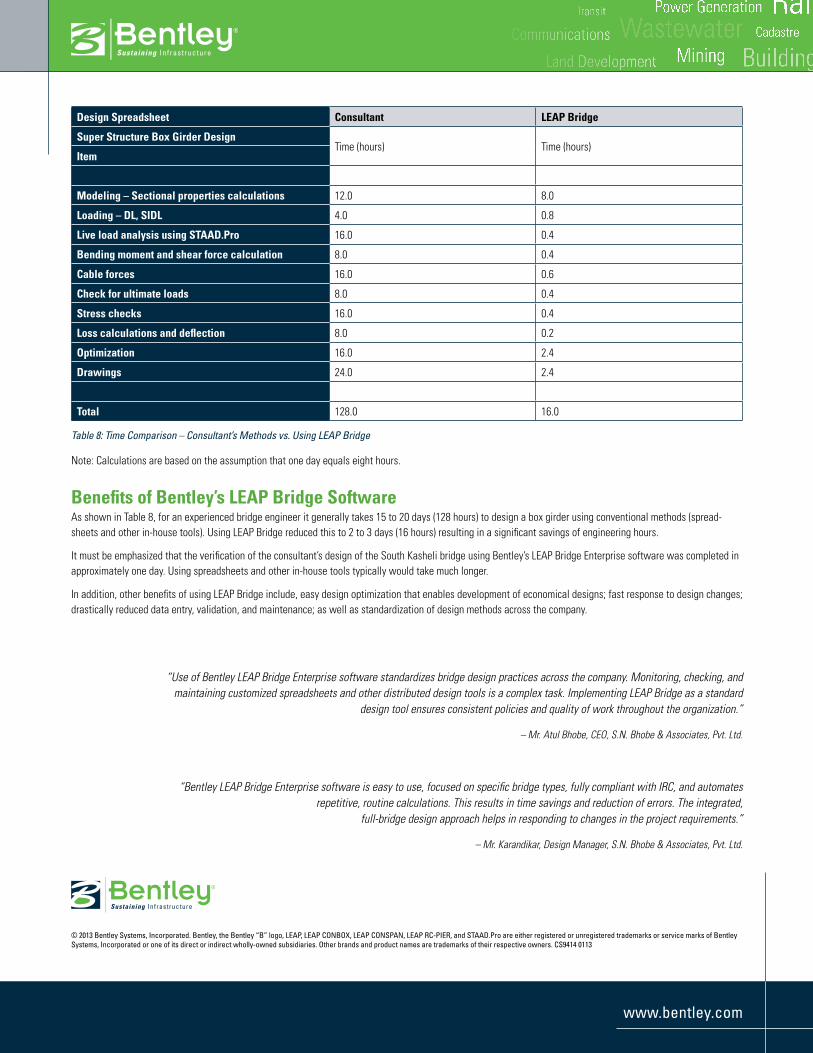
Design Spreadsheet Consultant LEAP Bridge
Super Structure Box Girder Design Time (hours) Time (hours)
Item
Modeling – Sectional properties calculations 12.0 8.0
Loading – DL, SIDL 4.0 0.8
Live load analysis using STAAD.Pro 16.0 0.4
Bending moment and shear force calculation 8.0 0.4
Cable forces 16.0 0.6
Check for ultimate loads 8.0 0.4
Stress checks 16.0 0.4
Loss calculations and deflection 8.0 0.2
Optimization 16.0 2.4
Drawings 24.0 2.4
Total 128.0 16.0
Table 8: Time Comparison – Consultant’s Methods vs. Using LEAP Bridge
Note: Calculations are based on the assumption that one day equals eight hours.
Benefits of Bentley’s LEAP Bridge SoftwareAs shown in Table 8, for an experienced bridge engineer it generally takes 15 to 20 days (128 hours) to design a box girder using conventional methods (spread-sheets and other in-house tools). Using LEAP Bridge reduced this to 2 to 3 days (16 hours) resulting in a significant savings of engineering hours.
It must be emphasized that the verification of the consultant’s design of the South Kasheli bridge using Bentley’s LEAP Bridge Enterprise software was completed in approximately one day. Using spreadsheets and other in-house tools typically would take much longer.
In addition, other benefits of using LEAP Bridge include, easy design optimization that enables development of economical designs; fast response to design changes; drastically reduced data entry, validation, and maintenance; as well as standardization of design methods across the company.
“Bentley LEAP Bridge Enterprise software is easy to use, focused on specific bridge types, fully compliant with IRC, and automates repetitive, routine calculations. This results in time savings and reduction of errors. The integrated,
full-bridge design approach helps in responding to changes in the project requirements.”
– Mr. Karandikar, Design Manager, S.N. Bhobe & Associates, Pvt. Ltd.
“Use of Bentley LEAP Bridge Enterprise software standardizes bridge design practices across the company. Monitoring, checking, and maintaining customized spreadsheets and other distributed design tools is a complex task. Implementing LEAP Bridge as a standard
design tool ensures consistent policies and quality of work throughout the organization.”
– Mr. Atul Bhobe, CEO, S.N. Bhobe & Associates, Pvt. Ltd.