Benefits of Software GPS Receivers for Enhanced Signal Processing
24
1 Published in GPS SOLUTIONS 4(1) Summer, 2000, pages 56-66. Benefits of Software GPS Receivers for Enhanced Signal Processing Alison Brown, NAVSYS Corporation 14960 Woodcarver Road, Colorado Springs, CO 80921 (719) 481-4877x314 (719) 481-4908 (fax) [email protected] Marvin May, Penn State University, Applied Research Laboratory Warminster, PA 18974-0591 Barry Tanju, Space & Naval Warfare Systems Command 4301 Pacific Highway San Diego, CA 92110-3127 Number of Pages: 24 Number of Figures: 20 ABSTRACT In this paper the architecture of a software GPS receiver is described and an analysis is included of the performance of a software GPS receiver when tracking the GPS signals in challenging environments. Results are included which demonstrate the advantage of the software GPS receiver in tracking the GPS signals in low signal-to-noise or jamming scenarios. Various current and previous applications of the software GPS receiver are also described. 1 INTRODUCTION The architecture adopted by a conventional GPS receiver is illustrated in Figure 1. The first step in the processing chain is to use an RF Digital Front-End (DFE) to digitally sample the GPS signal spectrum. The digital sampled signals are then processed using digital logic to correlate with the C/A and or P(Y) codes and digitally mix the result to baseband, using a complex multiply operation to remove the effect of the satellite doppler and receiver frequency offset (from the IF or RF sampling). The baseband digital signals are accumulated and the resulting in-phase and quadrature (I&Q) signals output for use in the receiver’s software signal processing algorithms. In a software GPS receiver, the signal processing functions that are performed using digital logic in the conventional receiver architecture shown in Figure 1 are implemented in software. This allows total flexibility in the signal processing algorithms used. In Figure 2, the software GPS receiver architecture is shown. In this architecture, the GPS signals are first buffered in memory to allow them to be accessed by the software receiver for processing. Since the GPS signals do not have to be
Transcript of Benefits of Software GPS Receivers for Enhanced Signal Processing

1
Published in GPS SOLUTIONS 4(1) Summer, 2000, pages 56-66.
Benefits of Software GPS Receivers for Enhanced Signal Processing
Alison Brown, NAVSYS Corporation
14960 Woodcarver Road, Colorado Springs, CO 80921
(719) 481-4877x314 (719) 481-4908 (fax) [email protected]
Marvin May, Penn State University, Applied Research Laboratory
Warminster, PA 18974-0591
Barry Tanju, Space & Naval Warfare Systems Command
4301 Pacific Highway
San Diego, CA 92110-3127
Number of Pages: 24
Number of Figures: 20
ABSTRACT
In this paper the architecture of a software GPS receiver is described and an analysis is included of the performance of a
software GPS receiver when tracking the GPS signals in challenging environments. Results are included which demonstrate
the advantage of the software GPS receiver in tracking the GPS signals in low signal-to-noise or jamming scenarios. Various
current and previous applications of the software GPS receiver are also described.
1 INTRODUCTION
The architecture adopted by a conventional GPS receiver is illustrated in Figure 1. The first step in the processing chain is to
use an RF Digital Front-End (DFE) to digitally sample the GPS signal spectrum. The digital sampled signals are then
processed using digital logic to correlate with the C/A and or P(Y) codes and digitally mix the result to baseband, using a
complex multiply operation to remove the effect of the satellite doppler and receiver frequency offset (from the IF or RF
sampling). The baseband digital signals are accumulated and the resulting in-phase and quadrature (I&Q) signals output for
use in the receiver’s software signal processing algorithms.
In a software GPS receiver, the signal processing functions that are performed using digital logic in the conventional receiver
architecture shown in Figure 1 are implemented in software. This allows total flexibility in the signal processing algorithms
used. In Figure 2, the software GPS receiver architecture is shown. In this architecture, the GPS signals are first buffered in
memory to allow them to be accessed by the software receiver for processing. Since the GPS signals do not have to be

2
.
processed in real-time, enhanced signal processing algorithms can be applied that allow the digital signals to be optimally
reprocessed, maximizing the probability of acquiring the GPS signals in a challenging environment.
Figure 1 Digital GPS Receiver Architecture
In Figure 2, one example of a software reprocessing algorithm is shown where the basic GPS signal processing functions are
implemented using frequency domain correlation. This approach takes advantage of the Fourier Transform correlation
theorem which states that the frequency transform of the correlation function in the time domain is the product of the signals’
transforms in the frequency domain (Brigham, E. Oran 1974).
(1)
)()()()( * fXfHdtxh ⇔+∫∞
∞−
τττ
The Fast Fourier Transform (FFT) algorithm in Equation (1) provides a convenient and computationally efficient method of
performing correlations in a software receiver architecture.

3
.
Figure 2 Software GPS Receiver Architecture
2 GPS SIGNAL PROCESSING
The performance advantage of a software GPS receiver when operating in an electronically challenged environment is
discussed in this section.
2.1 GPS Code Acquisition
The process of aligning an internally generated code to the received GPS code, which is biphase modulated on the GPS
signals, is referred to as signal acquisition. This process requires correlation with either the Coarse/Acquisition (C/A) code
for a commercial GPS receiver, or the encrypted Precision (P(Y)) code for a military GPS receiver. The local code generator
is set at some initial code epoch and the carrier Numerical Controlled Oscillator (NCO) is set at some initial carrier
frequency. This replicated signal is cross correlated with the received signal plus noise, coherently integrated over a
Predetection integration time denoted as Tc, thereby generating the in-phase and quadrature samples I(kTc) and Q(kTc),
respectively, as shown in Equation (2). These are then square-law detected, as in Equation (3), and, if necessary, summed
with other samples. The sum of the samples is then compared to a detection threshold, the magnitude of which is dependent
on the allowable probabilities of false alarm and successful detection. In Equation (4) and Equation (5) the algorithms for

4
.
computing the probability of missed detector and false alarm are shown for a specified signal-to-noise threshold (CNT).
These are derived in terms of the chi-square function P(γ|2NNC) and the non-central chi square function P(γ|2NNC,λ).
(2)
∫∫−−
==c
c
c
c
kT
Tkk
kT
Tkk dttQQdttII
)1()1(
)()(
(3)
∑=
+=NCN
kkk QIz
1
22
(4)
)2|(1)2|()0|(Pr 0
2
NCNC
nFA
NPNQCNzobP
γγγσ
−===≥=
(5)
),2|()|(Pr 0
2
TNCNC
TnMD
CNNNPCNCNzobP
×==<=
γγσ
The process of integration over Tc is known as the predetection integration interval. In general, to reduce the effects of noise
on the operation of the detection process, it is desirable to make Tc as large as possible, before having to resort to summing
over NNC noncoherent samples (I2+ Q2). However, the length of Tc is limited by the data modulated on the GPS signals (20
msecs) and by frequency uncertainty, which in turn is due to oscillator instabilities and unknown doppler effect.
Each search must be performed for every possible half code-phase interval and doppler frequency bin. The uncertainty in
code phase is due to user clock uncertainties plus user to satellite range uncertainty. For example, a user clock uncertainty of
one millisecond (random zero mean Gaussian bias - one standard deviation) and an additive user to satellite range uncertainty
of 30,000 meters (random independent Gaussian bias - one standard deviation) would result in a 3-sigma (99%) search region
of (10279 x 2 x 3) x 2 ≅ 123,345 bins for P(Y) code acquisition. Since the C/A code is repetitive over 1 msec, the search
region is much smaller for C/A code acquisition, resulting in 1023 x 2 ≅ 2,046 bins under the same assumptions.
The doppler bin size is dictated by the coherent integration period. To maintain the correlation loss due to doppler
uncertainty within 3 dB, the size of each frequency window should be kept within 0.442/Tc. If the Doppler one sigma
uncertainty and the receiver oscillator uncertainty is within 1 kilohertz, and the coherent integration period (Tc) was set at 20
milliseconds (the GPS data bit period), then the number of discrete frequencies to search over would be approximately 384.
In this scenario, the total number of bins that would need to be searched to assure P(Y) code acquisition would be over 47
million (123,345x384). It is this large number of bins to search which creates, in many operational scenarios, the
impracticality of Direct Y acquisition in an acceptable time.

5
.
With a conventional GPS receiver, the present approaches to reducing the acquisition time are:
• Time aiding the receiver with external clocks typically better than 1 millisecond. This reduces the number of searches by
reducing the code phase uncertainty.
• Massively parallel correlators. This enables the simultaneous or parallel processing of many bins at once.
• Improving the signal-to-noise ratio at the input to the receiver. As will be shown subsequently, the acquisition time
varies directly with the product of the coherent integration interval, TC and the number of summations, NNC. This
product is sometimes referred to as the dwell time per bin for a single search frequency.
In conventional GPS receivers, the acquisition process must occur in real time implying that the signal must be always
available in real time. The software GPS receiver provides an alternate strategy. By storing the broadband signal, the signal
can be “recirculated” in non real-time among the correlator resources. Instead of having to slew the correlator resources in
real time to the incoming signal until synchronization is achieved, the software receiver can “recirculate” the wideband signal
in post time without requiring further signal collection. Since, at least theoretically, the signal can be “recirculated” forever,
the software processing concept guarantees an “eventual” acquisition, given that the signal is present in the first place.
2.2 Probabilities Of Detection
The probability of false alarm (PFA ) can be computed as shown in Equation (4). The probability of detection (PD) can be
computed from the probability of missed detection shown in Equation (5) (PD=1-PMD). These probabilities are derived using
non-central chi-square density statistics as a function of the following parameters.
• NNC the number of non-coherent accumulations in the detection function
• CNT the signal-to-noise ratio threshold
• σn the RMS noise in the I or Q accumulated samples
• γ the threshold value for detection to be declared.
In the above distributions, once probabilities of false alarm and detection are chosen, then the threshold (γ) and number of
coherent integrations (NNC) may be solved for in terms of the noise power, signal power, and predetection interval.
Figure 3 utilizes modifications of this equation to plot dwell time per bin, NNCTC, versus C/N=γTC for a PD of 0.95 and a PFA
=10-4. Figure 4 to Figure 6 show the inverse solution for the PD as a function of C/N with dwell time per bin, NNCTC, and TC
as parameters. The reason for choosing total accumulation time per bin as a parameter will become apparent in the next
section where we discuss search times.

6
.
Figure 3 Dwell Time as a Function of C/N
Figure 4 Probability of Detection at Various Total Accumulation Times (Tc=1 msec)

7
.
Figure 5 Probability of Detection at Various Total Accumulation Times (Tc=5 msec)
Figure 6 Probability of Detection at Various Total Accumulation Times (Tc=20 msec)

8
.
2.3 Receiver Timing Definitions
The search time for a conventional receiver is defined as the time required to search and acquire the GPS satellite signals. It
should be distinguished from time to first fix for a GPS receiver which would normally include factors such as acquisition
and declaration of track for several satellites, bit synchronization, and Kalman filter fix convergence. It should also be
distinguished from exposure time, which is the time that the satellites must be in view of the antenna for a fix to be obtained.
In the case of a conventional GPS receiver, the exposure time must be equal to or greater than the time-to-first-fix, while, for
the case of the software receiver, exposure time represents the signal collection interval which must be greater than or equal
to the total accumulation time for the data. The processing time is the time required for the receiver to compute a navigation
solution following the exposure time. In the case of the software GPS receiver, the processing time is a function of the speed
and capacity of the receiver’s signal processing computer.
In the following section, a comparison is made of the needed exposure time between a conventional and a digital software
receiver.
A simple expression for the average sequential or serial search time in a conventional receiver is: CNCBINS TNNT 2/1search =
The average, or expected value of the random variable, search time, is therefore ½ of the product of the number of bins to
search and the dwell time per bin. Here the factor ½ occurs because that, on average, one will not have to search all the bins,
but only until a detection occurs. This expression is somewhat simplistic because it does not account for the occurrence of
false alarms and the subsequent time penalty which they cause. A more complete formula for the mean serial search time is
given in Equation (6) below:
(6)
[ ] CNCBINSFApD
Dsearch TNNPk
PP
T 12
2+
−=
In the numerical examples in this paper we chose kp=10, PFA=10-4, and PD=0.95. Figure 7 shows the normalized mean
acquisition search time as a function of the C/N for different predetection integration times.

9
.
Figure 7 Search time for conventional receiver
A conventional receiver uses multiple correlators to reduce the search time. For M correlators operating in parallel
simultaneously the simple result would indicate that the average search time would be reduced by a factor of M as shown in
Equation (7).
(7) M/2/1search CNCBINS TNNT ≅
A more precise formula, which assumes that each of the M blocks are independent and that no additional penalty occurs
when multiple false alarms occurs is given as shown in Equation (8):
(8)
{ ( )[ ] } M/111(2
SEARCH CNCBINSM
FAPD
D TNNPkP
PT +−−
−=
Note that in Equation (8), the number of bins depends on the frequency window size, which depends also on TC. Therefore
normalization by determining a mean search time per bin is not a useful methodology except for the case where there is only
one frequency to search over. plots the normalized search time versus C/N.
The exposure time for a software receiver is derived from the probability of correct detection in a single search bin. Figure 8
plots the exposure time versus C/N for the software GPS receiver. This demonstrates that reliable acquisition can be
accomplished using the software GPS receiver, even at very low signal/noise ratios. Signal detection down to 10 dB-Hz

10
.
C/N0 is possible, with exposure times of under 100 seconds. This capability enables the software GPS receiver to acquire
track the GPS signals in environments where a conventional receiver would be unable to operate.
Figure 8 Exposure time for software receiver
3 JAMMER PERFORMANCE
The enhanced signal processing capability of the software GPS receiver is also of benefit for acquisition and tracking of the
GPS signals in the presence of a jammer threat. The jammer has the effect of adding additive noise to the GPS signal
proportional to the jammer/signal (J/S) power ratio (Campanile, J., Nasuti, T., Nigro J., Engelhart, M. 1992). To operate in
the presence of a jammer, the receiver must be able to acquire under very low equivalent signal-to-noise ratios. The
equivalent signal/noise ratio can be computed from the effective noise that is added by the jammer signal as shown in the
following equation.
(9)
/
0
Ceq
CCeq
RJNQJRNJ
=
+=
In Equation (9), N0 is the thermal density, J is the jammer noise power, RC is the P(Y) code chipping rate or equivalently the
single sided front end bandwidth, and Q is a factor =1 for a narrow band jammer, 1.5 for a broad band spread spectrum
jammer, and 2 for a wide band jammer. For most cases investigating jamming, the jamming power in Equation (9)

11
.
dominates. In this analysis, only narrow band jammers were considered, so the input jammer power is not spread outside of
the front end bandwidth.
The following results were generated based on the assumptions shown below. Unless otherwise stated, the values shown are
3-sigma.
- Probability of detection of 0.95 and a probability of false alarm of 0.0001.
- Time/frequency uncertainty of 1 second/10 kHz (standard clock) and time uncertainty of 100 microseconds/2 kHz
(atomic clock)
- Sampling and processing implementation loss of 4.1 dB
- Number of correlators available for a conventional GPS receiver was 50 (Miniature Airborne GPS Receiver) or 1000 (E-
MAGR)
3.1 Exposure Time Comparison
Figure 9, represents the mean acquisition time for the conventional receivers and the exposure time for the software receiver
for the case of the standard clock.
Figure 9 Theoretical Direct Y Search Time to First SV using Standard Clock
For the conventional receivers, the mean acquisition time is defined as the mean time until a successful detection is made. As
always herein, acquisition refers only to the code correlation of the first satellite.

12
.
Note for the standard quality clock, for any J/S > 30 dB, the conventional receiver mean direct P(Y) acquisition times are
greater than 10000 seconds, which makes them totally impractical. Even for the 1000 correlator receivers, time aiding to
better than 1 second will certainly be necessary to achieve any practical acquisition performance. For the software receiver, a
significantly shorter exposure time is required. However, there will be a delay from the time that the RF snapshot is collected
until the time that the navigation solution is available, due to processing time. For applications which involve inertial
navigators, it is likely that exposure time is more important than the actual time that a fix is reported, as the inertial system
can propagate between GPS fixes. As can be seen from Figure 9, it is possible, even with a standard clock, to achieve fixes
in under 100 seconds exposure time at J/S levels of up to 50 dB.
Figure 10 Theoretical Direct Y Search Time to First SV using Superior Clock
Figure 10 shows the mean acquisition/exposure times for the time aided receiver using an atomic clock. The aiding quality
of 100 µsecs (3σ) is indicative of a 1 part in 1011 oscillator that has been reset (perfectly)within the last 38 days. For this high
quality time aiding, all the receivers except for the 1-correlator receiver could theoretically acquire in 100 seconds up to 41
dB J/S. The relative advantage of the software receiver, at least with respect to exposure time, amounts to about a 13 dB
improvement over the MAGR and 7 dB over the 1000 correlator receiver.

13
.
3.2 Probability Of Acquisition Comparison
In this section, for a given exposure time we determine the probability that a successful acquisition occurs. The curves for
probability of acquisition, were developed using the following assumptions for a conventional receiver.
- At each bin we spend NNCTC + kPPFANNC TC seconds.
- By definition the probability of a successful acquisition at a bin where the signal resides is PD. For a given fixed TSearch
we may have time to search all the bins once, or only a fraction of the bins (f)
f=
C
BINS
CNCFAPCNC
SEARCH
MN
TNPKTNT+
From Figure 11 for the standard clock, we note that only the software receiver, achieves a probability of acquisition greater
than 0.5 if restricted to less than 100 seconds. The software receiver can achieve a 95% probability of acquisition at 49dB,
55dB and 60dB for exposure times of 1, 10 and 100 seconds respectively.
Figure 11 Probability of Acquisition using Direct Y Search and Standard Clock (Exposure times are 100 sec, 10 sec, and 1
sec respectively reading right to left for a particular receiver)
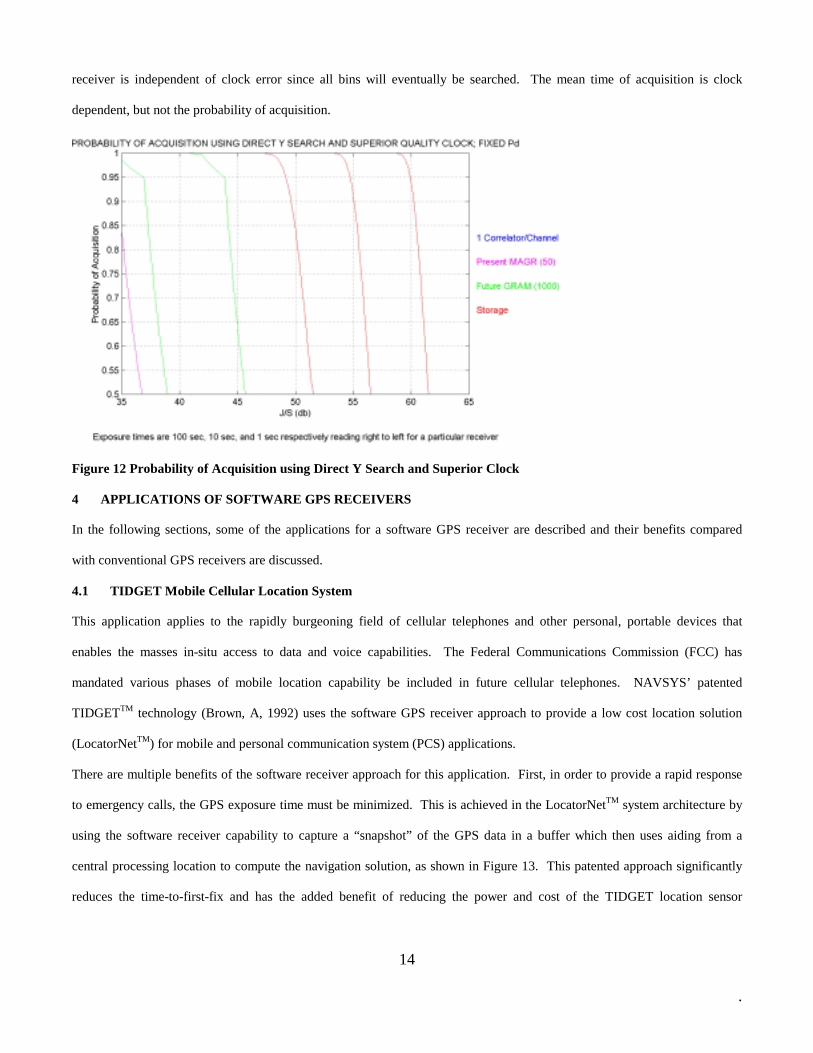
From Figure 12, for the superior clock, the simplified MAGR can achieve a 95% probability of acquisition within 100
seconds at a 34.5 dB J/S. The E-MAGR can achieve a 95% probability of acquisition within 10 seconds at a 39 dB J/S and
within 100 seconds at about 44 dB. For the software receiver, it could achieve a 95% acquisition at about 49dB, 55dB and
60dB J/S with exposure times of 1, 10, and 100 seconds, respectively. Note that the probability of acquisition of the software
14
.
receiver is independent of clock error since all bins will eventually be searched. The mean time of acquisition is clock
dependent, but not the probability of acquisition.
Figure 12 Probability of Acquisition using Direct Y Search and Superior Clock
4 APPLICATIONS OF SOFTWARE GPS RECEIVERS
In the following sections, some of the applications for a software GPS receiver are described and their benefits compared
with conventional GPS receivers are discussed.
4.1 TIDGET Mobile Cellular Location System
This application applies to the rapidly burgeoning field of cellular telephones and other personal, portable devices that
enables the masses in-situ access to data and voice capabilities. The Federal Communications Commission (FCC) has
mandated various phases of mobile location capability be included in future cellular telephones. NAVSYS’ patented
TIDGETTM technology (Brown, A, 1992) uses the software GPS receiver approach to provide a low cost location solution
(LocatorNetTM) for mobile and personal communication system (PCS) applications.
There are multiple benefits of the software receiver approach for this application. First, in order to provide a rapid response
to emergency calls, the GPS exposure time must be minimized. This is achieved in the LocatorNetTM system architecture by
using the software receiver capability to capture a “snapshot” of the GPS data in a buffer which then uses aiding from a
central processing location to compute the navigation solution, as shown in Figure 13. This patented approach significantly
reduces the time-to-first-fix and has the added benefit of reducing the power and cost of the TIDGET location sensor

15
.
(NAVSYS Corporation Patent Number 5,225,842, July 1993) and (NAVSYS Corporation Patent Number 5,379,224, January
3, 1995).
Figure 13 LocatorNet System Architecture
In Figure 14 and Figure 15 test data collected in a urban environment is shown which demonstrates the capability of the
TIDGET sensor to rapidly detect and track GPS signals using a software processing approach (Brown, A., Reed D., Sept.
1993). The TIDGET acquisition data is shown for two satellites tracked while driving through down-town Denver. A
conventional GPS receiver was used as a baseline for these tests, but this experienced significant drop-outs from building
shadowing. The TIDGET was able to track the satellites much more reliably in this environment using our software GPS
receiver signal processing.

16
.
Figure 14 SV 20 Tracking
Figure 15 SV 24 Tracking
In Figure 16, one of the PCS devices that is in operation using this technology, the Personal Guardian, is shown
(http://www.goeken.com/guardian.html).

17
.
Figure 16 Personal Guardian location device
4.2 GPS Data Storage Receivers
NAVSYS have produced a family of Digital Storage Receivers (DSR) which provide a sophisticated test and evaluation
capability for GPS development activities (May, M., Brown, A., Tanju, B, 1999) and (May, M. B., Minarik, Zeger, A., 1998).
In the DSR architecture illustrated in Figure 17, the RF Digital Front-End (DFE) signals are either digitally recorded using a
data logger co-located with the DFE or connected through a telemetry link. NAVSYS’ storage devices allow the full GPS
spectrum to be sampled and recorded with a resolution of up to 12 bits of data and data rates of up to 40 Msps.
Figure 17 Digital Storage Receiver Architecture
The stored digital GPS data can then played back either into a digital GPS receiver, such as NAVSYS Advanced GPS
Receiver (AGR) (Holm, E., Brown, A., Slosky, R., 1998), or into a software GPS receiver module where digital signal
processing software can be used to acquire and track the GPS signals. As an option, the recorded digital signals can also be
remodulated onto an RF carrier to be played back into a receiver antenna input. The capability also exists to generate
simulated digital data files for playback in the digital storage receiver architecture.

18
.
4.3 GPS Performance and Environmental Analysis
The post-test analysis capability of the digital storage receiver enables it to be used to capture segments of the GPS signal
environment for detailed analysis. This capability has been used for a variety of different applications by NAVSYS’
customers. Some of these are briefly described below.
The DSR was used to collect GPS signals from an aircraft flying above the ocean to characterize the specular component of
the GPS signal that would be received by sea-skimming missiles. This was post-processed to demonstrate the capability to
track multipath signals reflected from the sea (Auber, J., Bibaut, A., Rigal, J., 1994). This technique is now the basis of a
metrology system for measuring the height of the ocean surface
The same equipment was also used to collect flight test data that provided measurements on the signal reception
characteristic of a GPS pseudolite from an aircraft with a top and bottom mounted GPS antenna (LaBerge, E.F.C., Brown, A.,
van Diggelen, F., 1993). This flight test data was then played back post-test to replay the flight experiment through different
configurations of a pseudolite receiver to develop optimized tracking performance in the environment.
The DSR architecture has also been used for tracking missiles. NAVSYS delivered hardware to the Space Strategic Defense
Center (SSDC) which was installed on two Strypee missiles (Stadnick, P., 1996). The digital front-end was connected to a 2
Mbps telemetry link and the data was recorded at the range for post-processing. This digital GPS translator architecture was
used to demonstrate the ability to maintain carrier lock under high dynamics using test data collected from these missile
launches and from test data collected at the Holloman test track (Brown, A., Wilkison, R., 1998).
The DSR data sensor was used by the Air Force to collect data on the GPS signals in space in the Falcon Gold experiment.
The GPS sensor was installed on a Centaur orbit transfer vehicle and the recorded data telemetered to the ground for analysis
(Powell, T., Martzen, P., Sedlacek, S., Chao, C., 1998). This test data proved the capability to track the GPS satellite signals
from LEO to GEO orbits (see Figure 18).

19
.
Figure 18 Falcon Gold DSR Test Results
The data remodulation capability of the digital storage receiver (see Figure 17) can be used to provide a high fidelity signal
simulation capability. NAVSYS have developed a Matlab product that allows digital files to be generated for selected
scenarios. This provides low level visibility and control of the actual simulated environment (see Figure 19). This
simulation tool has been used, for example, to develop high fidelity high dynamic carrier phase tracking algorithms (Brown,
A., Matini, A., Caffery, D., 1996). This has enabled kinematic GPS techniques to be developed for use in precision guidance
of high dynamic vehicles such as missiles or aircraft.

20
.
Figure 19 Matlab Signal Simulation Tool
4.4 GPS Jamming Detection and Location
GPS has been adopted for virtually every military mobile operation and will be the primary navigation equipment for all
phases of commercial flight. Of critical importance are its accuracy, integrity, availability, and continuity of service in these
applications. As a low power radionavigation system, it is susceptible to both intentional and inadvertent interference. The
situational awareness of the availability and health of the GPS signal in the operational area of interest is required. If the
GPS signal is being jammed, then the nature of the jamming signal, its source and location are of critical importance. This
information will be necessary to take corrective action including prosecution of the interfering source.

21
.
Figure 20 TDOA Jammer Simulated Data Results
For jammer location (Brown, A., Reynolds, D., Roberts, Capt. D., Serie, Major S., 1999), the DSR is used as a signal monitor
to collect snapshots of the jammed signal spectrum, synchronized with a GPS time mark. When the DSR internal signal
processing indicates that GPS interference is present (e.g. through loss of lock of the GPS signals), it transmits this buffered
data to a central processing location. The advantage of this capability is that it enables TDOA/FDOA jammer location
techniques to be applied which enable location and identification of large numbers of jammers. In Figure 20, the observed
TDOA detection peaks are shown from cross-correlation between multiple DSR data sources. This system architecture was
used to locate jammers in a test performed at Holloman AFB, and demonstrated the capability to identify the location of
multiple low power jammer signals to an accuracy of better than 50 meters.
5 CONCLUSIONS
The rapid improvement in computer throughput has made direct storage and subsequent processing of the wide-band GPS
signal a practicality for many applications. In this paper, an analysis was included of the performance advantages in using a
software receiver for signal acquisition in a low signal/noise ratio or jamming environment. These advantages accrue from
the software receiver’s ability to “re-circulate” the stored data to the available processing resources. This enables the GPS
signals to be acquired and tracked in environments that would significantly challenge a conventional GPS receiver. This
approach has been demonstrated to provide enhanced GPS operation in urban regions, for space and airborne applications
and also has enabled detailed analysis of characteristics of the GPS signals, such as multipath effects.
REFERENCE LIST

22
.
Auber, J., Bibaut, A., Rigal, J. (1994). Characterization of Multipath on Land and Sea at GPS Frequencies. In Proceedings
of the Seventh International Technical Meeting of the Satellite Division of the Institute of Navigation, ION GPS-94 (pp.
1155-1171). Alexandria, VA: The Institute of Navigation.
Brigham, E. Oran (1974). The Fast Fourier Transform. Prentice-Hall, Inc., Englewood Cliffs, NJ.
Brown, A. (1992). The TIDGETTM -A Low Cost GPS Sensor for Tracking Applications. In Proceedings of the Fifth
International Technical Meeting of the Satellite Division (pp. 661-669). Alexandria, VA: The Institute of Navigation
Brown, A., Reed, D. (1993). GPS Receiver - TIDGET-Plus: Urban Navigation with Stand-Alone GPS. In Proceedings of
the Sixth International Technical Meeting of the Satellite Division (pp.959-966). Alexandria, VA: The Institute of
Navigation
Brown, A., Matini, A., Caffery, D. (1996). High Dynamic, Dual Frequency Tracking with a Low Bandwidth Digital
Translator. In Proceedings of the 9th International Technical Meeting of the Satellite Division of the Institute of Navigation
ION GPS-96 (pp.1709-1717), Alexandria, VA: The Institute of Navigation.
Brown, A., Wilkison, R. (1998). Direct Sensor to Weapon Network (DSTWN) Architecture. American Institute of
Aeronautics and Astronautics, Proceedings of the AIAA Defense and Civil Space Programs Conference and Exhibit (8
pages), Huntsville, AL.
Brown, A., Reynolds, D., Roberts, Capt. D., Serie, Major S. (1999). Jammer and Interference Location System – Design And
Initial Test Results. In Proceedings of the 12th International Technical Meeting of the Satellite Division of the Institute of
Navigation, ION GPS-99 (pp.137-142), Alexandria, VA: The Institute of Navigation.
Campanile, J., Nasuti, T., Nigro J., Engelhart, M. (1992). GPS Acquisition Performance in the Presence of Jamming. In the
Proceedings of Fifth International Technical Meeting of the Satellite Division ION-GPS-92 (pp. 265-274). Alexandria, VA:
The Institute of Navigation.
Holm, E., Brown, A., Slosky, R. (1998). A Modular Re-programmable Digital Receiver Architecture. In Proceedings of the
54th Annual Meeting (pp.543-547). Alexandria, VA: The Institute of Navigation.
LaBerge, E.F.C., Brown, A., van Diggelen, F., (1993). Test Results of a GPS/Pseudolite Precision Approach and Landing
System. In Proceedings of the Sixth International Technical Meeting of the Satellite Division, ION GPS-93 (p.853).
Alexandria, VA: The Institute of Navigation.
May, M. B., Minarik, S., Zeger, A. (1998). GPS Aided Mission Enhancement (GAME). In Proceedings of the 11th
International Technical Meeting of the Satellite Division, ION GPS-98 (pp.841-849). Alexandria, VA: The Institute of
Navigation.

23
.
May, M., Brown, A., Tanju, B., (1999). Applications of Digital Storage Receivers for Enhanced Signal Processing. In
Proceedings of the 12th International Technical Meeting of the Satellite Division of the Institute of Navigation, ION GPS-99
(pp.2199-2208), Alexandria, VA: The Institute of Navigation.
NAVSYS Corporation Patent Number 5,225,842, July 6, 1993. Vehicle Tracking System Employing Global Positioning
System (GPS) Satellites. Alison K. Brown and Mark A. Sturza.
NAVSYS Corporation Patent Number 5,379,224, January 3, 1995. GPS Tracking System. Alison K. Brown and Mark A.
Sturza.
Powell, T., Martzen, P., Sedlacek, S., Chao, C., (15 October 1998). Falcon Gold Experiment Data Processing at the
Aerospace Corporation. http://www.navsys.com/Falcon_Gold_Project.pdf
Stadnick, P. (1996). Flight Test of an Integrated Digital GPS Translator. The Institute of Electrical and Electronic
Engineers, Inc., Proceedings of 1996 IEEE Position Location and Navigation Symposium (pp. 75-82), New York, NY.
BIOGRAPHY.
Alison Brown is the President and CEO of NAVSYS Corp. She has a PhD in Mechanics, Aerospace, and Nuclear
Engineering from UCLA, an MS in Aeronautics and Astronautics from MIT, and an MA in Engineering from Cambridge
Univ. In 1986 she founded NAVSYS. Currently she is a member of the GPS-III Independent Review Team and Science
Advisory Board for the USAF and serves on the GPS World editorial advisory board.
Marvin May is responsible for Navigation Technology and education at PA State’s Applied Research Laboratory Navigation
Center in Warminster, PA. He has a BSEE from City College of NY and Masters Degree from New York University and
Polytechnic, and is a Professional Engineer. He is an adjunct professor at several universities and teaches Master’s Degree
navigation courses for the Pa. State Great Valley Graduate Center. At NCCOSC, he was the Chief Analyst of the Global
Positioning System Division as well as Project Engineer on inertial and geophysical navigation programs. May has
numerous ION publications and has been Chairman of the Greater Philadelphia Chapter, national Marine Navigation
representative and is now Historian of the Institute of Navigation
Bereket Tanju works for the Navy’s Navigation Systems Program Office as the Assistant Program Manager for GPS
Modernization. Prior to this, he was a navigation systems engineer at a Navy laboratory working on GPS/INS based
research, development, test and evaluation. He has a BSEE from the University of Maryland, and an MSIE from the
Pennsylvania State University. He is a 98 graduate of the Defense Systems Management College, School of Advanced
Program Management.

1
.
List of Figures
Figure 1 Digital GPS Receiver Architecture
Figure 2 Software GPS Receiver Architecture
Figure 3 Dwell Time as a Function of C/N
Figure 4 Probability of Detection at Various Total Accumulation Times (Tc=1 msec)
Figure 5 Probability of Detection at Various Total Accumulation Times (Tc=5 msec)
Figure 6 Probability of Detection at Various Total Accumulation Times (Tc=20 msec)
Figure 7 Search time for conventional receiver
Figure 8 Exposure time for software receiver
Figure 9 Theoretical Direct Y Search Time to First SV using Standard Clock
Figure 10 Theoretical Direct Y Search Time to First SV using Superior Clock
Figure 11 Probability of Acquisition using Direct Y Search and Standard Clock (Exposure times are 100 sec, 10 sec,
and 1 sec respectively reading right to left for a particular receiver)
Figure 12 Probability of Acquisition using Direct Y Search and Superior Clock
Figure 13 LocatorNet System Architecture
Figure 14 SV 20 Tracking
Figure 15 SV 24 Tracking
Figure 16 Personal Guardian location device
Figure 17 Digital Storage Receiver Architecture
Figure 18 Falcon Gold DSR Test Results
Figure 19 Matlab Signal Simulation Tool
Figure 20 TDOA Jammer Simulated Data Results