Benefits of Collecting OEE Data with Production Tracking Software
45
The Short and Long-Term Benefits of Automatically Collecting OEE Data from Your Machines Make It Better, Keep It Better Jim Finnerty Product Manager Wintriss Controls Group www.wintriss.com/sfc
-
Upload
wintriss-controls-group-llc -
Category
Data & Analytics
-
view
125 -
download
0
Transcript of Benefits of Collecting OEE Data with Production Tracking Software

The Short and Long-Term Benefits of Automatically
Collecting OEE Data from Your Machines
Make It Better, Keep It Better
Jim Finnerty
Product Manager
Wintriss Controls Group
www.wintriss.com/sfc

2/24/2017©2014 Wintriss Controls – All rights reservedSlide 2
im·prove [im-proov] verb
1. to bring into a more desirable or
excellent condition
2. to make better use of

Improvement
• All manufacturers want to improve the efficiency of
their operation
• With unlimited resources, you could improve the
productivity of every piece of equipment in your
factory
• Sadly, you don’t have unlimited resources
2/24/2017©2014 Wintriss Controls – All rights reservedSlide 3
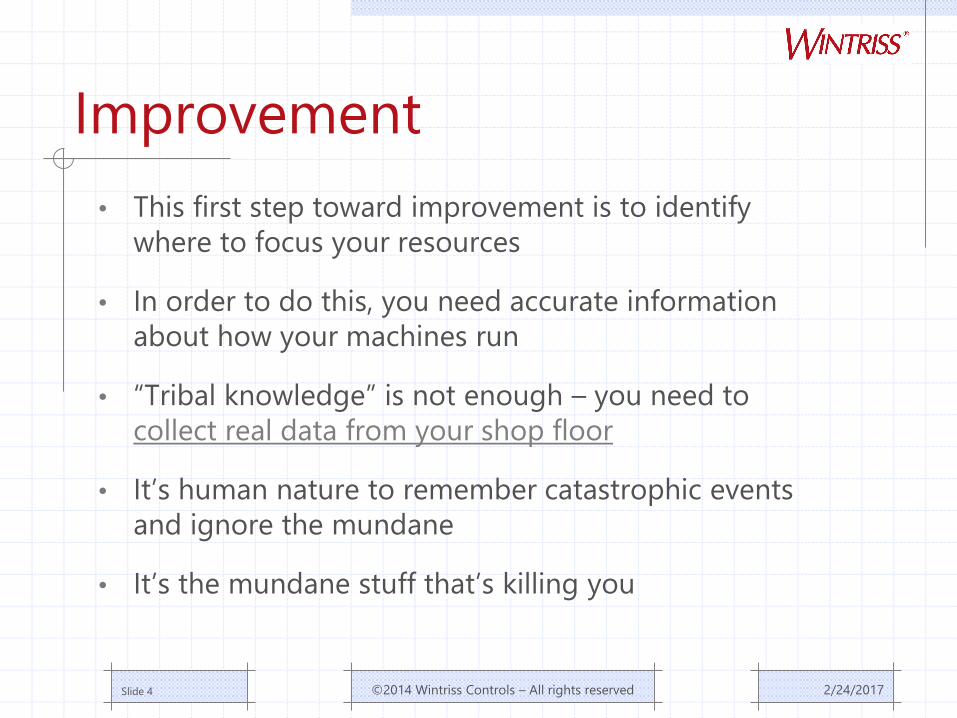
Improvement
• This first step toward improvement is to identify
where to focus your resources
• In order to do this, you need accurate information
about how your machines run
• “Tribal knowledge” is not enough – you need to
collect real data from your shop floor
• It’s human nature to remember catastrophic events
and ignore the mundane
• It’s the mundane stuff that’s killing you
2/24/2017©2014 Wintriss Controls – All rights reservedSlide 4

The Goal:
• To collect data that is:
Timely
Pertinent
Accurate
Unbiased
• And make the data readily available to everyone and
everything
©2014 Wintriss Controls – All rights reserved 2/24/2017Slide 5

Data Collection – What method?
• Data can be collected manually or automatically
• Manually collected data is often biased, late, and inaccurate
• When production data is manually tracked, the person recording the information will usually do as little as possible, as quickly as possible
• If data could be collected automatically, these problems would disappear
• The problem with automatic data collection is that it’s hard to do
©2014 Wintriss Controls – All rights reserved 2/24/2017Slide 6

Controllers
• Proprietary controllers
• PLCs
• PC-based controls
©2014 Wintriss Controls – All rights reserved 2/24/2017Slide 7
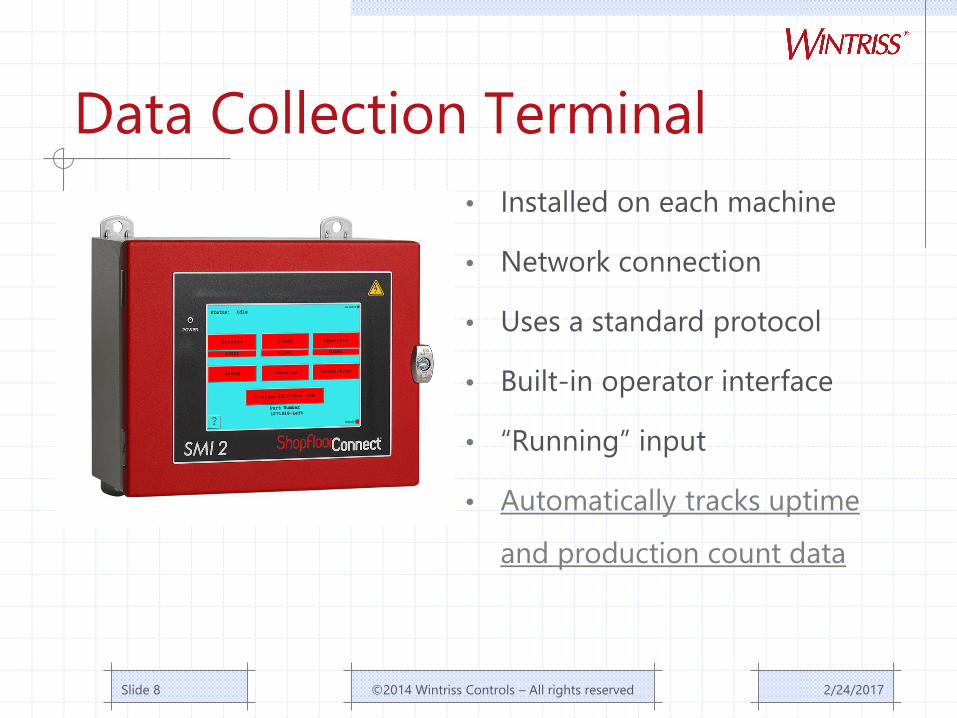
Data Collection Terminal
©2014 Wintriss Controls – All rights reserved 2/24/2017Slide 8
• Installed on each machine
• Network connection
• Uses a standard protocol
• Built-in operator interface
• “Running” input
• Automatically tracks uptime
and production count data
Data Collection – What Data?
• At the very least, you should collect:
Part counts
Status (running, down, changeover, etc.) over time
Tool, job, and operator info
• This information will allow you to calculate Overall Equipment Effectiveness
©2014 Wintriss Controls – All rights reserved 2/24/2017Slide 9

What is OEE?
• OEE (Overall Equipment Effectiveness) is a "best
practices" way to monitor and improve the efficiency
of manufacturing processes
• OEE takes the most common and important sources
of manufacturing productivity loss and places them
into three primary categories
• OEE is frequently used as a key metric in Lean
Manufacturing programs
©2014 Wintriss Controls – All rights reserved 2/24/2017Slide 10
• OEE = Availability x Performance x Quality
What is OEE? - Availability
• Availability is the percentage of time that the machine runs, compared to the total time
• Availability takes downtime loss into account
• There is a distinction between planned and unplanned downtime
• “Planned downtime” includes lunchtime, breaks, and planned maintenance
• Unplanned downtime covers everything else
©2014 Wintriss Controls – All rights reserved 2/24/2017Slide 11

What is OEE? - Availability
• Example:
There are 480 minutes in an 8-hour shift, 960 in two shifts
With a ½ hour for lunch and two 15-minute breaks, planned downtime is 60 minutes/shift. That leaves a net available time of 840 minutes.
If at the end of two shifts, there’s been a total of 144 minutes of unplanned downtime, the availability is:
©2014 Wintriss Controls – All rights reserved 2/24/2017Slide 12
(840 minutes – 144 minutes) / 840 minutes = .83
Availability was 83%

What is OEE? - Quality
• Quality is equal to the Good Parts / Total Parts
• Example:
Out of our 30,000 parts, 600 were later rejected.
©2014 Wintriss Controls – All rights reserved 2/24/2017Slide 13
29,400 parts / 30,000 parts = .98
Quality was 98%

What is OEE? - Performance
• Performance takes into account speed loss, which
includes any factors that cause the process to operate at
less than the maximum possible speed, when running.
• For example, if a machine’s maximum operating speed is
100 SPM, the maximum production rate is 6000 parts
per hour (with a one-up die)
• If that machine is run at 75 SPM, there’s a 25% loss
©2014 Wintriss Controls – All rights reserved 2/24/2017Slide 14

What is OEE? - Performance
• Example:
The press’s maximum operating speed is 100 SPM. This
equals a maximum production rate of 6000 parts/hour.
During our (840 minutes –144 minutes) 696 minutes of
operating time, we made 30,000 parts, giving us an
actual production rate of 2586 parts/hour.
©2014 Wintriss Controls – All rights reserved 2/24/2017Slide 15
2586 parts/hour divided by 6000 parts/hour = .43
Performance was 43%

What is OEE?
• OEE = Availability x Quality x Performance
©2014 Wintriss Controls – All rights reserved 2/24/2017Slide 16
Availability (83%) x Quality (98%) x Performance (43%)
OEE = 35%

Where OEE Falls Short…
• Overly simplistic (by design)
• Difficult to average over time because jobs differ in
size (quantity & time)
• Calculations become very difficult for multiple-up
operations
• Performance calculations are skewed
©2014 Wintriss Controls – All rights reserved 2/24/2017Slide 17

OEE - Performance
• Traditional OEE uses the machine’s “Ideal Rate” to
determine performance percentage
• The Ideal Rate is the maximum machine speed, which
traditional OEE holds as the limiting factor for
performance
• For many operations, maximum machine speed is not the
limiting factor
©2014 Wintriss Controls – All rights reserved 2/24/2017Slide 18
Fixing OEE
• Instead of a single machine Ideal Rate, use different
ideal rates for each machine/part combination
• This addresses the true performance limiting factor for
each part, and accounts for multiple-up operations
• Instead of trying to “weight” jobs, simply track and
average the whole period.
• All of this is very difficult to manage manually
©2014 Wintriss Controls – All rights reserved 2/24/2017Slide 19

Fixing OEE
• An automatic system can track which job is in which
machine, and apply the appropriate ideal rate
• Rates can be automatically multiplied for multiple up
processes
• OEE can be displayed in real time as a job is running
• Different sized jobs can be appropriately weighted to
provide accurate OEE for a process over a longer period of
time
©2014 Wintriss Controls – All rights reserved 2/24/2017Slide 20

Downtime Reasons
2/24/2017©2014 Wintriss Controls – All rights reservedSlide 21

Downtime Reasons
• In order to improve a machine’s efficiency, it is essential
that you know what is causing the downtime
• This information may be known only to the operator,
and cannot be collected automatically
• A good data collection system can coax the operator
into providing this information
• Additional functions are required at the machine
2/24/2017©2014 Wintriss Controls – All rights reservedSlide 22
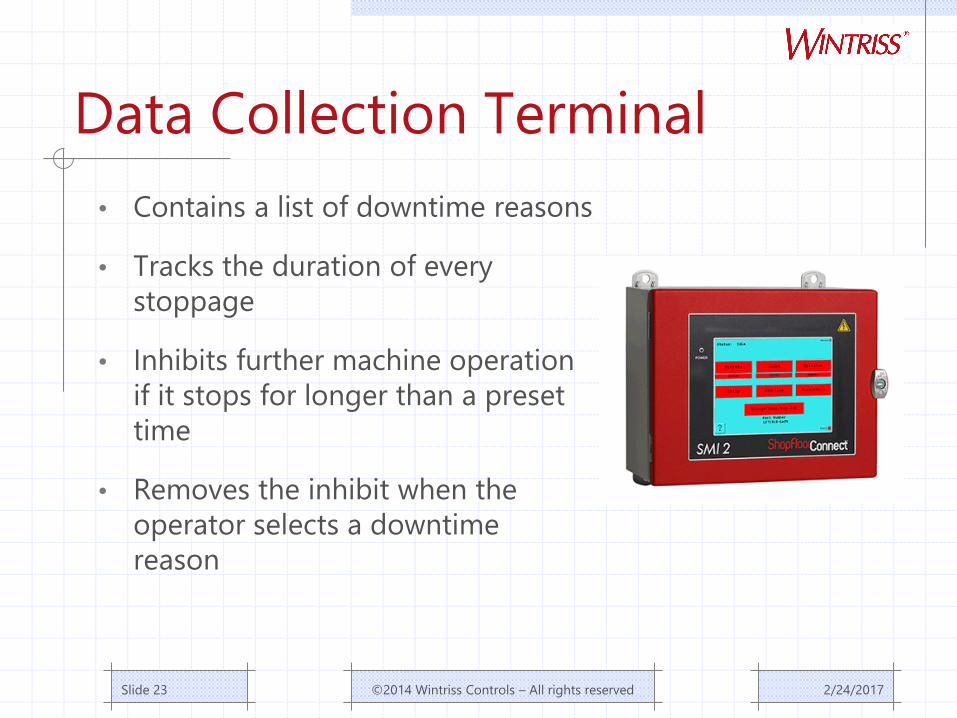
Data Collection Terminal
©2014 Wintriss Controls – All rights reserved 2/24/2017Slide 23
• Contains a list of downtime reasons
• Tracks the duration of every
stoppage
• Inhibits further machine operation
if it stops for longer than a preset
time
• Removes the inhibit when the
operator selects a downtime
reason

Real Time Data
• An automatic data collection system provides the
most benefit shortly after it is implemented
• Specific areas for improvement are identified, and
improvements are made
• When all the improvements are made, is it possible
to still get significant benefit from the system?
• Yes. Real-time data is the gift that keeps on giving
2/24/2017©2014 Wintriss Controls – All rights reservedSlide 24

Real Time Data
• Machine status display allows personnel to quickly
respond to problems with a machine
2/24/2017©2014 Wintriss Controls – All rights reservedSlide 25
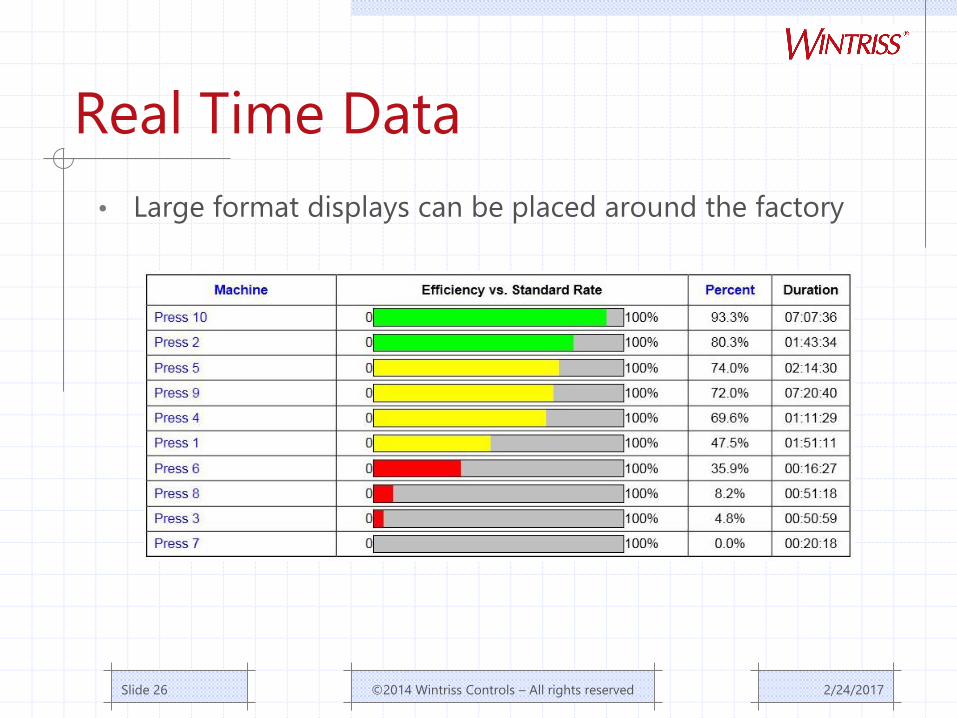
Real Time Data
• Large format displays can be placed around the factory
2/24/2017©2014 Wintriss Controls – All rights reservedSlide 26

Real Time Data
• Detailed job info can reduce “hidden” downtime
2/24/2017©2014 Wintriss Controls – All rights reservedSlide 27

Remember This Slide?
• We still need to address collecting tool, job and operator details
©2014 Wintriss Controls – All rights reserved 2/24/2017Slide 28

Track Total Hits on Each Tool
• Accurate hits counts are possible
2/24/2017©2014 Wintriss Controls – All rights reservedSlide 29

2/24/2017Page 30
Data Collection Success Stories
• A contract manufacturer was able to realize the
following benefits within six months of installation:
• Determined which jobs they needed to re-quote
(based on efficiency vs. the standard rate)
• Reduced tool maintenance-related downtime by
25% by accurately tracking hits and maintaining the
dies before they got too beat up
©2014 Wintriss Controls – All rights reserved

2/24/2017Page 31
Data Collection Success Stories
• By tracking efficiency by operator, they were able to
determine where they needed to focus their training
efforts.
• Justified a new feed purchase based on ROI from
reduced downtime
©2014 Wintriss Controls – All rights reserved

Downtime Reduction
• The automatically-generated
downtime reports indicated that an
Indiana contract stamper was
spending sixty hours per week
changing coils
• They decided to dedicate a full time
junior setup person to assist with
coil changes
2/24/2017Page 32 ©2014 Wintriss Controls – All rights reserved
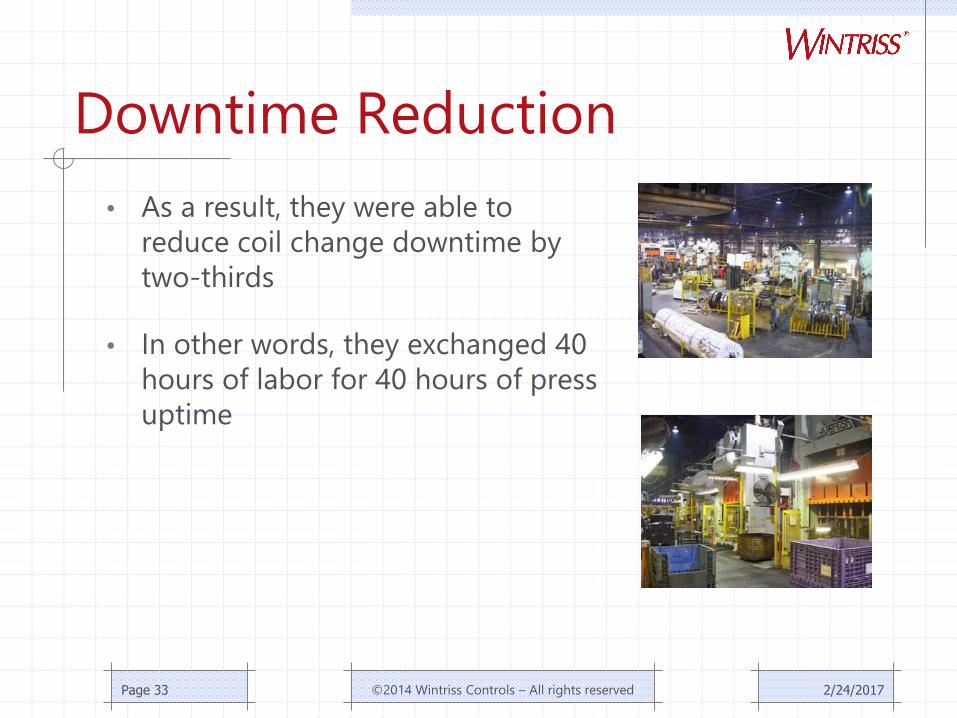
Downtime Reduction
• As a result, they were able to
reduce coil change downtime by
two-thirds
• In other words, they exchanged 40
hours of labor for 40 hours of press
uptime
2/24/2017Page 33 ©2014 Wintriss Controls – All rights reserved

More Downtime Reduction
• The same company was also
experiencing excessive downtime
caused by poor setup practices
• By providing additional training to
the setup people, they were able
to minimize setup-related
downtime like sensor faults and
straightener and feed issues
2/24/2017Page 34 ©2014 Wintriss Controls – All rights reserved

More Downtime Reduction
• This resulted in a 15% reduction
• They estimate that a further
downtime reduction of 9% came
from simply displaying real time data
out in the factory
2/24/2017Page 35 ©2014 Wintriss Controls – All rights reserved

Blame it on the New Guy
• A stamper is running 4 identical presses
making motor laminations
• The operators must constantly unload the
parts, so if the operator steps away, he has
to stop the machine
• The 4 machines share a common scrap
conveyor
2/24/2017Page 36 ©2014 Wintriss Controls – All rights reserved

Blame it on the New Guy
2/24/2017Page 37 ©2014 Wintriss Controls – All rights reserved
• Each day, one of the 4 presses would
have significantly more downtime than
the other three
• It was always the same operator that
had the extra downtime
• The additional downtime was caused by
the operator stepping away from the
press to change the scrap dumpster at
the end of the conveyor

Blame it on the New Guy
2/24/2017Page 38 ©2014 Wintriss Controls – All rights reserved
• The other three operators made him
do it because he was the new guy
• By assigning a utility person to the 4-
press cell to change the scrap
dumpster and stage coils, they reduced
downtime by 25%

More Downtime Reduction
• Downtime reports indicated that 15 minutes of every
hour were spent doing coil changes on large presses at
a Chicago-area metal stamper
• They knew it was bad, but the data collection software
allowed them to put hard numbers on it
• Upon review, they decided that their coil change
process was about as efficient as it was going to get
2/24/2017Page 39 ©2014 Wintriss Controls – All rights reserved
More Downtime Reduction
• Using the collected data, they were able to justify the
purchase of larger reels that could handle coils twice
as large
• In the end, they cut their coil change downtime in half
2/24/2017Page 40 ©2014 Wintriss Controls – All rights reserved

Downtime Reduction Team
• The same Chicago-area stamper has a group of
production and engineering people that meet weekly
to go over the “Top Ten” downtime list and identify
recurring problems
• “Waiting for QC” was a big source of downtime, so
they modified their procedures and built more gages
to allow the operators to do more QC at the machine
2/24/2017Page 41 ©2014 Wintriss Controls – All rights reserved

Downtime Reduction Team
• Using the downtime reports, they were able to
identify the operators that required additional
training
• They had the operators with the lowest downtime
number do the actual training
2/24/2017Page 42 ©2014 Wintriss Controls – All rights reserved
Efficiency Improvement
• The Bottom Line:
This manufacturer was able to
increase their plant-wide OEE from
32% to 55%
2/24/2017Page 43 ©2014 Wintriss Controls – All rights reserved

Use the Data
• Once the data is collected and
placed into a database, it
becomes available to all of
your other systems
• Building a system around
standard software
components makes it easier
to share the data
• See more examples of OEE
software applications
2/24/2017©2014 Wintriss Controls – All rights reservedSlide 44
Call on Us for Assistance
• Backed by 60+ years of manufacturing experience, we
developed our first downtime data collection and
efficiency reporting software product in 1985.
• Wintriss has the expertise to help you improve your data
collection, cut down time and boost efficiency.
• Read our data collection whitepaper to learn more
Contact us by:
Calling (800) 586-8324
Scheduling a demo
Submitting a question
2/24/2017©2014 Wintriss Controls – All rights reservedSlide 45