Benefits and Costs of Implementing the IAPMO Green ... tnncovp ijemodb1o8,nje82o8b 2 projec benefits...
17
PROJECT ENVIRONMENT DECEMBER 18, 2014 Benefits and Costs of Implementing the IAPMO Green Plumbing and Mechanical Code Supplement in Hawaii
Transcript of Benefits and Costs of Implementing the IAPMO Green ... tnncovp ijemodb1o8,nje82o8b 2 projec benefits...

PROJECT ENVIRONMENT
DECEMBER 18, 2014
Benefits and Costs of Implementing the IAPMO Green Plumbing and Mechanical Code Supplement in Hawaii

UHERO.HAWAII.EDU
PROJECT ENVIRONMENT 2
© 2014
BENEFITS AND COSTS OF IMPLEMENTING THE IAPMO GREEN PLUMBING AND MECHANICAL CODE
SUPPLEMENT IN HAWAII
©2014 University of Hawai‘i Economic Research Organization.
KIMBERLY BURNETT, PH.D. UHERO Research Economist
CHRISTOPHER WADA, PH.D. UHERO Research Economist
This research was supported by Hawaii Community Foundation
2424 MAILE WAY, ROOM 540 • HONOLULU, HAWAI‘ I 96822
(808) 956-7605 • UHERO@HAWAII .EDU

UHERO.HAWAII.EDU
PROJECT ENVIRONMENT 3
© 2014
EXECUTIVE SUMMARY
We calculate the benefits and costs of implementing the International Association of Plumbing and Mechanical Officials (IAP-
MO) 2012 Green Plumbing and Mechanical Code Supplement (GPMC) for various building types in Hawaii, with particular
emphasis on water-use efficiency provisions in the code. Benefits of the GPMC are measured as water savings, where baseline
usage is estimated in accordance with the 2012 Uniform Plumbing Code (UPC), which has been recently adopted by the state
and will soon be adopted by the counties. We also monetize those benefits at the household level (water bill savings) and at the
state level (cost savings to the water supply boards and departments throughout the state). Based on discussions with plumbers,
building contractors, developers, architects, mechanical engineers, planners, and other water specialists, as well as an assessment
of prices at major home improvement stores and other online retailers, we estimate the costs of GPMC compliance for new
structures planned for Hawaii over the next decade. If the GPMC is implemented, the payback period is two years and the net
present value assuming a discount rate of zero is $15.13 million. For a discount rate of 5%, the NPV is $11.29 million.
THE 2012 GREEN PLUMBING AND MECHANICAL CODE SUPPLEMENT
The IAPMO GPMC was first published in 2010 and has since been updated once in 2012. The GPMC is unique in that it
overlays existing published plumbing codes such as the 2012 UPC and there are no tiers of compliance or rating systems. The
GPMC is touted as being 20% more efficient than current plumbing codes and covers several major areas: high efficiency
plumbing fittings, fixtures and appliances; submetering for all commercial applications; water heating design, equipment, and
installation; occupancy specific provisions; and alternate water sources.
HIGH EFFICIENCY PLUMBING FITTINGS, FIXTURES AND APPLIANCES
The 2012 GPMC sets maximum flow-rate standards for indoor fixtures in both residential and commercial buildings as de-
scribed in Table 1.
TABLE 1. GPMC FIXTURE EFFICIENCY STANDARDS
Residential toilets 1.28 gallons/flush (gpf)Residential bathroom faucets 1.5 gallons/minute (gpm)Residential kitchen faucets 1.8 gpmResidential showerheads 2.0 gpmCommercial toilets 1.28 gpfUrinals 0.5 gpfCommercial faucets 0.5 gpmCommercial metering faucets 0.25 gallons/cycleCommercial pre-rinse spray valves 1.3 gpmFlushometer valve toilets 1.6 gpf
Also, water pressure should not exceed 60 psi, with the exception of showerheads (max flow-rate of 80 psi). Capping pressure
reduces water lost due to leakage and lessens wear and tear on mechanical components.

UHERO.HAWAII.EDU
PROJECT ENVIRONMENT 4
© 2014
The GPMC requires that residential clothes washers and residential and commercial dishwashers be in accordance with the
Energy Star program requirements. Given that new residential units are already typically being equipped with Energy Star
appliances, there is likely to be little additional water savings attributable to GPMC appliance standards. We therefore do not
include the costs and benefits of water-using appliances in our analysis.
OCCUPANCY SPECIFIC PROVISIONS
Potential water savings may be large for restaurants. Typical (older) pre-rinse spray valves consume two-thirds of water used in a
restaurant, exceed 3.0 gpm, and may be operated for 5 or more hours per day. The 2012 GPMC requires that pre-rinse spray
valves have an automatic shut-off feature and have a maximum flow rate of 1.3 gpm. Other occupancy specific water efficiency
requirements include those related to ice makers, food steamers and dipper well faucets. In this study we focus on retail space
and do not include restaurant-specific provisions in water savings calculations for the commercial sector but recognize that this
would be an important potential benefit that could be realized at low cost if restaurants turn out to make up a sizeable share of
future commercial development in Hawaii.
SUBMETERING
The 2012 GPMC requires that submeters be installed for all commercial applications including tenant spaces; landscape ir-
rigation systems; high water-using processes; and makeup water to cooling towers, evaporative condensers, and large boilers.
In particular, a submeter would be required for all individual tenant spaces on a property where water consumption exceeds
500 gallons per day for that tenant; the space is occupied by a commercial laundry, cleaning operation, restaurant, food service,
medical office, dental office, laboratory, beauty salon or barber shop; or the total building area exceeds 50,000 square feet. Indi-
vidual metering of tenants creates accountability and is a proven water efficiency tool.
WATER HEATING DESIGN, EQUIPMENT AND INSTALLATION
The 2012 GPMC includes provisions for conserving potable and non-potable water and energy associated with the generation
and use of hot water in buildings. This includes provisions for the portion of the potable water distribution system between a
water-heating device and the plumbing fixtures, including all dedicated return piping and appurtenances to the water-heating
device in a recirculation system. Potential water savings from a recirculation or other non-traditional distribution system depends
largely on the design of the building under consideration, so estimating the benefits related to water heating efficiency would
require a plumber to examine floor plans for all of the planned units included in our analysis (i.e. not just room counts), which is
not feasible for this study. Moreover, installation of recirculation systems would not be mandated under the GPMC; rather, the
GPMC ensures that if such systems are voluntarily installed, they meet certain efficiency standards. If the code were amended
to require recirculation pumps in new residences, however, the rough-in plumbing cost for labor and materials (pump, timer,
by-pass valves and connectors) would likely cost somewhere in the ballpark of $750. As already noted, the potential benefits will

UHERO.HAWAII.EDU
PROJECT ENVIRONMENT 5
© 2014
vary, but pumps currently on the market claim savings of up to 15,000 gallons per year.1 Together, those estimates could be used
to calculate the costs and benefits of requiring recirculation systems in new homes, but we do not consider them in the current
analysis, given that they are not mandated under the GPMC. Other provisions for water heating (e.g. those related to water
softening) are aimed at reducing energy use, and we do not monetize those potential benefits in the analysis.
ALTERNATE WATER SOURCES
Alternate water sources are non-potable sources of water that include but are not limited to gray water, on-site treated non-
potable water, rainwater, and reclaimed (recycled) water. The 2012 GPMC includes provisions for alternate water source
systems in the following areas: minimum water quality, backflow prevention, cross-connection testing, system design, permit-
ting, maintenance and inspection, and system marking and coloring. Although these requirements ensure safe installation and
operation of non-potable water systems that would ultimately reduce potable water use, the code does not mandate installation
of non-potable water systems (or piping) in new buildings.2 Thus, it would be difficult to estimate the effect of such provisions
on water use statewide without a better idea of how those provisions affect the likelihood of alternate water source adoption in
various sectors. Furthermore, mandating the installation of alternate water systems in new buildings would be challenging from
an implementation standpoint because the benefits of such systems could vary greatly across locations. For example, rainwater
catchment systems would not be particularly beneficial in very wet areas where outdoor water use is already low or in very dry
areas where the potential to capture rain is small. Residents in such areas would face higher home prices with minimal benefits.
If an alternate water system (e.g. graywater irrigation system) were mandated for new construction, the cost would vary accord-
ing to the completeness of the system. At minimum, a separate main line would be required to separate the gray water from
black water, allowing a resident to later hook up an irrigation system without having to make any changes to plumbing inside the
house. If the rough-in process included installation of a holding tank and/or the irrigation system as well, then the cost would
be much higher.
BUILDING TYPES
In 2013, the value of building permits totaled $2.7 billion statewide, with $1.02 billion attributed to residential permits, $75
million attributed to hotel permits, and $221 million attributed to non-residential permits (DBEDT, 2013). Permits for additions
and alterations accounted for the remaining $1.4 billion. Information gathered on planned projects over the next decade sug-
gests that the trend is continuing: residential development largely outweighs hotel and commercial development. In our analysis,
we further divide residential development into condominiums and single-family homes (SFHs). Water users therefore fall into
one of four general categories: condominiums, SFHs, hotels, or commercial. Although the commercial category could be bro-
ken down further into subcategories to account for the potentially large difference in water use between, for example, a restau-
1 http://www.amazon.com/Watts-500800-Premier-Water-Recirculation/dp/B000E78XHG/ref=zg_bs_601479011_9. It should be noted, however, that the purported water savings may be calculated with respect to baseline usage that does not correspond to the standards outlined in the 2012 UPC.2 Mandating this type of installation may not generate the desired results; people need to elect to “do the right thing” for such a measure to work the way it is intended (personal communication, T. Hiu). One possible way to encourage participation is an incentive or rebate program for the installation of alternative water systems by individual water users.
UHERO.HAWAII.EDU
PROJECT ENVIRONMENT 6
© 2014
rant and a clothing store, information about planned commercial development is often not specific enough to do so.3 Therefore
as detailed below, we focus on retail space in the commercial category and estimate savings based on a water use intensity index.
Since we do not have detailed information about planned permits for additions and alterations, we project water savings for that
category based on its relative historical contribution to total permit value. The average value of permits for additions and altera-
tions accounted for roughly 53% of the value of all building permits over the period 2011-2013. The final calculation for water
savings in each building category is therefore based on the total number of new/planned permits, adjusted upward by 53% to
account for expected additions and alterations.
Recently completed projects are not included in the analysis because per the 2012 GPMC, no provisions shall be deemed to
require a change in any portion of a plumbing system in an existing building when such work was installed and is maintained in
accordance with law in effect prior to the effective date of the GPMC.
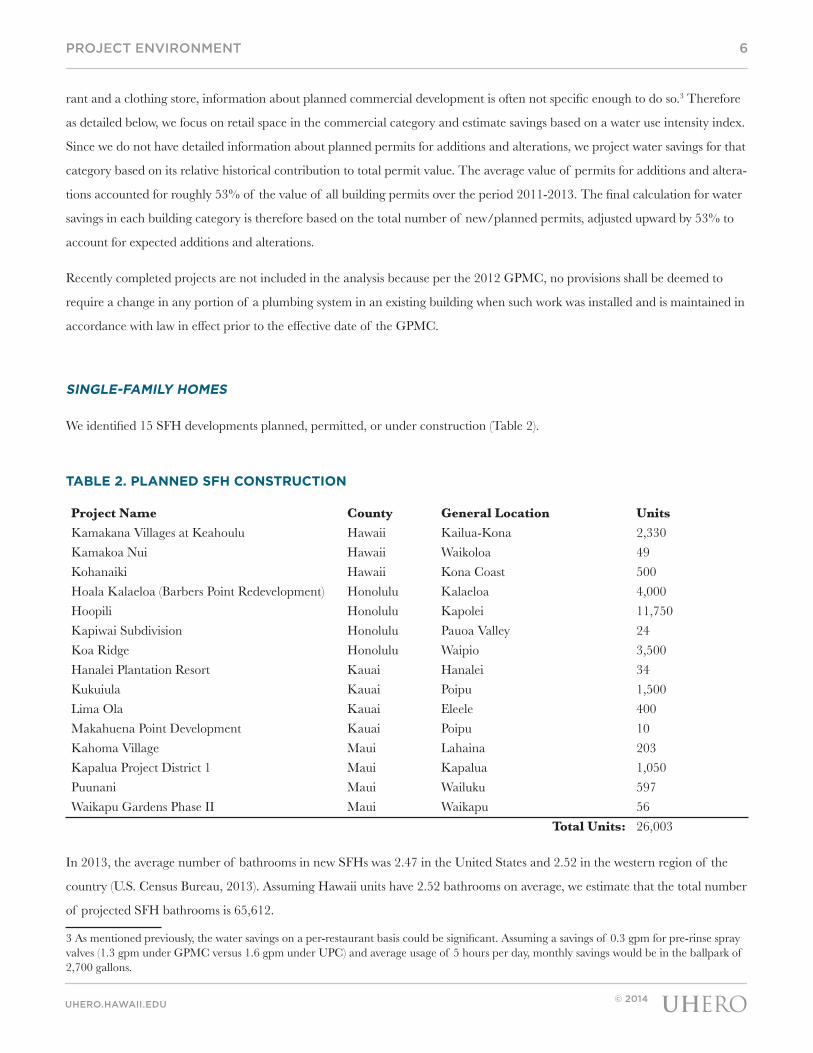
SINGLE-FAMILY HOMES
We identified 15 SFH developments planned, permitted, or under construction (Table 2).
TABLE 2. PLANNED SFH CONSTRUCTION
Project Name County General Location UnitsKamakana Villages at Keahoulu Hawaii Kailua-Kona 2,330Kamakoa Nui Hawaii Waikoloa 49Kohanaiki Hawaii Kona Coast 500Hoala Kalaeloa (Barbers Point Redevelopment) Honolulu Kalaeloa 4,000Hoopili Honolulu Kapolei 11,750Kapiwai Subdivision Honolulu Pauoa Valley 24Koa Ridge Honolulu Waipio 3,500Hanalei Plantation Resort Kauai Hanalei 34Kukuiula Kauai Poipu 1,500Lima Ola Kauai Eleele 400Makahuena Point Development Kauai Poipu 10Kahoma Village Maui Lahaina 203Kapalua Project District 1 Maui Kapalua 1,050Puunani Maui Wailuku 597Waikapu Gardens Phase II Maui Waikapu 56
Total Units: 26,003
In 2013, the average number of bathrooms in new SFHs was 2.47 in the United States and 2.52 in the western region of the
country (U.S. Census Bureau, 2013). Assuming Hawaii units have 2.52 bathrooms on average, we estimate that the total number
of projected SFH bathrooms is 65,612.
3 As mentioned previously, the water savings on a per-restaurant basis could be significant. Assuming a savings of 0.3 gpm for pre-rinse spray valves (1.3 gpm under GPMC versus 1.6 gpm under UPC) and average usage of 5 hours per day, monthly savings would be in the ballpark of 2,700 gallons.

UHERO.HAWAII.EDU
PROJECT ENVIRONMENT 7
© 2014
The average household size in Hawaii was 3.09 for owner-occupied housing units and 2.75 for renter-occupied units over the
period 2008-2012 (DBEDT, 2013). Across all housing units, the average number of persons per household was 2.95 over that
period (U.S. Census Bureau, 2014). For the purpose of calculating daily water use, we assume that the average household size in
the SFH category is 3 people.
CONDOMINIUMS
We identified 35 condominium projects planned, permitted, or under construction. Of those 35 projects, 12 include plans for
efficient water fixtures, fittings, and landscaping (DBEDT-HCDA, 2014). Table 3 lists the projects with provisions for water
efficient measures. These projects will not be included in our analysis. Table 4 includes the remaining 23 projects for which in-
formation on water efficiency was unavailable. Timeshares and resort condos are classified as condominiums because we believe
water consumption for these types of users is more likely to resemble permanent residents than visitors at hotels.
TABLE 3. PLANNED CONDO CONSTRUCTION WITH WATER EFFICIENT MEASURES
Project Name County General Location Units400 Keawe (Block B-1) Honolulu Kakaako 95400 Keawe (Block B-2) Honolulu Kakaako 88690 Pohukaina Honolulu Kakaako 804801 South Street Building A Honolulu Kakaako 635801 South Street Building B Honolulu Kakaako 410803 Waimanu Honolulu Kakaako 153Keauhou Lane (Block A-1) Honolulu Kakaako 423Keauhou Lane (Block A-2) Honolulu Kakaako 209The Collection Honolulu Kakaako 467Ward Village, Land Block 2, Project 1 (Waiea) Honolulu Kakaako 177Ward Village, Land Block 3, Project 1 (Anaha) Honolulu Kakaako 318Ward Village, Land Block 5, Project 1 Honolulu Kakaako 424
Total Units: 4,203
TABLE 4. PLANNED CONDO CONSTRUCTION WITHOUT WATER EFFICIENT MEASURES
Project NameCounty General Location Units
Hilton Waikoloa Resort: Kings' Land Hawaii Waikoloa 507ONE Ala Moana Honolulu Ala Moana 206Park Lane Ala Moana Honolulu Ala Moana 215Symphony Honolulu Kakaako 388Waihonua at Kewalo Honolulu Kakaako 341Building 77 Honolulu Kalaeloa 100Cloudbreak Hale Uhiwai Nalu Honolulu Kalaeloa 50East Kapolei II Rental Community Honolulu Kapolei 300Forest City Kapolei (Kapolei Lofts) Honolulu Kapolei 499Ohana Hale Honolulu McCully 180

UHERO.HAWAII.EDU
PROJECT ENVIRONMENT 8
© 2014
Hilton Time Share Tower Honolulu Waikiki 418Live Work Play Aiea Honolulu Waimalu 1,500Kiahuna Fairways, Pili Mai at Poipu Kauai Poipu 191Kiahuna Poipu Golf Resort Kauai Poipu 282Palms at Poipu Beach Kauai Poipu 164Poipu Sheraton Kauai Poipu 382Kolopua at Princeville Kauai Princeville 44Waipouli Niu/Coconut Beach Kauai Kapaa 343Hyatt Regency Maui Maui Kaanapali 131Villas at Royal Lahaina Maui Lahaina 126Kulamalu Affordable Housing Project Maui Pukalani 64Wailea Residence Maui Wailea 328Maui Lu Timeshare Maui Kihei 400
Total Units: 7,159
Among the 23 projects listed in Table 4, seven projects included specific information on the types of units in the building: 419
1-bathroom units, 598 2-bathroom units, 48 2.5-bathroom units, 70 3.5-bathroom units, and 8 4.5-bathroom units, leaving
6,016 unidentified units. In the western region of the United States in 2013, the distribution of bathrooms in multifamily units
was as follows: 52% 1-bathroom, 5% 1.5-bathrooms, and 43% 2-bathrooms or more (U.S. Census Bureau, 2013). Applying that
distribution to the 6,016 unidentified units in Table 3 generates the following: 3,128 1-bathroom units, 301 1.5-bathroom units,
and 2,587 2-bathroom units. We estimate that the total number of projected condo bathrooms is 10,769.
The average household size in Hawaii was 3.09 for owner-occupied housing units and 2.75 for renter-occupied units over the
period 2008-2012 (DBEDT, 2013). Across all housing units, the average number of persons per household was 2.95 over that
period (U.S. Census Bureau, 2014). For the purpose of calculating daily water use, we assume that the average household size in
the condo category is 3 people.
HOTELS
We identified 22 hotel projects planned, permitted, or under construction (Table 5). As indicated in the previous section, resort
condos and timeshares are classified as condominiums for the purpose of estimating water use.
TABLE 5. PLANNED HOTEL CONSTRUCTION
Project Name County General Location RoomsHoliday Inn Express Hawaii Kona 75Naniloa Hotel Hawaii Hilo 383Hyatt Regency Waikiki Honolulu Waikiki 1,230King's Village Condo-Hotel Honolulu Waikiki 256Laie Courtyard by Marriott Honolulu Laie 144Ohana West Waikiki Honolulu Waikiki 659Outrigger Reef on the Beach Honolulu Waikiki 200Ritz-Carlton Residences Condo-Hotel Honolulu Waikiki 309Ritz-Carlton Condo-Hotel (2nd Tower) Honolulu Waikiki 280Sheraton Princess Kaiulani Honolulu Waikiki 1,100Coco Palms Kauai Kapaa 363

UHERO.HAWAII.EDU
PROJECT ENVIRONMENT 9
© 2014
Hanalei Plantation Resort Kauai Hanalei 86Kapalawai-Robinson Resort Project Kauai Makaweli 250Kauai Lagoons Kauai Lihue 772Poipu Sheraton Kauai Poipu 102Waimea Kikiaola Land Co Kauai Waimea 250Waipouli Niu/Coconut Beach Kauai Kapaa 6Downtown Kihei Project Maui Kihei 150Grand Wailea Resort Maui Wailea 310Kula Lodge Maui Kula 15Maui Palms Maui Kahului 101Piilani Suites by Marriott Maui Wailea 200
Total rooms: 7,241
Assuming a single bathroom per hotel room, the total number of hotel bathrooms for the purpose of estimating GPMC compli-
ance costs is 7,241. The typical number of persons per hotel room in the United States in 2013 was two (AHLA, 2014), and the
median daily water use per hotel room over the period 2006-2012 was 102 gallons (EPA, 2012).
COMMERCIAL
TABLE 6. PLANNED COMMERCIAL DEVELOPMENT
Project Name County General Location Sq FtKamakana Villages at Keahoulu Hawaii Kailua-Kona 197,000Pahoa Shopping Center Hawaii Pahoa 104,000Hoala Kalaeloa (Barbers Point Redevelopment) Honolulu Kalaeloa 3,500,000International Marketplace Redevelopment Honolulu Waikiki 357,000Ka Makana Alii Shopping Center Honolulu Kapolei 2,918,520Target Kailua Honolulu Kailua 134,000Hokulei Village Kauai Lihue 620,730Kilauea Lighthouse Village Kauai Kilauea 50,000Maui Mall Expansion Maui Kahului 31,940Puunene Shopping Center Maui Puunene 275,000The Outlets of Maui Renovation Maui Lahaina 146,000
Total sq footage: 8,334,190
We identified 11 retail commercial development projects planned, permitted, or under construction (Table 6) for which informa-
tion about square footage was available. In nearly all cases, specific information about the number or size of individual retail
units was not available, however. Without more information about the types of units, estimating water consumption based on
projected fixture use is difficult. Instead, we calculate total commercial water usage assuming a water use intensity factor of 5
gallons per square foot for retail space (EPA, 2012).
BENEFITS (WATER SAVINGS)
We first calculate water savings in volume for each building type. That savings is then multiplied by the appropriate factor to
estimate individual savings and social savings in dollar terms.

UHERO.HAWAII.EDU
PROJECT ENVIRONMENT 10
© 2014
SINGLE-FAMILY HOMES
Water savings for a typical SFH is calculated as the difference between the water use baseline under the 2012 UPC (Table 7)
and water use under the 2012 GPMC (Table 8), except where noted otherwise. We focus on the benefits of reducing the allow-
able maximum flow-rate for plumbing fixtures. Total use per housing unit is based on an average household size of 3 people
(DBEDT, 2013; U.S. Census Bureau, 2014). Estimated daily use per person is based on Water Use Reduction Guidelines
produced by the U.S. Green Building Council for their LEED program (USGBC, 2012) and a water conservation residential
telephone survey of Oahu residents (OmniTrak Group Inc. 2009).
TABLE 7. WATER USE BASELINE FOR SFHS (2012 UPC)
Fixture type Max flow-rate Unit Duration
Estimated daily use per person
Number of occupants
Daily water use (gallons)
Residential toilets 1.6 gpf 1 5 3 24
Residential bathroom faucetsa 1.5 gpm 1 5 3 22.5
Residential kitchen faucets 2.2 gpm 1 4 3 26.4Residential showerheads 2.5 gpm 8 1.27b 3 83.9
Total use: 156.8
TABLE 8. WATER USE FOR SFHS UNDER 2012 GPMC
Fixture type Max flow-rate Unit Duration
Estimated daily use per person
Number of occupants
Daily water use (gallons)
Residential toilets 1.28 gpf 1 5 3 19.2
Residential bathroom faucets 1.5 gpm 1 5 3 22.5
Residential kitchen faucets 1.8 gpm 1 4 3 21.6Residential showerheads 2 gpm 8 1.27 3 67.1
Total use: 130.4
Total daily water savings for a household of 3 people is 26.4 gallons, a 17% reduction from the baseline. Recalling that the total
number of planned SFH units is 26,003, total expected daily water savings for new units is 686,038 gallons. Further assuming
that additions and alterations contribute additional savings equal to 53% of water savings for planned new units, total daily
water savings for the SFH category is 1.05 million gallons.
CONDOMINIUMS
a Based on discussions with developers, 1.5 gpm bathroom faucets are already typically being installed in new SFH developments, even though 2012 UPC only requires 2.2 gpm. b Results from the survey suggest that Oahu single family households average 3.8 showers or baths per day. Given our assumption of 3 household members, this is equivalent to 1.27 showers per person per day.

UHERO.HAWAII.EDU
PROJECT ENVIRONMENT 11
© 2014
Water savings for a typical condo unit is calculated as the difference between the water use baseline under the 2012 UPC
(Table 9) and water use under the 2012 GPMC (Table 10). We focus on the benefits of reducing the allowable maximum flow-
rate for plumbing fixtures. Total use per housing unit is based on an average household size of 3 people (DBEDT, 2013; U.S.
Census Bureau, 2014). Estimated daily use per person is based on Water Use Reduction Guidelines produced by the U.S. Green
Building Council for their LEED program (USGBC, 2012).
TABLE 9. WATER USE BASELINE FOR CONDOS (2012 UPC)
Fixture type Max flow-rate Unit Duration
Estimated daily use per person
Number of occupants
Daily water use (gallons)
Residential toilets 1.6 gpf 1 5 3 24Residential bathroom faucets 2.2 gpm 1 5 3 33Residential kitchen faucets 2.2 gpm 1 4 3 26.4Residential showerheads 2.5 gpm 8 1 3 60
Total use: 143.4
TABLE 10. WATER USE FOR CONDOS UNDER 2012 GPMC
Fixture type Max flow-rate Unit Duration
Estimated daily use per person
Number of occupants
Daily water use (gallons)
Residential toilets 1.28 gpf 1 5 3 19.2Residential bathroom faucets 1.5 gpm 1 5 3 22.5Residential kitchen faucets 1.8 gpm 1 4 3 21.6Residential showerheads 2 gpm 8 1 3 48
Total use: 111.3
Total daily water savings for a household of 3 people is 32.1 gallons, a 22% reduction from the baseline. Recalling that the total
number of planned condo units is 7,159, total expected daily water savings for new units is 229,804 gallons. Further assuming
that additions and alterations contribute additional savings equal to 53% of water savings for planned new units, total daily
water savings for the condo category is 351,600 gallons.
HOTELS
Water savings for a typical hotel room is calculated as the difference between the water use baseline under the 2012 UPC (Table
11) and water use under the 2012 GPMC (Table 12). We focus on the benefits of reducing the allowable maximum flow-rate
for plumbing fixtures. Total use per hotel room is based on an average occupancy of 2 people (AHLA, 2014). Estimated daily
use per person is based on Water Use Reduction Guidelines produced by the U.S. Green Building Council for their LEED
program (USGBC, 2012), adjusted for the fact that visitors and permanent residents use water differently. Estimated daily use of
toilets and bathrooms is adjusted downward and the duration of showers is adjusted upward until total baseline daily water use
is 102 gallons per room, which is the median water use per hotel room estimated by the EPA Energy Star Water Use Tracking

UHERO.HAWAII.EDU
PROJECT ENVIRONMENT 12
© 2014
Program (EPA, 2012).
TABLE 11. WATER USE BASELINE FOR HOTELS (2012 UPC)
Fixture type Max flow-rate Unit DurationEstimated daily use per person
Number of occupants
Daily water use (gallons)
Residential toilets 1.6 gpf 1 3 2 9.6
Residential bathroom faucets 2.2 gpm 1 4 2 17.6
Residential kitchen faucets 2.2 gpm 1 0 2 0Residential showerheads 2.5 gpm 15 1 2 75 Total use: 102.2
TABLE 12. WATER USE FOR HOTELS UNDER 2012 GPMC
Fixture type Max flow-rate DurationEstimated daily use per person
Number of occupants
Daily water use (gallons)
Residential toilets 1.28 gpf 1 3 2 7.68
Residential bathroom faucets 1.5 gpm 1 4 2 12
Residential kitchen faucets 1.8 gpm 1 0 2 0Residential showerheads 2 gpm 15 1 2 60 Total use: 79.68
Total daily water savings for a typical hotel room occupied by two visitors is 22.52 gallons, a 22% reduction from the baseline.
Recalling that the total number of planned hotel rooms is 7,241, total expected water savings for new units is 163,067 gallons
per day. Further assuming that additions and alterations contribute additional savings equal to 53% of water savings for planned
new units, total daily water savings for the hotel category is 249,493 gallons.
COMMERCIAL
Because specific information about the number or size of individual retail units was typically not available for planned commer-
cial development, it is difficult to estimate fixture use. Instead, we calculate baseline use assuming a water use intensity factor of
5 gallons/sf (EPA, 2012). For a total area of 8,334,190 square feet, this translates to 41,670,950 gallons per year. If the GPMC
is roughly 20% more efficient than the UPC along the lines of the percentages realized for residential units, total annual water
savings attributed to efficient fixtures is 8,334,190 gallons.
An analysis conducted by the National Science and Technology Council (NSTC, 2011) included three case studies which il-
lustrated that submetering electricity saved an estimated 18-30%. Though we cannot be sure that such savings would translate

UHERO.HAWAII.EDU
PROJECT ENVIRONMENT 13
© 2014
directly to water submetering, we conservatively estimate a 15% reduction in water use, calculated after the savings generated
from efficient fixtures. Total water savings per year in the commercial sector for new units is 13,334,704 gallons. Further as-
suming that additions and alterations contribute additional savings equal to 53% of water savings for planned new units, total
annual water savings for the commercial category is 20.4 million gallons.
MONETIZED TOTAL BENEFITS
Individual water bill savings are calculated by multiplying water saved by a typical residential unit with the first residential block
price ($4.03/thousand gallons) in the Honolulu Board of Water Supply (BWS) Rate Structure (http://www.hbws.org/cssweb/
display.cfm?sid=1175).4 Statewide water bill savings include commercial and hotel savings, which are monetized using the non-
residential uniform rate of $4.53 per thousand gallons.
Avoided costs to the Board of Water Supply are calculated using information about energy expenditures (the amount billed
by HECO) and total water consumption over the period 2010-2013. Expenditures per million gallons delivered daily (MGD)
ranged from $150,000 to $210,000 and averaged $188,000. Total expenses include the energy required to pump, treat, distrib-
ute, and maintain groundwater.5 Dividing by 365 days gives the cost saved per unit of water: $515/million gallons. To get sav-
ings for water managers, we multiply the $515/MG by the daily, monthly, and annual statewide water savings.
TABLE 13. BENEFITS ACROSS CONSUMPTION CATEGORIES
Type Daily Monthly AnnualQuantity (gallons)
New Condos 229,804 6,894,117 82,729,404Condo Additions/Alterations 121,796 3,653,882 43,846,584New Single-Family Homes 686,038 20,581,153 246,973,842Single-Family Home Additions/Alterations 363,600 10,908,011 130,896,136New Hotels 163,067 4,892,020 58,704,235Hotel Additions/Alterations 86,426 2,592,770 31,113,245New Commercial 37,041 1,111,225 13,334,704Commercial Additions/Alterations 19,632 588,949 7,067,393Statewide Water Savings 1,707,404 51,222,129 614,655,543
Type Daily Monthly AnnualDollars
4 The average Oahu household in a single-family home uses approximately 11,000 gallons per month, which falls within the first residential price block. Although statewide calculations are based on data obtained from the Honolulu Board of Water Supply, water management costs and pricing structures vary by island.5 Labor costs will not vary for changes in water efficiency at the scale we are considering.

UHERO.HAWAII.EDU
PROJECT ENVIRONMENT 14
© 2014
Condo Water Bill Savings per Household $3.88 $46.57SFH Water Bill Savings per Household $3.19 $38.28Statewide Water Bill Savings $7,034 $211,018 $2,532,212Savings to Water Managers $880 $26,390 $316,674Total Savings $7,914 $237,407 $2,848,886
COSTS
The cost of upgrading fixtures is minimal. At Home Depot (www.homedepot.com), we found 70 toilets and 24 showerheads
that come in standard and low-flow versions of the model with no difference in price. Faucets tended not to have standard
and low-flow versions of each model listed on the website. However, the average price of the first 50 results of 2.2 gpm faucets
(sorted by price from low to high) was $142, while the average price for 1.5 gpm faucets was $61. Based on discussions with
plumbers and subcontractors, we expect that there is likely to be little or no price difference between faucet accessories (or any
other plumbing fixtures for that matter) due to different flow rates. Rather, price differences arise from external factors, such as
size, style and finish.
A pressure reducing valve would be required for each residential unit to ensure that water pressure does not exceed 60 psi for
all fixtures except showerheads, which have a maximum allowable pressure of 80 psi. Installation of a new PRV would cost ap-
proximately $100 for the regulator itself, plus $150-200 for the labor. However, new homes are already equipped with PRVs, so
meeting the 60-psi standard would only require that plumbers set the pressure accordingly at the time of installation, i.e. there
would be no additional cost.
A search of online retailers revealed that 1/2-inch to 3/4-inch water submeters range in cost from $100-200 depending on the
brand, material and features.6 The National Science and Technology Council Subcommittee on Buildings Technology Research
and Development (NSTC, 2011) similarly note that nutating disk water meters range in cost from $50-400 (up to 3” connec-
tions). To calculate the cost of submetering individual commercial tenants, we assume that each submeter costs $200 and that
labor for installation would be roughly 10%, for a total of $220 per submeter.
We use information about Ala Moana Shopping Center to calculate the total number of submeters required for the 8.3 million
square feet of projected commercial space statewide. The 2.1 million square feet of gross leasable area in Ala Moana Shopping
Center together with the 310 tenants imply an average tenant space of 6,774 square feet. Assuming that this is representative of
retail space statewide, we divide 8.3 million by 6,774 square feet to arrive at an estimated 1,230 projected tenant spaces.
Under the GPMC, contractors, installers, or service technicians could be required to demonstrate competency, e.g. through
training and certification. Plumbing professionals would incur the cost if the state were to require certification (beyond a stan-
dard plumbing license). In 2013, there were 2,050 plumbers, pipefitters, and steamfitters employed in Hawaii (BLS, 2013). As-
suming that the IAPMO/GreenPlumbers Training and Certification Program7 is representative of the type of certification that
would be required, the per-applicant cost of $130 implies a total cost of $266,500.
6 EKM Metering (http://www.ekmmetering.com/), Submeter Solutions (http://esubmeter.com/), and Assured Automation (http://assured-automation.com/).7 http://www.nationalitc.com/NITCService.cfm?GO=CERT&CERTID=50

UHERO.HAWAII.EDU
PROJECT ENVIRONMENT 15
© 2014
TABLE 14. COSTS OF GPMC COMPLIANCE
Item Number of units Cost per unit Total costFixtures N/A N/A N/ACommercial submeters 1,230 $220 $270,663Training/Licensing 2,050 $130 $266,500
BENEFITS VERSUS COSTS
Total benefits are calculated as the sum of water bill savings and savings to water managers. Total costs include the costs to
install commercial submeters in individual tenant spaces and to certify plumbing professionals in Hawaii.
Technically, benefits would only start accruing upon completion of each project (i.e. when water consumption begins), and costs
would be accrued at the time of purchase and installation of submeters and at the time of enrollment in certification programs.
Given that the calculations are based on planned rather than completed construction, many of the projects do not have a set
or even projected completion date. In Figures 1 and 2, we assume that benefits are distributed evenly over a 10 year period, i.e.
every year a fraction of total projects are completed that account for one-tenth of the total projected water savings. Thus in year
1, one-tenth of the $2.85 million in annual savings from Table 13 ($285,000) is obtained, and that number continues to increase
by $285,000 every year up until year 10. Submetering costs are also distributed evenly over the 10 year period. Unlike for water
savings, however, the cost of installing a submeter is only paid once, i.e. one-tenth of $270,663 from Table 14 is included in the
total cost every year and the costs from previous years are not incurred again. Training/licensing costs are only included for the
initial year.
FIGURE 1. CONTEMPORANEOUS BENEFITS AND COSTS OF GPMC COMPLIANCE

UHERO.HAWAII.EDU
PROJECT ENVIRONMENT 16
© 2014
If the
GPMC is
implement-
ed, the costs will exceed the benefits in the initial year by roughly $9,000. Thereafter, annual benefits will always exceed costs,
with the net benefit reaching a peak of $2.82 million in year 10. Figure 2 shows that the payback period is two years; the value
of cumulative water saved in year 2 exceeds the total costs accrued over the entire time horizon. For a discount rate of zero, the
net present value (NPV) of the project is $15.13 million. For a discount rate of 5%, the NPV falls to $11.29 million.
ACKNOWLEDGEMENTS
We are grateful to Mark Abril (HPM Building Supply), Leo Asuncion (Office of Planning), W. Bruce Barrett (Castle & Cooke),
Amy Blagriff (Honolulu AIA), Phil Camp (Hawaii Architecture LLP), Andrew Chong (Mitsunaga & Associates, Inc.), Marc
Chun (Honolulu Board of Water Supply), Michael Fujimoto (HPM Building Supply), Melvin Harano (Thermal Engineering),
Timothy Hiu (Honolulu Department of Planning and Permitting), Kevin Machida (Thermal Engineering), Debra Mendes
(Office of Planning), Richard Myers (Honolulu AIA), Daniel Nagamitsu, Clayton Oku (Honolulu Department of Planning and
Permitting), Keith Sawamura (Design Partners), and Barry Usagawa (Honolulu Board of Water Supply) for providing insight
and expertise that greatly assisted this research. However, any errors in the report are our own.
FIGURE 2. CUMULATIVE BENEFITS AND COSTS OF GPMC COMPLIANCE

UHERO.HAWAII.EDU
PROJECT ENVIRONMENT 17
© 2014
REFERENCES
American Hotel & Lodging Associations (AHLA). 2014. Lodging Industry Profile. Accessible online: http://www.ahla.com/
content.aspx?id=36332
Bureau of Labor Statistics (BLS). 2013. State Occupational Employment and Wage Estimates – Hawaii. Accessible online:
http://www.bls.gov/oes/current/oes_hi.htm#49-0000
Department of Business, Economic Development & Tourism (DBEDT). 2013. State of Hawaii Data Book – Section 21: Con-
struction and Housing. Accessible online: http://dbedt.hawaii.gov/economic/databook/db2013/
Department of Business, Economic Development & Tourism – Hawaii Community Development Authority (DBEDT-HCDA).
2014. Accessible online: http://dbedt.hawaii.gov/hcda/projects/
International Association of Plumbing and Mechanical Officials (IAPMO). 2012. Green Plumbing & Mechanical Code Supple-
ment, 2nd edition. IAPMO: Ontario, CA.
National Science and Technology Council (NTSC). 2011. Energy and Water Usage: Analysis and Recommendations of the
Subcommittee on Buildings Technology Research and Development, October 2011. Accessible online: http://www.
whitehouse.gov/sites/default/files/microsites/ostp/submetering_of_building_energy_and_water_usage.pdf
OmniTrak Group, Inc. 2009. Water Conservation Residential Survey. Prepared for Katz & Associates.
U.S. Census Bureau. 2013. Construction Industry – Characteristics of New Single-Family Houses Completed. Accessible online:
https://www.census.gov/construction/chars/completed.html
U.S. Census Bureau. 2014. State & County QuickFacts: Hawaii. Accessible online: http://quickfacts.census.gov/qfd/
states/15000.html
U.S. Environmental Protection Agency (EPA). 2012. Energy Star PortfolioManager DataTrends – Water Use Tracking. Acces-
sible online: http://www.energystar.gov/ia/business/downloads/datatrends/DataTrends_Water_20121002.pdf ?2003-
40fb
U.S. Green Building Council (USGBC). 2012. Water Use Reduction Additional Guidance. Accessible online: http://www.
usgbc.org/Docs/Archive/General/Docs6493.pdf