BENEFIT COST ANALYSIS - Resilient Bridgeport · 5.2 Discount Rates ... 7 Benefit Cost Analysis...
57
BENEFIT COST ANALYSIS METHODOLOGY REPORT April 21, 2017
Transcript of BENEFIT COST ANALYSIS - Resilient Bridgeport · 5.2 Discount Rates ... 7 Benefit Cost Analysis...

BENEFIT COST ANALYSIS
METHODOLOGY REPORT
April 21, 2017

Resilient Bridgeport, Benefit Cost Analysis Methodology Report
arcadis.com Resilient Bridgeport
BENEFIT COST
ANALYSIS
Methodology Report
Prepared for:
Connecticut Department of Housing
Prepared by:
Arcadis U.S., Inc.
Our Ref.:
LA003323.0000
Date:
April 21, 2017
This document is intended only for the use of
the individual or entity for which it was
prepared and may contain information that is
privileged, confidential and exempt from
disclosure under applicable law. Any
dissemination, distribution or copying of this
document is strictly prohibited.
Macy Fricke, CFM
Management Consultant
Edward Fernandez, CFM
Senior Management Consultant
Hugh Roberts, PE
Associate Vice President

Resilient Bridgeport, Benefit Cost Analysis Methodology Report
arcadis.com Resilient Bridgeport
VERSION CONTROL
Issue Revision No Date Issued Page No Description Reviewed by
001 Rev. 1 Draft E. Fernandez
002 Rev. 2 Draft H. Roberts
003 Rev. 3 Final Draft E. Fernandez

Resilient Bridgeport, Benefit Cost Analysis Methodology Report
arcadis.com Resilient Bridgeport i
CONTENTS
Appendices ................................................................................................................................................... iii
Acronyms and Abbreviations ........................................................................................................................ iv
1 Introduction .......................................................................................................................................... 1-1
1.1 Benefit Cost Analysis Overview ................................................................................................... 1-2
2 Rebuild By Design Pilot Project ........................................................................................................... 2-1
2.1 Project Timeline ........................................................................................................................... 2-2
3 Resiliency Benefits ............................................................................................................................... 3-1
3.1 Resilient Redevelopment ............................................................................................................. 3-1
3.2 Dry Egress .................................................................................................................................3-15
4 Value Added Benefits .......................................................................................................................... 4-1
4.1 Social Benefits ............................................................................................................................. 4-3
4.2 Environmental Benefits ................................................................................................................ 4-7
4.3 Economic Revitalization .............................................................................................................4-10
5 Sensitivity Analysis ............................................................................................................................5-11
5.1 Analysis Uncertainties, Assumptions, and Limitations ..............................................................5-11
5.2 Discount Rates ...........................................................................................................................5-11
6 Double Counting .................................................................................................................................. 6-1
7 Benefit Cost Analysis Results .............................................................................................................. 7-1
8 Economic Impact Analysis ................................................................................................................... 8-1
8.1 Project Description ....................................................................................................................... 8-1
8.2 IMPLAN Software and Results .................................................................................................... 8-1
8.3 Approach ...................................................................................................................................... 8-2
8.4 Assumptions ................................................................................................................................ 8-4
8.5 Results ......................................................................................................................................... 8-5

Resilient Bridgeport, Benefit Cost Analysis Methodology Report
arcadis.com Resilient Bridgeport ii
TABLES AND FIGURES
Table 1. Summary of RBD Project Costs ................................................................................................... 2-1
Table 2. RBD Project Milestone Timeline ................................................................................................... 2-2
Table 3. Resiliency Benefits Matrix ............................................................................................................ 3-1
Figure 1. Expected Structural and Contents Damage from Inundation, NACCS Urban High Rise Prototype.
............................................................................................................................................................. 3-2
Table 4. Building Attributes......................................................................................................................... 3-4
Table 5. USACE NACCS, Number of Stories per Depth Damage Function .............................................. 3-5
Table 6. Replacement Values .................................................................................................................... 3-6
Table 7. Direct Physical Damage Results .................................................................................................. 3-8
Table 8. Relocation Costs Avoided ..........................................................................................................3-10
Table 9. Mental Health Prevalence Rates After a Disaster ......................................................................3-12
Table 10. Cost of Treatment After a Disaster (30 Month Duration), Per Person Expected to Seek
Treatment ...........................................................................................................................................3-13
Table 11. Loss of Road Service Results by Flood Scenario ....................................................................3-17
Table 12. FAA Category Levels and Values ............................................................................................3-18
Table 13. Injury Analysis Results .............................................................................................................3-19
Table 14. Expected Material Loss (D) Values by Percent Annual Chance Flood Event .........................3-21
Table 15. P Values ...................................................................................................................................3-21
Table 16. P Factor Descriptions ...............................................................................................................3-22
Table 17. W Factor Descriptions ..............................................................................................................3-23
Table 18. W Values ..................................................................................................................................3-23
Table 19. Estimated Fatalities Avoided by Flood Scenario ......................................................................3-24
Table 20. Value Added Benefit Matrix ........................................................................................................ 4-2
Table 21. Stormwater Park Low Annual Recreation Benefit ...................................................................... 4-4
Table 22. Stormwater Park High Annual Recreation Benefit ..................................................................... 4-4
Table 23. Stormwater Park Medium Annual Recreation Benefit ................................................................ 4-4
Table 24. Summary of Aesthetic Benefits by Project Element ................................................................... 4-5
Table 25. Annual Aesthetic Benefits of New Trees .................................................................................... 4-6
Table 26. Approach Summary by Vegetative Type .................................................................................... 4-8
Table 27. FEMA’s Annual Environmental Ecosystem Service Values ....................................................... 4-8

Resilient Bridgeport, Benefit Cost Analysis Methodology Report
arcadis.com Resilient Bridgeport iii
Table 28. RBD Project Elements Contributing Ecosystem Services ......................................................... 4-8
Table 29. Annual Ecosystem Service Benefits provided by the RBD Project ............................................ 4-9
Table 30. Annual Water Quality Benefits .................................................................................................4-10
Table 31. Economic Revitalization Benefits .............................................................................................4-10
Table 32. Summary of Uncertain Variables and Alternative Approaches ................................................5-11
Table 33. Summary of Benefit Range and Present Value ......................................................................... 5-2
Table 34. Summary of Double-Counting Approach ................................................................................... 6-1
Table 35. Annual and Present Value Benefits for the Medium Benefit Scenario ....................................... 7-1
Table 36. Benefit Cost Ratio by Benefit Scenario ...................................................................................... 7-2
Figure 2. Distribution of RBD Project Benefits, Medium Benefit Scenario ................................................. 7-2
Table 37. Annual and Present Value Benefits for the Low Benefit Scenario ............................................. 7-3
Table 38. Annual and Present Value Benefits for the High Benefit Scenario ............................................ 7-4
8-5
Figure 3. Economic Impact Results by Activity, Presented as Percentages .............................................. 8-5
APPENDICES
Appendix A: US Housing and Urban Development
(HUD) Crosswalk
Appendix B: Benefit Cost Analysis Crosswalk
Appendix C: Depth Damage Functions
Appendix D: Rebuild by Design Pilot Project Cost
Estimates
Appendix E: Occupancy Mapping
Appendix F: Additional Benefit Cost Analysis
Resources

Resilient Bridgeport, Benefit Cost Analysis Methodology Report
arcadis.com Resilient Bridgeport iv
ACRONYMS AND
ABBREVIATIONS
ARC: American Red Cross
BCA: Benefit Cost Analysis
BCAR: BCA Re-Engineering Report
BCR: Benefit Cost Ratio
BEA: Bureau of Economic Analysis
BLS: Bureau of Labor Statistics
BRV: Building Replacement Value
CDC: Centers for Disease Control
CRV: Contents Replacement Value
CSRV: Contents-to-Structure Ratio Value
CSO: Combined sewer overflow
CSS: Combined sewer system
DDF: Depth-Damage Function
DEEP: Connecticut Department of Energy and
Environment
DEM: Digital Elevation Model
DOH: Connecticut Department of Housing
EPA: U.S. Environmental Protection Agency
EIS: Environmental Impact Statement
FAA: Federal Aviation Administration
FEMA: Federal Emergency Management Agency
FIS: Flood Insurance Study
FIRM: Flood Insurance Rate Map
FFE: First Floor Elevation
GCP: Gross city product
GDP: Gross domestic product
GIS: Geographic Information System
HUD: United States Department of Housing and
Urban Development
LiDAR: Light Detection and Ranging
MEP: Mechanical/Engineering/Plumbing
NACCS: North Atlantic Coast Comprehensive
Study
NAICS: North American Industry Classification
System
NAVD88: North American Vertical Datum of 1988
NDR: National Disaster Resilience
NOAA: National Oceanic and Atmospheric
Administration
NPV: Net present value
NRCS: Natural Resources Conservation Service
OMB: United States Office of Management and
Budget
PTSD: Post-traumatic stress disorder
RBD: Rebuild by Design
SAM: Social Accounting Matrix
SF: Square Feet
SLR: Sea Level Rise
TM: Technical Manual
UDV: Unit Day Value
USACE: U.S. Army Corps of Engineers
WTP: Willingness to Pay

Resilient Bridgeport, Benefit Cost Analysis Methodology Report
arcadis.com Resilient Bridgeport 1-1
1 INTRODUCTION During Tropical Storm Irene (Federal Emergency Management Agency [FEMA] Major Disaster Declaration
[DR] -4023) and Hurricane Sandy (DR-4087), floodwaters from Long Island Sound inundated roadways,
critical infrastructure, businesses, and homes in low-lying areas, directly affecting the South End’s residents
and businesses. Following the devastation from Hurricane Sandy, the U.S. Department of Housing and
Urban Development (HUD) launched Rebuild by Design (RBD) to inspire innovative community and policy-
based resilience solutions to protect cities most vulnerable to intense weather events.
HUD awarded the Connecticut Department of Housing (DOH) $10 million to reduce flood risk for the most
vulnerable public housing stock in Bridgeport through continued planning and evaluation of long-term
resiliency strategies, as well as designing a RBD pilot project aimed at alleviating acute and chronic flooding
in the South End neighborhood. To this end, the Resilient Bridgeport Team, led by Waggonner & Ball with
Arcadis, Yale Urban Design Workshop and Reed Hilderbrand Landscape Architects, has developed an
innovative and multifaceted RBD project in the South End to provide benefits to the neighborhood by means
of dry egress and stormwater management.
The Resilient Bridgeport Team completed a benefit cost analysis (BCA) to evaluate the RBD project at its
current level of design as part of the design process. The BCA assesses resiliency, social, environmental,
and economic benefits that will result from the implementation of the RBD project. In accordance with HUD
Notice: CPD-16-06, the BCA uses federally accepted standard figures and methods to assess project
benefits.
This appendix serves to provide a detailed description of the BCA methods summarized in the BCA Report,
and includes the following principle sections:
• Section 1 Introduction includes a BCA overview.
• Section 2 RBD Project Description summarizes the RBD project and project costs.
• Section 3 Resiliency Benefits includes detailed methodologies used to determine resilient
redevelopment and dry egress benefits.
• Section 4 Value Added describes in detail the methods used to evaluate social, environmental,
and economic benefits.
• Section 5 Sensitivity Analysis includes a describes how analysts approached BCA assumptions
and the discount rate.
• Section 6 Double Counting describes how analysts approached potentially overlapping benefits
in the BCA.
• Section 7 Benefit Cost Analysis Results presents BCA findings.
• Section 8 Economic Impact Analysis is a detailed description of the methodology used to
evaluate economic impacts of project implementation.
To facilitate HUD’s review of the BCA Summary Report and BCA Methodology Report, analysts completed
two crosswalks:
1. Appendix A: HUD Crosswalk summarizes the pilot project’s benefits, costs, and BCA methods.
2. Appendix B: BCA Crosswalk relates CPD Notice 16-06 requirements to report sections.

Resilient Bridgeport, Benefit Cost Analysis Methodology Report
arcadis.com Resilient Bridgeport 1-2
1.1 Benefit Cost Analysis Overview
A benefit cost analysis (BCA) helps inform sound decision making related to public infrastructure
investment. BCA benefits represent the present value of the total expected annual losses avoided and
value added over the RBD project’s useful life. The BCA accounts for:
• Probabilities of flood events and losses
• Project useful life
• Time value of money (discount rate)
Resiliency benefits are future losses prevented or reduced by the RBD project. Analysts estimate losses
avoided for certain modeled flood scenarios, then apply the annual probability of occurrence to losses at
each flood scenario to determine expected annual losses avoided. Probability of occurrence refers to the
percent chance of an expected flood event being met or exceeded in any given year.
𝐴𝑛𝑛𝑢𝑎𝑙 𝑅𝑒𝑠𝑖𝑙𝑖𝑒𝑛𝑐𝑦 𝐵𝑒𝑛𝑒𝑓𝑖𝑡𝑠 = ∑ 𝐸𝑥𝑝𝑒𝑐𝑡𝑒𝑑 𝐿𝑜𝑠𝑠𝑒𝑠 𝐴𝑣𝑜𝑖𝑑𝑒𝑑 × 𝐴𝑛𝑛𝑢𝑎𝑙 𝑃𝑟𝑜𝑏𝑎𝑏𝑖𝑙𝑖𝑡𝑦 𝑜𝑓 𝑂𝑐𝑐𝑢𝑟𝑒𝑛𝑐𝑒
𝑠=4
𝑠=1
Where:
S = annual flood event scenario
Analysts project and discount annual benefits and project life-cycle costs1 over the RBD project’s useful life
(50 years) using a 7 percent discount rate to find the present value of project benefits. The project useful
life is the estimated amount of time the project will be effective. The discount rate determines the time value
of money; in other words, the discount rate accounts for the fact that monetary value tomorrow will not be
as much as it is in the present. The Office of Management and Budget (OMB) mandates the discount rate
to be 7 percent, but HUD also considers a 3 percent discount rate for review per HUD Notice: CPD-16-06.
The BCR is the project’s total present value of benefits divided by the project’s total present value of life-
cycle costs. NPV is the difference between the present value of a project’s total benefits and the present
value of a project’s total life-cycle costs. Both the NPV and BCR inform the RBD project’s cost effectiveness
and ensure the project is fiscally beneficial.
𝑁𝑒𝑡 𝑃𝑟𝑒𝑠𝑒𝑛𝑡 𝑉𝑎𝑙𝑢𝑒 = 𝑃𝑟𝑒𝑠𝑒𝑛𝑡 𝑉𝑎𝑙𝑢𝑒 𝑜𝑓 𝑃𝑟𝑜𝑗𝑒𝑐𝑡 𝐵𝑒𝑛𝑒𝑓𝑖𝑡𝑠 − 𝑃𝑟𝑒𝑠𝑒𝑛𝑡 𝑉𝑎𝑙𝑢𝑒 𝑜𝑓 𝑃𝑟𝑜𝑗𝑒𝑐𝑡 𝐶𝑜𝑠𝑡𝑠
𝐵𝑒𝑛𝑒𝑓𝑖𝑡 𝐶𝑜𝑠𝑡 𝑅𝑎𝑡𝑖𝑜 =𝑃𝑟𝑒𝑠𝑒𝑛𝑡 𝑉𝑎𝑙𝑢𝑒 𝑜𝑓 𝑃𝑟𝑜𝑗𝑒𝑐𝑡 𝐵𝑒𝑛𝑒𝑓𝑖𝑡𝑠
𝑃𝑟𝑒𝑠𝑒𝑛𝑡 𝑉𝑎𝑙𝑢𝑒 𝑜𝑓 𝑃𝑟𝑜𝑗𝑒𝑐𝑡 𝐶𝑜𝑠𝑡𝑠
This BCA presents benefits and costs in 2016 dollars. The sections below describe the RBD project and
the detailed methods analysts used to determine annual resiliency benefits and value added benefits that
Bridgeport will realize once it implements the pilot project.
1 Project life cycle costs include direct capital costs and operations and maintenance cost over the life of the project.
Resilient Bridgeport, Benefit Cost Analysis Methodology Report
arcadis.com Resilient Bridgeport 2-1
2 REBUILD BY DESIGN PILOT PROJECT
Through stakeholder meetings, community engagement, mapping, and modeling, the RBD project team
has come to understand the different impacts that chronic and acute flooding have on the community, and
the risks posed by climate change and sea level rise (SLR). Though the primary intent of the RBD project
is to reduce these impacts on the project area, the project team has also designed the project to serve as
a proof of concept for broader resilience principles within Bridgeport and the region. The project and the
collaboration that it requires will result in the demonstration of best practices for agencies and private
entities. It is intended to provide a precedent for future development, as well as encourage the adoption
and implementation of updated local policies, zoning regulations, and building code standards by the City
of Bridgeport.
Further, the State of Connecticut has committed to developing and implementing a set of resilience
performance standards for the RBD project. The State will coordinate the standards developed or the
project with those that are being developed for the National Disaster Resilience (NDR)-funded infrastructure
of similar nature being implemented in the South End of Bridgeport. Overtime, these performance standards
will be refined based on the outcomes of the RBD project and South End NDR project so that they can
continually be applied to any future development projects throughout the State.
The RBD project will extend Johnson Street to provide dry egress for future Mariana Village residents out
of the FEMA 500-year flood zone, as well as future SLR conditions of 3 feet. The Johnson Street Extension
will incorporate green infrastructure, such as bioswales, to divert surface runoff away from the combined
sewer system and into a multifunctional stormwater park. Stormwater park components such as terraced
basins and underground storage features will retain, delay, and improve the quality of stormwater runoff.
Community gathering spaces, play equipment and courts, and walkways in the stormwater park will provide
space for community programs, environmental education, and passive and active recreation. The park
component will also include new flora and fauna.
The stormwater park will collect surface water, which will be gravity drained to a new pump station located
at the southeast corner of South Avenue and Iranistan Avenue. A new underground force main will pump
the flow to an existing outfall at Cedar Creek, the Little Regulator Outfall. By removing stormwater from the
combined sewer system, a reduced load will be routed to the wastewater treatment plant on the west side
of Bridgeport. Similarly, bringing additional stormwater to the head end of Cedar Creek will improve flushing
and overall ecological function of the creek. RBD project costs include direct capital costs, as well as
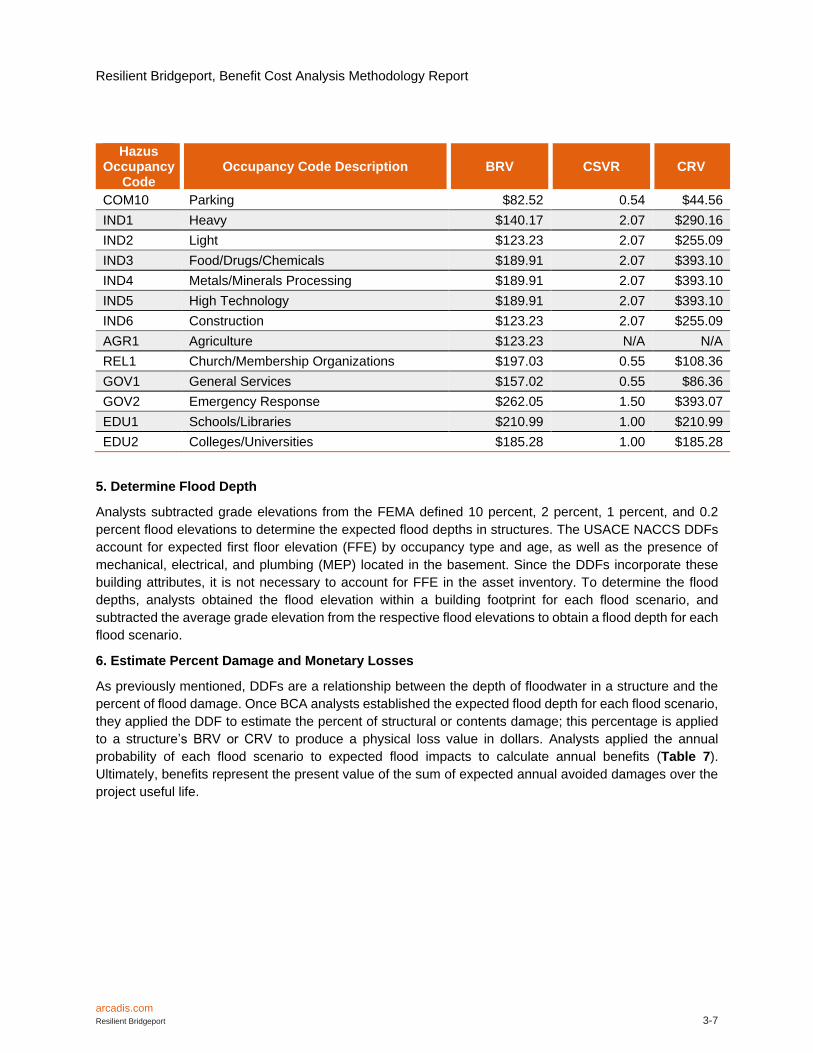
operation and maintenance (O&M) costs over the project useful life. Table 1 summarizes the total value of
each cost category. Refer to Appendix D: Rebuild by Design Pilot Project Cost Estimates for a detailed
description of project costs.
Table 1. Summary of RBD Project Costs
Cost Category Costs (7 Percent
Discount Rate)
Costs (3 Percent
Discount Rate)
Capital Costs $ 8,200,000 $ 8,200,000
Annual O&M Costs $ 75,000 $ 75,000
Present Value O&M Costs $ 1,035,060 $ 1,912,620
Total Project Costs $ 9,235,060 $ 10,112,620

Resilient Bridgeport, Benefit Cost Analysis Methodology Report
arcadis.com Resilient Bridgeport 2-2
2.1 Project Timeline
It is anticipated that the RBD project will be completed by the end of 2021. The project has not yet been
permitted, but preliminary permitting requirements have been identified and additional permit requirements
may be identified during the development of an Environmental Impact Statement (EIS). An aggregated EIS
to include both the RBD project and the Bridgeport resilience projects is being funded through the State of
Connecticut's National Disaster Resilience Grant award. The State is currently concluding a public
procurement process that will result in a consultant team being engaged under contract to complete the
Environmental Impact Statement and other tasks designed to move forward the projects funded by both
RBD and NDR.
Concurrent to this procurement process, the State's existing consultant team is also advancing the project
to a 30% design stage. It is expected that environmental review, preliminary design, and permitting will
continue into the last quarter of 2018 and construction will commence in early 2019 and continue into the
middle of 2021. A Notice of Intent to Prepare an EIS as required under 24 CFR Part 58.55 is anticipated to
be published in the Federal Register in September 2017 thereby launching the public scoping process.
Table 2 below delineates the major milestones for project completion including remaining design and
engineering work, permitting, bidding, and construction.
Table 2. RBD Project Milestone Timeline
Activity Milestone Start Date End Date
CDBG-DR Action Plan Substantial Amendment February 2017 June 2017
30 Percent Design Completion February 2017 June 2017
Resilience Strategies Finalization December 2016 June 2017
Environmental Impact Statement June 2017 July 2018
Final Design Documents July 2017 November 2018
Project Permitting October 2017 November 2018
RBD Project Construction November 2018 September 2021

Resilient Bridgeport, Benefit Cost Analysis Methodology Report
arcadis.com Resilient Bridgeport 3-1
3 RESILIENCY BENEFITS Resiliency benefits are the result of the RBD project’s expected effectiveness at protecting against future
flooding impacts. Resiliency benefits are related to resilient redevelopment or dry egress. These benefits
are the largest category of benefits quantified for the RBD project. Resilient redevelopment benefits include
direct physical damages, displacement costs, mental stress and anxiety, and lost productivity. Dry egress
benefits include loss of road service, injuries and fatalities (Table 3). The BCA estimates these losses as
probabilistic outcomes of flood risk from acute and chronic flood events. This BCA evaluates losses at the
10-precent, 2-percent, 1-percent, and 0.2-percent annual chance flood event, sourced from the Fairfield
County Flood Insurance Study (FIS). Analysts calculate resiliency benefits for current or future Marina
Village buildings.
Table 3. Resiliency Benefits Matrix
Benefit Category
Measurable Benefit/Metric
Stormwater Park
Johnson Street Extension Marina Village
Redevelopment Green Infrastructure
Raised Road
Re
silie
nt
Re
dev
elo
pm
en
t Physical Damages X
Displacement Costs X
Mental Stress and Anxiety
X
Lost Productivity X
Dry
Eg
res
s
Fatalities X
Injuries X
Loss of Roadway Service
X
The stormwater park and John Street Extension's green infrastructure contribute to reduced flood risk during chronic flood events, resulting in resiliency benefits. Acute flood events are more severe and result in greater flood impacts; therefore, resiliency benefits for acute flood events inherently capture benefits of lesser magnitude events. As such, analysts have not conducted a separate analysis.
3.1 Resilient Redevelopment Marina Village, the site of a former public housing development and the future home of a mixed income
residential development, is the focal point of the RBD project. The Resilient Bridgeport Team designed
project components to benefit the future mixed income redevelopment by reducing stormwater flooding
impacts and providing dry egress out of the FEMA 500-year flood zone plus SLR. Because Connecticut
building code requires dry egress from the 500-year flood zone for critical developments (e.g., public
housing developments), the Johnson Street Extension of the RBD project serves as a catalyst for the
resilient redevelopment of the site.
The BCA captures the benefits of the resilient redevelopment by evaluating the flood impacts that would
otherwise occur within Marina Village, as well as the economic benefits realized after the redevelopment of
the site. The following section describe the methods used to evaluate losses avoided due to resilient

Resilient Bridgeport, Benefit Cost Analysis Methodology Report
arcadis.com Resilient Bridgeport 3-2
redevelopment. Section 5.2.3 Economic Revitalization describes the economic revitalization
methodology.
3.1.1 Direct Physical Damages – Buildings and Contents
Resilient redevelopment will reduce the risk of direct physical damage to the future development on the
Marina Village site by reconstructing buildings to the 500-year flood elevation. Direct physical damages
include the degradation and destruction of property and are quantified through monetary losses. The BCA
categorizes property loss as both structural damage (i.e., damage that applies to real property) and content
damage (i.e., damage to personal property or inventory).
Analysts evaluate property losses using Depth Damage Functions (DDFs) developed by the United States
Army Corps of Engineers (USACE); DDFs relate the flood depth at a structure to an expected percent
damage for structures and contents. This percent damage is applied to a building or contents replacement
value to estimate monetary loss. Analysts calculate property damage results using building data as of 2015
and RS Means 2016 replacement cost values.
3.1.1.1 Depth Damage Functions
Analysts calculated expected property losses associated with the Fairfield County FIS flood scenarios using
standardized depth-damage functions (DDFs) specific to the characteristics and occupancy of a structure.
A DDF correlates the depth, duration, and type of flooding to a percentage of expected damage to a
structure and its contents, including inventory. The USACE produces DDFs that analysts can use to model
direct physical damages. Following Hurricane Sandy, the USACE developed DDFs specific to the Northeast
for coastal flooding in a report titled the North Atlantic Coast Comprehensive Study (NACCS). As this
information contains the most current and best available data, analysts used these functions to evaluate
direct physical damages. Figure 1 provides a sample depth damage relationship from the USACE NACCS.
Figure 1. Expected Structural and Contents Damage from Inundation, NACCS Urban High Rise
Prototype. Damage at negative flood depths accounts for impacts to mechanical, electrical, and
plumbing systems that may be located at or below grade.

Resilient Bridgeport, Benefit Cost Analysis Methodology Report
arcadis.com Resilient Bridgeport 3-3
3.1.1.2 Data Sources
BCA analysts utilized the following data sources to calculate expected structure, contents, and inventory
losses avoided:
• City of Bridgeport Tax Assessor Data (2015): Attributes from this dataset used in the direct
physical damage analysis include: square footage, number of stories, building elevation, and
building use. This dataset also provided building footprints.
• RS Means Building Construction Cost Data (2016): This publication provides location-specific
building replacement square foot costs for 160 building occupancy types. Using RS Means,
analysts calculated building replacement square foot costs for the various structure types in
Bridgeport.
• USACE North Atlantic Coast Comprehensive Study (NACCS) Physical Depth Damage
Function Summary Report (2015): Following Hurricane Sandy, the USACE collected empirical
data to estimate the damages that would occur from future events. This report produced damage
functions for residential, non-residential, and public property. Analysts used DDFs from this study
to estimate direct physical damages.
• USACE West Shore Lake Pontchartrain Hurricane and Storm Damage Risk Reduction Study
(2014): This study conducted by the USACE produced contents-to-structure ratio values (CSRVs)
for residential and non-residential structures. CSRVs are a percentage of the total building
replacement values, and analysts used CSVR’s determine total contents replacement values for
structures in the project area. While produced for a separate region, analysts determined this study
to be the best and most recent data available for use with the DDFs.
• Connecticut Department of Energy and Environmental Protection Digital Elevation Model
(2011): A Department of Energy and Environmental Protection (DEEP) digital elevation model
(DEM) is a model of the ground surface, and provides the ground elevation for structures. The DEM
is a raster layer of high-resolution ground elevation data based on information from bare-earth
LiDAR elevation data collected and compiled during December 2006 and Spring/Summer 2004.
• Fairfield County Flood Insurance Study (2013): provides flood elevations for the 10 percent, 2
percent, 1 percent, and 0.2 percent flood events. Analysts use flood elevations to approximate flood
depths inside structures.
3.1.1.3 Approach
Analysts completed the following six steps to conduct the direct physical damages analysis.
1. Develop Asset Inventory
Analysts identified benefitting structures (e.g., the redevelopment of Marina Village) and gathered building
attributes necessary for analysis, such as number of stories, area, and building use, from Bridgeport’s tax
assessor data (Table 4). Analysts used the attributes of the Marina Village building stock prior to demolition
as it is the best available data at the time of analysis; analysts assumed the redevelopment of Marina Village
will be a similar style and density multi-family housing complex. Analysts merged building footprints and
parcel level data using the unique identification number.
Resilient Bridgeport, Benefit Cost Analysis Methodology Report
arcadis.com Resilient Bridgeport 3-4
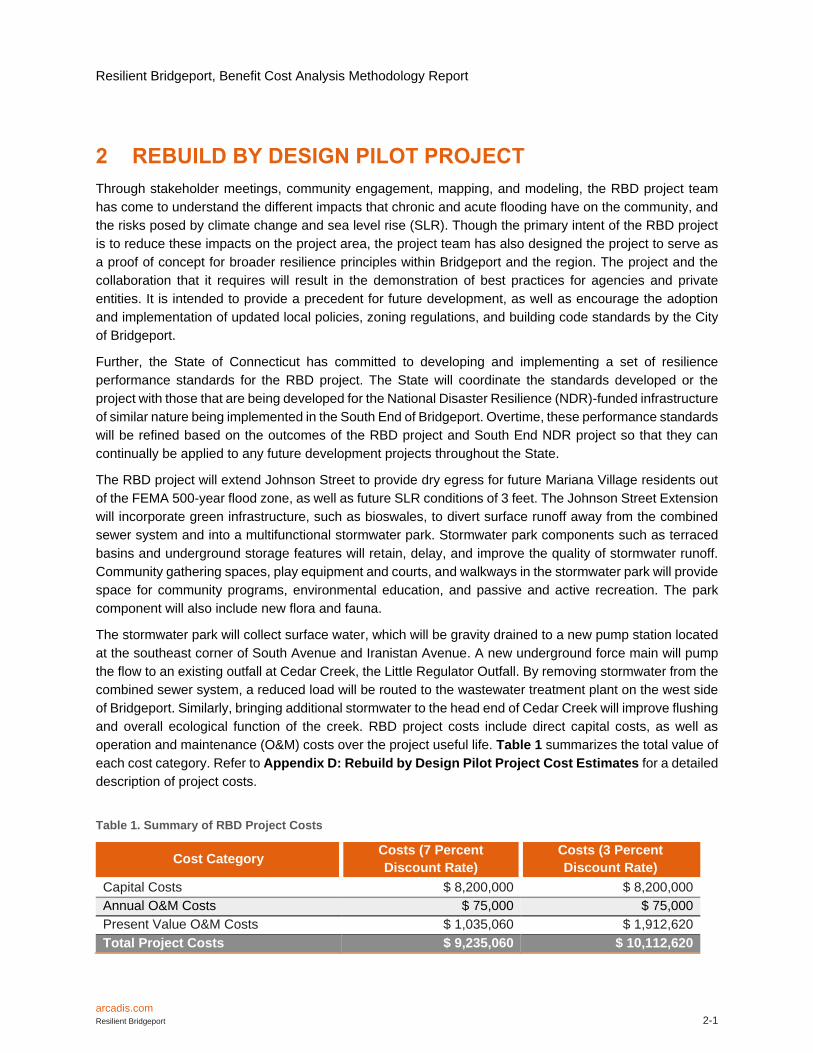
Table 4. Building Attributes
Attribute Analysis Use
Parcel ID Key location identifier specific to a parcel
Unique ID Key location identifier specific to a building
Address Key location identifier
Living Area Used in square footage analysis and replacement value
calculation
Land Occupancy Description Building use
Land Use Description Secondary identifier of building use
Number of Stories Used in square footage analysis
Ground Elevation
Structure grade elevation is an essential field used to estimate the approximate flood depth within
structures. To determine the structure grade elevation, analysts extracted the average elevation within a
structure footprint from the DEEP DEM.
2. Map Building Use to Depth Damage Functions, Replacement Values, and Hazus Occupancy
Types
Buildings may be classified according to both construction features (type) and use (occupancy); analysts
use these classifications to determine further information about the structure. For example, BCA analysts
mapped land occupancy descriptions to classifications used by RS means to estimate replacement value
for a structure. Analysts completed the following mappings based on land occupancy descriptions:
• Land occupancy description to USACE NACCS DDFs. Refer to Appendix C: Depth Damage
Functions for a listing of land occupancies and damage functions.
• Land occupancy description to contents/inventory value shares described in the USACE Lake
Pontchartrain Study to assign the appropriate CSRV’s. Refer to Appendix E: Occupancy
Mapping for the full mapping scheme
• Land occupancy description to Hazus occupancy classes to estimate a replacement value for
structures, as well as apply the appropriate business interruption time multipliers, one-time
disruption costs, and for certain uses, the percent owner occupancy. Refer to Appendix E:
Occupancy Mapping for the full mapping scheme.
3. Conduct Square Footage Analysis
Damages must be assessed based on the square footage within a certain number of stories NACCS
identifies for each DDF.2 The number of stories analysed by the DDF is related to the structure type and
the expected location and value of mechanical, electrical, and plumbing (MEP) in buildings. A significant
portion of a building’s value is captured in such assets; damage costs to these assets can therefore be
disproportionate to those of other assets. Urban high rise damage functions, for example, analyse damages
as a percent of the square footage of the first ten floors given the NACCS assumption that MEP assets are
located within the basement or first floor of the structure.
2 U.S. Army Corps of Engineers. North Atlantic Coast Comprehensive Study (NAACS). http://www.nad.usace.army.mil/CompStudy

Resilient Bridgeport, Benefit Cost Analysis Methodology Report
arcadis.com Resilient Bridgeport 3-5
To calculate the structure square footage for the analysis, analysts multiplied the square footage per floor
by the DDF’s number of stories identified by NACCS (Table 5) or the total number of stories, whichever is
less, for each structure. Analysts use the analysis square footage to calculate the building and contents
replacement value, as described in the next steps.
Table 5. USACE NACCS, Number of Stories per Depth Damage Function
DDF No. Building Types Stories (for Analysis)
1A-1 Apartment 1-Story, No Basement 1
1A-3 Apartment 3-Story, No Basement 3
2 Commercial Engineered 2
3 Commercial Non-Engineered 1
4A Urban High Rise 10
4B Beach High Rise 10
5A Residential 1-Story, No Basement 1
5B Residential 2-Story, No Basement 2
6A Residential 1-Story, With Basement 1
6B Residential 2-Story, With Basement 2
7A Building on Open Pile Foundation 1
7B Building on Pile Foundation with Enclosures 1
Source: North Atlantic Coast Comprehensive Study: Resilient Adaptation to Increasing Risk. Physical Depth Damage Function Summary Report. January 2015.
4. Determine Building and Contents Replacement Value
Building replacement values (BRVs) and Contents Replacement Values (CRVs) are necessary to place a
value on expected damage to buildings. Analysts used RS Means 2016 Square Foot Costs to estimate the
BRV.
Building Replacement Value
The BCA Re-engineering Guide defines the BRV as, “the building replacement value for a specific
component of the building, expressed in dollars”.3 Analyst used RS Means square foot costs to estimate
building replacement values for each Hazus occupancy class4. RS Means is a construction cost estimating
resource published each year often used by engineers to evaluate different construction cost possibilities.
RS Means square foot costs capture labor and material costs, and other information such as city cost
3 Federal Emergency Management Agency. Benefit Cost Analysis Re-engineering Guide. Full Flood Data. 2009. Located at: http://www.fema.gov/media-library-data/20130726-1738-25045-2254/floodfulldata.pdf 4 Hazus occupancy classes represent a certain building type based on use, and the FEMA Hazus-MH Flood Technical Manual applies an average square footage to each occupancy class. This average square footage was used to choose the appropriate replacement value per square foot from the RS Means cost data book.

Resilient Bridgeport, Benefit Cost Analysis Methodology Report
arcadis.com Resilient Bridgeport 3-6
indexes, productivity rates, crew composition, and contractors overhead and profit rates are also available.
Analysts used the appropriate RS Means city cost indices of 1.12 for residential uses and 1.09 for
commercial uses to accommodate construction conditions in Bridgeport. Table 6 shows the BRV values
determined from RS Means with the city cost index increase for Fairfield County. The building replacement
value represents the cost to repair or rebuild damaged buildings in current dollars.
Contents Replacement Value
The USACE NACCS does not include content replacement ratios, therefore analysts used the next best
available data. The CRV is based on the contents-to-structure ratio values (CSRV) for residential and non-
residential structures from data obtained through surveys in the West Shore Lake Pontchartrain Hurricane
and Storm Damage Risk Reduction Study (Table 6).5 To calculate the CRV, analysts multiplied the total
BRV by the appropriate CSRV, mapped to the Hazus occupancy class. Because the contents values are
based on percentages, they increase coincident with an increase in the BRV and do not need to be updated
to Bridgeport specific values.
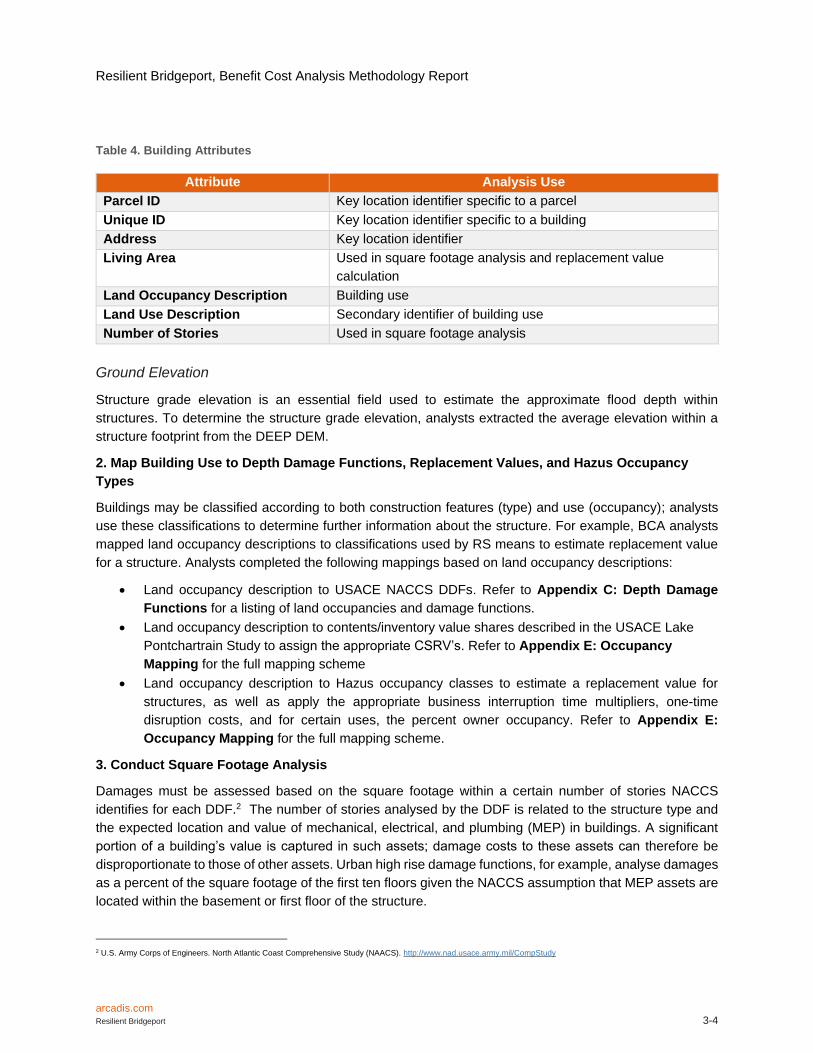
Table 6. Replacement Values
Hazus Occupancy
Code Occupancy Code Description BRV CSVR CRV
RES1 Single Family Dwelling $130.34 0.69 $89.93
RES2 Mobile Home $125.17 1.14 $142.70
RES3A Multi Family Dwelling - Duplex $107.23 0.69 $73.99
RES3B Multi Family Dwelling – 3-4 Units $206.99 0.69 $142.82
RES3C Multi Family Dwelling – 5-9 Units $206.99 0.69 $142.82
RES3D Multi Family Dwelling – 10-19 Units $197.06 0.69 $135.97
RES3E Multi Family Dwelling – 20-49 Units $191.07 0.69 $131.84
RES3F Multi Family Dwelling – 50+ Units $184.55 0.69 $127.34
RES4 Temporary Lodging $192.14 0.69 $132.57
RES5 Institutional Dormitory $220.99 0.69 $152.49
RES6 Nursing Home $224.80 0.69 $155.11
COM1 Retail Trade $127.17 1.19 $151.33
COM2 Wholesale Trade $123.23 2.07 $255.09
COM3 Personal and Repair Services $148.21 2.36 $349.78
COM4 Business/Professional/Technical Services $183.48 0.54 $99.08
COM5 Depository Institutions $276.60 0.54 $149.36
COM6 Hospital $394.26 0.54 $212.90
COM7 Medical Office/Clinic $223.50 0.54 $120.69
COM8 Entertainment & Recreation $233.01 1.70 $396.13
COM9 Theaters $195.78 0.54 $105.72
5 USACE. 2014. West Shore Lake Pontchartrain Hurricane and Storm Damage Risk Reduction Study – Final Integrated Feasibility Study Report and Environmental Impact Statement. November.
Resilient Bridgeport, Benefit Cost Analysis Methodology Report
arcadis.com Resilient Bridgeport 3-7
Hazus Occupancy
Code Occupancy Code Description BRV CSVR CRV
COM10 Parking $82.52 0.54 $44.56
IND1 Heavy $140.17 2.07 $290.16
IND2 Light $123.23 2.07 $255.09
IND3 Food/Drugs/Chemicals $189.91 2.07 $393.10
IND4 Metals/Minerals Processing $189.91 2.07 $393.10
IND5 High Technology $189.91 2.07 $393.10
IND6 Construction $123.23 2.07 $255.09
AGR1 Agriculture $123.23 N/A N/A
REL1 Church/Membership Organizations $197.03 0.55 $108.36
GOV1 General Services $157.02 0.55 $86.36
GOV2 Emergency Response $262.05 1.50 $393.07
EDU1 Schools/Libraries $210.99 1.00 $210.99
EDU2 Colleges/Universities $185.28 1.00 $185.28
5. Determine Flood Depth
Analysts subtracted grade elevations from the FEMA defined 10 percent, 2 percent, 1 percent, and 0.2
percent flood elevations to determine the expected flood depths in structures. The USACE NACCS DDFs
account for expected first floor elevation (FFE) by occupancy type and age, as well as the presence of
mechanical, electrical, and plumbing (MEP) located in the basement. Since the DDFs incorporate these
building attributes, it is not necessary to account for FFE in the asset inventory. To determine the flood
depths, analysts obtained the flood elevation within a building footprint for each flood scenario, and
subtracted the average grade elevation from the respective flood elevations to obtain a flood depth for each
flood scenario.
6. Estimate Percent Damage and Monetary Losses
As previously mentioned, DDFs are a relationship between the depth of floodwater in a structure and the
percent of flood damage. Once BCA analysts established the expected flood depth for each flood scenario,
they applied the DDF to estimate the percent of structural or contents damage; this percentage is applied
to a structure’s BRV or CRV to produce a physical loss value in dollars. Analysts applied the annual
probability of each flood scenario to expected flood impacts to calculate annual benefits (Table 7).
Ultimately, benefits represent the present value of the sum of expected annual avoided damages over the
project useful life.

Resilient Bridgeport, Benefit Cost Analysis Methodology Report
arcadis.com Resilient Bridgeport 3-8
Table 7. Direct Physical Damage Results
Flood Scenario (Percent Annual Chance Event)
Loss Category Total Direct Physical
Damages Building Losses Contents Losses
10 Percent $2,007,510 $2,326,120 $4,333,630
2 Percent $3,285,290 $4,620,570 $7,905,860
1 Percent $4,003,460 $5,792,100 $9,795,560
0.2 Percent $6,171,770 $9,453,250 $15,625,020
Annualized Losses Avoided $318,840 $401,850 $16,772,570
3.1.1.4 Assumptions
BCA analysts made the following assumptions to account for uncertainties and limitation of the analysis:
• The USACE NACCS DDFs account for underground vulnerabilities by applying a percent damage
for negative flood depths.
• The NACCS DDFs did not provide percent loss for all flood depth intervals for all occupancies, and
provided no percent loss above ten feet of flood depth. As such, analysts developed trend
interpolations based on the preceding three available flood depths for missing DDFs. A similar
approach was used for flood depth gaps below zero flood depth, using averages between flood
depths, where available.
• The DDFs do not assume complete loss beyond 50 percent damage, as is often assumed for use
with benefit cost analyses, as well as substantial damage determinations. Further, the analysis
does not consider the impacts of codes and standards in restoration. As such, direct physical
damage costs may be conservatively low.
• Benefits begin the year Marina Village redevelopment is complete, which is 2023.
• The RBD project life-cycle costs do not include the costs associated with the redevelopment of the
Marina Village site. In Connecticut, activities such as the construction of public housing in the
floodplain are considered a “critical activity.” Critical activities are regulated to the 500-year flood
elevation when applying to the Department of Energy and Environment Protection for a Flood
Management Certification.6 These costs are not included in the analysis, since they are activities
associated with the minimum standards per the Regulations of Connecticut State Agencies and not
an additional expense to develop to a higher standard.
• Analysts assume the redevelopment of Marina Village will be a similar style and density multi-family
housing complex. As such, analysts consider the number of future population and units within the
site to be similar. The analysis does not consider an increase in development or population density,
resulting in a conservative analysis.
3.1.2 Displacement Costs
Residents of impacted structures may experience displacement costs during the time when a building
becomes uninhabitable due to flood damage. Relocation costs are associated with moving a household or
a business to a new location and resuming business in that new location. Relocation costs are derived from
6 Sections 25-68h-1 through 25-68h-3, Regulations of Connecticut State Agencies

Resilient Bridgeport, Benefit Cost Analysis Methodology Report
arcadis.com Resilient Bridgeport 3-9
displacement time, which is derived from DDFs that relate a depth of flooding to an amount of time a
structure is not usable. The overall approach taken to evaluate relocations costs is:
1. Identify flood depths and damage expected at the 10 percent, 2 percent, 1 percent, and 0.2 percent
annual chance flood event
2. Determine expected displacement time based on flood depth and building use
3. Calculate relocation costs
3.1.2.1 Data Sources
BCA analysts used the following data sources when evaluating displacement costs:
• Hazus-MH 3.2 One-time Disruption Cost Defaults: Hazus provides national one-time relocation
costs per square foot based on Hazus occupancy class. These costs are provided in 2006 dollars
and have been normalized to 2016 dollars based on inflation. Refer to Appendix F: Additional
Benefit Cost Analysis Resources for Hazus-MH 3.2 manual excerpts.
• US Census Bureau American Community Survey 5-Year Estimates (2014): provided the
percent owner occupancy by census block for residential uses. Analysts used Hazus-MH 3.2
default values for commercial structures as local figures were not readily available.
• Hazus-MH 3.2 Percent Owner Occupancy Defaults: Hazus provides percent owner occupancy
for non-residential uses by Hazus occupancy class (local value not available).
• Direct Physical Damages: Flood impacts were modeled for different flood scenarios to determine
which structures are expected to flood and the depth of flooding within the structure (see 2.2.1
Direct Physical Damages – Buildings and Contents).
• FEMA BCA Toolkit 5.3: Depth displacement tables were not provided with the USACE NACCS
DDFs used in the direct physical damage analysis, therefore analysts extracted displacement
tables from the BCA Toolkit to determine displacement time for structures based on flood depth.
• Local Rental Rates: Analysts researched local rent rates within the project area and applied these
rates by occupancy. An online survey of varied sizes and types of residential spaces currently
available for rent within the South End established local residential rental rates. Local commercial
rental rates were obtained in the same manner as residential rental rates. Analysts used Loopnet
to obtain commercial rental values, and Trulia, and Zillow to conduct the residential survey (all
online real estate services).
3.1.2.2 Approach
1. Identify Impacted Structures: The direct physical damages analysis identified structures expected to
be impacted at the 10 percent, 2 percent, 1 percent, and 0.2 percent annual chance flood events.
2. Identify Impacted Square Footage: For structures that are expected to experience less than ten feet
of flooding, the total impacted square footage is the area of the first floor. Analysts use the total square
footage of the first two floors when a structure experiences more than ten feet of flooding.
3. Identify and Apply Percent Owner Occupied by Occupancy: For residential uses, census block level
data provided the percent owner occupied. Analysts assigned all non-residential uses default percent
owner occupancy obtained from Hazus-MH 3.2.

Resilient Bridgeport, Benefit Cost Analysis Methodology Report
arcadis.com Resilient Bridgeport 3-10
4. Identify Rental Rates by Occupancy: Analysts categorized available rental units by commercial and
residential uses for the project area, and then calculated an average rent price per square foot per year for
each use. The results of this analysis indicate that the average annual price per square foot for commercial
properties in 2016 is $10.05, and the average annual price per square foot for residential properties in 2016
is $13.13. Analysts converted these values to an average price per square foot per day for use in the
relocation cost calculation outlined below.
5. Evaluate Displacement Time: The estimated flood depth within each structure is correlated to USACE
depth displacement tables to estimate displacement time for each modeled flood scenario.
6. Process Relocation Costs: Analysts processed relocation costs to building occupants based on
occupancy type.7 Displacement costs, or relocation costs, are a product of percent damage, impacted
square footage, disruption costs per occupancy, rental costs, displacement time, and percent owner
occupied. Analysts applied the probability of each flood scenario to expected impacts to calculate annual
benefits (Table 8).
𝑅𝑒𝑙𝑜𝑐𝑎𝑡𝑖𝑜𝑛 𝑐𝑜𝑠𝑡𝑠 = 𝐼𝑓 𝑝𝑒𝑟𝑐𝑒𝑛𝑡 𝑑𝑎𝑚𝑎𝑔𝑒 𝑖𝑠
> 10 𝑝𝑒𝑟𝑐𝑒𝑛𝑡: 𝐼𝑚𝑝𝑎𝑐𝑡𝑒𝑑 𝑓𝑙𝑜𝑜𝑟 𝑎𝑟𝑒𝑎 × (1 − 𝑝𝑒𝑟𝑐𝑒𝑛𝑡 𝑜𝑤𝑛𝑒𝑟 𝑜𝑐𝑐𝑢𝑝𝑖𝑒𝑑) × 𝑑𝑖𝑠𝑟𝑢𝑝𝑡𝑖𝑜𝑛 𝑐𝑜𝑠𝑡
+ 𝑝𝑒𝑟𝑐𝑒𝑛𝑡 𝑜𝑤𝑛𝑒𝑟 𝑜𝑐𝑐𝑢𝑝𝑖𝑒𝑑 × (𝑑𝑖𝑠𝑟𝑢𝑝𝑡𝑖𝑜𝑛 𝑐𝑜𝑠𝑡 + 𝑟𝑒𝑛𝑡𝑎𝑙 𝑐𝑜𝑠𝑡 × 𝑑𝑖𝑠𝑝𝑙𝑎𝑐𝑒𝑚𝑒𝑛𝑡 𝑡𝑖𝑚𝑒)]
Table 8. Relocation Costs Avoided
Flood Scenario (Percent Annual Chance Event)
Relocation Costs
10 Percent -
2 Percent $18,180
1 Percent $53,770
0.2 Percent $124,300
Annualized Losses Avoided $1,150
3.1.2.3 Assumptions
• Relocation costs are only calculated for floors expected to be directly impacted by floodwaters.
There are times when the entire structure will be displaced because of flood impacts. As a result,
this approach produces conservative results.
• Depth displacement tables used in the analysis do not consider flooding below grade. Utilities and
other critical assets may lie below grade. When these areas flood, occupants may be displaced,
even if flood waters do not reach above the first floor. The analysis does not capture such
displacement.
• The depth displacement tables do not extend beyond 16 feet of flood depth. As such, analysts
assume displacement periods for flood depths above 16 feet match the time for displacement at
16 feet.
7 It is important to note that this equation incorporates only owner-occupied structures when calculating displacement values. The reason for this is that a renter who has been displaced would likely cease to pay rent to the building owner of the damaged property, and instead would pay rent to a new landlord. As such, the renter could reasonably be expected to incur no new rental expenses. Conversely, if the damaged property is owner-occupied, then the owner will have to pay for new rental costs in addition to any existing costs while the building is being repaired. This model assumes that it is unlikely that an occupant will relocate if a building is slightly damaged (less than 10% structure damage).
Resilient Bridgeport, Benefit Cost Analysis Methodology Report
arcadis.com Resilient Bridgeport 3-11
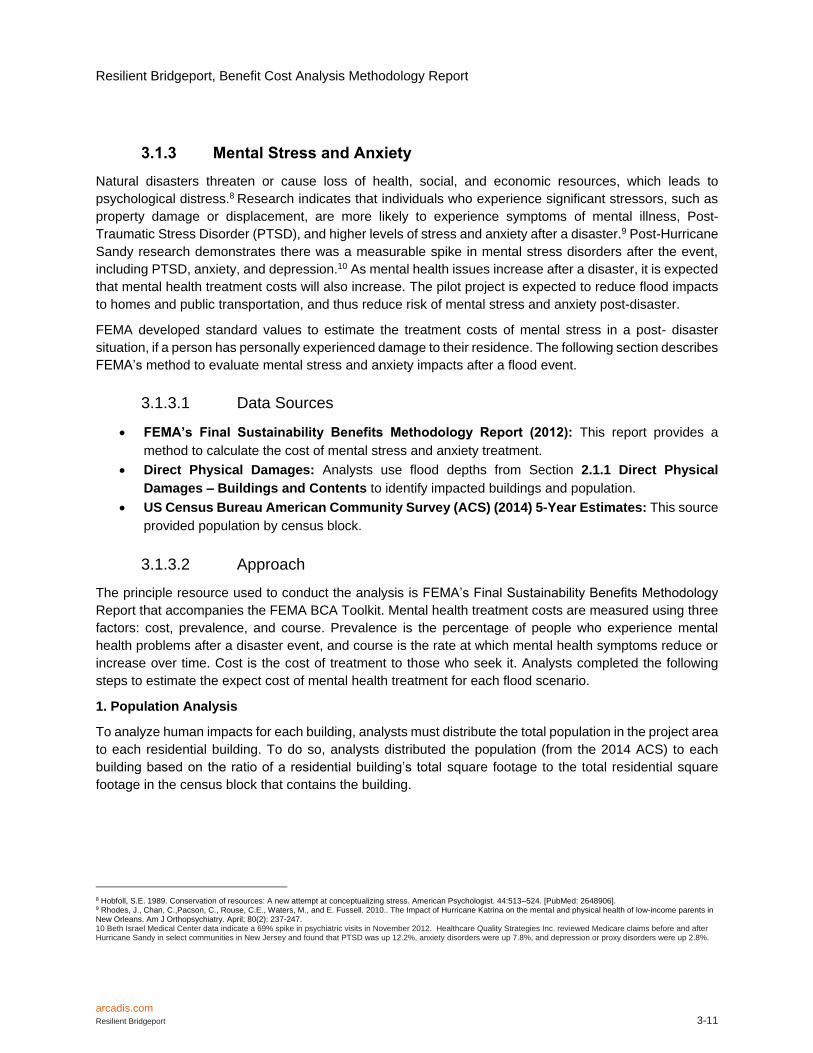
3.1.3 Mental Stress and Anxiety
Natural disasters threaten or cause loss of health, social, and economic resources, which leads to
psychological distress.8 Research indicates that individuals who experience significant stressors, such as
property damage or displacement, are more likely to experience symptoms of mental illness, Post-
Traumatic Stress Disorder (PTSD), and higher levels of stress and anxiety after a disaster.9 Post-Hurricane
Sandy research demonstrates there was a measurable spike in mental stress disorders after the event,
including PTSD, anxiety, and depression.10 As mental health issues increase after a disaster, it is expected
that mental health treatment costs will also increase. The pilot project is expected to reduce flood impacts
to homes and public transportation, and thus reduce risk of mental stress and anxiety post-disaster.
FEMA developed standard values to estimate the treatment costs of mental stress in a post- disaster
situation, if a person has personally experienced damage to their residence. The following section describes
FEMA’s method to evaluate mental stress and anxiety impacts after a flood event.
3.1.3.1 Data Sources
• FEMA’s Final Sustainability Benefits Methodology Report (2012): This report provides a
method to calculate the cost of mental stress and anxiety treatment.
• Direct Physical Damages: Analysts use flood depths from Section 2.1.1 Direct Physical
Damages – Buildings and Contents to identify impacted buildings and population.
• US Census Bureau American Community Survey (ACS) (2014) 5-Year Estimates: This source
provided population by census block.
3.1.3.2 Approach
The principle resource used to conduct the analysis is FEMA’s Final Sustainability Benefits Methodology
Report that accompanies the FEMA BCA Toolkit. Mental health treatment costs are measured using three
factors: cost, prevalence, and course. Prevalence is the percentage of people who experience mental
health problems after a disaster event, and course is the rate at which mental health symptoms reduce or
increase over time. Cost is the cost of treatment to those who seek it. Analysts completed the following
steps to estimate the expect cost of mental health treatment for each flood scenario.
1. Population Analysis
To analyze human impacts for each building, analysts must distribute the total population in the project area
to each residential building. To do so, analysts distributed the population (from the 2014 ACS) to each
building based on the ratio of a residential building’s total square footage to the total residential square
footage in the census block that contains the building.
8 Hobfoll, S.E. 1989. Conservation of resources: A new attempt at conceptualizing stress. American Psychologist. 44:513–524. [PubMed: 2648906]. 9 Rhodes, J., Chan, C.,Pacson, C., Rouse, C.E., Waters, M., and E. Fussell. 2010.. The Impact of Hurricane Katrina on the mental and physical health of low-income parents in New Orleans. Am J Orthopsychiatry. April; 80(2): 237-247. 10 Beth Israel Medical Center data indicate a 69% spike in psychiatric visits in November 2012. Healthcare Quality Strategies Inc. reviewed Medicare claims before and after Hurricane Sandy in select communities in New Jersey and found that PTSD was up 12.2%, anxiety disorders were up 7.8%, and depression or proxy disorders were up 2.8%.

Resilient Bridgeport, Benefit Cost Analysis Methodology Report
arcadis.com Resilient Bridgeport 3-12
2. Determine Prevalence Rate and Course
FEMA’s Final Sustainability Benefits Methodology Report11 uses prevalence percentages and mental
health expenses from Schoenbaum (2009) to derive a standard value for mental stress and anxiety costs.
Prevalence percentages are adjusted over different time periods: mild to moderate impacts will reduce over
time as treatment is provided, while severe mental health problems may persist much longer, possibly never
being fully resolved.12 Table 9 provides a summary of prevalence considering course over four different
time periods.13 The FEMA methodology only captures mental health impacts for the first 30 months because
prevalence rates after this period are not available.
Table 9. Mental Health Prevalence Rates After a Disaster
Time after Disaster Severe Mild/Moderate
7-12 months 6% 26%
13-18 months 7% 19%
19-24 months 7% 14%
25-30 months 6% 9%
Source: FEMA Updated Social Sustainability Methodology Report
3. Establish Treatment Cost
Schoenbaum provides an estimate of treatment costs in an ideal scenario where all needs are met. FEMA
contends that treatment costs from the study must be adjusted to consider only those with mental health
problems who will actively seek out treatment (41 percent).14 FEMA uses the following steps to adjust total
treatment costs from Schoenbaum for a percentage of individuals who seek treatment and for prevalence.
𝐶𝑜𝑠𝑡 𝑝𝑒𝑟 𝑝𝑒𝑟𝑠𝑜𝑛 𝑠𝑒𝑒𝑘𝑖𝑛𝑔 𝑡𝑟𝑒𝑎𝑡𝑚𝑒𝑛𝑡 = 𝑇𝑟𝑒𝑎𝑡𝑚𝑒𝑛𝑡 𝑐𝑜𝑠𝑡 𝑝𝑒𝑟 𝑝𝑒𝑟𝑠𝑜𝑛15 × 0.41 × 𝑝𝑟𝑒𝑣𝑎𝑙𝑒𝑛𝑐𝑒
This methodology is applied to each time period, adjusting for prevalence. Analysts normalized the values
provided by FEMA’s Final Sustainability Benefits Methodology Report (2012) using the Consumer Pricing
Index (CPI) Inflation Calculator,16 and the costs for both severe and mild/moderate mental health problems
over each time period are added together to provide a total treatment cost of $ 2,707 for 30 months. Table
10 provides a summary of treatment costs in current dollars.
11 FEMA. 2012. Final Sustainability Benefits Methodology Report. August 23. 12 Schoenbaum, Michael; Butler, Brittany; Kataoka, Sheryl; Norquist, Grayson; Springgate, Benjamin; Sullivan, Greer; Duan, Naihua; Kessler, Ronald; and Kenneth Wells. 2009. Promoting Mental Health Recovery After Hurricanes Katrina and Rita: What Can Be Done at What Cost. Archives of General Psychiatry, Vol. 66, #8, August. 13 FEMA. 2014. Updated Social Benefits Methodology Report. December 18. 14 Wang, Philip S., MD, DrPH; Lane, Michael, MS; Olfson, Mark, MD, MPH; Pincus, Harold A., MD; Wells, Kenneth B., MD, MPH; Kessler, Ronald C., PhD. 2005. Twelve-Month Use of Mental Health Services in the United States: Results from the National Comorbidity Survey Replication. Archives of General Psychiatry, v. 62, June. A., MD; Wells, Kenneth B., MD, MPH; and Ronald C. Kessler, PhD. 2005. Twelve-Month Use of Mental Health Services in the United States: Results from the National Comorbidity Survey Replication. Archives of General Psychiatry, v. 62, June. 15 Schoenbaum, Michael; Butler, Brittany; Kataoka, Sheryl; Norquist, Grayson; Springgate, Benjamin; Sullivan, Greer; Duan, Naihua; Kessler, Ronald; Wells, Kenneth. 2009. Promoting Mental Health Recovery After Hurricanes Katrina and Rita: What Can Be Done at What Cost. Archives of General Psychiatry, Vol. 66, #8, August 2009. 16 U.S. Bureau of Labor Statistics. Undated. CPI Inflation Calculator. [web page] Located at: http://www.bls.gov/data/inflation_calculator.htm.

Resilient Bridgeport, Benefit Cost Analysis Methodology Report
arcadis.com Resilient Bridgeport 3-13
Table 10. Cost of Treatment17 After a Disaster (30 Month Duration), Per Person Expected to Seek Treatment
Time after
Disaster Severe Mild/Moderate
Total per
person
7-12 months $ 220.00 $ 691.27 $ 911.27
13-18 months $ 256.66 $ 451.98 $ 708.64
19-24 months $ 256.66 $ 372.22 $ 628.88
25-30 months $ 218.89 $ 239.28 $ 458.17
Total $ 2,707
Source: FEMA Updated Social Sustainability Methodology Report
4. Identify Impacted Population and Calculate Costs
Analysts consider the total number of residents in Marina Village projected post-development that
experience flooding during a 0.2 percent annual chance event as impacted. The cost per person was
applied to the total number of Marina Village residents expected to be impacted by flooding. Per FEMA
methodology, analysts do not annualize benefits; rather, benefits at the design level of protection (the 0.2
percent annual chance flood event) are incorporated into the BCR as a one-time benefit: $1,050,280.
3.1.3.3 Assumptions
• Research is limited to 30 months after a disaster; therefore, estimated losses avoided are limited
to this period. Mental health avoided losses beyond two and a half years after a disaster, though
expected, are not valued in this analysis.
• Benefits are calculated for only 41 percent of the impacted population because research indicates
that only that portion of the population with mental health issues can be expected to seek treatment.
This significantly lowers the calculated treatment costs and does not consider the full costs to
society.
• The analysis does not consider population growth.
• The value of treatment is a national figure and does not consider local costs.
3.1.4 Lost Productivity
FEMA’s standard values for mental health impacts also include lost productivity due to mental stress and
anxiety. Historical impacts indicate that mental health issues will increase after a disaster, and this, paired
with research related to lost productivity due to mental illness, indicates that economic productivity can be
impacted by an increase in mental health issues post-disaster.18 A study of 19 countries by the World Health
Organization showed a lifetime 32 percent reduction in earnings for respondents with mental illness.19
Implementation of the RBD project will help reduce the number of stressors caused by natural disasters,
thereby reducing mental health impacts. Fewer mental health impacts will reduce lost work productivity.
17 Costs normalized to 2015 dollars using the CPI calculator located at: http://data.bls.gov/cgi-bin/cpicalc.pl?cost1=623.63&year1=2008&year2=2015 18 Insel, Thomas. Assessing the Economic Costs of Serious Mental Illness. American Journal of Psychiatry. 165:6 June 2008. / Kessler et al. Individual and Societal Effects of Mental Disorders on Earnings on the United States: Results from the National Comorbidity Survey Replication. American Journal of Psychiatry. 165:6. June 2008. 19 Levinson, et al. 2010. Associations of Serious Mental Illness with Earnings: Results from the WHO World Mental Health Surveys. British Journal of Psychiatry. August; 197(2): 114–121. http://www.ncbi.nlm.nih.gov/pmc/articles/PMC2913273

Resilient Bridgeport, Benefit Cost Analysis Methodology Report
arcadis.com Resilient Bridgeport 3-14
3.1.4.1 Data Sources
• FEMA’s Final Sustainability Benefits Methodology Report (2012): This report provides a
method to calculate the cost of lost productivity after a flood event.
• US Census Bureau American Community Survey (2014) 5-Year Estimates: Analysts use the
average number of workers per household and persons per household from this data source to
determine the number of impacted workers.
• Direct Physical Damages: Analysts use flood depths from Section 2.1.1 Direct Physical
Damages – Buildings and Contents to identify impacted buildings and population.
• Structure Population: provides the number of people expected to reside in impacted buildings.
3.1.4.2 Approach
FEMA’s Final Sustainability Benefits Methodology Report that accompanies the FEMA BCA Toolkit is the
primary resource used to estimate lost productivity.
1. Determine the Value of Work Productivity
Analysts first established the value of work productivity per FEMA’s methodology:
𝐿𝑜𝑠𝑠 𝑜𝑓 𝑊𝑜𝑟𝑘 𝑃𝑟𝑜𝑑𝑢𝑐𝑡𝑖𝑣𝑖𝑡𝑦 = (𝐸𝐶𝑁𝐴 × 𝐻𝑁𝐴) × 25.5%
Where:
𝐸𝐶𝑁𝐴: Average Employment Compensation
𝐻𝑁𝐴: Average Number of Hours Worked per Day
FEMA references Levinson et al (2010)20 in which research was conducted using the World Health
Organization’s Mental Health Surveys in 19 countries; the study found that individuals in the United States
with mental health illnesses experience as much as a 25.5 percent reduction in earnings. The national
average for employment compensation in March 2015 was $33.49 per hour.21 This, multiplied by the
average number of hours worked per day (6.9),22 produces a daily U.S. value of $231.08. Thus, a 25.5
percent reduction in earnings would equal a loss of $58.90 daily, or $1,767 per capita, monthly.
2. Determine Prevalence Rates
Analysts apply $1,767 to the amount of time lost productivity is expected to occur, 30 months. Prevalence
factors from Schoenbaum (2009) are used to adjust the value of productivity loss over 30 months, to
account for the fact that only a portion of the population will experience mental health impacts post-disaster.
The prevalence factor is based on severe mental health issues because there is insufficient literature to
document the impacts of mild/moderate mental health issues on productivity.23 Accounting for prevalence,
the value of work productivity for 30 months is $3,394 per capita, monthly.
20 Levinson, et al. 2010. Associations of Serious Mental Illness with Earnings: Results from the WHO World Mental Health Surveys. British Journal of Psychiatry. August; 197(2): 114–121. http://www.ncbi.nlm.nih.gov/pmc/articles/PMC2913273 21 Employer Costs for Employee Compensation. March 2015. United States Department of Labor, Bureau of Labor Statistics. 22 Average week hours of overtime of all employees. Web page. Located at: http://www.bls.gov/news.release/empsit.t18.htm 23 FEMA. 2014. Updated Social Benefits Methodology Report. December 18.

Resilient Bridgeport, Benefit Cost Analysis Methodology Report
arcadis.com Resilient Bridgeport 3-15
3. Identify Impacted Population
Analysts consider the total population in residential buildings that experience flooding during a 0.2 percent
annual chance event as impacted. Population data and the average number of persons per household
(2.72) determined the number of households projected to be in the Marina Village redevelopment. Analysts
apply the average number of workers per household in Bridgeport (1.35 workers) to the number of
households impacted to determine the number of wage earning residents who will experience flooding. The
total lost productivity share per worker for 30 months ($3,394) is multiplied by to the number of wage-
earning residents who will experience flooding to value productivity losses avoided. Analysis results are
$653,610; analysts incorporate benefits into the BCR in the same fashion as mental stress and anxiety
benefits.
3.1.4.3 Assumptions
• Analysts assumed that the average number of workers per household and the average number of
persons per household for Bridgeport is applicable to the project area.
• Value is provided for the first 30 months only because there is insufficient literature available to
analyze longer periods of time.
• Prevalence rates are based on severe mental issues because there is insufficient literature related
the impacts of mild or moderate mental health problems on work productivity. Thus, analysts
consider results as conservative.
• The analysis does not account for population growth.
3.2 Dry Egress Dry egress is a development practice in Connecticut that requires critical developments, such as public
housing, located within the 500-year floodplain, to have a means of evacuation, as well as route for
emergency vehicles, constructed to the 500-year flood elevation plus 2 feet.24 Elevated roads also prevent
residents from being stranded during flood events, reduce flood damage, reduce the need for water
rescues, and increase public safety. The RBD project will provide dry egress for the Marina Village
redevelopment site, as well as a shorter route to access dry egress for Seaside Village residents and
adjacent properties. Dry egress will be constructed to the 500-year flood elevation plus 3 feet to account
for future SLR. The BCA captures the benefits of dry egress by evaluating the value of road service and
avoided casualties.
3.2.1 Loss of Roadway Service
Transportation assets and systems in the South End may flood during both acute and chronic events. Loss
of roadway service is a function of the per-hour value of time, detour route, and number of vehicles
evacuating. Analysts focused on the future residents of the Marina Village redevelopment that will benefit
from dry egress.
24 “A Guide for Higher Standards in Floodplain Management”. Association of State Floodplain Managers. October 2010.

Resilient Bridgeport, Benefit Cost Analysis Methodology Report
arcadis.com Resilient Bridgeport 3-16
3.2.1.1 Data Sources
• FEMA Benefit-Cost Analysis Re-Engineering (BCAR) Development of Standard Economic
Values: provides a standard value of detour lost time per vehicle.
• The New England Hurricane Evacuation Study (2016): provides the average number of vehicles
per household and Bridgeport specific evacuation rates.
• Fairfield County FIS and Flood Insurance Rate Map: This data is overlaid with buildings to
determine potential evacuation routes.
• Direct Physical Damages: Analysts used flood depths for each structure to identify impacted
buildings and residents.
3.2.1.2 Approach
This FEMA methodology is centered around the value of time, which is described in FEMA’s Benefit Cost
Analysis Re-Engineering Guide, Development of Standard Economic Values report. In summary, analysts
evaluate additional travel time needed for an alternative travel route because floodwaters inundate a
roadway. The following equation characterizes roadway loss of service:
𝑅𝑜𝑎𝑑𝑤𝑎𝑦 𝐿𝑜𝑠𝑠 𝑜𝑓 𝑆𝑒𝑟𝑣𝑖𝑐𝑒 = [((𝑈𝑝𝑃𝐷×𝐸𝑅) × 𝑉𝑝𝐻 × 𝑉𝑇) × 𝐷𝑇] × 𝑇𝑉
Where:
UpPD: Number of Units per Property Description
ER: Expected Evacuation Rate
VpH: Average Number of Vehicles per Household
VT: Vehicle Trips to Evacuate
DT: Delay Time
TV: Hourly Value of Time per Vehicle
1. Evaluate Evacuation Routes and Determine Delay Time
Analysts reviewed the FEMA flood zones and found floodwaters would inundate future Marina Village
resident’s evacuation route during a 2 percent annual chance flood event. When no alternative route is
available, FEMA uses a delay time of 12 hours as a standard value.25
2. Identify Impacted Population and Evacuating Vehicles
Analysts apply the average vehicles per household sourced from the New England Hurricane Evacuation
Study (2016) to the total the number of households projected to be in Marina Village, determined in Section
2.1.4 Lost Productivity. Analysts factor evacuation rates into the analysis to account for residents that
choose to shelter in place. Analysts assumed vehicles trips during an evacuation scenario to be one.
25 FEMA Supplement to the Benefit-Cost Analysis Reference Guide (2011). Page 5-14. http://www.fema.gov/media-library-data/1396549910018-c9a089b8a8dfdcf760edcea2ff55ca56/bca_guide_supplement__508_final.pdf
Resilient Bridgeport, Benefit Cost Analysis Methodology Report
arcadis.com Resilient Bridgeport 3-17
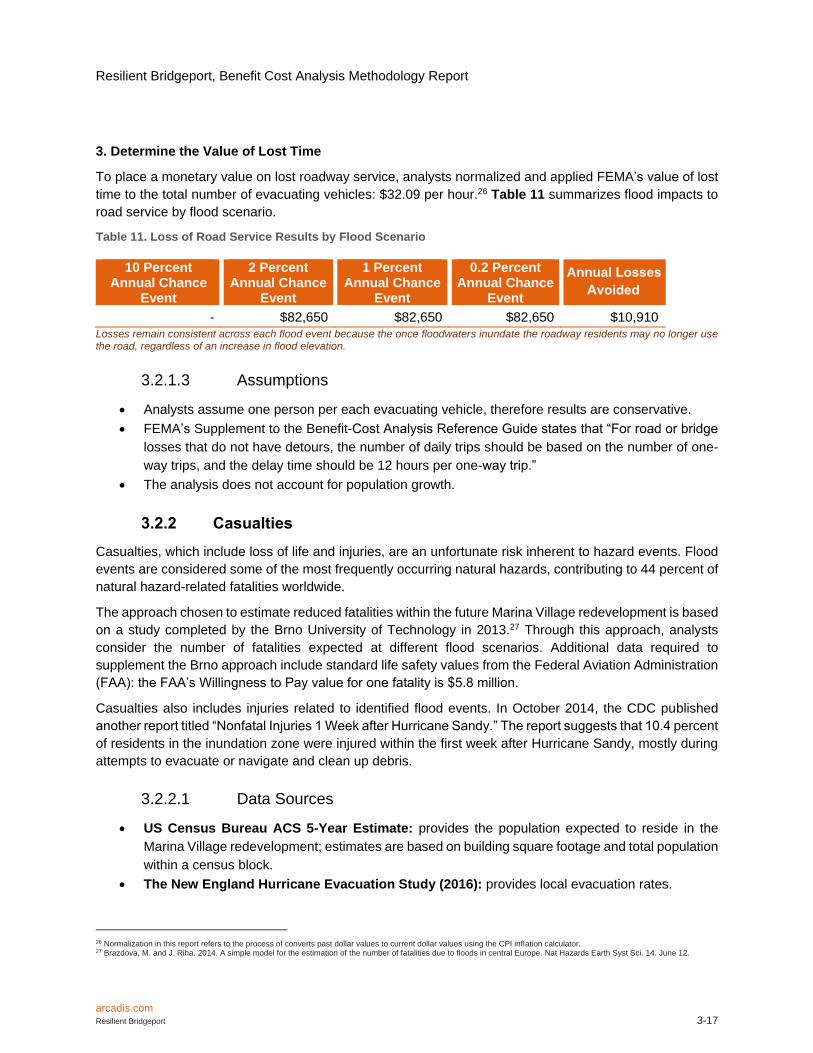
3. Determine the Value of Lost Time
To place a monetary value on lost roadway service, analysts normalized and applied FEMA’s value of lost
time to the total number of evacuating vehicles: $32.09 per hour.26 Table 11 summarizes flood impacts to
road service by flood scenario.
Table 11. Loss of Road Service Results by Flood Scenario
10 Percent Annual Chance
Event
2 Percent Annual Chance
Event
1 Percent Annual Chance
Event
0.2 Percent Annual Chance
Event
Annual Losses
Avoided
- $82,650 $82,650 $82,650 $10,910
Losses remain consistent across each flood event because the once floodwaters inundate the roadway residents may no longer use the road, regardless of an increase in flood elevation.
3.2.1.3 Assumptions
• Analysts assume one person per each evacuating vehicle, therefore results are conservative.
• FEMA’s Supplement to the Benefit-Cost Analysis Reference Guide states that “For road or bridge
losses that do not have detours, the number of daily trips should be based on the number of one-
way trips, and the delay time should be 12 hours per one-way trip.”
• The analysis does not account for population growth.
3.2.2 Casualties
Casualties, which include loss of life and injuries, are an unfortunate risk inherent to hazard events. Flood
events are considered some of the most frequently occurring natural hazards, contributing to 44 percent of
natural hazard-related fatalities worldwide.
The approach chosen to estimate reduced fatalities within the future Marina Village redevelopment is based
on a study completed by the Brno University of Technology in 2013.27 Through this approach, analysts
consider the number of fatalities expected at different flood scenarios. Additional data required to
supplement the Brno approach include standard life safety values from the Federal Aviation Administration
(FAA): the FAA’s Willingness to Pay value for one fatality is $5.8 million.
Casualties also includes injuries related to identified flood events. In October 2014, the CDC published
another report titled “Nonfatal Injuries 1 Week after Hurricane Sandy.” The report suggests that 10.4 percent
of residents in the inundation zone were injured within the first week after Hurricane Sandy, mostly during
attempts to evacuate or navigate and clean up debris.
3.2.2.1 Data Sources
• US Census Bureau ACS 5-Year Estimate: provides the population expected to reside in the
Marina Village redevelopment; estimates are based on building square footage and total population
within a census block.
• The New England Hurricane Evacuation Study (2016): provides local evacuation rates.
26 Normalization in this report refers to the process of converts past dollar values to current dollar values using the CPI inflation calculator. 27 Brazdova, M. and J. Riha. 2014. A simple model for the estimation of the number of fatalities due to floods in central Europe. Nat Hazards Earth Syst Sci. 14. June 12.

Resilient Bridgeport, Benefit Cost Analysis Methodology Report
arcadis.com Resilient Bridgeport 3-18
• Federal Aviation Administration (FAA) values: The Federal Aviation Administration (FAA)
categorizes injuries and fatalities as shown in Table 12. FEMA has acknowledged the validity of
these life safety values and permits their use in benefit cost analyses.
• CDC injury rates: The CDC report from October 2014 titled “Nonfatal Injuries 1 Week after
Hurricane Sandy” estimates 10.4 percent of residents in the inundation zone were injured within
the first week of Hurricane Sandy.
• Brno University of Technology fatality risk methodology: the approach is based on three main
factors: materials loss, population preparedness, and warning.
3.2.2.2 Injuries
To quantify the value of injuries, analysts developed the below equation based on the CDC study titled
“Deaths Associated with Hurricane Sandy”. Analysts assumed that all injuries reduced are FAA AIS1 minor
injuries. This injury category is the lowest value within the FAA study ($13,59028) allowing for a conservative
analysis of injuries associated with a flood event.
𝑉𝑎𝑙𝑢𝑒 𝑜𝑓 𝐼𝑛𝑗𝑢𝑟𝑖𝑒𝑠 = (𝑃𝑜𝑝𝑢𝑙𝑎𝑡𝑖𝑜𝑛 × (1 − 𝐸𝑣𝑎𝑐𝑢𝑎𝑡𝑖𝑜𝑛 𝑅𝑎𝑡𝑒)) × 10.4% × $13,590
Table 12. FAA Category Levels and Values29
Injury
Category Description of Injury
Fraction of
WTP Value
of Life
(Percent)
WTP Value
(2008
Dollars)
AIS 1
Superficial abrasion or laceration of skin; digit sprain; first-
degree burn; head trauma with headache or dizziness (no
other neurological signs).
0.20 $12,000
AIS 2
Major abrasion or laceration of skin; cerebral concussion
(unconscious less than 15 minutes); finger or toe
crush/amputation; closed pelvic fracture with or without
dislocation.
1.55 $90,000
AIS 3
Major nerve laceration; multiple rib fracture (but without flail
chest); abdominal organ contusion; hand, foot, or arm
crush/amputation.
5.75 $334,000
AIS 4
Spleen rupture; leg crush; chest-wall perforation; cerebral
concussion with other neurological signs (unconscious less
than 24 hours).
18.75 $1,088,000
AIS 5
Spinal cord injury (with cord transection); extensive second-
or third- degree burns; cerebral concussion with severe
neurological signs (unconscious more than 24 hours).
76.25 $4,423,000
AIS 6 Injuries, which although not fatal within the first 30 days after
an accident, ultimately result in death. 100 $5,800,000
28 Normalized to current dollars using the Consumer Price Index inflation calculator. 29 Revised Departmental Guidance: Treatment of the Value of Preventing Fatalities and Injuries in Preparing Economic Analyses. Located at: https://www.faa.gov/regulations_policies/policy_guidance/benefit_cost/media/Revised%20Value%20Of%20Life%20Guidance%20Feburary%202008.pdf

Resilient Bridgeport, Benefit Cost Analysis Methodology Report
arcadis.com Resilient Bridgeport 3-19
Source: Revised Departmental Guidance: Treatment of the Value of Preventing Fatalities and Injuries in Preparing Economic Analyses.
3.2.2.2.1 Approach
1. Identify Impacted Population
Analysts consider the number of residents in Marine Village that experience flooding during the 0.2 percent
annual chance event and did not evacuate as the impacted population.
2. Estimate and Value Injuries
Analysts apply 10.4 percent to the total impacted population, then the value of injury to determine the
monetary cost of injuries. The CDC report Nonfatal Injuries 1 Week after Hurricane Sandy found the rate
of injuries among impacted persons to be 10.4 percent.30 Table 13 summarizes the results of the injury
analysis.
Table 13. Injury Analysis Results
Percent Annual Chance Event
Value of Injuries
10 Percent -
2 Percent $146,990
1 Percent $244,510
0.2 Percent $548,380
Annual Injuries Avoided $6,480
3.2.2.2.2 Assumptions
• The results are based on historical data from a CDC survey conducted 5 to 12 months after
Hurricane Sandy. The timing of the evaluation, coupled with the fact that the data is only available
for one event, increases uncertainty. Nevertheless, the study performed is in an area like the project
area, which means that conditions under which the survey was completed are largely transferable.
The survey is thus an appropriate source from which to transfer expected results.
• Injuries reported are only for a one-week period following Hurricane Sandy. The analysis does not
account for injuries sustained while repairing damages from Sandy more than one week following
the event.
• Estimated injuries are all considered minor; the BCA does not account for moderate or serious
injuries.
• The BCA evaluates people with multiple injuries the same as people with only one injury.
• The analysis does not include people in buildings that do not experience flooding, and neither are
injuries sustained because of road damage and closures.
• The BCA does not consider worker and transient populations.
• The BCA does not account for population growth.
30 CDC report titled “Nonfatal Injuries 1 Week after Hurricane Sandy,” October 2014, page 1. http://www.cdc.gov/mmwr/preview/mmwrhtml/mm6342a4.htm

Resilient Bridgeport, Benefit Cost Analysis Methodology Report
arcadis.com Resilient Bridgeport 3-20
3.2.2.3 Fatalities
Most existing methodologies that estimate fatalities use two groups of characteristics: hydraulic
characteristics such as water depth, rate of water rising, flow velocities, wind, and temperature; and by area
characteristics including factors such as population density, land use, warning systems, and vulnerability of
the population.31 Arcadis analysts considered material loss, population preparedness, rate of water rise,
and warning capabilities. This approach is the most appropriate because it accounts both for event damage
characteristics and the community’s capacity to prepare for and react to flood events, both of which relate
to vulnerability.
3.2.2.3.1 Approach
The Brno University of Technology approach is based on three main factors: material loss (in dollars),
population preparedness, and warning. The equation presented below expresses the relationship of these
factors. There are additional factors that are important to consider in estimating the loss of life in a natural
hazard event. Nevertheless, factors such as debris, climatic conditions, water quality, and time of day, were
not available for analysis due to a lack of data.
The equation for fatality estimates:
𝐿𝑂𝐿 = 0.075 × 𝐷0.384 × (𝑃 + 2)−3.207 × (𝑊 + 2)−1.017
Where:
LOL: Loss of Life
D: Material Loss ($)
P: Population Preparedness (aggregated population preparedness factors)
W: Warning (factor-based)
1. Determine D, W, and P Factor
(i) D Factor
The D factor (material loss) consists of building damage and contents loss, which analysts estimated in
direct physical damages analysis. For the purposes of this analysis, analysts evaluated only structure and
contents damage for residential structures for the appropriate flood scenarios. Analysts assumed these
losses reflect both the destructive ability of the event and the number of endangered inhabitants. The
analysis does not consider damage to constructed assets, such as roads or utility systems. The values
used as D in the formula are listed in Table 14.
31 Jonkman, S.N. and J.K. Vrijling. 2002. Loss of life models for sea and river floods. Flood Defence. Wu et al. (eds) Science Press, New York Ltd.

Resilient Bridgeport, Benefit Cost Analysis Methodology Report
arcadis.com Resilient Bridgeport 3-21
Table 14. Expected Material Loss (D) Values by Percent Annual Chance Flood Event
Percent Annual Chance Flood Event Expected Material Loss
10 Percent $4,333,630
2 Percent $7,905,860
1 Percent $9,795,560
0.2 Percent $15,625,020
(ii) P Factor
The P Factor (population preparedness) expresses the preparedness of the community for flood
management and resiliency, and it reflects the population’s general awareness of flooding and required
preparations. Analyst determined this value by rating eight sub-factors on a scale of -1 to 1 (Table 16).
The evaluation of the P sub-factors is based on existing conditions within the project area community. The
flood knowledge held by the public in Bridgeport greatly increased after Hurricanes Sandy and Irene.
Analysts evaluated the P sub-factors to determine the below ratings for P1 to P8. Because of the frequency
and amount of flood prevention and awareness activities present in Bridgeport, analysts assumed that the
same P subfactors apply for all four flood scenarios. Analysts found the final P Factor using the equation
below, where P is the aggregated preparedness score presented in Table 15. Table 16 describes P
subfactors.
𝑃 =1
8∗ ∑ 𝑃𝑖
8
𝑖=1
Table 15. P Values
P Subfactor Factor Description Existing Conditions
Evaluation
P1 Flood awareness and general knowledge of hazards
1
P2 Flood memory 1
P3 Existing flood documentation
1
P4 Understanding of activities and behavior during floods
0
P5 Initiatives and activities of flood committees
0
P6 Response to hydrological forecast
0.5
P7 Response to flood warning 0
P8 Evacuation and rescue activities
1
Aggregated Preparedness 2.125

Resilient Bridgeport, Benefit Cost Analysis Methodology Report
arcadis.com Resilient Bridgeport 3-22
Table 16. P Factor Descriptions
Pi
Score
-1.0 -0.5 0.0 0.5 1.0
P1
No flood awareness
or knowledge about
flood hazard,
sometimes ignorance
Poor awareness,
underestimation of
flood hazard
Common flood
awareness
Fair knowledge about
flood hazards
obtained mostly from
the media
Excellent knowledge
about flood hazards
via the media,
education, training,
etc.
P2
Area never flooded,
no experience with
flooding
Area flooded
decades ago, poor
records concerning
flood losses
Area flooded
decades ago, good
records concerning
the risks
Flooding still in the
memory of the
population
Personal experience
with flooding
P3
Flood extent maps or
flood management
plans not available
Existing flood extent
maps are outdated
Flood extent maps
drawn up based on
current hydrologic
data, but only poor
flood management
plans exist
Flood extent maps
drawn up, flood
management and
evacuation plans
available
Flood extent maps
drawn up, updated
digital versions of
flood management
and evacuation plans
available
P4
Individuals have no
idea about actions to
take during floods
Limited (vague)
understanding of
what to do during
floods
General
understanding of
what to do before
and during a flood
Quite good
knowledge of flood
management plans
and corresponding
activities
Perfect knowledge of
flood management
plans and understand
of what to do in the
event of flooding,
good preparedness
P5 No flood committee
established
Flood committee
established but not
trained, only
equipped with flood
fighting facilities
Flood committee
established and
generally trained,
poorly equipped with
flood-fighting facilities
Only moderately
experienced but
trained committee
with standard flood
fighting facilities
Experienced and
well-trained flood
committee equipped
with flood-fighting
facilities
P6
No response to
hydrological forecast,
no understanding or
belief
Poor understand of
hydrological forecast
and poor response
Approximate
understanding of
forecast and
adequate response
Fair understanding of
hydrological forecast
and good response
Very good
understanding of
hydrological forecast
and very good
response
P7
No response to
warning, no idea
about warning
procedures and
response
Only poor response
to warning, warning
system not trusted
Adequate response Good response to
warning
Immediate and fast
response to warning
P8
Rescue system does
not exist, no staff or
equipment available
Organized rescue
system does not
exist, volunteer basis,
no trained staff
available with
randomly acquired
equipment
Poorly organized but
functioning rescue
system, basic rescue
equipment of
adequate quality
Functioning rescue
system, trained staff
with equipment of fair
quality
Efficiently functioning
rescue system, well-
trained, experienced
and well-equipped
personnel
(iii) W Factor
The W factor (warning) includes factors that influence warning of the community that an event is forecasted.
The contributing factors include a hydrological forecast, the type of warning system employed, the speed
of flooding, and the rate of water level rise; as these factors are somewhat based on the frequency and

Resilient Bridgeport, Benefit Cost Analysis Methodology Report
arcadis.com Resilient Bridgeport 3-23
extent of flooding, analysts evaluate the W Factor for each flood scenario. Table 17 shows the scale of
sub-factors.
Table 17. W Factor Descriptions
Wi Score
-1.0 -0.5 0.0 0.5 1.0
W1
No hydrologic forecast, forecast not possible (e.g. at small catchments)
Only vague and general forecast
General forecast for medium size catchment
Hydrologic forecast provided in a standard way by hydrologic services
Reliable hydrologic forecast based on contemporary technical and modelling techniques
W2 Flood may arrive within several tens of minutes
Flood arrives faster than 45 min
Flood arrives within several hours
Flood arrives within 1 day
Flood arrives within several days
W3 Warning system does not exist
Poorly designed and functioning warning system
Only moderately reliable warning system
Fully functioning traditional warning system
Sophisticated warning system including digital online alarm systems
W4
Water rises at a rate of several meters per hour (floods in 1998, 2009)
Water level rise about 1 m per hour (small catchments in 2013)
Rate of several meters per day
About 1 m per day (floods in 1997, 2002)
Water level rise of several meters over several days
For factor W4, water rise rates are based on event data. Table 18 provides evaluations for W1 to W4 values
for each flood scenario. The aggregated effect of Factor W was evaluated using the equation below, here
W is the sub-factor score.32
𝑊 =1
4∗ ∑ 𝑊𝑖
4
𝑖=1
Table 18. W Values
W
Subfactor
Subfactor Description Existing
Conditions
(10 Percent)
Existing
Conditions
(2 Percent)
Existing
Conditions
(1 Percent)
Existing
Conditions
(0.2 Percent)
W1 Reliability of hydrological
forecast 0.5 0.5 0.5 0.5
W2 Speed of flood arrival 1.0 1.0 1.0 0.5
W3 Warning system 1.0 1.0 1.0 0.5
W4 Rate of water level rise 0.0 0.0 0.0 -0.5
Aggregated Warning Factor Score (W
Factor for each flood scenario) 1.38 1.38 1.38 0.25
32 Brazdova, M. and J. Riha. 2014. A simple model for the estimation of the number of fatalities due to floods in central Europe. Nat Hazards Earth Syst Sci. 14. June 12.

Resilient Bridgeport, Benefit Cost Analysis Methodology Report
arcadis.com Resilient Bridgeport 3-24
2. Value Loss of Life
Loss of life is estimated for each flood scenario by placing all determined factor values (D, P, and W) into
the previously mentioned equation.
For example, the calculation to determine the number of casualties in the 1 percent annual chance event scenario includes:
D Value = $1,608,409,580 P Value = 2.13 W Value = 1.38
0.79 = 0.075 ∗ $1,608,409,5800.384 ∗ (2.13 + 2)−3.207 ∗ (1.38 + 2)−1.017
Analysts apply Federal Aviation Administration’s (FAA) Willingness to Pay values for a fatality ($5.8 million)
to value loss of life.
Table 19. Estimated Fatalities Avoided by Flood Scenario
Percent Annual Chance Event
Estimated Fatalities
Value of Lost Life
10 Percent 0.08 $564,290
2 Percent 0.10 $710,820
1 Percent 0.11 $771,800
0.2 Percent 0.13 $923,370
Annual Fatalities Avoided - $80,210
3.2.2.3.2 Assumptions
• The analysis does not account for road and non-structural asset damages.
• Loss of life post-disaster can be affected by many factors not considered in this methodology,
including the financial and physical health of the population, mental stress and anxiety, and other
factors.
• Fatalities may not be calculated on a per-structure basis due to the nature of P values, which
consider the flood preparedness characteristics of the whole study area population.
• The analysis does not account for population growth.

Resilient Bridgeport, Benefit Cost Analysis Methodology Report
arcadis.com Resilient Bridgeport 4-1
4 VALUE ADDED BENEFITS Beyond improving Bridgeport’s flood resiliency by reducing acute and chronic flood impacts to public
housing and residents, the RBD project intends to foster community cohesion, generate economic
opportunities, improve the natural environment, and stimulate redevelopment through growth, prosperity,
awareness, and beauty. Analysts consider added value benefits, in addition to resiliency benefits, when
comprehensively analyzing increased community resilience: Investment in increased flood resilience may
foster commercial and residential redevelopment, in turn, promoting a more diverse and healthy economy.
A resilient environment can provide protective services that stabilize and contribute to improved air and
water quality, and may also help improve resident’s health. Community gathering space provides an
opportunity for increased social interactions and cohesion, creating additional networks for support during
and after disaster events.
Value added benefits include social, environmental, and economic revitalization benefits resulting from the
RBD project. These benefits include:
• Social benefits in the form of recreational value;
• Aesthetic benefit generated from making the surroundings more desirable for businesses and
residents;
• Environmental benefits in the form of reduced energy use, air pollution, water pollution, and carbon
dioxide emissions; and,
• Economic revitalization benefits related to added commercial space.
Table 20 relates RBD project elements to value added benefit categories.
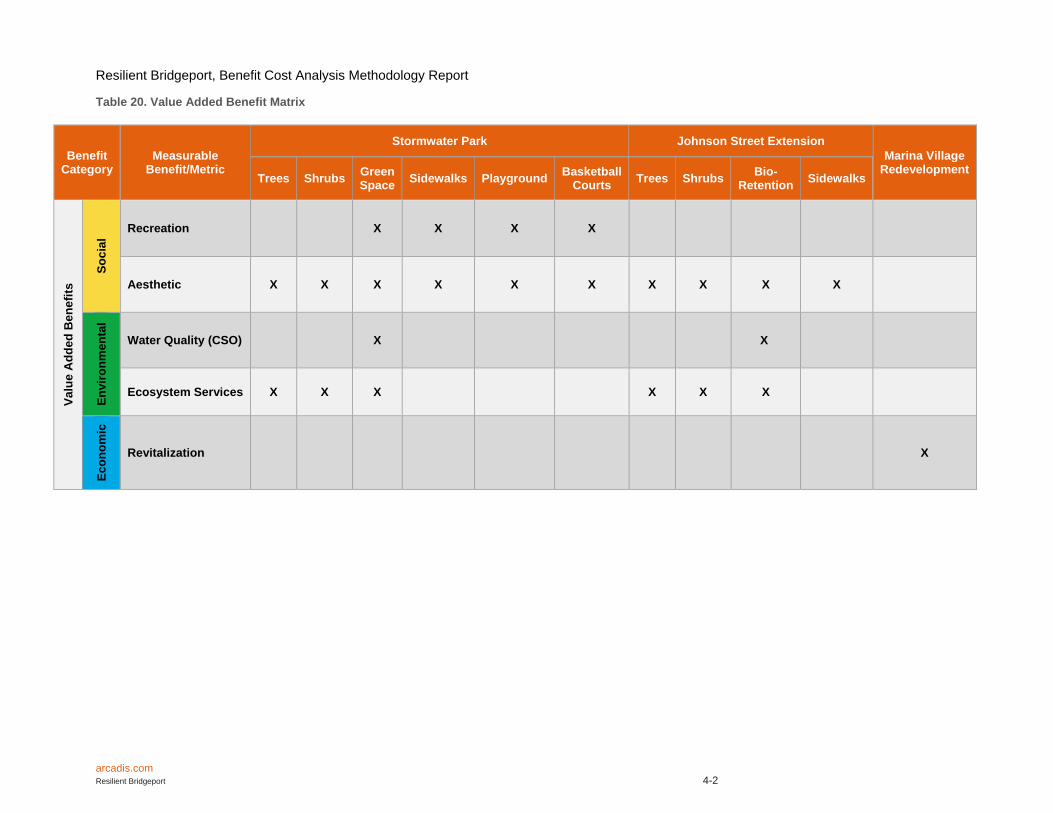
Resilient Bridgeport, Benefit Cost Analysis Methodology Report
arcadis.com Resilient Bridgeport 4-2
Table 20. Value Added Benefit Matrix
Benefit Category
Measurable Benefit/Metric
Stormwater Park Johnson Street Extension
Marina Village Redevelopment
Trees Shrubs Green Space
Sidewalks Playground Basketball
Courts Trees Shrubs
Bio-Retention
Sidewalks
Valu
e A
dd
ed
Ben
efi
ts
So
cia
l
Recreation X X X X
Aesthetic X X X X X X X X X X
En
vir
on
men
tal
Water Quality (CSO) X X
Ecosystem Services X X X X X X
Eco
no
mic
Revitalization X

Resilient Bridgeport, Benefit Cost Analysis Methodology Report
arcadis.com Resilient Bridgeport 4-3
4.1 Social Benefits Urban parks and green space help improve the quality of life and social sustainability of cities by providing
recreation opportunities and aesthetic enjoyment, promoting physical health, contributing to psychological
well-being, enhancing social ties, and providing opportunities for education.33 The RBD project’s
multifunctional stormwater park will be a new public amenity in the neighborhood, and includes basketball
courts, a playground, sidewalks, green open spaces, and passive seating areas. The new stormwater park
will provide opportunity for residents to participate in recreation activities, environmental education, and
community programs, thereby enhancing their health and well-being, increasing social capital34 and
improving the quality of life in the greater community.35
4.1.1 Recreation Benefits
Recreation benefits quantify the consumer value of increased outdoor recreation expected to occur after
completion of the new stormwater park. There are federally approved methods to quantify the value of new
outdoor recreation opportunities: the low value method is based on FEMA’s Final Sustainability Benefits
Methodology Report, and assigns a value per square foot of recreational space. The high value method
uses United States Army Corps of Engineers (USACE) Unit Day Values to value an increase in recreation
activity. The medium method is the average results of high and low estimated benefits.
4.1.1.1 Data Sources
• FEMA’s Final Sustainability Benefits Methodology Report (2012): provides a recreational value
per acre of space. Refer to Appendix F: Additional Benefit Cost Analysis Resources for a
summary of FEMA’s standard values.
• USACE Economic Guidance Memorandum, 16-03, Unit Day Values for Recreation for Fiscal
Year 2016 (2015): provides a daily recreational value by type of recreation activity.
• RBD Project Design Drawings: provide the total area of park features.
4.1.1.2 Approach
Analysts implemented two federal methods to evaluate the stormwater parks recreation benefits. These
methods are described in detail below.
4.1.1.2.1 FEMA: Low Value Method
FEMA generates an annual recreational value per unit area using nationwide, rural, and urban willingness
to pay studies.36 Analysts normalized37 and converted FEMA’s standard annual recreational value per acre
to current dollars per square foot: $0.13. Analysts apply this value to the total area of new park amenities
to estimate the annual recreational value. Table 21 summarizes results of the low value method by park
feature.
33 Zhou, X. and M.P. Rana. 2011. Social benefits of urban green space. A conceptual framework of valuation and accessibility measurements. Management of Environmental Quality: An International Journal. 34 Gomez, E., Baur, J.W.R., Hill, E., and S. Georgiev. 2015. Urban Parks and Psychological Sense of Community. Journal of Leisure Research. 35 Lestan, K.A., Erzen, I., and M. Golobic . 2014. The Role of Open Space in Urban Neighbourhoods for Health-Related Lifestyle. 2014. International Journal of Environmental Research and Public Health. June 36 FEMA uses the benefit transfer methodology to apply the results of previously conducted primary studies to another geography. 37 Normalization in this context refers to converting past dollar values to current dollar values using the Consumer Price Index (CPI) Inflation Calculator: http://www.bls.gov/data/inflation_calculator.htm.

Resilient Bridgeport, Benefit Cost Analysis Methodology Report
arcadis.com Resilient Bridgeport 4-4
Table 21. Stormwater Park Low Annual Recreation Benefit
Park Feature Square Feet Annual Recreation Benefit
Playground 11,613 $1,510
Basketball 9,152 $1,190
Sidewalks 6,334 $820
Green Open Space 38,069 $4,950
Total 65,168 $8,470
4.1.1.2.2 USACE: High Value Method
The USACE produces Unit Day Values (UDV)38 based on expert or informed opinion and judgement to
estimate the average willingness to pay for recreation resources. Analysts calculate recreation benefits by
applying the UDV to a park feature’s expected useful life. The Federal government generates standardized
average estimated useful life values that analysts used for the analysis. 39 UDVs provide a range of possible
recreation values based on activity type, general or specialized recreation. Analysts used the lowest value
available for general recreation ($3.90) to produce conservative estimates. Table 22 provides results of the
high value method by park feature.
Table 22. Stormwater Park High Annual Recreation Benefit
Park Feature Expected Useful Life (Years) Annual Recreation Benefit
Playground 10 $14,240
Basketball 25 $35,590
Sidewalks 50 $71,180
Green Open Space 100 $142,350
Total 185 $263,350
4.1.1.2.3 Medium Value Method
Analysts found the medium recreation benefit value by averaging the results of the low and high value
methods (Table 23).
Table 23. Stormwater Park Medium Annual Recreation Benefit
Park Feature Low Benefit Value High Benefit Value Medium Benefit Value
Playground $1,510 $14,240 $7,870
Basketball $1,190 $35,590 $18,390
Sidewalks $820 $71,180 $36,000
Green Open Space
$4,950 $142,350 $73,650
Total $8,470 $263,350 $135,910
38 United States Army Corps of Engineers. 2016. Economic Guidance Memorandum, 16-03 Unit Day Values for Recreation for Fiscal Year 2016. Located at: http://planning.usace.army.mil/toolbox/library/EGMs/EGM16-03.pdf 39 Fannie Mae. Instructions for Performing A Multifamily Property Conditions Assessment. Appendix F. Estimated Useful Life Tables. Located at: https://www.fanniemae.com/content/guide_form/4099f.pdf

Resilient Bridgeport, Benefit Cost Analysis Methodology Report
arcadis.com Resilient Bridgeport 4-5
4.1.1.3 Assumptions
• The results of previously conducted studies are applicable to the project area. The FEMA annual
recreation value relies on studies that are limited in scope, but FEMA considers these studies
applicable nationwide. This approach does not consider location-specific factors known to impact
the results of recreation studies, such as population density, age, and income distribution.40
4.1.2 Aesthetic Benefits
The RBD project will integrate concepts of green infrastructure into the Johnson Street Extension; thoughtful
“green street” design coupled with the new stormwater park will create a more appealing project area to
existing and future residents. This attention to aesthetic detail may create a positive effect for residential
property and the local economy. One measurable example of an aesthetic benefit that can contribute to
this positive effect is attractive views and willingness to pay for these views. The benefits of increased
aesthetic amenities, including attractive views, may be quantified through hedonic pricing demonstrated in
the housing market, and on a standard value-per-square foot basis.
4.1.2.1 Data Sources
• FEMA’s Final Sustainability Benefits Methodology Report (2012): provides an aesthetic value
per acre of space. Refer to Appendix F: Additional Benefit Cost Analysis Resources for a
summary of FEMA’s standard values.
• United States Department of Agriculture (USDA) Northeast Community Tree Guide: Benefits,
Costs, and Strategic Planting (2007): provides annual aesthetic value per tree.
• RBD Project Design Drawings: provide the total area of park features and total number of new
trees.
4.1.2.2 Approach
FEMA’s Final Sustainability Benefits Methodology Report uses the benefit transfer methodology41 to
convert results of hedonic pricing studies to a nationwide annual aesthetic value per acre. Analysts
normalized this value to 2016 dollars and converted it to square feet; this value is $0.04 per square foot
annually. Analysts apply this value to the total area of the new multiuse stormwater park to value aesthetic
benefits. Table 24 summarizes aesthics benefits by project element and feature.
Table 24. Summary of Aesthetic Benefits by Project Element
Project Element Feature Square Feet Annual Aesthetic Benefit
Stormwater Park
Playground
11,613 $470
Basketball
9,152 $370
Sidewalks
6,334 $250
40 Brander, L.M. and M.J. Koetse. 2011. The Value of Urban Open Space: Meta-analyses of contingent valuation and hedonic pricing results. Journal of Environmental Management. 92 (2011) 2763-2773. October 41 The benefit transfer method applies the results of previously conducted primary studies to another geography.

Resilient Bridgeport, Benefit Cost Analysis Methodology Report
arcadis.com Resilient Bridgeport 4-6
Project Element Feature Square Feet Annual Aesthetic Benefit
Paving
26,645 $1,070
Green Open Space
38,069
$1,520
Shrubs
2,740 $110
Johnson Street Extension
Shrubs
4,720 $190
Bio-retention
9,372 $380
Sidewalks
9,334 $370
Paving
10,286 $410
Total 128,265 $5,130
New trees may also increase the aesthetic quality of the surrounding area. The U.S. Forest Service’s
Northeast Community Tree Guide (2007) provides an annual asethetic value per public tree ($32.84).
Analysts normalized this value to 2016 dollars ($38.44), and applied it to the total number of added trees
to generate annual benefits. Table 25 summarizes the annual aesthetic benefit of new trees.
Table 25. Annual Aesthetic Benefits of New Trees
Project Element Number of Trees Annual Aesthetic Benefit
Stormwater Park 81 $3,110
Johnson Street Extension
66 $2,540
Total 147 $5,650
4.1.2.3 Assumptions
• Analysts assumed that the results of previously conducted studies, used by FEMA to determine
standard values, are transferable to the project area. FEMA values are based on studies FEMA
considers to be applicable nationwide. Research indicates that higher population density results in
a considerable increase in the value of urban parks and open space.42 The analysis does not
capture increased value in urban areas due to the use of FEMA standard figures.
• The Northeast Community Tree Guide provides values for small, medium, and large tree. Analysts
assumed that the added trees are fully developed medium-sized trees; therefore, the benefits
calculated pertain to medium trees.
• The USDA’s Northeast Community Tree Guide accounts for tree morbidity over time (33.95
percent); therefore, it is not included as a separate function in the calculation.
42 Brander, L.M. and M.J. Koetse. 2011. The Value of Urban Open Space: Meta-analyses of contingent valuation and hedonic pricing results. Journal of Environmental Management. 92 (2011) 2763-2773. October

Resilient Bridgeport, Benefit Cost Analysis Methodology Report
arcadis.com Resilient Bridgeport 4-7
4.2 Environmental Benefits The RBD project proposes to add new natural vegetation that will produce a range of environmental
benefits, also known as ecosystem goods and services. Ecosystem goods and services provided by natural
vegetation may be quantified to estimate their economic benefit to society. Such benefits can be
categorized through measures such as carbon sequestration, air pollutant reduction, energy savings,
increase in water quality, and pollination. The RBD also implements stormwater management measures
that will reduce water treatment needs and environmental impact of CSO events. Environmental benefits
are grouped into two categories based on valuation methods: those associated with the ecosystem goods
and services and those associated with reduction CSO events.
4.2.1 Ecosystem Goods and Services
Natural capital is the world’s stock of natural assets, such as
soil, air, water, and all living things that provide a good or
service that benefits society. For example, natural capital, such
as forests and soils, provide the ecosystem service of filtering
water independent of treatment plants.
Ecosystem services are grouped into four broad categories:43
• Provisioning services: produce physical materials
that society uses such as minerals, gases, and living
things;
• Regulating services: create and maintain a healthy
environment such as climate stability and flood
protection;
• Supporting services: maintain conditions for life such
as habitat and genetic diversity; and,
• Cultural services: provide meaningful human
interaction with nature including spiritual, recreational,
aesthetic, educational, and scientific uses. Sections
3.1.1 Recreation Benefits and 3.1.2 Aesthetic
Benefits describe the methods used to evaluate these
benefits.
4.2.1.1 Data Sources
• FEMA’s Final Sustainability Benefits Methodology Report (2012): provides an annual
ecosystem service value per acre of green space. Refer to Appendix F: Additional Benefit Cost
Analysis Resources for a summary of FEMA’s standard values.
• United States Department of Agriculture (USDA) Northeast Community Tree Guide: Benefits,
Costs, and Strategic Planting (2007): provides annual environmental benefit values per tree.
• RBD Project Design Drawings: provide the total area of green space and number of new trees.
43 Earth Economics. 2015. Earth Economics Ecosystem Valuation Toolkit. [Web page] Located at: http://esvaluation.org/ecosystem-services/
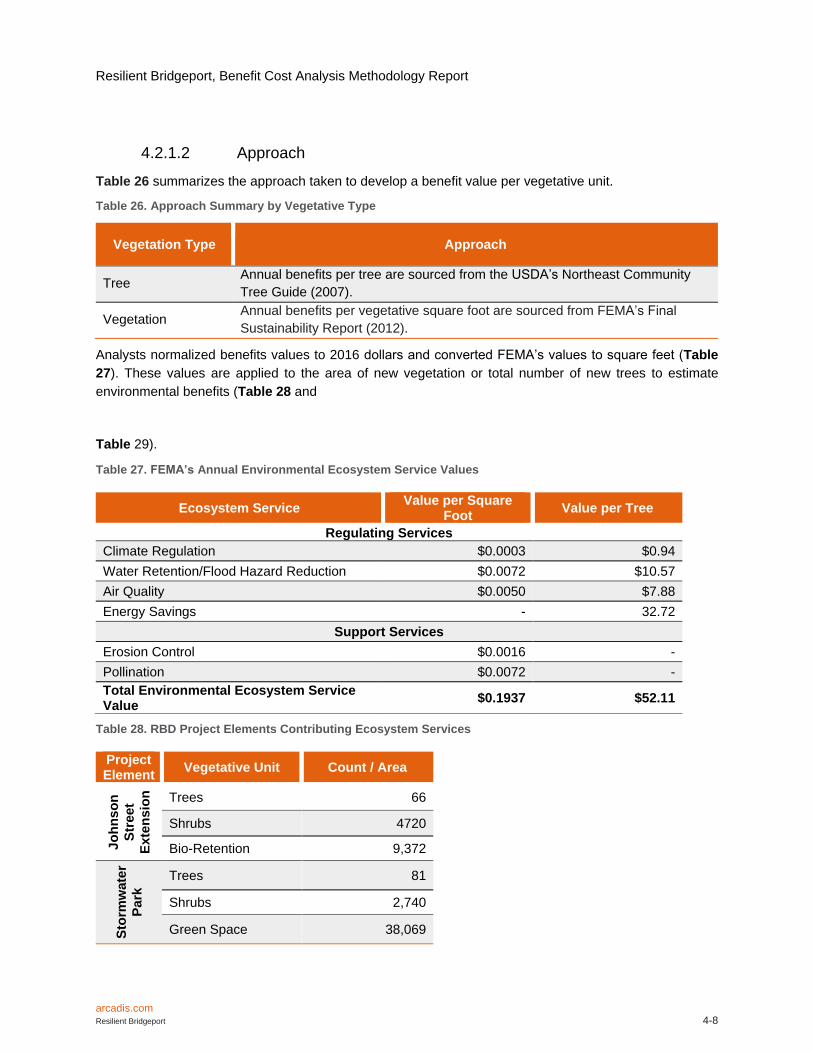
Resilient Bridgeport, Benefit Cost Analysis Methodology Report
arcadis.com Resilient Bridgeport 4-8
4.2.1.2 Approach
Table 26 summarizes the approach taken to develop a benefit value per vegetative unit.
Table 26. Approach Summary by Vegetative Type
Vegetation Type Approach
Tree Annual benefits per tree are sourced from the USDA’s Northeast Community
Tree Guide (2007).
Vegetation Annual benefits per vegetative square foot are sourced from FEMA’s Final
Sustainability Report (2012).
Analysts normalized benefits values to 2016 dollars and converted FEMA’s values to square feet (Table
27). These values are applied to the area of new vegetation or total number of new trees to estimate
environmental benefits (Table 28 and
Table 29).
Table 27. FEMA’s Annual Environmental Ecosystem Service Values
Ecosystem Service Value per Square
Foot Value per Tree
Regulating Services
Climate Regulation $0.0003 $0.94
Water Retention/Flood Hazard Reduction $0.0072 $10.57
Air Quality $0.0050 $7.88
Energy Savings - 32.72
Support Services
Erosion Control $0.0016 -
Pollination $0.0072 -
Total Environmental Ecosystem Service Value
$0.1937 $52.11
Table 28. RBD Project Elements Contributing Ecosystem Services
Project Element
Vegetative Unit Count / Area
Jo
hn
so
n
Str
eet
Ex
ten
sio
n
Trees 66
Shrubs 4720
Bio-Retention 9,372
Sto
rmw
ate
r
Pa
rk
Trees 81
Shrubs 2,740
Green Space 38,069

Resilient Bridgeport, Benefit Cost Analysis Methodology Report
arcadis.com Resilient Bridgeport 4-9
Table 29. Annual Ecosystem Service Benefits provided by the RBD Project
Ecosystem Service
Johnson Street Extension Stormwater Park
Total Street Trees
Shrubs Bio-
Retention Trees Shrubs
Green Space
Climate Regulation $62 $2 $3 $76 $1 $12 $160
Water Retention/Flood Hazard Reduction
$698 $34 $68 $856 $20 $275 $1,950
Air Quality $520 $24 $47 $638 $14 $192 $1,440
Erosion Control - $8 $15 - $4 $61 $90
Pollination - $34 $67 - $20 $272 $390
Energy Savings $2,160 - - $2,650 - - $4,810
Total $3,439 $101 $200 $4,221 $58 $813 $8,830
4.2.1.3 Assumptions
• The Northeast Community Tree Guide provides values for small, medium, and large tree. Analysts
assumed that the added trees are fully developed medium-sized trees; therefore, the benefits
calculated pertain to medium trees.
• The USDA’s Northeast Community Tree Guide accounts for tree morbidity over time (33.95
percent); therefore, it is not included as a separate function in the calculation.
• The results of previously conducted studies are applicable to the project area. FEMA values are
based on studies FEMA considers to be applicable nationwide.
4.2.2 Combined Sewer Overflow Reduction
A significant added benefit of the RBD project is the ability to retain stormwater. The City of Bridgeport
currently uses a combined sewer system. When rain events occur, the City’s sewer system can become
overwhelmed and untreated wastewater can spill into nearby waterways as a relief mechanism to avoid
damaging property or treatment plants; this is commonly referred to as a CSO event. The RBD project
proposes to implement a stormwater management features that will capture flow, preventing it from entering
the combined sewer system and contributing to CSO events. This water quality benefit is not captured in
ecosystems services benefits, therefore requiring a separate analysis.
4.2.2.1 Data Sources
• Bridgeport Long Term Control Plan: provided information needed to derive a damage cost.
• RBD Project Modeling: provided total CSO reduction volume.
4.2.2.2 Approach
CSOs have a major impact on water quality and pose significant health and safety risks. Bridgeport is acting
to meet water quality requirements under the Clean Water Act. The City has developed a Long-Term
Control Plan to reduce the frequency of CSO events. The Plan reveals it will cost the City $384,900,000

Resilient Bridgeport, Benefit Cost Analysis Methodology Report
arcadis.com Resilient Bridgeport 4-10
over 30 years to reduce CSO output by 43 million gallons. Given this information, analysts generated a
damage cost for CSO abatement: $0.29 per gallon per year. Analysts modeled CSO reduction at the RBD
design event (25-year Natural Resources Conservation Service [NRCS] rainfall event), and applied the
damage cost to the total volume of CSO reduction to estimate water quality benefits (Table 30).
Table 30. Annual Water Quality Benefits
25 Year NRCS event Volume (gallons)
Annual Water Quality Benefit
Volume Reduction in CSOs at Outfall 620,000 $3,300
4.2.2.3 Assumptions
• The assessment accounts for runoff that will be retained by the stormwater park and green street’s
bio-retention features, as well as additional system capacity to manage flow.
4.3 Economic Revitalization The resilient redevelopment of Marina Village includes added commercial space that will generate
economic revitalization benefits. These benefits can be measured through anticipated added economic
output and employment compensation. Output is the value of industry production, and employment
compensation includes wages and benefits for employees.
4.3.1 Data Sources
• FEMA’s Hazus-MH 3.2: provides a method to estimate economic losses and gains and provides
national output and employment compensation values per square foot.
4.3.2 Approach
Phase I of Marine Village redevelopment includes 10,000 square feet of new commercial space. Analysts
normalized Hazus’ output per square foot per day and employment compensation per square foot per day,
and used the equation below calculate the economic benefits of added commercial space. Table 31
summarizes annual economic revitalization benefits.
𝐴𝑑𝑑𝑒𝑑 𝑂𝑢𝑡𝑝𝑢𝑡 𝑝𝑒𝑟 𝑌𝑒𝑎𝑟
= 𝐴𝑑𝑑𝑒𝑑 𝐴𝑛𝑛𝑢𝑎𝑙 𝑂𝑢𝑡𝑝𝑢𝑡 𝑜𝑟 𝐸𝑚𝑝𝑙𝑜𝑦𝑚𝑒𝑛𝑡 𝐶𝑜𝑚𝑝𝑒𝑛𝑠𝑎𝑡𝑖𝑜𝑛 𝑝𝑒𝑟 𝑆𝑞𝑢𝑎𝑟𝑒 𝐹𝑜𝑜𝑡
× 𝐴𝑑𝑑𝑒𝑑 𝑆𝑝𝑎𝑐𝑒 (𝑆𝐹)
Table 31. Economic Revitalization Benefits
Marina Village Phase 1 Annual Economic
Output
Commercial (square feet) 10,000 $5,400

Resilient Bridgeport, Benefit Cost Analysis Methodology Report
arcadis.com Resilient Bridgeport 5-11
4.3.3 Assumptions
• The analysis does not account for inflation over time, nor does it consider business turnover,
vacancy rates, and changes in future land use for the analysis area.
• Analysts assume revitalization efforts will be successful
5 SENSITIVITY ANALYSIS The relationship between BCA inputs and outputs requires certain assumptions. To ensure the BCA
captures and describes uncertainty related to inputs and outputs, analysts performed a sensitivity analysis.
By evaluating a variety of different model inputs, BCA analysts could identify the most appropriate values
for use in the analysis and understand how assumptions impact BCA results, and thereby any decisions
that may be based on BCA findings. This section provides an understanding of how a change in an
uncertain variable will impact the present value of project benefits or costs, and the resulting BCR.
5.1 Analysis Uncertainties, Assumptions, and Limitations Analysts estimated low, medium, and high benefits when more than one Federal method or value was
available to evaluate a project benefit, or when uncertainties result in an alternative assumption in
methodology or the use of a different methodology. This BCA report illustrates the range of benefits as low,
medium, and high benefit scenarios for the pilot project’s recreation and direct physical damage benefits
and provides an indication of the differing variables or approaches for these benefits. Analysts limited low,
medium-, and high- benefit scenarios to varying Federally approved BCA methods or values; this BCA does
not explore the use of values or methods that are not accepted by Federal agencies. Table 32 presents
variable approaches explored during analysis.
Table 32. Summary of Uncertain Variables and Alternative Approaches
Benefit Variable Approaches Solution
Direct
Physical
Benefits
The BRV and CRV can have a significant impact on
the monetary value of property loss. Analysts
generated low-, medium-, and high- replacement
values using 2016 RS Means Square Foot Costs to
understand how the replacement value may impact
BCA results.
Low Estimate: Economy BRV per square
foot: $110.10
Medium Estimate: Average BRV per
square foot: $130.34
High Estimate: Custom BRV per square
foot: $169.74
Recreation
Benefits
Analysts can calculate recreational benefits using
different methods, such as willingness to pay values
related to a specific recreation activity or a value per
square foot of recreation space.
Low Estimate: FEMA value per square
foot
Medium Estimate: Average of low and
high estimate
High Estimate: USACE Unit Day Values
5.2 Discount Rates The discount rate captures social “opportunity costs” (the maximum worth of an input feature as assessed
among practical alternative uses), and provides an interpretation of the present value of expected annual

Resilient Bridgeport, Benefit Cost Analysis Methodology Report
arcadis.com Resilient Bridgeport 5-2
benefits and costs. In other words, the discount rate attempts to measure the present value of future benefit,
and always assumes that future benefit is of lower value than present benefit.
OMB Circular A-94: Guidelines and Discount Rates for Benefit-Cost Analysis of Federal Programs requires
a discount rate of 7 percent. The Federal government last updated this discount rate in the OMB Circular
A-94 in 1992. Sources of literature, such as the article Discount Rate published by the Association of State
Floodplain Managers, emphasize the uncertainty surrounding discount rates. It can also be useful to
analyze discount rates used by other federal agencies. The Government Accountability Office (GAO) is a
congressional agency that determines its own discount rate policy. The GAO uses the yield of United States
Treasury debt with a maturity of the duration of the Project.44 Appendix C of OMB Circular A-94 (Revised
in January of 2015), states that the 30-year interest rate is 1.4 percent.45 Furthermore it states that,
“Programs with durations longer than 30 years may use the 30-year interest rate in calculating the discount
rate.”
To analyze the potential impact of assumptions surrounding discount rates, analysts compared the present
value of project benefits and costs using two different discount rates recommended by OMB Circular A-94
(7 percent) and HUD Notice: CPD-16-06 (3 percent). Table 33 summarizes the range of benefits individually
using both discount rates, as well as the BCR for each benefit scenario.
Table 33. Summary of Benefit Range and Present Value
Benefit Bound Estimated Annual
Benefit Present Value of Benefits BCR
Discount Rate: 7 Percent
Direct Physical Damages
Low $673,630 $8,667,050 1.32
Medium $720,690 $9,272,460 1.57
High $817,070 $10,512,500 1.91
Recreation
Low $8,470 $119,240 1.32
Medium $135,910 $1,910,160 1.57
High $263,350 $3,701,080 1.91
Discount Rate: 3 Percent
Direct Physical Damages
Low $673,630 $16,678,350 2.16
Medium $720,690 $17,843,370 2.64
High $817,070 $20,229,640 3.24
Recreation
Low $8,470 $247,030 2.16
Medium $135,910 $3,292,180 2.64
High $263,350 $7,611,340 3.24
44 Page 4. Located at: http://www.floods.org/PDF/WhitePaper/ASFPM_Discount_%20Rate_Whitepaper_0508.pdf 45 Web page. Located at: https://www.whitehouse.gov/sites/default/files/omb/memoranda/2015/m-15-05.pdf

Resilient Bridgeport, Benefit Cost Analysis Methodology Report
arcadis.com Resilient Bridgeport 6-1
6 DOUBLE COUNTING
Duplication of benefits, or “double-counting,” may occur when two projects or methodologies of similar
purpose have overlapping benefits. Analysts identified and removed double counting from the evaluation
to maintain its integrity. Benefits may duplicate because:
1. Benefits calculated in the analysis may duplicate each other if there is overlap in the underlying
values used to quantify losses avoided or value added.
2. Bridgeport has implemented or plans to implement a project in the same area with overlapping
benefits.
Table 34 identifies potential double counting along with a description of how analysts managed or removed
these duplications.
Table 34. Summary of Double-Counting Approach
Benefit Potential Duplication Resolution of Duplication
Resiliency Benefits
Road Service
and Casualties
The primary objective of dry egress is to provide
residents with a means to evacuate before and after a
flood event. There are two benefits associated with dry
egress: continuity of road service, valued through lost
time, and avoided casualties, valued using the FAA’s
WTP for life and injuries. In theory, residents that
choose to evacuate would not be exposed to the risk of
injury or loss of life. Similarly, residents that choose to
shelter in place do not benefit from avoided time lost.
Therefore, analysts must take care to identify the
appropriate population for each analysis.
Analysts used local evacuation rates
to address potential overlapping
benefits: casualties were estimated
for the population not expected to
evacuate, and continuity of road
service was estimated for the
population expected to evacuate
before a storm event.
Relocation
Relocation costs may be a double-counting with shelter
needs. The relocation approach assumes that all
displaced individuals will require alternative living
quarters, thus capturing the costs of individuals that
may opt or need to go to a shelter.
The BCR does not include costs
associated the shelter needs to avoid
any possible duplication. Instead, the
BCA reports provides estimated
population expecting to require public
shelter in the case of an event for the
benefit of the reader.
Social Benefits
Recreation
In the future, Bridgeport may implement projects that
improve the quality of Seaside Park. Such
improvements may impact park visitation and may
duplicate recreation benefits for different park sites.
The BCA calculates recreation
benefits by unit of stormwater park
elements to ensure that the benefits
calculated are specific to RBD project
only.
Health
Surveys used to determine consumer surplus values for
recreation benefits may inherently include a health
benefit component. Thus, recreation consumer surplus
values may be duplicative with health benefits related to
recreation.
The BCA report describes health
benefits of recreation space in a
quantitative manner, but analysts did
not calculate monetary values to be
included in the benefit-cost ratio to
avoid any risk of double-counting
benefits.
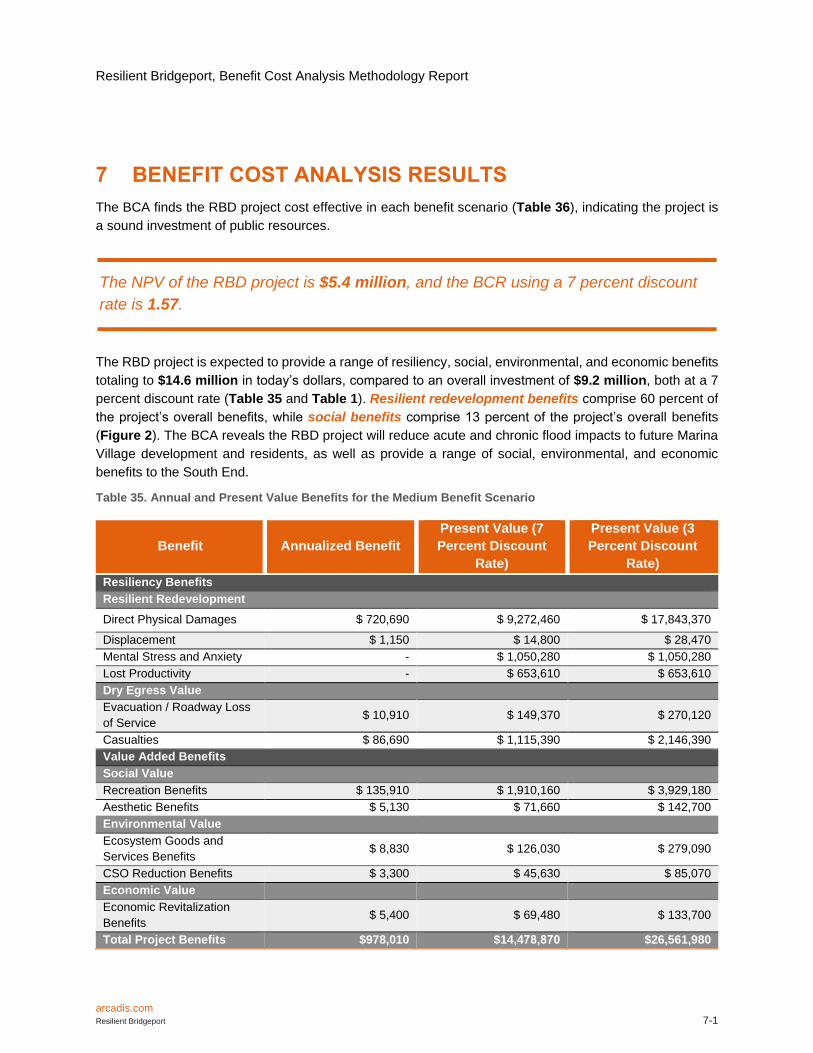
Resilient Bridgeport, Benefit Cost Analysis Methodology Report
arcadis.com Resilient Bridgeport 7-1
7 BENEFIT COST ANALYSIS RESULTS
The BCA finds the RBD project cost effective in each benefit scenario (Table 36), indicating the project is
a sound investment of public resources.
The RBD project is expected to provide a range of resiliency, social, environmental, and economic benefits
totaling to $14.6 million in today’s dollars, compared to an overall investment of $9.2 million, both at a 7
percent discount rate (Table 35 and Table 1). Resilient redevelopment benefits comprise 60 percent of
the project’s overall benefits, while social benefits comprise 13 percent of the project’s overall benefits
(Figure 2). The BCA reveals the RBD project will reduce acute and chronic flood impacts to future Marina
Village development and residents, as well as provide a range of social, environmental, and economic
benefits to the South End.
Table 35. Annual and Present Value Benefits for the Medium Benefit Scenario
Benefit Annualized Benefit
Present Value (7
Percent Discount
Rate)
Present Value (3
Percent Discount
Rate)
Resiliency Benefits
Resilient Redevelopment
Direct Physical Damages $ 720,690 $ 9,272,460 $ 17,843,370
Displacement $ 1,150 $ 14,800 $ 28,470
Mental Stress and Anxiety - $ 1,050,280 $ 1,050,280
Lost Productivity - $ 653,610 $ 653,610
Dry Egress Value
Evacuation / Roadway Loss
of Service $ 10,910 $ 149,370 $ 270,120
Casualties $ 86,690 $ 1,115,390 $ 2,146,390
Value Added Benefits
Social Value
Recreation Benefits $ 135,910 $ 1,910,160 $ 3,929,180
Aesthetic Benefits $ 5,130 $ 71,660 $ 142,700
Environmental Value
Ecosystem Goods and
Services Benefits $ 8,830 $ 126,030 $ 279,090
CSO Reduction Benefits $ 3,300 $ 45,630 $ 85,070
Economic Value
Economic Revitalization
Benefits $ 5,400 $ 69,480 $ 133,700
Total Project Benefits $978,010 $14,478,870 $26,561,980
The NPV of the RBD project is $5.4 million, and the BCR using a 7 percent discount
rate is 1.57.

Resilient Bridgeport, Benefit Cost Analysis Methodology Report
arcadis.com Resilient Bridgeport 7-2
Table 36. Benefit Cost Ratio by Benefit Scenario
Scenario Low Benefit Cost Ratio Medium Benefit Cost Ratio High Benefit Cost Ratio
7% Discount Rate
RBD Project 1.32 1.57 1.91
3% Discount Rate
RBD Project 2.16 2.64 3.24
Figure 2. Distribution of RBD Project Benefits, Medium Benefit Scenario
mfricke
Stamp
mfricke
Sticky Note
Accepted set by mfricke

Resilient Bridgeport, Benefit Cost Analysis Methodology Report
arcadis.com Resilient Bridgeport 7-3
Table 37. Annual and Present Value Benefits for the Low Benefit Scenario
Benefit Annualized Benefit
Present Value (7
Percent Discount
Rate)
Present Value (3
Percent Discount
Rate)
Resiliency Benefits
Resilient Redevelopment
Direct Physical Damages $ 673,630 $ 8,667,050 $16,678,350
Displacement $ 1,150 $ 14,800 $ 28,470
Mental Stress and Anxiety - $1,150,430 $1,150,430
Lost Productivity - $715,940 $715,940
Dry Egress Value
Evacuation / Roadway Loss
of Service $ 10,910 $ 149,370 $ 270,120
Casualties $ 86,690 $ 1,115,390 $ 2,146,390
Value Added Benefits
Social Value
Recreation Benefits $ 8,470 $ 119,240 $ 247,030
Aesthetic Benefits $ 5,130 $ 71,660 $ 142,700
Environmental Value
Ecosystem Goods and
Services Benefits $ 8,830 $ 126,030 $ 279,090
CSO Reduction Benefits $ 3,300 $ 45,630 $ 85,070
Economic Value
Economic Revitalization
Benefits $ 5,400 $ 69,480 $ 133,700
Total Project Benefits $803,510 $12,245,030 $21,877,300

Resilient Bridgeport, Benefit Cost Analysis Methodology Report
arcadis.com Resilient Bridgeport 7-4
Table 38. Annual and Present Value Benefits for the High Benefit Scenario
Benefit Annualized Benefit
Present Value (7
Percent Discount
Rate)
Present Value (3
Percent Discount
Rate)
Resiliency Benefits
Resilient Redevelopment
Direct Physical Damages $ 817,070 $ 10,512,500 $ 20,229,640
Displacement $ 1,150 $ 14,800 $ 28,470
Mental Stress and Anxiety - $1,150,430 $1,150,430
Lost Productivity - $715,940 $715,940
Dry Egress Value
Evacuation / Roadway Loss
of Service $ 10,910 $ 149,370 $ 270,120
Casualties $ 86,690 $ 1,115,390 $ 2,146,390
Value Added Benefits
Social Value
Recreation Benefits $ 263,350 $ 3,701,080 $ 7,611,340
Aesthetic Benefits $ 5,130 $ 71,660 $ 142,700
Environmental Value
Ecosystem Goods and
Services Benefits $ 8,830 $ 126,030 $ 279,090
CSO Reduction Benefits $ 3,300 $ 45,630 $ 85,070
Economic Value
Economic Revitalization
Benefits $ 5,400 $ 69,480 $ 133,700
Total Project Benefits $1,201,830 $17,672,320 $32,792,900

Resilient Bridgeport, Benefit Cost Analysis Methodology Report
arcadis.com Resilient Bridgeport 8-1
8 ECONOMIC IMPACT ANALYSIS In addition to the benefits of increased resiliency from reduced future disaster loss, project expenditures for
construction are expected to stimulate economic activity within Bridgeport and Fairfield County. This
economic impact evaluation is accessory to the RBD project; the intent is to evaluate the expected
economic benefits generated by project construction in the form of employment, labor income, value added,
and sales and revenues (output).
8.1 Project Description
The RBD project includes two main elements: the Johnson Street Extension and a multiuse stormwater
park. The Johnson Street Extension will provide dry egress and incorporate green infrastructure, such as
bioswales, to divert surface runoff from the combined sewer system and into the multifunctional stormwater
park. The 2.5 acre stormwater park will include terraced basins, underground storage features, community
gathering space, and recreational features. Flow from the stormwater park will be pumped via a new force
main to an existing outfall. Analysts used the cost estimates for the Johnson Street Extension and force
main to conduct the economic impact analysis (EIA); detailed cost estimates for the stormwater park were
not available at the time of analysis.
8.2 IMPLAN Software and Results
This methodology presents the approach used to model economic impacts for project expenditures.
Generally, analysts evaluate the cost of each proposed project element using IMPLAN modeling software
to determine the economic impacts that will result from the change in the local economy directly related to
project expenditures. IMPLAN software provides economic data and modeling to users for assessing the
economic impacts of project implementation in all industry sectors, with the intent of predicting how projects
or policies interact with and shape the economy. Analysts used IMPLAN Version 3.1 software, an input-
output system that uses a combination with social accounting matrices (SAMs) and economic multipliers to
estimate the result of changes or activities in an economic region. SAMs provide a complete picture of the
economy and generate multipliers to measure the impacts from one activity for a given sector throughout
the entire economy. Analysts used the 2015 Fairfield County Package for the economic impact analysis,
which includes the economic profile for each zip code. and Table 40 below describes the IMPLAN analysis
report outputs and types of relationships reported. Each result category presented in Table 39 is reported
in terms of relationships measured, displayed in Table 40.
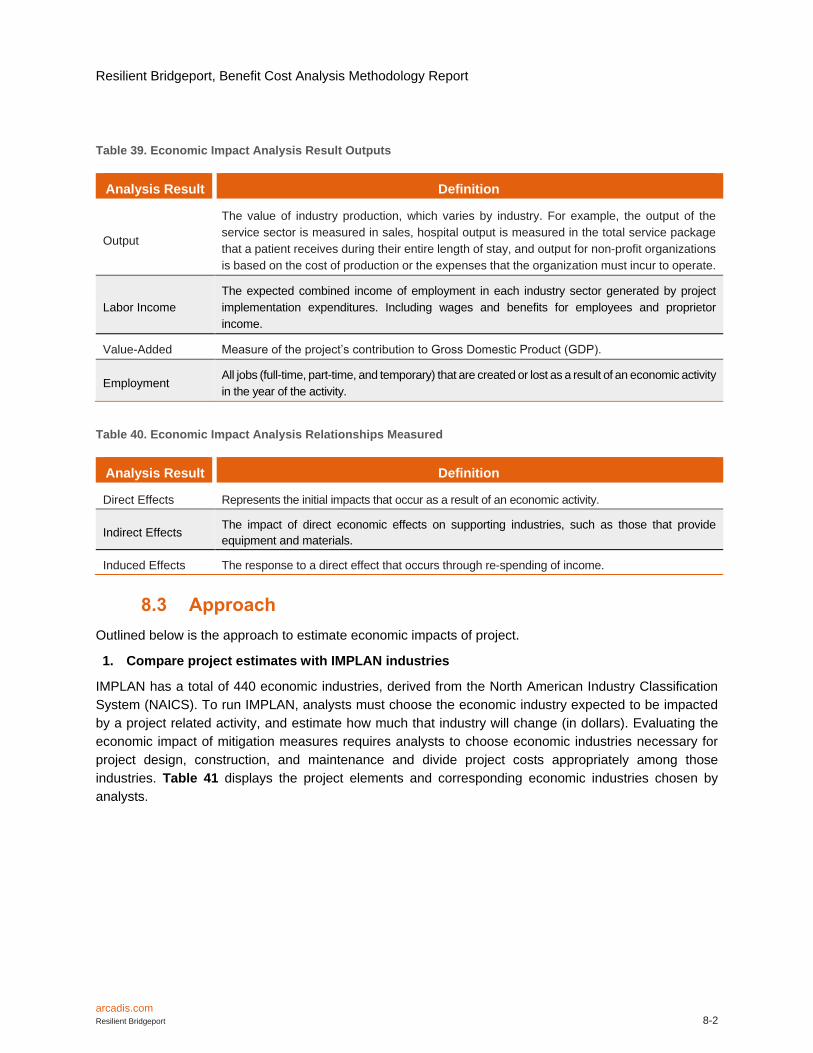
Resilient Bridgeport, Benefit Cost Analysis Methodology Report
arcadis.com Resilient Bridgeport 8-2
Table 39. Economic Impact Analysis Result Outputs
Analysis Result Definition
Output
The value of industry production, which varies by industry. For example, the output of the
service sector is measured in sales, hospital output is measured in the total service package
that a patient receives during their entire length of stay, and output for non-profit organizations
is based on the cost of production or the expenses that the organization must incur to operate.
Labor Income
The expected combined income of employment in each industry sector generated by project
implementation expenditures. Including wages and benefits for employees and proprietor
income.
Value-Added Measure of the project’s contribution to Gross Domestic Product (GDP).
Employment All jobs (full-time, part-time, and temporary) that are created or lost as a result of an economic activity
in the year of the activity.
Table 40. Economic Impact Analysis Relationships Measured
Analysis Result Definition
Direct Effects Represents the initial impacts that occur as a result of an economic activity.
Indirect Effects The impact of direct economic effects on supporting industries, such as those that provide
equipment and materials.
Induced Effects The response to a direct effect that occurs through re-spending of income.
8.3 Approach
Outlined below is the approach to estimate economic impacts of project.
1. Compare project estimates with IMPLAN industries
IMPLAN has a total of 440 economic industries, derived from the North American Industry Classification
System (NAICS). To run IMPLAN, analysts must choose the economic industry expected to be impacted
by a project related activity, and estimate how much that industry will change (in dollars). Evaluating the
economic impact of mitigation measures requires analysts to choose economic industries necessary for
project design, construction, and maintenance and divide project costs appropriately among those
industries. Table 41 displays the project elements and corresponding economic industries chosen by
analysts.

Resilient Bridgeport, Benefit Cost Analysis Methodology Report
arcadis.com Resilient Bridgeport 8-3
Table 41. Expenditures used in the Economic Impact Analysis
IMPLAN Industry Planning and
Design
Johnson
Street
Extension
24” RCP Force
Main Maintenance
30 Stone mining and quarrying $- $20,480 $- $- $-
31 Sand and gravel mining $- $- $11,040 $- $-
36 Other nonmetallic materials $- $45,080 $- $- $-
51 Water, sewage, and other
systems $- $126,400 $- $254,240 $-
58 Construction of other new
nonresidential structures $- $- $49,600 $- $-
62 Maintenance and repair
construction of nonresidential
structures
$- $42,960 $- $- $75,000
64 Maintenance and repair
construction of highways, streets,
and bridges
$- $94,520 $- $- $-
58 Construction of other new
nonresidential structures $- $116,880 $- $106,960 $-
157 Asphalt paving and
manufacturing $- $163,680 $- $- $-
208 Concrete pipe manufacturing $- $- $54,320 $226,800 $-
213 Cut stone and stone product
manufacturing $- $50,440 $- $- $-
326 Street lighting fixtures
manufacturing $- $64,680 $- $- $-
445 Commercial and industrial
machinery and equipment rental $- $276,560 $172,280 $- $-
449 Architectural, engineering,
and related services $1,100,000 $- $- $- $-
507 Commercial and industrial
machinery and equipment $- $35,560 $- $- $-
2. Populate IMPLAN model
Analysts created an IMPLAN model and populated the software with appropriate project costs listed in Step
1.
Resilient Bridgeport, Benefit Cost Analysis Methodology Report
arcadis.com Resilient Bridgeport 8-4
3. Review IMPLAN outputs
Analysts reviewed outputs generated from IMPLAN software for appropriateness. The IMPLAN analysis
software evaluates the relationships between employment, labor income, economic output, and value
added to GDP three ways: 1) direct impacts, which include industries directly related to mitigation activities;
2) indirect impacts, which include industries that support directly impacted industries; and 3) induced
impacts, or benefits created through employee spending.
8.4 Assumptions
Analysts made the below assumptions to run the IMPLAN model accurately.
• Project planning and design will take place from 2016 through 2018. The costs of planning and design are distributed across those three years as described in the project budget.
• Project expenditure inputs are assigned the year of activity completion, IMPLAN outputs are adjusted to 2017 dollars.
• Project construction will occur between 2018 and 2022. Analysts allocated the costs of project construction, including materials, labor, and equipment, equally across those four years to account for temporal differences in project expenditures.
• Analysts applied IMPLAN’s Local Purchase Percentage, calculated from the study area’s SAM, to all industry sectors. This assumes that a certain percentage of an industry will be purchased locally, discounting commodities or services that are imported from outside of the study area which therefore have no impact on the local economy.
The following caveats apply to the results of the economic impact analysis, and should be considered when
evaluating results:
• These results display the expected economic effect of the proposed project on the entirety of Fairfield County.
• The project is in the first stages of planning; the analysis must be considered as preliminary and can be refined as more project details are realized.
• Employment generated by analyzed project expenditures include all full-time, part time, and temporary positions.
• IMPLAN does not account for price elasticities or changes in consumer/industry behavior based on a direct effect, such as changes in spending patterns within sectors not related to project expenditures directly.
• The results presented are those that are associated with the years the project is implemented, and are not projected into the future.

Resilient Bridgeport, Benefit Cost Analysis Methodology Report
arcadis.com Resilient Bridgeport 8-5
8.5 Results
Analysis results indicate that the Johnson Street Extension and force main, will result in:
The top three industries expected to be impacted by project implementation include the construction
industry, the engineering and architectural services industry, and the water system industry. As a
whole, the project is expected to generate $3.7 million in industry production, creating $2.4 million in
value added (GDP) for Fairfield County.
Figure 3 below offers the results of the economic impact analysis, organized by project activity. These
results are presented in percentages to show the contributions that each makes to the whole impact.
Figure 3. Economic Impact Results by Activity, Presented as Percentages
$- $200,000 $400,000 $600,000 $800,000 $1,000,000 $1,200,000 $1,400,000 $1,600,000
Johnson Street Expansion
24" RCP
Force Main
Planning and Design
Value Added Labor Output Project Costs
• 10 JOBS DIRECTLY RELATED TO THE ACTIVITIES LISTED IN THE APPROACH.
• 4 JOBS CREATED IN SUPPORTING INDUSTRIES.
• 5 JOBS CREATED THROUGH EMPLOYEE SPENDING.
• 19 JOBS CREATED TOTAL, WITH $1.8 MILLION IN LABOR INCOME (THIS INCLUDES
EMPLOYEE WAGES AND BENEFITS AND PROPRIETOR INCOME).