
BENEFIT ANALYSIS OF CAD/CAM / DESIGN/COMPUTER-AIDED ... · i-v.4 0naval postgraduate school...
90
,D-Ri38 398 METHODOLOGY FOR BENEFIT ANALYSIS OF CAD/CAM / (COMPUTER-HIDED DESIGN/COMPUTER-AIDED MANUFACTURING) IN USN SHIPYARDS(U) NAVAL POSTGRADUATE SCHOOL MONTEREY CR UNCLASSIFIED R B RALMAN MAR 84 F/G 9/2 N EhmhohhomhoiE EhhhhEmhhhhhhE EhhhhhmhhhhhhI EhhhhhhhhhhhhE EhhhhhmhohhhhE EhhhhhhhhmhhhE
Transcript of BENEFIT ANALYSIS OF CAD/CAM / DESIGN/COMPUTER-AIDED ... · i-v.4 0naval postgraduate school...

,D-Ri38 398 METHODOLOGY FOR BENEFIT ANALYSIS OF CAD/CAM /(COMPUTER-HIDED DESIGN/COMPUTER-AIDED MANUFACTURING) INUSN SHIPYARDS(U) NAVAL POSTGRADUATE SCHOOL MONTEREY CR
UNCLASSIFIED R B RALMAN MAR 84 F/G 9/2 N
EhmhohhomhoiEEhhhhEmhhhhhhEEhhhhhmhhhhhhIEhhhhhhhhhhhhEEhhhhhmhohhhhEEhhhhhhhhmhhhE

VI
.-
111 IIII122-na
6.25 1.64 11.6
MICROCOPY RESOLUTION TEST CHARTNATIONAL BUREAU OF STANDARDS- I963-A
* % %

I-
V.4
0NAVAL POSTGRADUATE SCHOOLMonterey, California
DT I~" t •
EB3 1984
THESISMETHODOLOGY FOR BENEFIT ANALYSIS
OF CAD/CAM IN USN SHIPYARDS
by
Richard B. Grahlman
March 1984
Thesis Advisor: R. Kevin Wood
6 LQApproved for public release; distribution unlimited
! 84. 02 03 057

SECURITY CLMUIPI11CAYIO11 OF TIMIS PAGE eWA Dma XWOVe.
REPOT DCUMNTATON AGEBEFORE COMPLETING FORMXIVNPONT NUM41EN11 L2 GOVT ACCESSION06 NO: 7. RECIPIENT S CATALOG NUMWER
14. ?ITLE (mat ieieIs S. TYPE OF REPORT & PERIOD COVERED
Methodology for Benefit Analysis of CAD/CAM Mastrch 1984 i
in UM Sipyads. PERFORMIANG ORG. REPORT NUM8ER
7- AUHOW11111 4. CONTRACT OR GRANT NUNGER(s)
9. PERORM 1 AIIIIATI@N HNOMI AND ADDRESS 10. PROGRAM ELEMENT. PROJECT, TASK
Naval Postgraduate School AE OKUI UIR
Monterey, California 93943
11. CONTROLLING OVIVICES NAME AND ADDRESS 12. REPORT DATE
Naval Postgraduate School March 1984Monterey, California 93943 13. HUNGER OF PAGES
86I.. MONSTORING AGENCY NAWE A A35f2Rs11=1 &ieank Cm&f.d Office) 15. SECURITY CLASS. (of this repet)
a0CLASSI lC ATIOWi DOWNGRADING
SC17 EDULE
1gC RISYNIJIN STATEMENT (o #uis Rhpeet
Approved for public release; distribution unlimited
17. DISTRSUYION STATEMENT (of Meo aawe mmwdl ea In . It Af.., 4ome Ospst)
4 ~I& SUPftlEMTARY NOTES
* ~Is. iday '0065I" ( mbu - un aMd VI *..eeam Ot IdmIp or week Ru,)
Computer-Aided Design/Computer-Aided Manufacturing; CAD/CAM;Comtputer-Integrated Design, Manufacture, and Maintenance; CIDMM; Tangibleand intangible benefit analysis; History of CAD/CAM in shipbuilding.
IS. AISTRAC? (C&Whw n 169w" old" ## w"uaap - Id"'eI~y bF W-ek inA.)
) ;This thesis expands the concept of Computer-Aided Design/Computer-AidedManufacturing (CAD/CAM) in naval shipbuilding to include maintenance.This inclusion is coupled with the integration of the design andmanufacturing processes in the acronym CIDMM, which stands forIComputer-Integrated Design, Manufacture and Maintenance.
S/N 0102- LP. 014.66401 SECURITY CLASSIFICATION Of THIS PAGE (Ohm. DWa 11MIa,..

.um.'v CLAS, ICATOW OF THIS PA49 (Gm Do m
A methodology is proposed to identify and measure the tangible andintangible benefits derived from CAD/CAM in naval shipbuilding. Themethodology is flexible enough to be applied to future CIDW systems.A decision-aid for assessing the intangible benefits and a structure forcomputing the time benefits are proposed in the methodology.
Bt
A. /
IgECURil CLASIFPICATION OF THIS PA64tuhft 810e bOrnE
2SNOAO2.LP.
..6,.
- :-
amI!i I il il ii t , ~l ml :' m ' T <t -I"" 5%f' '-''PY''':'"Z'

Approved for public releast; distribution unlimited.
methodlogyfor Benefit Analysisof CD/CI inUSE Shipyards
by
Richard B. GrahimanLieutenant Commander, United States Navy
B.S., Oregon State Univarsity, 1976
Submitted in partial fulfillment of therequirements for the degree of
nASzER or SCIENCE 11 OPERATIONS RESEARCH
from the
NAVAL POSTGRADUATE SCHOOL
Narch 1984
Author:
approved by:_
Thesis Advisor
Second Reader
Chairma * rtaent of Operations Research
Dean of Inf ormatio y sciences
3

&BSTRICT
This thesis expands the concept of Computer-lided
Design/Computer-kided manufacturing (CAD/CAM) in naval ship-
building to include maintenance. This inclusion is coupled
with the integraticn of the design and manufacturing
processes in the acronym CIDSM, which stands for
Computer-Integrated Designt anufacture and Maintenance.
A methodology is proposed to identify and measure the
tangible and intangible benefits derived from CAD/CAM in
naval shipbuilding. The methodology is flexible enouqh to
be applied to future CIDKH systems. A decision-aid for
assessing the intangible benefits and a structure for
computing the time benefits are proposed in the methodology.
',
4
"-a, ° --- /-°o' ' 0.' '2. o ,' ' .'"""'., ..... . .. - .- . . .
.4L
TABLE OF CONTENTS
I, INTRODUCTION . . . . , . . . . . . . . . . 10
A. PRODUCTIVITY IN THE U.S. . . . . . . . . . * o 10
B. PRODUCTIVITY IN U.S. NAVAL SHIPBUILDING . . . 11
C. CURRENT TECHNOLOGY & SHIPBUILDING o . . . 14
D. U.S. NAVAL SHIPYARDS & CURRENT TECHNOLOGY . . 14
II. A BRI. HISTORY OF CID/CAN ........ . . . . 17
A. BACKGROUND ... .... . o . o o 17
B. THE FIRST GENERATION OF CAD/CAR . . . . . . . 17
C. THE SECOND GENERATION OF CAD/CAB o . . . . . . 19
D. THE THIRD GENERATION OF CAD/CAB o . o . . . . 20
III. CIDER* THE NEXT GENERATION . ..... . . a 23
A. INYEGRATICl OF DESIGNe MANUFACTURING AND
MAINTENANCE . . . . . . . . . . . . . . . . . . . 23
B. SHIPBUILDINGv CID65r AND THE FUTURE . . . . . 28
IV. DISCUSSION OF EXISTING BENEFIT METHODOLOGIES . . . 30
A. OVERVIEW . . . . . . . . . . . . . . . . . . . 30
B. EXISTING BENEFIT ANALYSIS METHODOLOGIES . . . 31
1. Chasen's Method (as applied by Lonq
Beach M.S.) . . . . . . . o . o . . . . . 31
2. Shah G Yans Method . . . . . . . . . . . 34
3. CARDOS Productivity measurement method . . 36
4. Packer and Kahn's method . . . ... . . . 39
A. G MOTIVISION TO . . . . . . . . . . . . . . . . 48
B. TANGIBLE BENEFIT QUANTIFICATION . . . . 511. Quality •58
5, .. :

-7 - V-7~ r. IM * ( - T.~. . ' J.
2. Flezibility . . . . . . . . . . ..... 659
3. Accuracy . . . . . . . . . . . . . .. .. 59
4. Transferability . .. . . . . . a . . . . 59
5. Atomization . . . . . . . . . . . . . . . 60
6. Simulation . . . . . . . . . . . . . . . . 60
C. INTANGIBLE BENEFIT ANALYSIS . .. . . . . . . 64
1. Rethinking of Design, methods . . . . . . 65
2. more Efficient work Scheduling . . . . . . 66
3. Technical Publication Changes . . . . . . 67
4. Improved Accuracy in Fabrication . . . . . 68
S. Refine and Improve Work methods . . . . . 69
6. Communication/Cohesiveness.. ...... 70
7. Engineering Data-base for Life-Cycle
management . . . . . . . .*. . . . . . . . 71
8. Quality of Engineering Personnel . . . . . 71
D. OTHER BENEFITS . . ... . . .... . .. . 72
1. Reduced aterial astes ,......72
2. anpoer/Workload Fluctuations . ..... 73
3. Paper Elimination . . . . . . . . . . . . 73
4.. The Cutting Edge of Technology . • o . . . 74
Eo SU ARY . 6 o 6 . . . * . . . .. . .. 75
VI. FORML BBTHODCLOGT . . . . . . . . . . 76
A OVERVIEW . . e . . e. . . . . . . . . . . . . 76
B. TANGIBLE ENEFIT ANALYSIS USING THE
GENERIC FRANZORK . . . . . . . . . . 76
1. Data Collection . . . . . ... . . . . 76
2. Analysis . . . .... . . . . . 79
C. INTANGIBLE BENEFIT ANALYSIS .. . . . . 81
1. Data Cllection and Analysis ....... 81
D. "OTHERM BENEFIT ANALYSIS . . . . . . .. ... 81
1. Data Collection and Analysis . . . . . . . 81
E. SUMARY 6 . . . .6 . . . . 82
6
" * "e" - a- * .*: ** %"*'' ;, ,** "a'4". -""' ". -" "-"- -- """---"• ".-" "--- - -.- "- - • . .. • -I .. .. i -,, ,, ," , o$_'; .,. .'. ; , ,a. . " " . ,' ,. * ,_-,,.',. ,.. .. ., ".,'. ..

LIST OP RIPEBUCEU . .. . *.. ...... .@ . . 84
INITIAL DISTRIBUTION LIST .... ... . 86
'~? 7
L1ST OF TABLES
1. Proposed Five-Year Naval Shipbuilding Plan . . . . 131U. Variables in Order of Their greatest Cluster
Loading . e .. • . . . . . . . ... . . . . . . 42
III. Relevant Benefits of CAD/CA . . . . . . . . . .50IV. Relevant Benefits of The Status Quo . . . . . . . 51
8
8

LIST Of FIGURES
1.1 Typical Interim CAD/CAM System Configuration. . 16
2.1 The First Generation . . . . ....... .. 18
2.2 The Second Generation . . . . . . . ...... 20
2.3 The ?hird Generation . . . . . . . . .. . . . . 21
3.1 Manual Approach . . . . . . .. . . . . . . . . 25
3.2 CIDU Approach . . . ..... . . . ...... 264.1 Perceptual Map . . . . .. . . ...... 43
4.2 Perceptual Cifferences . . . . ... 4.5. 54.3 System Comparison . . . ..... . . . ..... 46
5.1 Tine Flow fcr Generating an Elementary
Design . . . a . a . . . . * e . . . . . .. . 52
5.2 Time Required to Program One Tool Detail . . . . 53
5.3 Sample Data Reduction Scheme . . . . . . . . . . 56
5.4 Data Reduction ith Subsets Included . . . . . . 636.1 Computervision Learning Curve . . . . . . . . . 78
6.2 Methodology Flowchart . . . . ........ 83
9

, - -- . . .. - i .
' -- -- . - , .-.- ,.. . - , . .- ,
x. UTI1 DUg2101L
This thesis presents a methodology to analyze the
benefits derived from present Computer-Aided
Design/Computer-aided Manufacturing (CAD/CAM) Systems or
from future Computer Integrated Design, Manufacture and
Maintenance (CIDN) Systems. It was developed in response
to a requirement to document the actual benefits derived
from the Interim CAD/CAM Systems being used at the eight
U.S. naval shipyards. The methodology provides a vehicle to
measure the tangible benefits such as time, material and
manpower savings and thu intangible benefits such as
quality, worker satisfactton and readiness. The underlying
motivaticn for examining this technology is the interest inimproving productivity where possible. We will begin by
examining productivity in the United States.
A. PRODUCTIVITY I THE U.S.
Productivity and productivity measurement are topics of
great concern in the U.S. today. Former Deputy Secretary of
Defense, Paul W. Thayer, states: (Ref. 1: pp. 3]
" Improving productivity is one of the most formidablechallenges facing America and the Defense Departaenttodaa. It affects our economic vell-being and curnatifial secur ty, After a rude awakening in the interna-tional *arketp Mae. we can no longer be complacent aboutth continued produttive sueri ity of the United States.o ai our technological leadershp is challenged across a;road range of processes and prodlcts. legdars
America still has the most highly skilled and talentedwork force in the world and we maintan the highest levelof out Ut per worker of anl,.contry in the world. Butrecent y tboee has been a isturbing decline in the rateof PTOuctivi ty glowth. The Department of Defense has a$ peg lal interest inre versing that trend, particularly asit affects develoging and b uiding omplex sophisticated* weapon systems to eet national security object ves.
10
'Ib ~l
'.4.i& ..,Ir'r, .' -, -. -*% - _'.: C

With expanding commitments but lnited resources theDefense Department must improve productIvily to sustain astrong deterrent force and maintain a h gh degree ofreadiness."
Clearly, improving prcductivity in DOD is important. On. of
the areas hardest hit by this productivity decline, and an
area with substantial impact on sustaining a "strong deter-
rent force" and maintaining a "high degree of readiness" is
shipbuilding and repair. It is estimated that "productivity
in the best Japanese and Scandinavian yards is of the order
of 100 percent better than in good U.S. or U.K. shipyards"
[Ref. 2]. Although this statement refers to merchant and
not naval construction, a 2:1 edge in productivity is idi-
cative cf the U.S. shipyards lack of use of the
state-of-the-art technology.
B. PRODUCTIIT! I U.S. NAVAL SHIPBUILDING
Examining U.S. naval shipbuilding and repair cannot
really be done separately from general shipbuilding and
repair as the two are closely related. "I low level of Navy
orders in the past was normally offset by a high level ofcommercial crders and vice versa" (aef. 3: pp. 12]. The
currect economic climate and foreign competition has reducedcommercial crders to a point where naval ship construction
and repair will predominate for some time. This predomi-
nance creates productivity problems for the shipbuilders who
have to shift to a very different type of construction.
*While the fundamental naval architecture and marine engi-nearing principles are the same, the complexity of design
and construction of naval ships is significantly greater
both frcm a technical and administrative viewpoint.
A Naval Ship is a totally integrated weapon system where
space, weight and survivability are carefully balanced
factors. a commercial ship, on the other hand, has large
11
I g " .' " " '' , " .* ." ." .................
volumes of space, small crews, and generally simpler equip-
sent. Administratively the Navy requires much more exten-sive contracts, work monitoring and customer approval than
do commercial buyers. This means that Navy Ships are much
more expensive and time-consuming to build than commercial
craft.
The existence of government-owned shipyards further
compounds the problem of having to build ships for the Navy
which are more expensive and time-consuming. while
government-cwned shipyards deal only with repair, they draw
supplies, equipment and personnel from the same sources as
the private yards. The competition for rescurces between
the government- owned shipyards and the private yards,.increases the cost of naval construction.
The decline in the shipbuilding industry that iscurrently being felt has caused skilled workers to seek
employment in other fields. There has also been a decline* in the industrial support base of vendors who provide ship-
builders with systems and components. These systems andcomponents account for more than 50% of a Naval vessel'scost, and in many cases are currently coming from a singlesource. In this case the lack of competition from suppliersof critical components increases the cost of naval
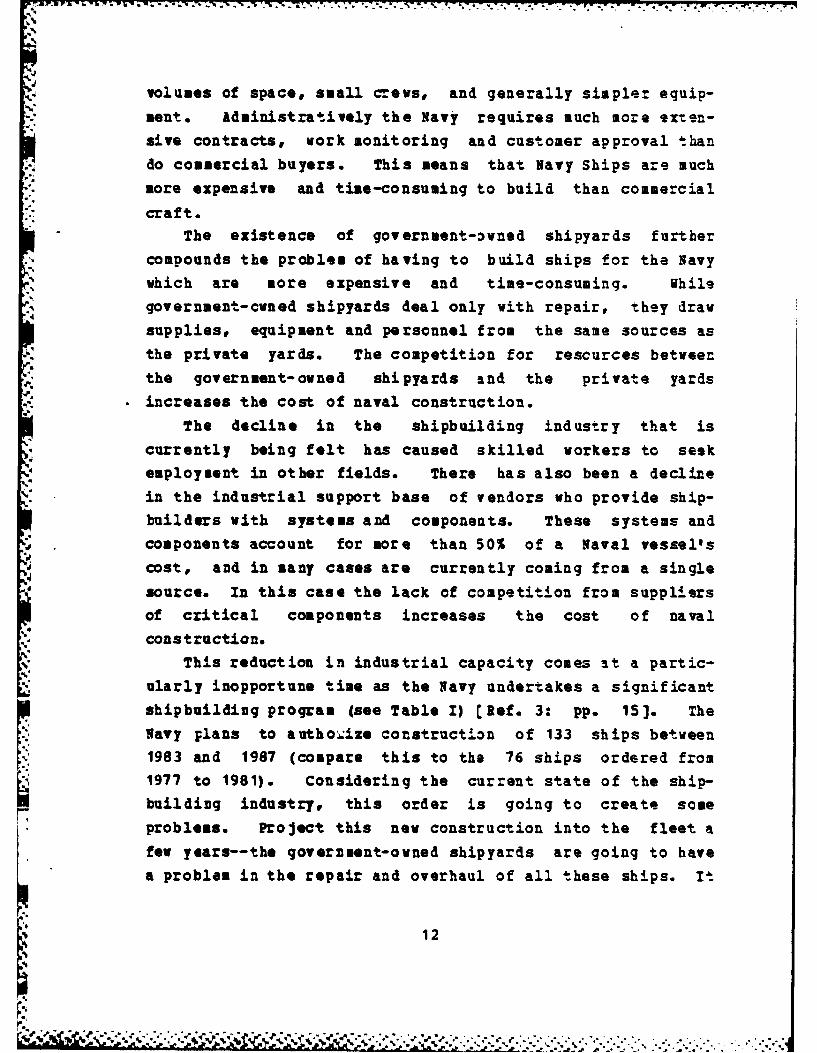
construction.This reduction in industrial capacity comes at a partic-
ularly inopportune time as the Navy undertakes a significantshipbuilding program (see Table I) [Ref. 3: pp. 15]. TheNavy Flans to autho .ize construction of 133 ships between1983 and 1987 (compare this to the 76 ships ordered from1977 to 1981). Considering the current state of the ship-building industry, this order is going to create some
problems. Project this new construction into the fleet afew years--the government-owned shipyards are going to havea problem in the repair and overhaul of all these ships. It
12
,a.
F:: - . .. .- . .

TIBLE I
Proposed Five-Tear Naval Shipbuilding Plan
EW CONSTRUCTIOI NUBER PERCENT-. 6
iAu1.u&c =.q~ 37Trident Fleet Ballistic Missile Submarine 6Nuctlear Alrcrart Carri or (CV) 2Nuclear t*ack Submarine (SSN-688) 17Guided iss3 s Cruiser (C -47) 17Guided Misi Dst ye (DGX) 4Nuclear Guded 51ss 11 Cru ser (CGN-42) 1Destroyer (DD-963) 3
Total 50
Landill Shin Dock (LSD-'411 8Auph 1ious saut Shi HLD-) 2G1 dod Missile Friqate 1FFG-7 12ne. Countermeasures Sh :p 3) 1Coastal Mine S veeper Ship (MS-1) 2Destroyer Tender JAD)-2Ileet Oiler TAO) 18Ocean Surveillance Ship (GOS)6Am ntio Shi (AR) 4Ca :e La yng a depair Shi ; (TARC)Salva S hip (IRS) 2Past om at Support Ship (AOE) 2
Total 83Conv ersion/LIca st ic€ asRe a itFinti.
Aircaft Carrier (CV Slep 3Battleship (BBL (React) 3Ocean Survey Sa jTAGSj (Cony n) 2Range Instr .entDtion Si p (T.) (oav| 1Bospital Ship (TAX) (C) IA 2Fast Logistics support Ship A4T!)R1PBS Resupply Ship (TAK) (rBi) (C) I
Total 16
Report on the St s hbuldi and Ship RepairIn.dstry of the United Stat. gashgton D.C.Tal 1-6.
13
. x .?.. :. ;;. ; ;. . . ;. : ;.:. -:-.':-,'"".,:",..".V. - . ..... ..-..-- ". ...-.

"7 - .- 77,-7 74' 777; -
was these types of problems that caused the industry to
begin locking for cheaper, faster and less labor-intensivs
ways to build high-quality ships. the technology that seems
to offer the most potential to do those things is CAD/CAM.
c. CURRENT TECHNOLOGY S SEIPBUILDING
CAD/CAM is not new to the shipyards. The next chapter
will detail its history, but as a preview relevant to this
discussion, CAD/CAM has been in the shipyards about 10years. U.S. shipyard use of CAD/CAM in the mid-seventies
consisted primarily cf automated two-dimensional drafting
- and numerical control (NC) of machining operations.
Unfortunately today, ten years later, CAD/CAM use in theshipyards is still at about that same level. The projectmanager for an extensive survey of CAD/CAM development inshipbuilding states "at the present stage of CAD/CAM devel-
opment in shipbuilding, computerization tends to be waste-fully fragmented. The design department might have a CADsystem, production a system for analysis, and manufacturing
,".)me NC equipment. Nobody's talking to anybody else, thecompute: systems don't interact, whereas they could really
benefit from passing data back and forth via something likean IGES (International Graphics Exchaage System) translator"(Ref. 4: pp. 131. The commercial shipyards are behind in
their utilization of present CAD/CAM technology. However,the government-owned shipyards are even farther behind.
This will be discussed in the next section.
D. U.S. IVAL SHIPTYRDS & CURRENT rECHIOLOGY
The Naval shipyards have had CAN, comprised of numericalk- control equipment, for some time. However, only recently
* has any CAD capability become available. The Navy yards
were able to acquire the Computervision CADDS 4 Designer V
..
t14
-I A

CAD/CAR Systems with the stipulation that they (the ship-
yards) report the actual benefits derived from the system by
larch, 1984. This system is referred to as the Interim
CAD/CAR System. An example of a typical system configura-
tion is shown in Figure 1.1.
The requirement te document the actual benefits derived
from the system is part of the motivation behind this
thesis. Detailed discussion of the requirement and the
other motivations are in Chapter 4. Chapters 5 and 6 deal
with a methodology designed to identify and analyze the
benefits of CAD/CAM to the Navy. A major drawback to that
effort is the short period of tin& some of the shipyards
have had the systems and the predominant use of the systems
for design and drafting. Although cost-effective in those
areas alone, the system has capabilities for integrating CAD
and CAN which are currently not being used. The concept of
integrating design, manufacture and maintenance activities
from a ccmmon database will be explored in Chapter 3.
I
IU.
'i- 15
,,* % **9% *~**'t ' ," ;*> . '' '''<'1:4; '-: ':'" :-'-'A '.,o..,:, -"--'--...;.",..'.-'-:....V

'I I
CENTRAL PROCESSING COMPLEX
~I- IIDi
Unit
'4' 14'
WONTTO Diiie
0 Figure 1.1 Typi~cal Interim C&D/cag syrstem Confilguration
~~16
%I'. -,''",' . , .',-.. .". ;.,, . , °,.. . , ,,,..', ,,-. ..... ,,' .. ,-,., ,',.,...,,,,, ,.....
)I
.4'gmi lm,& ' l l :" , , "' -" '

wz. A IzEr tz.TizgU ai £AN
A. BACKGROCiD
This chapter will provide a historical perspective off
CaD/CAN and computer technology, highlighting events perti-
nent to th. shipbuilding industry. This is not meant as an
exhaustive history of computer technology or of -AD/CAN. It
is intended as background for the reader, in order for him
or her to become familiar vith the concepts of the tech-
nology and its application in the shipyard environment. The
history is traced under six headings: 1) Computer tech-
nology, 2) Interactive computer graphics (IACG), 3)
Numerical control (NC), 4) Computer-aided design (CAD), 5)
Computer-aided lofting (CaL) and 6) Computer-aided
manufacturing (CA).
B. TBE FIRST G3BNRITIO OF CAD/CAB
In my opinion, the first generation of CAD/CAM begins in
1801 when the Frenchman Jacquard invented the first auto-
mated manufacturing system. The Jacquard Loon was a punched
card driven device that automatically controlled the weavingprocess. This was a forerunner 2f the numerical controlprocess using punched paper or mylar tapes.
In 1830 the first computer was invented by Babbage. TheI" term "computer" had not been coined and Babbage's calcu-
" lating machine was called an "analytical engine." Onehundred years later, the first analog computer was built by
Bush. The tempo increased in computer technology with the
first digital computer, Colossus I, built in 1943. Threeyears later, the University of Pennsylvania built ENIAC, and
five years after that, the UNIVAC I was built. In computer
17

Yew CouspiaW IACG NC CAD CAL CAMloot =2eq1a4d uto-
_ _ _ _ card.!_ _using paae
Anlytical
13i0 lus Ildsfirst sats$q
1143 COLOSSUS Ifirst digital
1940 JU. of Pon.
UNI Sl UtVAC Ilot Generation _______ _______ ______________
1,52 'Parson $ MIT
develop 3 axis
NIC usingpunched cards19' lS4 I•rroduction Itouto
of PC mahine of AScIItools in U.S.
l15 D0C installs Various ship. LWU Planning1ot PC flame yarde end System dsvel-burger in U.K. research groups oped for 90Cshipyard develop design
clculation
Figure 2.1 The First Generation
technology, this is the accepted beginning of the first
generation. I have tacked the beginning up to include the
Jacquard Loom because it is the beginning of programmed
manufacturing control. This generation is shown schemati-
cally in Figure 2.1 (lef. 5: pp. 14].
The first generation continued through the early 50's
with the large vacumn tube computers being used for
accounting tasks. This was the first introduction of
computers into the shipbuilding industry. By the aid 50's,
many shipyards in a number of countries were using computers
for "calculations for hydrostatics, stability curves and
capacities" [lef. 5: pp. 3]. The first change in
Frogrammed manufacturing since Jacquard came in 1952, when
18.
* .5-. , ' " ' ' '.-...- . , ' ' ' '.-- '. / .'.".. .' .' '.'-.. " '.-.,',.,, - -"-. . . .. ,..'. ,--""'

Parson and HIT developed a 3 axis numerical control machine
using punched cards. It would be two years before NCmachine tools were introduced in the Unit eed States.
Programming these machines was done manually in the basic
machine language. In 1959# a group of Scottish shipbuilders
formed the Clyde Shipbuilders Computer Group to develop
computer applications to shipbulding. This was the firstorganized effort in shipbuilding t3 utilize the burgeoning
technology.
This is where I mark the end of the first generation of
CAD/CAN. The second generation begins with the use of tran-sistors, which increased the computing power 10-fold.
C. TE SECOND GENERATIOI OP CAD/CAI
The second generation of CAD/CAll, in my opinion, is
coincident with the accepted second generation of compute=
technology and is marked by the replacement of vacumn tubes
with transistors, circa 19614. ith the increase in* computing power it would be only two years until Sutherland
developed "Sketchpad," the first interactive computergraphics system. During this period, the Norwegians devel-oped 3SSI and IBB completed ADAPT, both pioneering systems
in CAll.
The ensuing 6 years can generally be described by theexplosion of interactive computer graphics and a flurry ofactivity in the search for new applications. One such area
. was computer-aided drafting, and with drafting came
computer-aided design (in an interactive graphics sense).What should be apparent is the lack of continuity between
numerical control# CAD, and CAN development (see Figure 2.2)[Ref. 5: pp. 41. Each area was developing on its own. NC
proceeded to improve and be more widely used after the
creaticn in 1964 of APT, a higher level numerical control
19

A
Yew Computer We NC CAD CAL CAMESSI devel-
of 2nd Gas. aped incommters.Nl~y
transistorsr feplaee tubes _
1963 Sutherland IBM completes
DIGIGRAKIC
ON anI-noe
developmente __
11is Development Ism ALPU 11C flae burn- AWTOKONof 3rd Gen. Syetm with ewe ietall : intruced to*ers. 22S0 scope for Port V.11o.r intrnational
G H Syteam at Sound MS shipyrdetnograted sokhdt G rl8het. Steel
c its develop prtincrease progrming ZACGcomputing
___power by 100 ____ _ ______
1966 Lockhosd doeldes STEERSEAR comp.to develop its HIZAC eouplet
mown system
N97 C fteme VIING CORP.bender Instal-led in U.K.
_ ebhippyrd
f its I CASDOS comp. ASZRn eonp.,'."""IITOM ,. com= 1.p.
Figure 2.2 The Second Generation
language. Also, abcut that tine, another application was
found in the shipyards, the generation of NC data through
computer-aided lofting (CAL). CIL involves the automated
layout of plate patterns and the conversion of these layouts
to flame-cutter paths described numerically. The &UTOKON
system was the first CAL system and was introduced in 1965.
De TIN THIRD GENIATIOi OF CAD/CAN9 '
It is difficult to establish the exact timing of the
third generation in CAD/CAf. If we look at shipbuilding it
would appear to be around 1968 when two significant
computer-aided design systems were developed: one being
CISDOS, the other being FORAY (see Figure 2.3)
4i 20
"'I.+, ,.;..;. , .... . .. . - .. . - .. . -. .. +, . . . .. . . . . . - . . . . - . . . . . . . . .

"' 1C.V r . *F
- - IYW COMuts' IAC NC CAD CAL CAM I1919 Niai1oapatew 0OP018111U PC fI4Q bursar POWA aemp.
loped ffers ZAN installed at__________ system Aveedale
1972 t, meed ainoom 71
fo A- United statesNewor NOW ie . AUn1100
197l CADMA ne eeted M uam prehasesby 13 AUTO O fee US
14 77 BiV Installs i pyardsSOKC burnin W I
1971 CAON installed AUTOKON It utilising IAC, for part gen.- at Avondale and meeting.* of fered to Us3 licenscees
S1973 iror ocoput ee CAO and SPANS Interfacedeveloped empletd by Avoedale
191 CADW estalled 11TaN6 2 Implemnted in UK shLipyard usingat MAIM CADA" as ZACO system
,l ,.13 CADAN Installed HCO13A and SPAM3 interface completed at* at an TOO NO BestMe ,C tJ J e tIW 10 offered to worl wide ehipyarde
,--,
SFigure 2.3 The Third Generation
[Ref. 5: pp. 4]. The problem arises when one considers
that the automotive industry, specifically General motors,
had been secretly invclved in CID since 1959. As mentioned
earlier, the aircraft industry was also involved in CAD/CAMwith their development of both SCAUTO by McDonnel Douglasand CADAN by Lockheed during the late 50's and early 60's.CISDOS was the U.S. Navy's "Computer-kided Structural
Detailing of Ships" program. It was orginally intended to• bring together CAD and WC. It was stated that "the
successful culmimaticn of this project (CASDOS) will result
in a means for producing fully detailed vorking plans andnumerical control programs for the automatic flame cuttingof plates directly by computer using contract plans and
4. detailed specificaticns as starting input" (Ref. 5: pp. 6].Unfortunately, the project failed due to "the lack of an
21
as*Za..
a..- ' ,"* - " '" " e '" """ " "" " ' ' ' ' ""*" " " " ' "-" ' % " " " " " " " " % " "" -
'. J, _ 1_-1.. .-F *
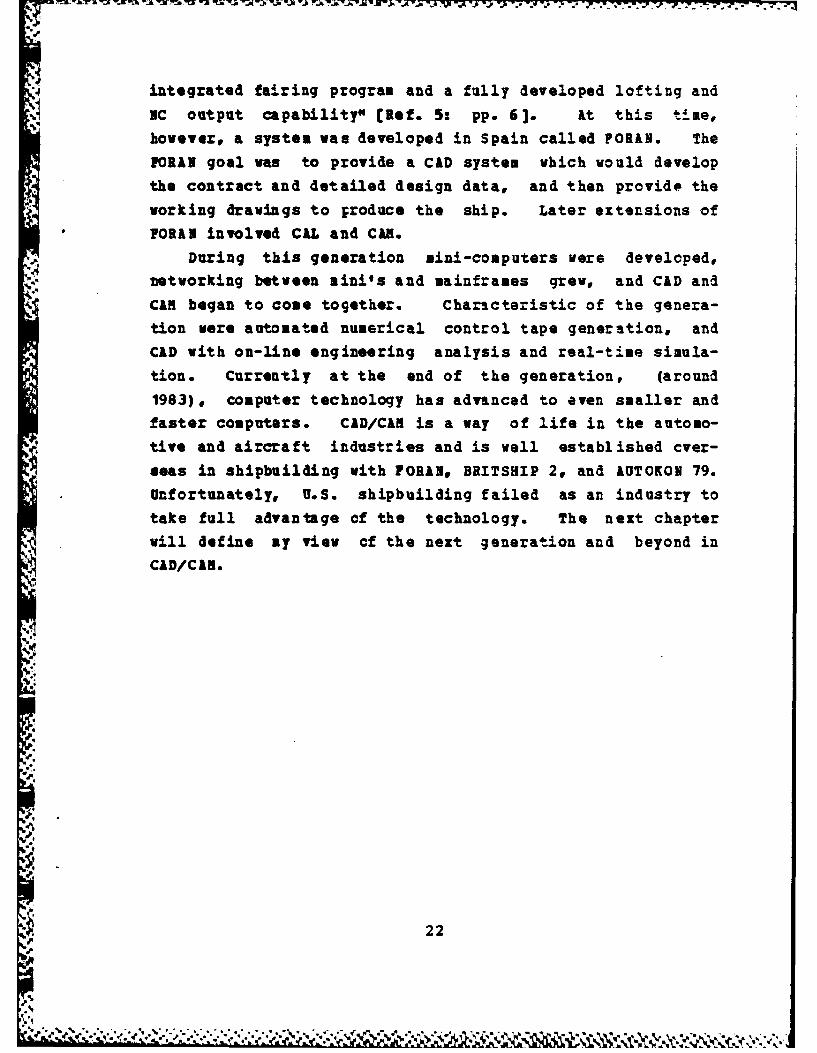
integrated fairing program and a fully developed lofting and
Vc output capability" [Ref. 5: pp. 6]. At this time,
however, a system was developed in Spain called ORkN. The
PORAN goal was to provide a CAD system which would develop
the contract and detailed design data, and then provide the
working drawings to produce the ship. Later extensions of
?ORIN involved CAL and CAN.
During this generation mini-computers were developed,
networking between mini's and mainframes grew, and CAD and
CAN began to come together. Characteristic of the genera-
tion were automated numerical control tape generation, and
CAD with on-line engineering analysis and real-time simula-tion. Currently at the end of the generation, (around1983), computer technology has advanced to even smaller andfaster computers. CAD/Ckf is a way of life in the automo-tive and aircraft industries and is well established ever-
seas in shipbuilding with lORANv BRITSHIP 2, and AUTOKON 79.
Unfortunately, U.S. shipbuilding failed as an industry to
take full advantage of the technology. The next chapterwill define my view cf the next generation and beyond in
CAD/Ci.
22
F4
Ill. CIN, ZrUI E?111L21
A. INTIGltAlTO OF DISXGIr MIIUTACTURIIG AiD MAINTENANCB
The next generation in CAD/CAB is beginning nov. The
significant difference between this and the previous genera-
tion is not due to hardware breakthroughs or new applica-
tions, but is due to an attitude change. The attitude that
is changing is the belief by those using the technology,
that only through total integration of CAD and CAR can the
real potential of the technology be realized. Previously
CAD and Can had been thought of as separate activities. A
number of terms have been coined describing this integrated
approach to design and manufacture. Computer-Aided
Engineering (CAE) and Advanced Integrated CAD/CAR are two
such terms.
I woulS like to go one step further in the conceptuali-
zation of what I think this generation holds for CAD/CA by
adding maintenance to the integrated design and manufac-
turing concept. The addition of maintenance considerations
in the process closes the loop between designer, sanufac-
turer and user. The term I have chosen to describe this
c concept is both simple and symbolic--CIDER; Computer
Integrated Design, Manufacture, and Maintenance. It is
symbolic in the removal of the "/" between CID and CAN, thus
emphatically stating there cannot be any barrier between
design and manufacture. The characteristics of CIDER will
be described in terms of the shipbuilding industry but
applicability to other industries should be easy to
extrapolate.
The first realization that must occur is that "we are no
longer preparing drawings, we are building the prototype in
23

%- .
the ccmputer" (Ref. 5: pp. 19]. This has, in my opinion,been the biggest stumbling block to the successful iaplemen-tation of CAD/CAN in the shipbuilding industry. CIDHM goes
one step farther and rather than building the prototype, ye
V are kuilding each individual ship in the computer. Adescription of what exactly is involved in CIDAN is in
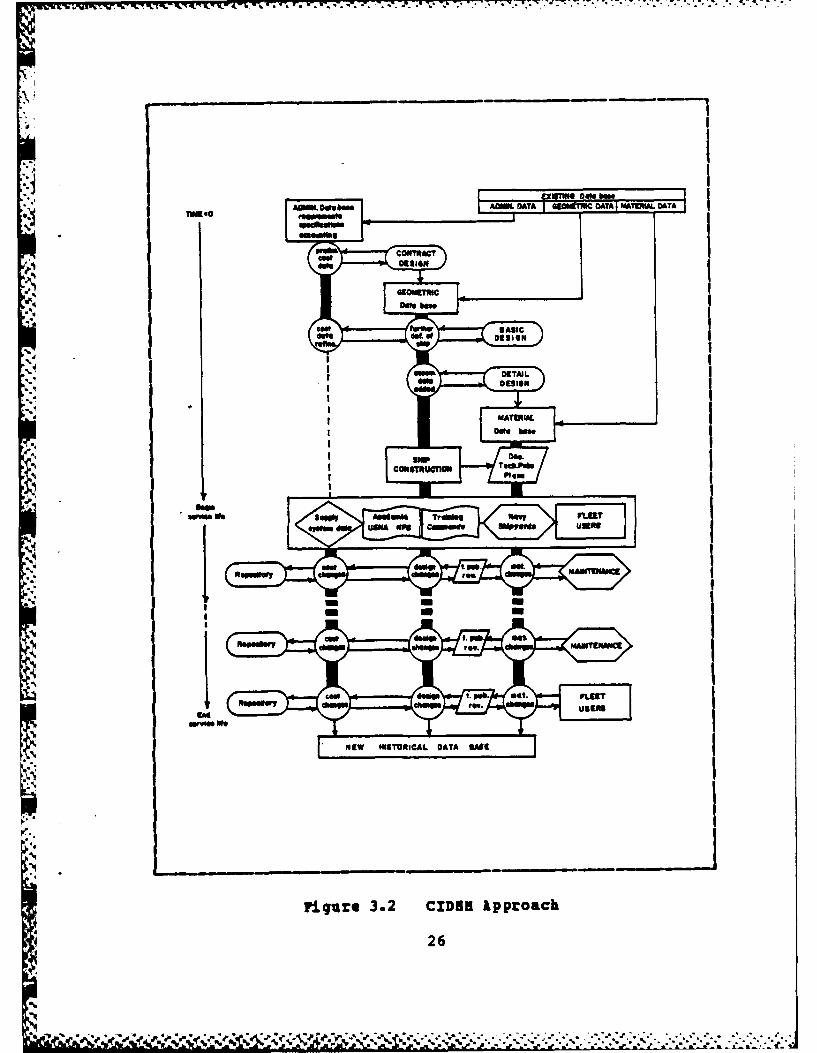
order. Figure 3.1 shows the present manual approach to the
creation and passing of the engineering and administrative
information. All the information is passed via a papermedium, which is bulky, hard to revise and typically out ofdate. The repositories handle the information via aperture
cards and microfilm on a system sinliar to one the Air
Force has labled "archaic" (Ref. 6]. Figure 3.2 shows thecreation and passing of the engineering and administrativeinformation via three digital data bases. These digitaldata bases allow almost real-time transfer of information
providing disseminaticn of the most up-to-date informationLVand rapid feedback from the fleet user. Incorporating
changes to or transfering information from a digitized database is simple and fast. There is no need to redraw draw-ings everytime a change is made or a drawing is transferred.
There is no need to wait years for changes to be incorpo-
rated in the technical documentation. There is no need forthe repositories to keep millions of aperture cards, each
representing I or 2 drawings on file. A single 10 inch
video disk can hold approximately 6000 E size (36" x 48")
drawings at a cost of about S3.00.Future miniaturization in laser disk technology will
provide the seaman on the ship with the ability to take aI small video disk and player to the piece of machinery he isworking on and view his entire maintenance task, (including
troubleshooting, disassembly, repair and assembly) at the
maintenance site. In additional advantage to the video disk
medium is its ambivalence to electromagnetic interference.
24
. i. i. . % , .. '% ''.,V .' : V : -. ...... .*; . :. * .,... .. ... z . .. :. ... .

OESIGIACO~sO4 "SI 09314N
IfI
"a FLEET USER
SNPPIF"M De,.NEXM
% 25
Awv LwUMT0 L -
*~ ~~~o bg U1 anCLOIA5S
Igo _ _ _- _ -
do"u~ 3.ApIoCh41Deig
26AI
DESIG

This could be quite important in the various electromagnetic
fields found aboard naval vessels.This level of involvement of the user with the detailed
figures created by the designer is a fundamental improvementfrom today's technology. In between the user and thedesigner is the manufacturer. The existence of a commonengineering data base (the geometric data base and thematerial data base) allows the direct transfer of designdata to the manufacturer on the shop floor. Direct numer-
ical control (DNC) is a manufacturing technique currently inuse in the aerospace industry. Direct transfer eliminatesthe entire step of interpreting the drawings and programmingthe numerical control machine. Direct transfsr allows allthe pieces to be fabricated from the design, not variousintrepretations of it, resulting in a product that fitstogether better. In shipbuilding, the bringing of subassem-blies together is called zone construction. -Ships arebuilt in chunks around the yard. These modules are built
completely outfitted and ready for launch. When all isready they are brought together swiftly on the (ship)ways,;wldea into a complete ship and launched. Not only is time
on the ways greatly reduced, but construction is consider-ably simplified. Crews can get at their work more easily,
there is more space for manuvering equipment around theisolated modules, more bottlenecks are largely eliminatedand delays do not accumulate" [Ref. 4: pp. 14]. This wouldbe impossible if all the pieces to "the puzzle" were not
created from a common engineering data base. This construc-tion technique was pioneered by the Norwegians and has sincebeen successfully adopted by the Japanese. Both countriesare leaders in the use of CAD/CAM technology.
27
'f * J. 4( - s' . ? .. .... ...-..... .... ...... -- . . . . .

B. SHIPBUILDIUG. CIDHE AIND THE FUTURE
Sc far, this discussion has not been exceptionally futu-
ristic. lost of the concepts are implementable with today's
technology. With soze imagination one can envision complete
design and manufacturing systems built around a common data
base. A designer would sit in an easy chair (perhaps with a
head mounted cursor control mechanism) and select from a
menu the type of ship he wanted to design. Once selectionwas made, a generic ship of the type selected would appear.
.Through the designers inputs of size, speed, cost and other
parameters the system would develop the design automati-cally, much as group technology and generic part definitionis done today. The system should have the ability tointeract with the designer, capitalizing on the designer's
imagination, skill, and the systems ability to optimize or
automatically design. (This type of symbiotic man-machine
relationship has been a dream for many years. Advances in
artificial intelligence are making it closer to being a
reality, but, unfortunately, it is still a long way off.)
Once tte designer is satisfied with the design, acommand would generate the detailed information, partslists, cost estimaticn, and production schedule. Ancthercommand would transfer the design to an automated shipyardwhere intelligent robcts would select the raw materials andbegin machining the parts from the production schedule
previously generated. As the parts were produced they wouldbe automatically assembled. These assemblies and the compo-nents frcm subcontractors would be pieced together until the
final ship was complete.While the construction process was going on, the same
data would be used to program maintenance "manuals" in theform of video disks or some other medium. Automaticauthoring, a concept being explored today by the Navy, would
• . 28

provide the text, while the detail designs would provide the
"figures," figures in the sense of 3-dimensicnal colorgraphic images.
5' It appears in this shipyard of the future that the human
element has been removed. Although possible, this would be
a tremendous mistake. The human element should be removed
from the mundane, time-consuming, or dangerous tasks where a
robot could perform then better, and placed in those posi-
tions where humans will always be needed, positions that
require thought, judgement, and intuition.
The U.S. is a leader in computer technology. However,
the country has fallen behind in its industrial application
of that technology, especially in the shipbuilding industry.
The U.S. Navy as the predominant customer of U.S. ship-bulding is in a unique position to influence its direction
and growth. By pursuing the CIDKE concept, the Navy can not
only improve itself but can improve this country's produc-
-tivity and the technological edge that will guarantee the
lifestyle enjoyed in this country today.
V
IJ, 29
A..-

I-. D.9. .J -, ,.. M E *.9...9.
A. ROV VTIE
A historical background and futuristic projection of the
CIDSR technology has been presented in the previous chap-
ters. I hope the case has been made for the Navy becoming a
leader in this technology. accomplishing this will require
a very large investment in manpower and capital resources.
Part of this investment has already been made with the
procurement of the interim CAD equipment currently in place
at the eight Naval Shipyards. Along with the authorization
[e.f. 7: pp. 2] to begin investigating the technology as it
applies to the shipyards, was a requirement of the Naval Sea
Systems Ccamand to:"subait an evaluatiou.showing the actual observed prod uT-tiv ty increalo attributabl9 to CAD/ AN. This re;o twillserv o v ry the economT c analysis in the SDP and toprov do a basis for project ons for the long range plan."
This requirement, combined with the requirements of S.ECNAV
Instruction 7000.148 which calls for economic analysis on
major programs (part of which should consist of benefitanalysis) [Ref. 8], and the lack of existing benefit anal-
ysis methodologies in the field is the motivation for the
remainder of this thesis. Existing methodologies will be
discussed followed by the development of a new methodology,"the Grahlman methodology." The Grahlman methodology will
draw from the existing methodologies' strengths, be appli-
cable to Interim CAD/CAR Systems installed at the shipyards,
and, more importantly, will be extendable to the CIDERconcept discussed in the first portion of this thesis.
30
K,,%
. V d*

a. EXISTING BEIT AIALYSIS BETRODOLOGIES
Previous benefit analysis has been primarily limited to
CAD systems. Host of the methods currently published
attempt to quantify the tangible benefits, usually man-hour
savings, compare those (converted to dollar savings) to the
costs of the system, resulting in a sort of net gain assess-
ment. A negative net gain indicates a loss. The intangible
benefits, such as improvements in drawing quality or design
innovation, are given a cursory discussion and then ignored,resulting in a "worst case" type of analysis. Four methods
will be reviewed. Two deal with purely tangible benefitsand two attempt to measure CAD productivity wholely through
subjective analytical techniques.In reviewing another's work, it must be kept in mind
that the reviewer's erspective is considerably different
than that of the author. The reviewer also does not share
the luxury of detailed derivation to aid comprehension.
Generally he must extract the essence of a piece of work asit applies to his use, which seldom does the original work
-p
justice. With that caveat in mind, we will proceed.
Sylvan Chasen's methodology for determining "the
break-even point fcr interactive graphics cost savingsversus the cost of capital equipment and labor charges" was
used by the Long Beach Naval Shipyard to justify acquiringadditional CAD/CAM equipment (Ref. 9] under the Computer
Aided Engineering and Documentation System (CAEDOS) contractno. 00123-31-R-0156. The methodology was extracted from
Chasen's paper "Formulation of System Cost Effectiveness"[lef. 10: pp* 263]. This discussion will use the model aspresented in the paper.
31
' ..

The model is
C.R. = + Hl-H2 Rm+Rc (eqn 4. 1H3.Rm H3KRm H3 Rm
where
C.R.-Ccst reduction in dollars,HlNfan-hours for anyidefined task,, set of tasks, or
project pr icr to introduction of CAD/CAM,
f2-Nan-hours on the same basis as Hi except that theyare the hours unaffected by CAD/CAM. H2 is asubset of H1,
Un3-an-liours aent at the CAD/VAn console to producethe same am unt of work previously done in (Hl-H2)hours,
Rm-Average man-hour rate (console user) in dollars/hour,
Rc=Ccnsole rate in dollars/hour, and
Kaistimated dollar savlnas ittributable to the non-direct (intang ile) benefits.
Long Beach I.S. chose to use the model in a worst
case scenario by giving no credit to intangible benefits" (K). This approach has merit in that measuring or even
estimating the intangible benefits of CAD/CAM in terms ofman-hou- savings or dollar savings can be very difficult.
These benefits and their associated problems will be
discussed later. However, note that by giving no credit tothe Intangible benefits, i.e., setting K=O, an additive termis dropped from the equation, resulting in the most conser-vative estimate of savings. If the cost reduction (C.R.) isalso set to zero (the threshold level) (Ref. 10: pp. 268]
the only remaining terms are the productivity ratio (P.R.)defined by (91-H2]/H3 and the "maximum" productivity ratio
(Rax) defined by CRm+Rc]/Rm, which are equal at the break-
even point. This establishes a cost effectiveness criteria.
32
. . . . . .. . ... . . .. .. .
** , , ,:.. ., . " .. .. , ,¢ - ": " * ; "':. ." .. " ."".".". ... ".'." ". ". _ .J.- - &. - . A. P . .

For the CAD/CAM system to be cost effective P.R. must exceed
Baz*Significant in Chasen's discussion on productivity
e ef. 10: pp. 261] is his Hl-92 term that appears to be thefirst explicit correction of the common practice in CAD/CAMproductivity measurement of simply taking the difference inthe time required to do a task manually and the time
required to do the task with CAD/CAM. This direct compar-
ison of total task, set of tasks, or project times is in
error because it includes administritive time not influencedby CAD/CAM, which, if included in the difference calcula-tion, would result in erroneously lower productivity ratios.
Only two topics are not adequately addressed with
the method--the first being how the man-hours Hi and H2should be determined. Is I to be determined by historical
A records? Is it to be estimated? Is H2 measured, and if so,
how? Task analysis techniques exist which could accuratelydetermine these but are costly in terms of time and money.
The second topic not adequately discussed is the notion of
operator skill level on the system. Chasen admits the
productivity ratio (P.R.) "is dependent on such things asthe skill level and quality of work and the characteristicsof the CAD/CAN system" (Ref. 10: pp. 262]. Implicit arethe assumptions that all the operators are at 100 effi-
ciency, or that the man-hours spent at the console producethe same amount of work. The variable (H3) represents some
constant average of user skill levels, and is the same as
the skill level of those engaged in doing the task pricr toCAD/CAM. In the lcng run this may be true, but when cne
considers the normal technological life of most computersystems of about 8 yr. [Ref. 11: pp. C.2-5], this long-run
argument falls short.
33
)j ; ;'.;, - - . "...' -..C'. _.,g-.C ..%- .- * " , V -' -,'-... €" ."\pjm~ . ' _. ".". ." .% .% ". _% .. % % % •
.% :.- . . , .. : . . -% - -. . .. P,- - h...o., , . . :, . . ., . , *,.: . .-. ,.. .. . . .
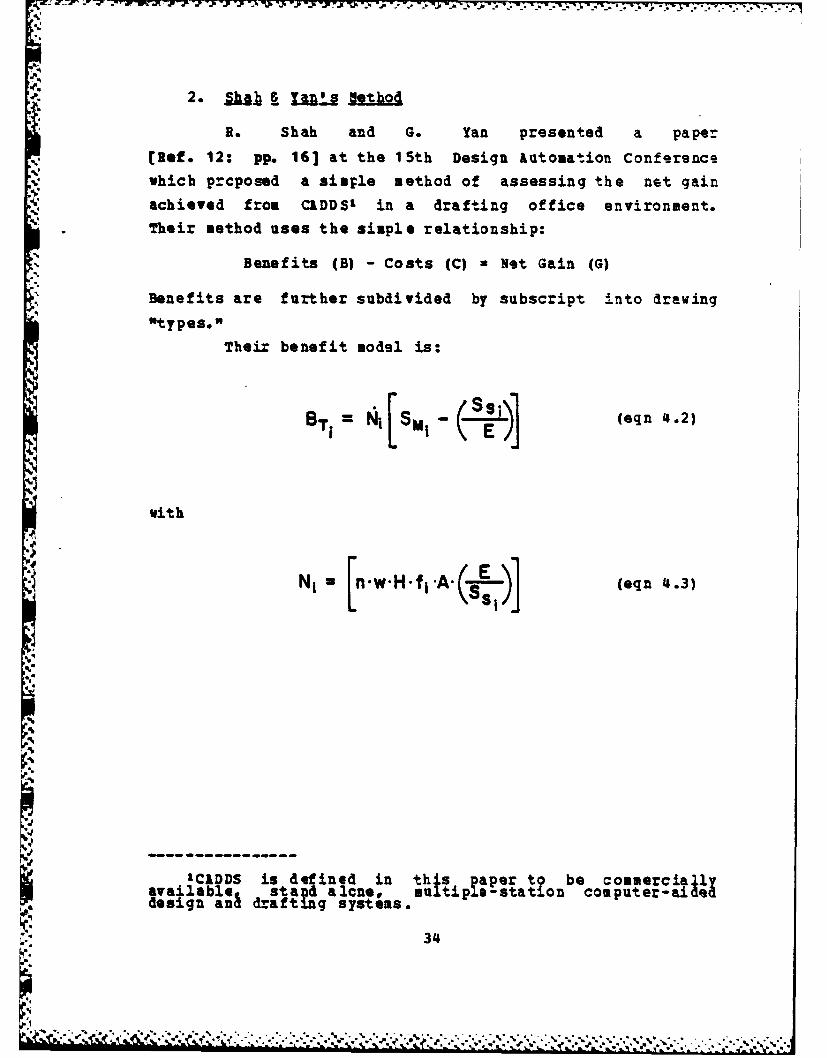
R. Shah and G. Yan presented a paper
[Ref. 12: pp. 16] at the 15th Design Automation Confersnce
which prcposed a simple method of assessing the net gain
achieved from CIDDSI in a drafting office environment.Their method uses the simple relationship:
Benefits (B) - Costs (C) a Net Gain (G)
Benefits are further subdivided by subscript into drawing,qIty pe ."
Their benefit model is:
ST N SM (eqn 4.2)
with
qE
N1 * nwH-fIA. _i) (eqn 4.3)
'0
Ij CIkDDS is defined in this jae obe commerciallyavailable, stand alcne, multip i-station computer-; aideddesign an& drafting systems.
93
9%'
9%,,.° .% - . ,. . - e- .i °
.. . oo , "e9,.. ' . , 4 , , - ' . , . . , . ' . . , . . . . . . . ' . " " e " ' ' " " " " ' " . - " . " ; . - , ' ' " " " " " " " . . ' - , "

7;_V.21
which combine to yield
ST [n'w-H] -i (eqn 4.4)
(E)
whereL*ho lime benefit (savings) in man-hours of a CAT. iTdraw1ng,
NinAverage number of CAT. i drawings produced/period,St~u ver!ge nan-hors required for drafting a CAT. iSiArawing manually.*
-Liverage man-bours required for a CAT. i drawingusing CDDS, 3
Z=CADDS user efficiency factor, (OSE51)
nlNumber of work stations,v=lumber of shift hours/period,Hsingle shift hours/period,
fi-Fraction of CIDD alloted to CAT. i drawings, and
A-CADDS system availability.
First, consider the way Shah and Yan deal with thequestion of "tasks not affected by CAD/CAM." In the deriva-
tion [Ref. 12: pp. 21] Shah and Yan include two terms,
which represent the average man-hours needed for planning,
preparation approval, issue, and distribution of Category i
drawings produced on CADDS or manual methods respectively.
They conclude that "based on our experience, activities like
planning, preparation, approval, issue and distribution takesimilar man-power effort whether the task is done manually
or using CADDS." This allows them to equate the two terms,
and, because of their algebraic relationship, drop then from
Includes extracting data for wiring lists, etc., whereapplicable.
3Ibid
35

the equation. The result is a comparison only of tasks
"affected by CADDS," similiar to Chasen's comparison.
This model is also "worst case," in that intangible
benefits are ignored. Shah and Yan do include an efficiercyterm (E) that adjusts the man-hours expended by a user that
may be new to the system and hence not as productive as hecould be, to that cf someone who is considered to be 100%
efficient. k vendor should be able to provide accuratelearning curves on a given system for determination of thisterm.
3. CAIDQS P.22li y §easuI~gZ._ Jelbo
The next method differs significantly from theprevious two in that it deals with productivity in a subjec-tive, instead of quantitative, way. The method was
presented in a tentative work plan lRef 13] for the CAEDOSproductivity study tc be conducted by a private consulting
firm under contract tc the Navy. The "productivity measure-
ment plan" details a measure of productivity (HP) that
consists of a weighted sun of productivity factors:
M. MP- Wi.PRI (eqn 4.5)
PwherePRi=Improvement in productivity due to a particular
.actor Cf computer-ailad engineering,
" i =eighting of factor its impact on productivity, and
if-Total number of productivity factors.
6o,
*" 36
,: W ' ". " ' ,, - '\'. . , . p- ',- A- .. -.-.... . . . ..

The productivity factors identified in the CIEDOS study
include: I Tme7) QualityReproducibility 8) Automization
3 Skll level s 1) Documentationcommunication 1 Improved project
resource management5) Configuration ugut. III Reduction of uncertainity6 ost & value o 1 Ability to spot
information unsuccessful pro jects early
A measure of cost (MC) is then determined by summingthe costs in obtaining certain features (factors):
M
MC u LCI (eqn 4.6)Ji
These two terms are then combined in a
productivity/cost ratio (PCR):
PCR a MP (eqn 4.7)MC
The strength of the proposed measure Iies in its
simplicity. The measure of productivity (HP) is easy toexplain and represents a "common sense" approach to theproblem of productivity measurement; however, this techniqueis better suited for measurement of completely non-quantifiable entities, such as "the value of learning"
because of the difficulties in defining a universallyaccepted measure of value. ith a weighted sum model, ameasure of value is determined by a weighted average of
someonels, or some group's subjective assesment of value.
37
V V %""°% , %"", "D . ° '. .. V a"• % " .*.% - . .- . . . . .. . - . .. ** .. . . .

-~~ -77. 4
4 a major weakness of the model as it applies to
Department of the Navy Productivity measurement is thecompletely subjective measurement of factor 1, time. SECNAVInstruction 7000.14B clearly states "output measures(benefits) shall be expressed quantitatively whenever
possible", (Ref. 8: pp. 101. Time savings represent a
major factor in this type of productivity analysis (Bef. 13]and should be measured quantitatively instead ofsubjectively.
* The model has analytical problems. The measures aretoo subjective for meaningful analysis. Subjective terms
should have some sort of sensitivity analysis performed onthem to determine if they are unfairly forcing a particular
outcome. Also note that in the model subjective weights are
multiplied by subjective productivity factors. Thismultiplicity further confounds the sensitivity analysis. To
be adequately analyzed, the reaction of the model to allpossible ranges of bcth factors should be examined.
The model has data collection problems. For
example, to reduce the subjectivity in "skill levels," youwould have to test all the engineers on their professional
skills before they used the CAD/CAM system, then retest them
after use. The difference would be a measure of their
improved skill level. This assumes the engineers have notused CAD/CAR before, which is unlikely, and further assumesthe administration of a representative skill level test,
which may not be feasible.Additional data collection problems occur with the
measurement of cost (BC). Each Ci represents a cost ofobtaining the productivity of the ith factor. Is this to
mean that out of the total system cost one has to carve the
cost of those system components that make the factorpossible? As an example, consider the factor automization
that represents the system's ability to automate certain
38- ** *% ."*'* \ -
design practices like rules checking. A, designer, through
l his experience and education, knows certain basic design
rules. The computer system can be programmed to check aao,
. design against these rules and flag any discrepancies. Thecost asscciated with this ability should, by implicaticn of
the model, be the ccst of the software that provided the
rules checking ability. The question that now arises is "do
we include the cost of the hardware needed to provide the
ability"? What if a specific piece of hardware provides two
capabilities? Should it be counted twice? It is notcompletely clear what the measurement of cost really is.
My final point on this model is how easily it could
be abused. Any competent analyst could support or refute
almost AM position with this model by manipulation of theweights, measures of productivity, and measures of cost.
There is no auditable data source, only a group of people'sopinions that determine if a system is productive, and by
how much.
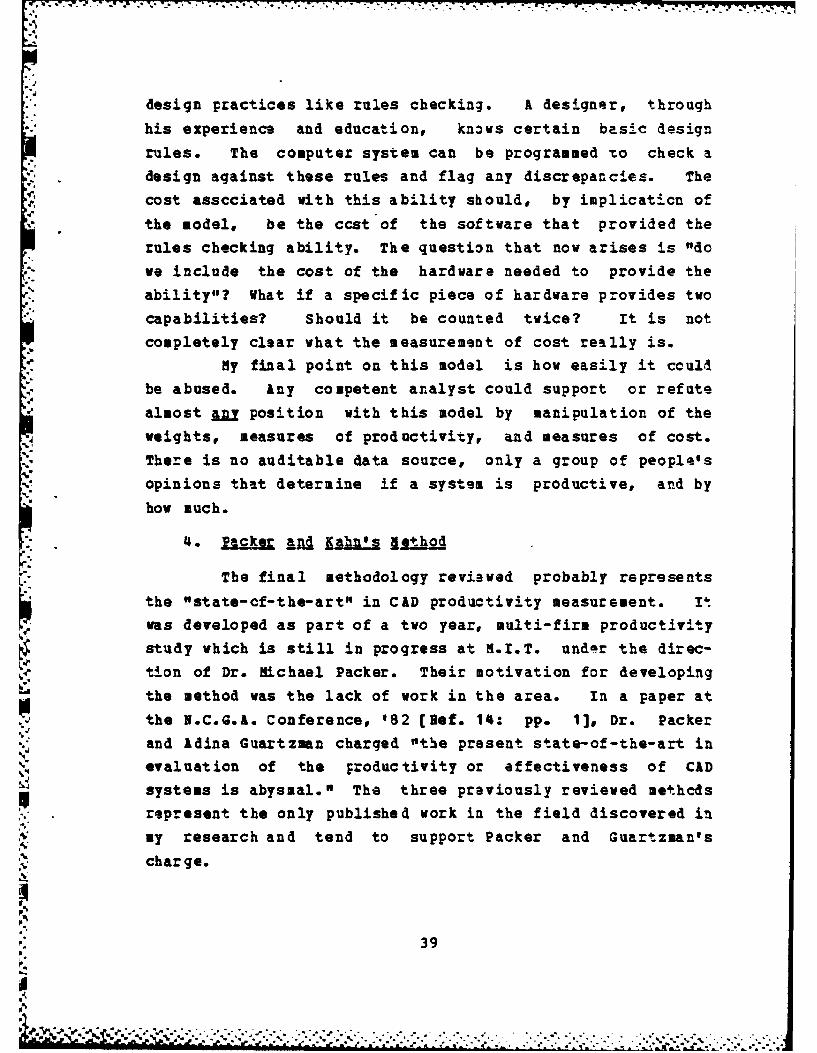
4. Packer Iahn _abI's jjethod
The final methodology reviewed probably representsthe "state-cf-the-art" in CAD productivity measurement. Itwas developed as part of a two year, multi-firm productivity
study which is still in progress at M.I.T. undar the direc-
tion of Dr. Michael Packer. Their motivation for developing
the method was the lack of work in the area. In a paper at
the N.C.G.A. Conference, '82 [Ref. 14: pp. 1], Dr. Packer
and Idina Guartzmn charged "the present state-of-the-art inevaluation of the productivity or effectiveness of CAD
systems is abysmal." The three previously reviewed methcdsrepresent the only published work in the field discovered in
my research and tend to support Packer and Guartzman's
charge.
39
do ',' ''.v" ,aaa . -. ... -...- . * -.. ... .*.. ... . .,. . . .. .... .. . .. ... .. ., h, >-i ,'i ,'i ,
.' -'..,,>'.......'. -. .'--. . , ~ * .- - . .. '... . *; -... ,-

.. i T. -;W-
The .I.T. study has two separate facets: the meas-urement cf tangible benefits and the measurement of intan-gible and collateral benefits. Packer builds a case against
comparing actual CAD time with estimated CAD times(Ref. 15: pp. 52-54]. I disagree with his statement
(Ref. 16: pp. 2] that comparing actual CAD times with esti-mated CAD times is "useless,' however. Each situation mustbe considered individually. In the Naval Shipyards case,there simply is not time to collect the data and analyze itusing Packer and Kahn's method before the March 1984 dead-
line. The other and most important point is "what is theanalysis being used for?" For acquistion decisions, appro-priate estimates are adequate.
The .I.T. study is collecting data on "project*cycle time" and "changes in the project" other than customer
requests. The data is being collected on all jobs, CAD or
manual, with the intent of developing a large enough data
base to sake statistical comparisons. They hope to generatedescriptive statistics on:
-- Project cycle time--Job dra ftling/desigp time-- Number o changes by source and reason-Job descripton parLmeters (subjective descriptors like
complexity, innovativeness, etc.)
The next phase of the analysis involves stepwise
regression and analysis of variance to determine the rela-
tive effects of a number of variables on actual and esti-
mated job completion times (the independent variables are
job description parameters) . The same techniques will alsobe used to lock at CAD useage and job parameters on projectcycle time, CID useage and job parameters on the number of
errors and changes requested, and last, a determiniation of
the distribution of the time of the drafting and design
effort per project.
'i0
" t O

• * .* * a -. a*. . *a 4 ba p W *..,.b ' * J " * m , a -i - -. . .
The intangible and collateral benefits are measured
by analysis of a detailed questionaire designed to break the
broad, vague concepts such as flexibility, into detailed
specific criteria of organizational effe'tiveness.Hierarchical clustering is used to organize the questicns
-, into groups. See Table II [Ref. 16: pp. 4] for samplequestions and groupings.
Alpha in Table II is the Cronbach measure of reli-
ability. It is used to estimate "the reliability of empir-
ical measurements cbtained in one administration of ameasurement instrument (questionaire)" (Ref. 17: pp. 57].
Thus, alpha represents a measure of the internal consistencyof the questions in the group. "General guidelines forvalues of alpha in empirical research are that alpha-0.6 isadequate (to establish a group) in exploratory analysis, and
that alpha-0.8 is preferred for applied work"[Ref. 17: pp. 158]. As shown by the Table II alpha statis-tics, three of the five groups meet the 0.6 criteria to
establish a group. Beta, in Table II, is the coefficient ofgeneralizability [Ref. 18: pp. 17] and is defined as theratio cf population variance to the variance of the group.It expresses how well the group is likely to place indi-vidual questions relative to all other questions. Since thevariance of the group will always be less than the variance
of the population, beta will be between 0 and 1. The higherbeta, the mcre general the questions in a group.
PThe groups in Table II were formed by simultaneouslymaximizing Alpha and Beta. Maximum loading on a clustermeans that a specific question had a maximum correlationbetween it and its corresponding group. Each question isscored tetween I (very difficult and 7 (very easy).Questions were worded so that higher scores corresponded tohigher levels of effectiveness [Ref. 17: pp. 46]. The meanscores of each questicn in a group are averaged to provide a
.1
a.14
a.".
.I'
D'
". ". .". . ." .. .",..,...,, .- , ..... '. '. ''. .. ."'." . •.''',,".,..,''., ,.v ,",,.. , .'5. , ',a' *. " ,-''-,", "" "", - r a- - - . " " " - "' " ' T ", aa..,a. " ", ,":r', ,a ' %7&l ,' a a', , ,
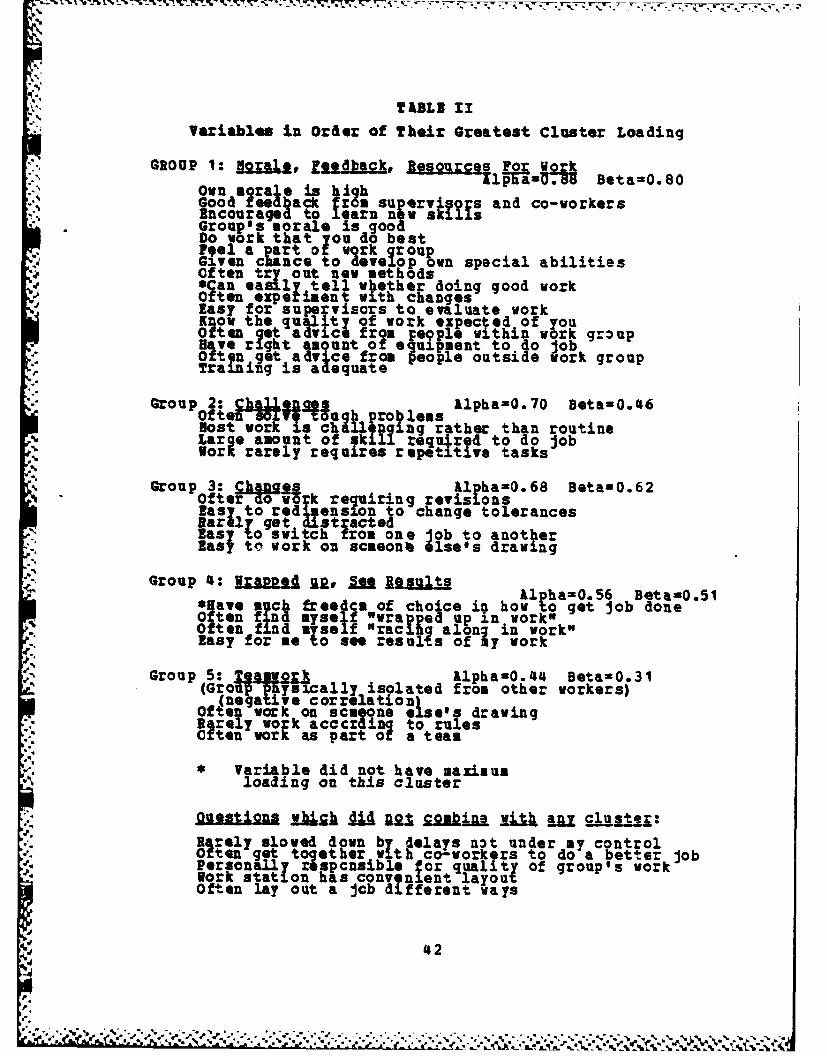
TABLE 11Variables in Order of Their Greatest Cluster Loading
GROUP 1: Iaorat fedac, Resourcef!ro2j BetO.plaPHSBeta=0.80"-' Own morale is high
Good feedback from su ervios and co-workersEncouraged to learn nw skilsGroup's morale is goodDo work that you do bestel a Part of work roupGvn cianc. t develop cvn special abilities
Often try out new methods* an eamly tell 00thegadoing good workMOten exper ent .th cangesEasy for supe visors to evaluate workKnow the qu1l ty of work expected of youOften qet advice from jeople within vork groupUTe ight amountof equipment to do job-"tgnge.t advice from people outside work groupTra nng is adequate
Group 2: ie2nee .lpha0.70 Beta-0.46Often sov ough proo lessHost work s challengIng rather than routineLarge amount of ski±I required to do jobWork. rarely requires repetitive tasks
Group 3: .lpha=0.68 Beta=0.62Ofter do o k reqiring revisionsEasilto red ens on to change tolerancesBare@y get 4 isntactedEasy to switch rn one job to anotherEasy tt: work on scmeont elsels drawing
group 4: frappe qpgsaua~_ GoL: 1. , SeeAlha=-0.56 Beta=0.51N ave such freedca of choice iq how to get job doneOften find myself "wrapped up in work'
* . Often find myself "racing along in work"Easy for me to see results of my work
Group 5: U3JLY2 Alpha=0.44 Betas0.31(Group pysically isolated from other workers)
(negative correlationOften work on scm one else's drawing•~rely work acccr.ini to rulesSften work as part o a team
* Variable did not have maximumloading on this cluster
.. Oetin _Ugh I" ngI combine Xjijj a1UcK
R rely slowed down by delays not under my controlOften get together with co-workers to do a better job
'. Personally respcnsible for quality of group's workWork station has convnient layoutOften lay out a jcb di fferent ways
'42
• W . . ~ s . S .. . . . . . . . . . .'. ....**S% , . ...... /...:..... ...... ,...**. -.- "..-_ - .,'..,'.'.*,-4,,,.,..,..:,

7.4.F
|, a
COMPANY E QI FACTOR GROUP SCORES
(groups suggested by 8 - factor solution
Fl "own oreativity"
F2 "group functioning"F3 "pace , concentrationF4 flexibility"F6 information , resources
FI
,MANUAL Workers
NN
F6 F2
factors 5,7,8 not used' to construct clustered factorgroups because of low reliability due to bipolar (,-)Interitem correlations.
CAD nz8 MANUAL nz6
Figure 4.1 Perceptual flap
43
- -v.- .. . J%_. . . --- -- -- - -- -- --__ _ _ ___ _

point estimate for the group. These are plotted en a
"perceptual sap" resulting in the pentagon-like Figure 4.1.
The center is the origin and each group score is plotted out
from the center along its respective radial. The further
out the radial, the more effective the system. The inter-
connection of the cints gives the pentagon shape, and
provides a way of distinguishing the manual points (dashed
line) from the CAD pcints (solid line).
The advantages of this perceptual mapping technique
are:
1. The system can be used to monitoz performance overtime.
2. Akstract concepts are made explicit.
3. Perce tin a t the ouanizatlon b dgrou H in the organizatign can e con ard!ferent
There are three major drawbacks to the perceptual
sap for information presentation. The first involves the
interconnectivity previously discussed. The interconnection
of the radials implies some connection between adjacent
radials when in fact none exists. The second involves mcst
people's subconscious preference for aesthetically pleasing
geometric shapes. This preference introduces an element of
bias. For example, in Figure 4.2 Factory A and Factory B
have identical CAD and manual system perceptions, however
Factory A will generally be perceived as doing better with
CAD because of the more pentagon-like shape.
The third drawback is the lack of indication of the
accuracy of the points on the various radials. The standard
, deviations have been computed (Ref. 17: pp. 75] and should
te displayed somehow.A better presentation of the data might be through a
multi-variate box-plot display (Ref. 19: pp.29]. a better
compariscn of the systems can be made from the additional
information presented. Data with the same means and stan-dard deviations as that contained in Figure 4.1 is displayed
44
4
I

* * . ,.T- 3 L, * . * . "W-'% ' I V,, I , . . , . 't. , ',Jf :, -% U. u. . . . . . o -.* U .. . , . .. . .E'
4 .
4'3
Wih factory isdon'better with CADW
2 -- -MNALWrkr
S2
. Factory 8
Figure 4.2 Percept~ual DiLfferences
with this box-plot method in Pigure 4.3. As can be seen,
~the relative positions of the interquartile ranges gives an• indication of whether CAD wcrkers or manual workers are mor
."productive" in the five areas. Now thought thedecision-makor is present ed with inforation about theu nderlying distribution of the answers, and with this infor-
": mation can immediately decide whether the differences are
Ssignificant for the decision process. This is not to argue.that t-tests for significance should be discarded, they have
iei

~110
419 I-- 0
'4i
34t
In m
Alonp~d buioojou
.9. I46
- h - 17 W . . V . .~
their place in the analysis, but to point out that the goal
is to produce a decision-aid that is useful to decision
makers in comparing differing systems. An additional advan-tage to this data representation is that it can be computed
- and plotted automatically. An example of a FORTRAN subrou-
tine used to create similiar box-plot displays can be foundin McNeil [Ref. 19: Fp. 46].
-47
"pp.
*. I
.1
"-p
, ,'.-' ". -" - . "'- ." " " -"" ..,' .' ." " . "- " ." -" " , - -" .- . . , . . .. - . - - -. . -
Ye iUILILU! Uun2
-I A. IIO!TITAIOu
The four previously discussed methodologies have their
, own strengths and weaknesses in dealing with the question of
"benefits" derived f c, or relating to, the use of CAD/CIA
(CAD in most cases). Chasen [ef. 10: pp. 263] identifies
the need to compare only "tasks affected by CAD/CAM" for
productivity measurement but fails to account for user effi-
ciency on the system. Shah & Yan (Ref. 12: pp. 17] deal
with the efficiency problem and provide a very useable meth-
odology for %agib l* benefit analysis. In 1978 this was
farther than anyone else had gone. Unfortunately, today we
need a methodology to measure tangible and intangible
benefits of CAD/CAR and of the next generation technology,
CIDER. The CADOS study (Ref. 13] offers a method to
measure the intangibles of CAD/CAR which could be extended
to CIDER, but which has some real problems with data collec-
tion and analysis. Packer and Kahn [Ref. 16: pp. 2] offer
a methodology that measures both tangible and intangible
benefits of present CAD technology. This method would be
hard to extend to CIDER technology because of the tangible
benefit measurements requirement to analyze a large enoughdata base to be statistically significant. The timerequired to develop that data base could probably be meas-
ured in decades. The intangible benefit measurement method,
however, does appear quite useful and expandable. Clearly,
none of the methods were specifically intended for shipyard
analysis and hence are not really adequate. What " needed
is a methodology that synthesizes the good points and avoids
the pitfalls of the methods discussed--a methodology
48
.", i _ " ".,,_'*'" ' ,.p_. .*.. .",:* .o . ,",, . " .. , .. . .•. . ,.

specifically tailored to the shipyard environment--such a- methodology is proposed here.
I good source of informed discussions of the benefits to
be derived from a CAD/CAN system in the shipyard environment
is the requests shipyards submit to the Naval Sea Systems
Command (PES-309) fcr interim CkD/CAM equipment. These
requests require the shipyards to justify the acquisition,
and usually include a listing of the benefits they hope to
enjoy if the system is obtained. Study of these and related
requests resulted in the list of benefits found in Table
III. Benefit analysis usually involves comparison of somenew system to the existing system or the t SLug. Table
IV lists the relevant benefits of maintaining the manualdesign, drafting, manufacture and maintenance methodscurrently in use.
In developing a methodology to assess the benefits ofCIDSE as they apply to the shipyards, it is important to
keep in mind the purpcse of a methodology. The intended useis to objectively quantify, where possible, the relativetangible and intangible benefits between the existing system
and a new technology. Presently, that means providing a
methodology to analyze the Interim CAD/CAN Systems being
installed at the shipyards. The method, however, will stillbe extendable to analysis of the next generation of systemsdescribed by the acronym CIDMH.
Following Packer, the methodology is divided into. multiple parts. The first part addresses the tangible or
quantifiable benefits of the Interim CAD/CAN System. The
second addresses the intangible benefits and the last part
addresses those benefits not falling easily into either ofthe above categories. A formal delineation of the
methodology is presented in the next chapter.
49

TABLE III
Relevant Benefits of CAD/CAR
1. Increased productivity (reduced man-hours to accomplishtask) through automation of repetitive time-consuming tasks.
2. incteased froluctivity t roggh ahe to r. produce a aesgn rom * ezstng goneric el men d s 980s
3. I qreasqd productivity through the ability to rapidlyHeit ezM ing aesigns.
4. Increased productivity through automated numerical control(noc.) tape or APT source code generation.
5. Increased roductivity through easier access to archivedrawings (treserte digi ta lyg.
6. Incre4sed prouctivity through computer generateo 3-D.modeling for installaTion and general configuration analysis.
7. Bettei; quality designs through imprgveddesi ner'4 creativity provided by the ma-machine intergace.
8. Bett r aualily drawings, less errors, morestan arz at ln.
9. iloser to optimal layouts (flat pattern) resaltingin reduced waste and cutting time.
10. Increased productivity rsulting from a rethinking ofeway elements are designe.
esig., manufacture and maintenance will marry, resultingin a better product from the freer transfer or knowledge.
4' 11. Increased groductivity i maintenance areas revork.overhaul) through ore efficient work c heduln anre uct on oi re undant and/or interfering opera-ions.
12. IncIaseP prodctivity through automated technicalpublicatio and other documettat on authoring and updating.
13. jettee acguracy in element fabrication resultingin reduced asseml time.
14. Incesed manpower available to refine and improve work,p methoas.
15. Iroved communication in organizatiop.resul.ting from"eteryone working o.n the same pJan" wich a so results inorgan zation cohesiveness.
16. Istablishment of a common engineering data base for usein p onpiuction and management of ships over
17. attractipq and maintaining quality engineeringpersonnel,
18. Better hndling 9f "1 rash" jobs and fanpoe/orkloadfluctuations (reduced overtme and aro-out).
19. lotantial elimination of all paper representation or ateast reducedspace required fot drawing storage.
20. Istalbish the organization in a leadership role in anemerging technology.
-so'. 50
-C- C..

TABLE IT
televmut Bemefit* of The Status Quo
1. So transition to a new system and the associated problems.
* 2. No now equipment procurement, maintenance or support costs.
4, 3. Known costs.
4 . No chance of obsolescence after procurement.
5. Larit numbers of job types (numerical control programmers,raftsmen, etc.) *aft ltact.
6. System is relatively secure.
4-' . TANGIBLE BENEFIT QU&NTIPICTION
The desired output of a tangible benefit model is some
type of information the decisicn maker can use to balance
against the cost of the decision. "Cost" is a generic term,
tut for most decisicns in which economic analysis would
apply, it is taken to be monetary in nature with the
accepted yardstick being dollars. The problem that often
arises is that dollar savings cannot be measured directly.
fowever, we can measure the time savings gained from a
particular alternative. Two examples of the types of timesavings gained are shown. Figure 5.1 (ef. 12: pp.17]
shows the time savings from a computer-aided drafting
system, while Figure 5.2 [Ref. 20: pp. 31] shows the time
savings frem computer-aided NC programming. Time can then
be utilized as the common denominator in the benefit quanti-
fication. This tends to allow for easier data collection,
and the calculation of the tine savings benefit which can be
converted to dollar savings by the appropriate labor rates.
We have seen frcm Chasen (Ref. 10] and Shah (Ref. 121
that the savings in man-hours achieved in an application
area for any given period can be represented as the differ-
once between the time spent accomplishing the design or
51
I' ' ' % ---. ,,,. ..... .... .....

mr
m.. man hoursIJ - t mhn. 0 -
Planaing and P ppaubm Planning and preparaliono-- 3m r. - Sm]is I19.3m .6ro 19. m_ hr_.
Approval, leave wW distrIbIion "0rIla DraftiWN 13 m.hrs.i Aj Approvol, Isue and distribution
10 abre. I im. hr.
Planning and prepattm21.5 i.brs.
d Drattlng 5.3 mnWe..-
Approval, issue and diilibutlion4-,hrs. Extracting data for list
6.S &hr&, using86maiCADOS uyin
Planning and preparation
21.5 mehrs.
Drafting 26.3 sars.
Approval , issue and distributionS 4 me.hm -
170.1 IMANUAL techniquess
dI
SFigure 5.1 TinO Flow for Generating In Elementary Design
52
,I

TYPE OF PROGRAM
Computer - AidedProgomming
40 min.Graphics NC
400 min.. oventiona I
~Figur~e 5.2 Timis BecquiLre4 to Program On* Tool Detail1
53
L~ b . ". "o °, • -- -• -• " * -" *-- . . . ... • . ..

manufacturing project manually and the time spent acccm-
plishing the sam project using the CAD/CAM system. A
distinction is made between benefits incurred with CAD and
those incurred vith CAN even though there are application
areas both have in ccmmon. For example, there may also be
design and drafting requirements in a manufacturing shop.
This separation of CAD and CAM is lone primarily to reflect
present-day thinking and data collection. With the creation
of a single digital data base, CAD and CAM must be combined
if the true potential of the system is to be realized. This
rethinking will take time as old barriers are broken down
and better working relations between design, manufacture,
and maintenance operations are established. Meanwhile, inan effort to make the models more accurate to the present
day, the separation will be maintaiaed.
The generic framework for both CAD and CAM time savingsis:
TB= M-S (eqn 5.1)
where
TB-Benefit in man-hour saviags.K-Estimate of thq man-hours required to accom lish
the p oject using manual design and manufacturingtechniques, and
S-Actual man-hours required to accomplish theproject using the computer-aided system.
The model can be improved by the addition of an operatord efficiency correction term (Ref. 12]o if learning curve data
is available:
TBaM-(SE) (eqn 5.2)
514

where the new term, E is the fractional efficiency rating of
a user of the particular CAD/CAM system. An example of why
this correction is important involves two users of a partic-
ular CAD/CAM system. Both designers are experts at manual
design techniques. Designer A has only had six months of
experience on the CAD/CAN system and is considered to
operate the system at 50% capacity. Designer B has had
considerable experience on the CAD/CAM system and is consid-
ered to operate it at 100% of its capacity. They work on
two separate but similar projects that each estimates should
take eight hours to complete using manual design techniques.
Designer A finishes his project on the CAD/CAM system in six
hours, while Designer B finishes his in three hours. From
equation 5,1 the total benefit from both projects attribu-
table to the CAD/CAM system is seven man-hours
((8-6)+(8-3)=7). This yields a productivity ratio of 1.78:1
for the CAD/CAM system. Using equation 5.2, the total
benefit is ten man-hcurs ((8-(.5x6))+(8-(1x3)-10). This
yields a productivity ratio of 2.67:1. Which is a better
estimate of the productivity gain attributable to the
CAD/CAM system? The second, because the first penalizes the
M21SM for Designer A's inexperience. The reason for the
benefit analysis is to compare systems, manual vs. CAD/CAM,
not designers. The efficiency correction brings all users
of the CAD/CAM system to an expert level, which is fair
since the comparison is to an estimate based on an expert
user of the manual design system. An example of the datareduction process utilizing the efficiency correction is
shown in Figure 5.3.
55
ao, . ',' ,," ' ' ,. .. , .- " - ' . "..•., . . .",. + , ."'" " -.'- . ,,.. .,,-",.- ," " "4"p .P +' , .""",
. , .. , .. ",° o ",

1 I1
*0
ILI VL
- so
'204
a56

The above is essentially the model developed by R. Shah
and G. Yan [Ref. 12] for 2-dimensional drafting applica-
tions. The model has been generalized to apply to several
applications relevant to CAD or CAN. Unfortunately, the
models still give a conservative estimate of benefit by only
quantifying the time saved in the design, drafting or manu-facturing processes. Both fail to capture some key elements
to productivity inherent in the Interim CAD/CAM Systems.The key elements of productivity associated with CAD/CAM
on the Interim System are:1. Ralitu 1CAD/'CAM)
97f.tr to produce "bettor" designs through theexploration of many alternatives.
2e lxibiity (CAD/CkAfTbU-irIZTy to rapidly change an existing designfor a nev applicat on.
3. Pcurigid (CAD/CAM)Merror rate and the ability to rapidlycorrect those errors that do occur.
4. Trasferaility(CADbi nbtwe y transfer designs to and fromt,'ar Rhi v ng tacilit I es. .This inclydes tha transfr-r
~mstiens between the storage nod us and the user
mediums.
JRAf5W111aaA fityto automatically produce numer-Cal control tapes and/or the APT source code, to
drive the numericallly controlled manufacturingprocess.
6. sltn Cgityt6. -6n-518 CTOitTt simu.~ate 3- mc-ups for
Installat on and general configuration analysis.Any particular project done on the Interim System will
have one or sore of these elements. If we keep in mind that
each element represents a subset of the total project, thenthe discussion of each subset and its quantification will be
easier to follow. Each element will be discussedindividually with the necessary modifications to the genericbenefit model following the discussion.
7.
. 5
1.ua-it Y.
The first element is an expression of quality. Thebenefit from the element of quality is sulti-faceted and can
be quantified in any number of functional forms. Onepossible quantificaticn is presented here. If one accepts
the assumption that the designer will select the best design
of those created or reviewed, and that up to some point, the
greater the selection the better the design will be, then
counting the number of those alternatives, and using it as a4' multiplicative factor will yield a proxy' measurement of the• .quality of the design.
Critics would point out that this type of measure-
sent penalizes the good designer who produces high quality
work with a minimum number of alternatives and rewards a
poor designer who explores an exorbitant number of alterna'-
tires and produces good work. It can be argued, however,
that the poor designer working on the system will actually
improve his skills as he is able to rapidly discard poor
alternatives and explore new ones. In a very short period
of time, be will have reinforced the good design skills anIA be pursuing those alternatives he has learned will be bene-
ficial. He is now at the level of the good designer who
will use the capabilities of the system to be innovative.
Innovation in design is where real gains in productivity andother long term non-quantifiable benefits are reaped in the
total design, manufacture and maintenance process. Forthose reasons, counting the alternatives explored is a
simple but representative way to quantify quality. Thisapplies more directly to CID; however, in the manufacturing
environment there is a certain amount of design work
performed that would be applicable.
'Proxy in this sense means an artificial measure used tofe resent an actual quantity that cannot be quantified
ectly.
58

2. JLiU
The second key element to CID/CAR productivty is the
ability to rapidly change an existing design for a new
application. The model thus far developed deals with pure
design and the resulting drafting applications. we will now
look at the time benefit gained from computerized design
within an existing *family" of designs.
The existence of the "family" of parts and their
engineering data base allows instantaneous entry and revi-
sion of the particular family member. Using manual techni-
ques, the draing(s) and analysis data must be reviewed,
sketches drawn and when the change is finalized a new set of
drawings and engineering analysis data generated. Using
parametric methods, a family somber can be selected, parame-
ters changed as required, analysis performed and drawings
generated in a semi-automatic iulteractive mode which should
be such faster than manual methods currently in use.
3. icuraj
The third key element to CAD/CAR productivity is in
the area of accuracy. Designs produced on the Interim
CAD/CAN System should have fewer errors because of the
reduced opportunity for the human element to make them.
Conversion of the errcr rate as a measure of accuracy to the
common denominator of time is accomplished by taking the
tine spent correcting errors using manual techniques and
subtracting from that the time spent correcting errors using
the Interim CID/CAN System.
The fourth element in CAD/CAN productivity deals
ith the mass storage and retrieval aspects of an Interim
CAD/CAM System. Present technology storage systems usually
59
4;, _. :,,, . ., . ? ,.., .. .. ' .,, ... , , .?.......:,..,, :,.. .?. : .,

p; •
involve cataloging sme sort of microform. Preparation of
this microform is usually done at the user site. Then, it
is shipped to the storage facility. Present technology
offers a variety of ways of transferring a digital data baseto a storage facility. The data can be read to a magnetic
tape or optical disk and shipped, or a direct link from the
user's computer to the storage computer via satellite or
phone line can be established and the data passed. Thismethod affords the opportunity of real-time updating, thusbypassing the problem of the archive maintaining the correct
revision of the design.
The fifth key element *can be quantified as the
difference between the time taken to generate a numerical
control tape using manual methods and the time taken to
generate a numerical control tape using an Interim CAD/CAL
System. Both times should reflect programming, validation
and run times to capture the time benefit gained by opt!mal
cutter path routing.
The sixth key element can be quantified as the
difference in the time required to design, construct and
utilize 3-D models or mock-ups for installation and general
configuraticn analysis, and the time to design, constructand utilize the same configuration digitally on the InterimCAD/CAM System.
Present manual methods of configuration analysis
involve the dockside creation of full scale wood mock-ups
followed by insertion of the various now components to check
if they can be installed as desired. The CAD/CAM systems
ability to generate 3-D models provides a tool to simulate
the environment and the component insertion without full
scale mock-up construction.
60

Quantifying these six key elements in the gener.ic
model is accomplished by quantifying each element individu-
ally and then simply summing to get the total benefit from a
given project. The first element is represented by equation
5. 3:
TB1: (Ml-MA)-((SI1 SA)-E1) (eqn 5.3)
where
TB-Total benefit from the 99A-i_1 element,1=Estimate of the time spent, on a project using
manual techniques in pure esign,filThe agmber of alternatives explored using manualtechniques,
S1=The time required to complete pure design aspectsof the project,
SA=The number of alternatives explored on the CAD/CkMsystem, and
Z1 = The measure of user efficiency in pure design onthe system (O<B_<1.O).
61
p.. #" " "'" ' * "', , ,''." " "• " ''- - '.'' ' " " "- "- "- ". . . . . . .

- - - . * . ~ . . . . . . . . ~ ~ **** **7
To represent the remaining elements the generic framework is
simply subscripted (io1):
TB1 MI- (,SI E1) (eqn 5.4)
for in
2: Plexibility
3: Accuracy
4: Transf erability5: Automization
6: Simulation
T31=Total benefit frcm the ith element,
ft! uflstimite of, theetime spent on a project using manualtechniques in element iactivity,
S;=The time* required to complete element i activity of theprojecto and
E;=T e, measure 3f~se efficiency in element i activity on
Adding across the elements provides the total'4 project benefit, (TPP):
TPB a ZTB1 (eqn 5.5)altI
A data reduction scheme showing the subsets is showt by
Pigure 5.14.
4 62

411
4V
II 0is' I9 I i 'I
I Ii~ U.3.fob
AME VO
Ii~iU~6I
It can be seen that productivity ratios can bdeveloped for each elemental activity as well as the aggre-
gate ratio for the entire project. This provides a manage-.ent tool for monitoring productivity in each project aswell as the much needed [Ref. 16: pp. 1] verification of
the venders' claims tc productivity gains available from the
CAD/CAN system. This ratio can then be used in standardeconomic analysis procedures to estimate dollar-savings, andhence return on investment, payback periods, etc., requi-ed
in the acquisition process.A possible embellishment of the model would be the
inclusion of an estimate on the standard deviation of M,
which is the estimate of the total project time using manualtechniques. This can be accomplished by taking the differ-
ence of the ninety-fifth percentile estimate and the fifth
percentile estimate of the time required for the project,Fand dividing it by 3.2 (Ref. 21]. This will give a rough
cut at the standard deviation which can be squared to get
the variance estimate. If one were to use the estimatedtime to accomplish the project manually, the upper estimate(+I standard deviaticn) and the lower estimate (-1 standard
deviation) as three points in the data reduction scheme, the
user would end up with three productivity ratios. Thisrepresents the high, sean and low levels of productivity onemight expect.
C. INTANGIBU BENEFIT INALYSIS
Thus far we have attempted to quantify the first nine of
the twenty benefits listed in Table i1. Those benefits andtheir respective quantifying element (s) were:
1. Increased productivity (reducel man-hours to accomplishtask) through automation of repetitive time-ccnsumingtasks; QUALITY, FLEXIBILITY, ACCURACY
2. Inc eased ro~uc t ivi t y thriugh theribi rapidlyprouce a Rsign from existn ener c telentodes gns
FLEXIBILITY
6-4

3. In creasd productlvity through the ability to rapidly-'."edit existing designs .edt x QUALITY, 'iLEXIBILITY, ACCURACY
4. Increased prodactivity through autopated numericalcontrol tape or APT source codi generation;
A UTOaIZATION
5. Increased productivity throuh easier access toarc ivel drawings represented ligitally;
IRAISFERIBILITY
.In fsed roduitivil hrou conuter genr ated 3-Danalysis; SIHULATION
7. Better .uality designs through, improved designercreatfvity proided by te man-machine interface;QUALITY
8. tett~r quality drawings, fever errors, more standard-zaon;ACCURACY
9. Ho e optimal layouts resulting in9. reauced vastle an cutt nQ time:
AUTONIZATIONSome of the benefits are only partially represented.
For example, benefit nine also includes "reduced waste,"
which is not captured by the time difference in automizationwhile reduced cutting time is. The remainder of this
chapter will be devoted to discussing the remaining benefits
in Table III.
.9 1. RehAina 2 DUSaa. JMethods
Benefit number ten, "the increased productivity
resulting from a rethinking of the way elements are
designed," is in reference to the use of a common engi-
neering data base, in digital format, that can easily beshared between design, manufacture and maintenance activi-
ties. Design problems can be quickly identified by manufac-turinq engineers and easily corrected. Fleet user
suggestions can also be incorporated much faster. This
*- interaction between designer, manufacturer and user is one
of the primary long range benefits of a CIDMK system. Today
with the Interim CAD/CAM System the interaction is generally
65
%.•I % " % %,' " ,% " ,% "

, i .
confined betweeen designer and manufacturer. However, this
is an improvement to the previous poor state of
communication.The quantification of rethinking design methcds
could be accomplished by surveying designers, manufacturers
and users as to their impressions of what communication
between groups is or could be like with the Interim CAD/Cl
System. Questions like, "do you see an improvement in
information flow occuring between design and manufacturing
activies resulting from the Interim CAD/CL? equipment?"
could be used to gather data on the expected level of infor-
mation exchange. This is a reasonable measure since user
expectations would probably tend to occur. For example, if
the users expect the system to fail, it probably will. This
is the argument of the self-fulfilling prophecy.
2. =_q Iffkcint Lal~ ScheduJllq
Benefit number eleven, "the increased productivity
in maintenance areas (rework, overhaul) through more effi-
cient work scheduling and reduction of redundant and/or
interfering operations," refers to the problems associated
with different workshops all accomplishing their work from
each individual shop's original drawings. For example, theair conditioning shop is tasked with installing a newcompressor in a space. To install it, they have to cut ahole in the deck to lower it into the space. They finish
installing it and weld the deck plate back into place. Oneweek later the hydraulic shop wants to put a hydraulic pump
in the space and has to also cut a hole in the deck. This
redundant activity cculd have been avoided if both shops had
daily access to the latest changes to the space. This
access is easily accomplished through the use of a commonengineering data base. Managers would have a means oftracking and thus coordinating the work effort.
". 66
,< .. ,. ., ,.. .,..:.. .

The quantification of more efficient work scheduling
- could be accomplished by a survey of management to see ifthey believed having a daily view of the work proposed or in
progress would be useful in their scheduling tasks.Questions like "do you see an improvement in productivity
resulting from your ability to track or project the actualchanges cccuring in a space from your office on a daily
basis?" could be used to gather data on more efficient workscheduling resulting from the CAD/CAM system.
3. IgIal ulca pCa~1
Benefit number twelve, "the increased productivity
through automated technical publication and other documenta-
tion authoring and updating," deals with the Interim CAD/CAMSystems capability to update fleet technical publications inalmost real-time, instead of the months it currently takes,
"update," in this sense, referring to text and illustration
changes. The benefit as it would be realized with theInterim CAD/CAR System would be the reduced time required to
4. transfer the latest engineering drawings to the publishing
agency for incorporation into the appropriate referencemanuals and other technical publications. The greatestrealization of benefit would occur on the publishers' end,
-where they would be able to instantly access the digitizeddrawings, edit them fcr appropriate figure layout, and print
then. This would require them to have a compatible CADsystem, but I submit that if the digital drawings wereavailable, it would not be long before the publishing agen-pcies gained the ability to use that data.
Quantification of the time savings could be done as
a tangible benefit to the Navy but would not specificallyapply to the Naval Shipyards. What does apply, though, isthe shipyards ability to rapidly issue engineering changesto the fleet user and begin receiving feedback from them.
67

Quantification of these types of benefits could be acccm-
plished through survey of the users with questions like "do
you anticipate a shorter time delay in implementing design
and engineering changes into the technical publications as a
result of the digitized data base and Interim CAD/CAMSystem?" I follow-up question to see if a productivity gainis not foreseeable with the Interim CAD/C13 System, but is
forseeable with the implementation of a Navy wide CAD/CAM
system could be "do you anticipate a shorter time from
design and engineering change to technical publication
incorporation of thcse changes resulting from a compatible
Navy-wide CAD/CAB capability?"
4. Isy9.23A &LaSz ik.n Faicaio1 n
Benefit number thirteen, "better accuracy in element
fabrication resulting in reduced assembly time," deals withthe increased accuracy in fabrication and hence the improve-sent in fit of all the parts when assembled. This is almost
a quality assesment on the manufacturing side of the CAD/CAB
relationship. This could be quantified with the tangiblegeneric framewozk if applied to a assembly line type of
activity. The shipyards, however, leal with "one of a kind"manufacturing and repair, requiring a more subjectiveassessment of how well things designed and manufactured onthe CAD/CAM system go together.
Questions such as "have you noticed an increasedquality of fabricated parts and finished products?" followed
by "do you attribute this wholely or at least in part to the
p" implementation of the Interim CAD/C1B System?" Clearly the
people who are trying to fit Plate A and Plate B together
with Plate C will have an opinion on the accuracy of the
manufacture of those pieces.
- 6 8

* S. Z S1WIM M K7. !7W -7-7 7 7 7 k _
Benefit number fourteen, "the increased manpower
available to refine and improve work methods," deals withthe ability of the users of the Interim CAD/CAN System toconvert their new found spare time, if any, into improvedwork methods in areas not adaptable to CAD/CAN use, or inareas where innovative application of the technology couldbe beneficial. Realization of this benefit will directly
depend on the attitude of the users toward the system and
their ability to use some of the "spare time" for innovative
activities. Both of these elements will depend on howmanagement has implemented the CAD/C&A system in the work-place. This benefit could be quantified through countingthe increase or decrease in suggestions submitted. However,
this is somewhat unreliable, and may not have any bearing onthe CAD/CIN system. A method that would work for measure-sent of attitudes is again the survey of all users andbenefactors of the system. Questions like "are there anywork methods that you have contemplated improving but have
not had the time to follow the through?" followed by "doyou think any time savings you realize would be applied to
improving those previous identified work methods?", andfinally, with an explanation, "if not, why not?" Here youwould have an indication of a desire to change something for
the better, an indication of time savings resulting from theCAD/CAN system, an indication of management's implementation
policies, and, finally, an indication of exactly what theproblem with management of the assets might be.
Care should be exercised in quantifying this benefitto avoid double counting the time savings. This time savingshas been previously identified as a tangible benefit. Thesavings identified in this section would have to besubtracted from the savings previously defined in equations
." 69
a.%
-ln * '*imh -*i *l l iia. * -* ",a - - ' . ,,,Q ' ' • ,,. -

.-
5.1 through 5.4, before reporting the total time savings
resulting from the CAD/CAN system. An alternate way toresolve this double ccunting conflict would be to assume the
time spent refining and improving work methods using manualdesign and manufacturing techniques would be the same as thetine spent using a CaD/CAN system. Since they are assumed
equal, the benefit would not be time savings, but would be
the contribution of "better" work methods brought about by
the use of a "better" tool, the CAD/CAi system, with whichto analyze the existing work methods. Just as one can build
a house with an axe, a "better" house can be built using
power tools. The new tools aid in the definition of the new
methods that result in a "better" house.
6. Coasun iag onCohes ivees
Benefit number fifteen, improved communication in
the organization which results in organizational cohesive-
ness deals with the improved communication and interaction
of the design, manufacturing and maintenance users much asbenefit number four did, but this time the benefit to be
measured is not the free exchange of ideas but the user
satisfaction which leads to organizational unity and cohe-siveness. As it applies to the Interim CAD/CAM System, wecould seek to measure the job satisfaction generated by a
reduction in frustration caused by "everyone no1 working on
the same plan." This also relates to benefits reaped fromU improvements in work scheduling, number six.Quantificaticn of job satisfaction is a major topic
in many practical psychology books and is sometimes
addressed under the subheadings "teamwork" and "morale."Dopico [Ref. 17: pp. 48, 513 develops a number of questions
under both headings that gives an indication of the usertsfeelings about his satisfaction with the organization andhis role as a user of the CAD/CAN system.
70

7. 1"nUi.1n1 Data-z&Ua .1 i- L Ii& -canagement
Benefit number sixteen, "establishment of a common
engineering data base for use in construction and management
of ships over their lifetimes," deals with the long-range
benefits to be derived from a common engineering data base
created at initial design, utilized in construction, reworkand overhaul, and day to day maintenance on the ships. This
benefit is the cornerstone of the CID89 concept but is alsoapplicable now as the Navy begins to use CAD/CAM in its
initial design efforts. This is a subjective assessment of
future benefits perceived as accruing from this digital data
base made possible by CAD/CAM. This would include thingssuch as increased readiness through shortened overhaul time.
There is a problem here though, in that those most capable
of assessing the benefit of a common data base e.g.,
b.4. Shipyard Commanders, or Fleet Commanders, may not be versed
in the capabilities of the CAD/CAH system, while those wellversed in CAD/CAiMs capabilities are not versed in the
effect of, say, a 20% reduction in overhaul time on fleet
readiness. With a little imagination though, I think ques--4
tions could be developed that when posed to both groups, the
fleet benefactors and the Shipyard CAD/CAM users, could be
subjectively analyzed to give an indication of these types
of benefits (readiness just being one example).
Benefit number seventeen, "attracting and main-
taining quality engineering personnel*" deals with the
i. benefits accrued from maintaining a trained engineering
workfcrce as well as attracting new personnel. In the U.S.
today, there is a shortage of engineering personnel."Colleges and universities are not training enough new grad-
uates in the needed time frame" (Ref. 3: pp. 49]. With the
71
... . . . -. ,. .' . .,4-; ,',. .'. . , '. .. ', .'.. . ' - . ..| !

engineering job market as copetitive as it is and the
government's traditionally low pay, U.S. Waval Shipyards
will not stand a chance at any of the "best and the
brightest" engineers unless they can offer an opportunity to
work with the latest technology in the engineering sciences.
& more troubling aspect of the problem, is the retention of
qualified personnel who have developed an expertise in U.S.Naval Ship design, ccnstruction, repair and overhaul. The
U.S. Navy simply cannot afford to loose this cadre of
personnel. This is not to imply that making the coaitment
to CID/CAN will ensure a steady stream of engineers, or the
retention of existing personnel, but I think it is one of
the most important and most overlooked benefits associated
with CAD/CAM.Quantification of the benefit is again through a
survey of all the users. Questions like "is it important toyou to work for an organization that is a leader in your
technical field?", cr "is (was) the Navy's involvement in
CAD/CAM a factor in your decision to stay with (or to join)
the U.S. Naval Shipyard Enninaring force?" would give some
indication as to how important, from a human resource point
of view, it is for the Navy to pursue CAD/CAR.
D. OTHER BBNEFITS
This section deals with the remaining benefits from
Table III that do not see to fit into the tangible measure-
sent framework, or the intangible survey framework. Eachbenefit will be discussed and an appropriate quantification
method suggested.
* 1. leadiam ahterial FAa&s
This benefit deals with the reduction of wastematerial generated fzcm flat pattern cut-outs. The use of
72
.I- o . o -. . .- . . . .. . .

-. a.k~ ~L~Z~ Pkb -~- A Jll-& NN IC A1 7" -P'' . ' V~ X-07 7 77 - P'* w-.
pattern layout optimization programs and numericallycontrolled flame cutting techniques should reduce the amount
of scrap produced. Quantification is relatively easy, by
measuring the amount of waste material generated. This
amount can be converted to a "percent waste" which can be
compared to previous waste data for an indication of waste
reduction.
2. Ha E91ag koad PluctualIn
The next benefit discussed leals with the proverbial
problem of "crisis management--the problems of unantici-pated work associated with impossible deadlines. The resultof this unanticipated tasking is a lot of overtime labor and
"farming-out" of projects that cannot be accomplished inter-
nally. I reduction in overtime would save money as would areduction in the number of farm-outs.
Quantification of the benefit can be accomplished by
counting the number and cost of the projects farmed out as
well as the amount of overtime being generated. The cost of
farm-outs will have to be corrected to some base yeardollars, but once that is done it will give an indicator in
dollars of improvements in farm-out reduction. k usefulstatistic can be found by counting the number of farm-outsin a fixed time frame and then dividing that by an index
project load. An example would be faram-outs per year per100 projects which would reflect the influence of workload
in the decision to farm-out.
3. P ~~ Aliianas±Jn
% This benefit simply addresses the gain in floor
space attributable to the digital storage of drawingsinstead of the current methods. This will have the largesteffect on the archiving facilities as their current micro
form storage is replaced by magnetic tape, hard disk, or
73
*''.," .'',"q"" "." .' ". " , - . . . -- -. - - ' uI - ~ .'. ... .j

,T!
optical disk mediums. At the Shipyard level the benefit
will also be in square-foot savings, but on a much smaller
level. I suspect any initial savings in storage will be
offset by the space requirements of the CID/CAM system.
* Quantification, if desired, can be accomplished with a
simple relationship that yields storage space required as a
function of the number and size of the drawings to be
stored.
4. =1 a~a =! g MO 21 10chLg129
This benefit deals with the advantages gained by an
organization, in this case the Navy, from being a leading
force in a technology. The most graphic example of this
advantage coes from the civilian computer market with the
IBM Corporation. There is little doubt that IBM is a
leading force in computer technology. Because of this lead-
ership, there is a great deal of interest by smaller compa-
nies software vendors, peripheral manufacturers, etc., to be
"IBM compatible." IBM, through their leadership, has in
effect created the defacto standard that others follow.
As was presented earlier, the U.S. Navy has a vested
interest in the CAD/CAN technology and the direction the
shipbuilding industry including repair/rework/overhaul is
proceeding in this ccuntry. If the Navy hopes to influence
that direction in their best interests, they will have to be
a leader in the field. The areas of the technology that
have already been identified to be in the Navy's best
interest are: (Ref. 22: pp. 20]1. Interoperability
2. Int erchangeabil ity
3. ft"Zg standardization
74K ,,.,. .... , .,-..-.. , / . ,,,, - % - -. ,,,, ,- , , ,. , ,. . . ., .,....- ,,
4a. 1e tronic trau ferrence of all data, initiallyen gineering (ate throughout the MaterialCommand.a) Shipyazds (public and private)
b) Contractors
c) Ordnance Labs
d) Naval academia (USN&A, PS)
a) AUl Systems Commands
f) Potentially all Navy
Quantification of this benefit cannot be accom-
plished with measurements or surveys as it is simply too
broad a concept to pin down. It must be left up to the
reader at this point to visualize the entire technology,
CAD/CAB today. CIDffsm tomorrow, and in his or her own mind
realize the tremendous potential presented.
I. sunial
I hope that in this chapter you have seen the pieces of
a methodology designed to measure the benefits from the
interim CAD/CaB System as well as a method that could be
extended to measure the benefits of future developments in
the technology. The next chapter will put the pieces
together in a formal statement of the methodology and how it
can be applied to the current shipyard environment.
75
u ii I " i = ' + + = + • : + + '+ - -- + L +31 " _' , ,+--kl, Jl,.' A % %.+. %l ', I _ i.

Jr.° 9Jl_ . I V VWL _ . .L' 7 . J -- Z 7 7 . 777. 7
~vI. IMAI, U121211hO
A. OVERVII
The proceeding chapter defined the pieces of Grahlman's
method. This chapter will put those pieces together
resulting in a sort of "road map" that describes how the
user would implement the method. As stated before, the
method has three distinct parts:
1. Tangible Benef it Analysis Using The GenericFramework
2. Intangible Benefit Analysis
3. "Other" Benefit AnalysisEach part has its own data collection and analysis techni-ques which will be detailed in this chapter.
3. TANGIBLE BENEFIT ANALSIS USING THE GEERIC FRNEVORK
* 1. all1 Q2.1Jin
The generic model developed for quantification of
the tangible benefits requires an estimate of the time it
takes to accomplish the project using manual techniques. In
addition to this point, estimates of the longest (95thpercentile) and shortest (5th percentile) possible times arerequired to establish an approximation of the standard devi-ation of the original estimate. These estimates should bemade by the person most familiar with the project require-ments and most familiar with the time required to accomplish
the project using manual techniques. This person is mostlikely the shop supervisor. An alternative to this esti-
mating method would be to use the Computer-aided Time
Standards System, which is designed around the the Defense
Work easurement Standard Time Data (DIKSTD) (Ref. 23].
76

This contains time estimates for accomplishing various
tasks. I total project estimate could be determinad by
combining the estimates of its composite tasks. It is this
authors belief though, that the shop supervisor's estimate
would be more accurate. Unfortunately, no data currently
exists tc substantiate that belief.Further refinement of the productivity information
into the six key areas identified would require the indi--vidual users to make their own estimates of the time
required to accomplish the particular task manually. Highand low estimates could also be made and standard deviationscomputed.
Either method of estimating the manual time could beused depending on the user's goals for the benefit analysis.
For the Harch 1984 Naval materiel Command Report, the firstmethod is probably adequate. Actual collection of the time
estimates in either case could be accomplished automaticallyby responding to programmed query by the system at log-on or
by a data collection form that would accompany each project.
* Collecting the actual system time required tocomplete the project can be done automatically within the
system. When a user logs onto the system, the project andnature of the session, e.g., error checking and correcting,can be recorded providing a means of collecting data under
the heading "Accuracy." At log-off, the system can
automatically perform the required accounting
of user/project/subset information. again, the subsetinformation is nice to have, but not essential to the actualproductivity measurement. Thus far, we have the four piecesof data required to use the data reduction scheme for deter-
mining the uncorrected time savings per project. Use of thedata reduction scheme will be detailed in the next
subsection.
77
In m e k md .n mln4g-w k l~ .ln l.'.. ? , . , . .. ,, i . - . . , ..z
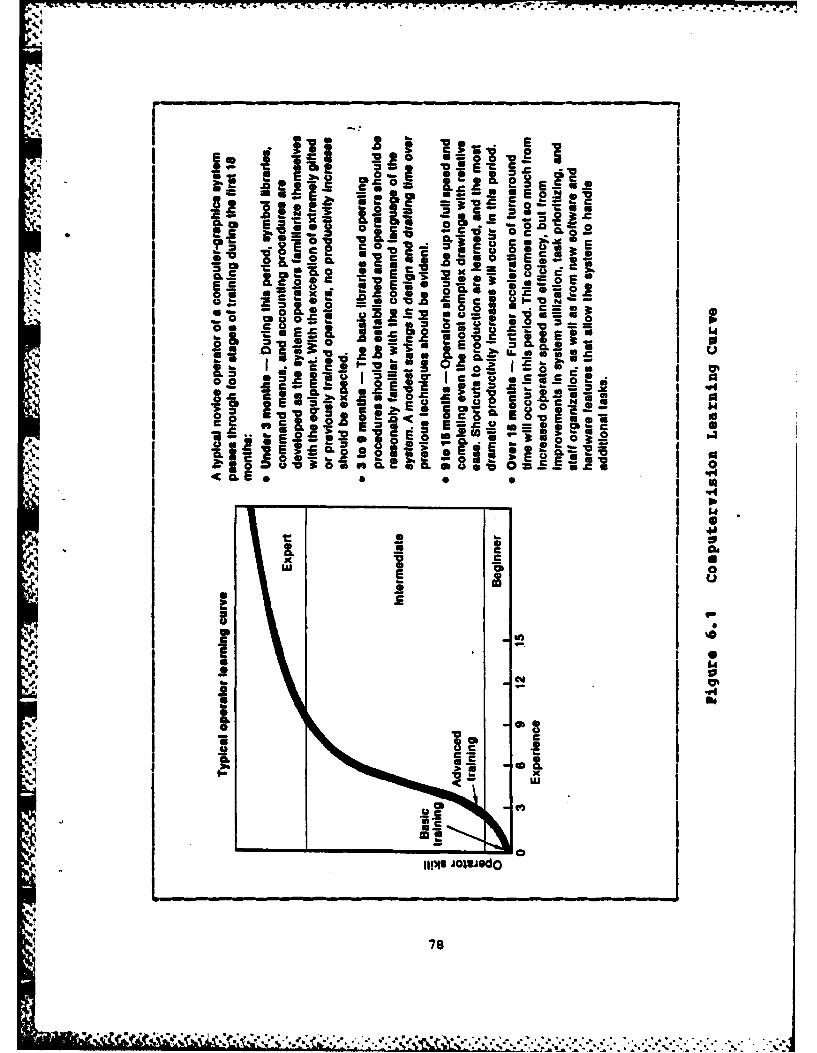
ID 'a E c .0 -. IN E cVc2 IA Cb a c~.0tj. E z 0 E O E
e 3 c aIva ~ co m
"I i ' 3 W- Ic 0 -
E c a wi~ 8 EE~ '.2 N
- - a - - -0
~~ CS Cs~ %. d ! .-a c
= a Ef 0.09IjS c ;S- =2 c=v- 0E c~ *s2
b. S- "4=~.~.
"' I a 14p
E .2 2' ..2 E c E
0 am
CLC
ax
'4 E
*IU Cc I
.4c I
v5. Uxd
.7u
78

To determine the corrected time savings, a userefficiency factor must be determinel. This is accomplished
with the user learning curve data supplied by the vendor.In the case of the Interim CAD/CAB System, that would beComputervision. In my research I was unable to obtain
specific data upon which Computervision based their CAD
system learning curve, Figure 6.1 [Ref. 24]. Although not
accurate enough to be used, it shows the general shape of
CAD/CAB learning curves. As shown in the figure, operatorskill (efficiency) is a function of experience (time) on thesystem. This relationship can be described mathematicallyand once determined, can be used to compute the desiredefficiency correction factor. Collection of this data can
either be done manually with the project data sheet orautomatically by the system.
2. iualyj,4
Analysis of the time data is accomplished through
the data reduction schemes previously shown. The firstscheme discussed is shown in Fiqure 5.3. In it, the timespent on a project per week per user is tracked across theduration of the project. Also available, but not requiredfor the computation of time saved, is system utilizationdata. At any stage cf the project the time spent per user
can be computed by summing that user's account on theproject to date. To compute the corrected time spent, eachweek's time must be multiplied by the applicable efficiencyfactor, in parentheses, before summing across the weeks foreach user.
Now, assume that the shop supervisor is the personestimating the manual times. To compute an estimate of thestandard deviation of the supervisor's estimate, the 95th
percentile is subtracted from the 5th percentile and divided
by 3.2 as previously discussed in Chapter 5. The total
79

system time required for the project is found by summing
across all the users. This is then subtracted from theestimated time to complete the project using manual techni-
ques, yielding a total time savings for the project and anestimate of its accuracy.
At this point, similiar projects are grouped intoapplication areas such as 2-D drafting, piping, etc. Thetotal time savings per application is found by summing
across all the projects in the group. To obtain an estimateof the standard deviation of this total time savings, thestandard deviations of each project are squared then summed
(the variance of a sum is the sum of the variances assuming
independence). This sun is converted back into a standard
deviation by taking its square root. This technique can be
applied to get the total time savings by summing ILU theprojects instead of by application group, if desired.
The second scheme includes the subsets and is shown
in Figure 5.4. Data reduction is essentially the sane,except each user has potentially six subset accounts that
must be tracked. If the user is estimating his own manualtimes, each subset will have an associated standard devia-
tion estimate. The subsets are then summed across the users
to get a total system time per subset. In this way, the
result is a total time savings per subset per project. Fromeither time savings (subdivided or not) productivity ratios
can be computed which could be useful in future economicanalysis involving CAD,/CAH in the shipyard environment.
80

C. INTANGIBLBENEFIT ANALYSIS
The intangible benefit data is collected from the
results cf a questicnaire customized to the shipyard anvi-
ronsent. The questions generated should cover the benefit
areas discussed in Chapter 5. The perceptions of thebenefits will differ with different groups of people. The
questions are grouped using the cluster analysis techniques
described in chapter 5 and Dopico [Ref. 17]. Once thegroups have been formed and the leftover "other" benefit
catagories identified, analysis of the results can begin.This analysis consists of submitting the raw data to a
boxplot routine which computes the median and quartiles.
This information is then displayed on a system comparison
plot sisiliar to that found in Figure 4.3.
D. "OTHEUU BENEFIT ANALYSIS
1. 21t. 7LLgco nj Anlysis
a. Tangible Benefits Not-Quantifiable Using the
Generic Pramework
Data for these benefits should be availablethrough the appropriate accounting branches. This data
should be collected and analyzed to determine if any reduc-
tion in waste material, farm-outs or overtime in theirrespective areas could be attributable to the Interim
CAD/CAR System.
b. Von-Quantifiable and Intangible Benefits
Data collection has already been accomplished
through the questicnaire. Analysis of this data will
consist of computing the means and standard deviations of
4 81

the samples, each question representing a sample. These
statistics and their contribution to the benefits they
describe should be thoroughly discussed.
it this point in the overall benefit analysis,the user of the methodology could discuss LU benefits notpreviously discussed. This will generally be in the form ofsubjective logical argument.
. SOIRNBY
k summary of the methodology is presented as a flowchart
shown in Figure 6.2. It is the hope of this author that the
methodology presented will establish a useful framework forthe systematic and thorough benefit analysis of not only the
Interim CAD/CAR System but also future systems catagorizedunder the acronym CIDBI.
,°
82
* V'",

_ i
A P
I Z 0L. t I.
I IL
' 83
.1.t, i ' 5\" . J ,2 ,-°- .; ''"-'-'" -." ',. '' .""""". ,"""""""":"""'.-''...-'. :z ., . . .v ',.,a ... ,,m I . o ,-I z--a ,
U . -. . •" ."-. ' ." .-',. - - .- - - '. . . . .- -. - - . - - -
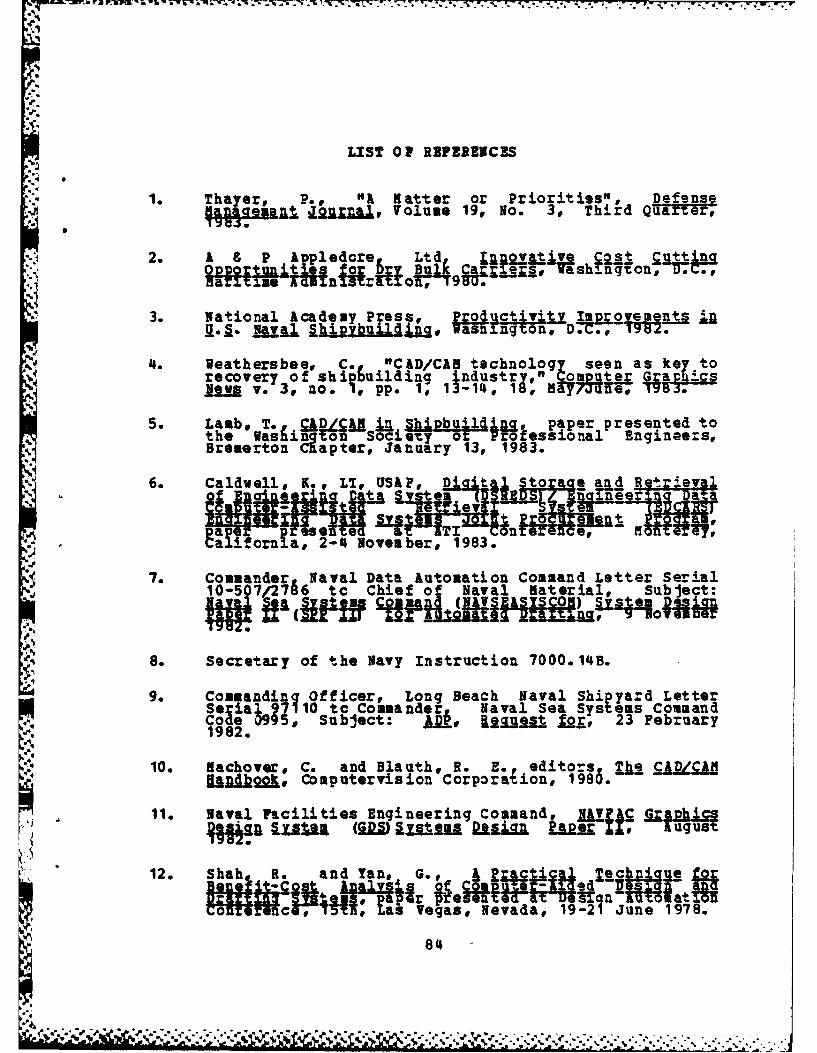
LIST OP REFERENCES
1. Thayer, P., "A atter or Priorities", DefensedanDp_ o Volume 19v No. 3, Third Quarer
2. A 8 P 4 Apledore Ltd, tovatv4ve Cost Cutt ga a a 9 nls8nrann .
3. National Academy Press, Productivi y Improvements.mJ. Ail Ihipbuld , Wag , D..,-7 .
4. Veathersbee, C., "CAD/CAM technology seen as key torecovery of shiibuilding industr oa e .
Sv. 3p, no. , pp. 1, 13-114, 18 ay/Jun 1V
5. Lamb, T.. QAIla 1hipbuldi a epaper presented tothe Nasng6 nSoci ry or roess onal Engineers,Bremerton Rapter, January 13, 1983.
6. Caid ell, Kw oaiSAon D togaas an d R tr Val
of Secay o h ayIstrcin00.l.
5_ela _9_7110 -tcoaae svaSaSses sa
i ~r a
Maora, -c .- 4 November, 1983.
7. Commander Naval Data Automation Command Letter Serial10-507/2766 to Chief of Naval Material, Sbje t
8. Secretary of the Navy Instruction 7000. 14B.
9. commanding Officer, Long Beach Naval Shipyard LetterSeiial- 97110 to Commander Naval Sea Syst ems CommandCode 0995, Subject: ljfl, i.2(auest fLRw 23 February
10. Machover,0 C. and Blauth R E. edito -2Je CD/C.kflA w Computervision Coiporaiionw 1 98 5
11. Naval Facilities Engineering Comand, NAP~ Qa~hsDAMn911 (UMl anu-19 iILU pa Ag -s
12. Sha R. and TantG r"i9 1chD1A4sMa-M41 * %in ITT5 mat o
Y1Fnc~w #as Vegas, Nevada, 19-2~ June 1978.
811-

13. Camuti Rsrc cho ILCorpo ation, AO
14. Packer 11. , and Guartzman, &a ka Eaut of theEfec Qf Q-RVt.IIkjdg 0sI~q VC1 -k uIernce &nafi~Ft. -' e P9ap
1;7 June 1982.
15. Packerp g. Boo "Measuring the intangible inProductivtty"Zachol 3jv ,V 6 p.4-7bkt/Har 1983. 1g .8pp.4-7
16. Packer, No., and Kahn, Z., M& t-j Stud of 2 he
3une 1983.
18. Cronbach, Lop and others, DS~ndabilitv -ofBeauJ.ri inniUnL2. John Viy F, son,4' 172
19.' McNeil, D., ineatv 21~ knlysisp John WileySons, 1977.
*20~. Schulz, Jo. -A kP1~ &kDghf + dIA~ 1DtITI n:IR~e Hotry Iti2Ei~n rnfla, 2-4 November,
1983.
21. Hoder, .p Phil s, C., Davis R. P~jc anqmn
22. Leahy, J., Capt., USe Steering committee Brief, Naval-~ Sea systems Command, March 8, 1 983.
23. Department of Defense, Manual 5010.15.1-N,St As~L~jga j j;r, jIasuL3.Il, 1974.
24. BlauthfiIa and Preston, 3. " Cornuting the Paybackfor ~ ~ ~ .M C~"~~~~ 0 Lgust 1981.
85
'p%
INITIAL DISTRIBUTION LIST
No. Copies
1. Defense Technical information Center 2Cameron tationAlezand-. a, Virginia 22314
2. Librjr;Code Q142 chool 2laval ost raduate SChoonterey, galifcrnia 93943
3. I ecretari of Defense
(5aIper Reserve &ffa trs and Lo stics).v1 a' orsonnel Pol. cyRoom 3 D 364 Penta onVashington, .C. 29301
4. Ccumander Naval Sea Systems Command 2Cavy DepartmentCAPT.Joan F. Leahy III USN, PBS-309Vashington, D.C. 20361
5. Ron BfundeSdo 244 1Hare Island aval Shi adVallejc# Ca fornia 5M
6. Dr. Peter C.C. an , Code 531G 1Department of. atha, a 0 csNava Postgraduate schoolHonterey, Califernia 93943
7. Leonard 3. Shea IComputer Resource Technology Corp.271 1?ourth AvenueSan Dzego, Ca4ffclrnia 92103
8. Ricbard B. Grahiman, LCDR, USE 41320 Spruanc RoadHonterey, Ca !fcrnia 93940
86

*FII
4 1r
~1 II All
iv % 1;.
pr1 fJ w , itI .,,1olrwwIv wqn


![Principles and Standards for Benefit–Cost Analysis] Introduction- Professionalizing Benefit–Cost Analysis](https://static.fdocuments.us/doc/165x107/56d6beb21a28ab30169333bb/principles-and-standards-for-benefitcost-analysis-introduction-professionalizing.jpg)


