
Beneficiation – Concentration
32
Sponsored by: CHAPTER 12 Beneficiation – Concentration
Transcript of Beneficiation – Concentration

Sponsored by:
CHAPTER 12
Beneficiation – Concentration
SPONSOR PROFILE
Mineral Technologies is a recognised leader in mineral processing solutions worldwide.
Throughout our 70+ year history we have delivered a comprehensive range of integrated equipment and services that cost-ef fectively transform orebodies into high-grade mineral products for customers.
Today, our commitment continues with the ongoing release of an expanding range of minerals testing, plant design and mineral separation equipment solutions across the industrial minerals, iron ore, coal and metals market sectors.
Our core capabilities include:
• mineral testing and process design
• process plant design
• process optimisation
• design, manufacture and supply of mineral processing equipment
• equipment commissioning and training.
A key element of our ongoing commitment is close collaboration with customers in the development of innovative equipment and services to meet specif ic mineral processing needs. This has resulted in long-standing customer relationships, of ten developed during the upgrading and expansion of existing
mineral processing operations, and the establishment of signif icant new equipment installations worldwide.
In addition to our collaborative approach, we proactively research and develop new equipment designs, manufacturing materials and technologies to continually improve throughput, grade and recovery, equipment durability, overall safety and environmental outcomes that deliver cost-ef fective solutions for our customers.
Underpinning our design exper tise is our extensive operational knowledge gained from regular access to processing plants, combined with our broad range of proprietary equipment and service of ferings. This unique combination enables our engineering teams to go beyond delivering standard engineering outcomes.
Our Australian manufacturing facility houses the world’s largest spiral manufacturing facility and produces over 20 000 star ts annually. In 2010/11, we manufactured HC33 and WW6 spirals for Arcelor Mit tal’s Mont Wright mining operations in Canada to deliver the largest single order for spirals in our history.
Our head of f ice, based in Australia, suppor ts a network of of f ices located in South Africa, India and Nor th and South America. Our teams operate within an international engineering and supply strategy that enables us to successfully work with customers anywhere in the world.
CHAPTER CONTENTS
Gravity concentration 267
Advantages 267
Suitability 267
Mineralogy 268
Test work 268
Flow sheet design 270
Jigs 271
Spiral concentrators 273
Shaking tables 274
Centrifugal concentrators 276
Sluices and strakes 279
Magnetic and electrostatic separation 280
Feed characterisation 280
Equipment description 280
Equipment selection 280
Cost estimation 283
Worked examples 283
Flotation 286
Data requirements 286
Jameson cell operation 287
Mechanical cell selection 288
Cost estimation 289
Worked examples 289
Lifetime costs of cells 291
Summary 291
Ore sor ting 291
Sorting machines 291
Sor ting mechanics 292
Cost estimation 293
Acknowledgements 293
References and fur ther reading 293

CONTRIBUTORS
First edition text by: M Millard, R Barbagallo, N Dawson, B Ruggiero, P Baily and R Dudgeon
Revised and updated by:
Damian Connelly FAusIMM(CP), Director / Principal Consulting Engineer, Mineral Engineering Technical Services Pty LtdAlexander (Sandy) Lewis-Gray, Technical Director, Gekko SystemsDenis Yan MAusIMM, Consulting Metallurgist, Mineral Engineering Technical Services Pty Ltd
Cost Estimation Handbook 267
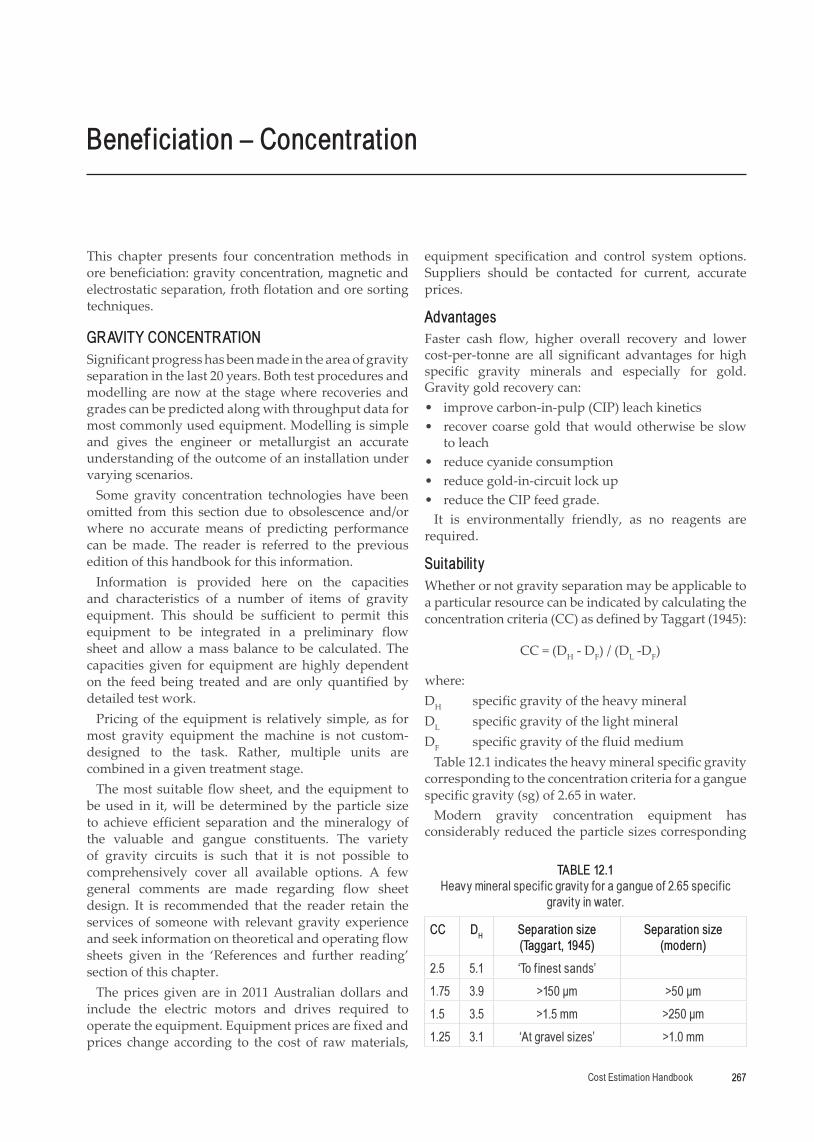
This chapter presents four concentration methods in ore beneficiation: gravity concentration, magnetic and electrostatic separation, froth flotation and ore sorting techniques.
GRAVITY CONCENTRATIONSignificant progress has been made in the area of gravity separation in the last 20 years. Both test procedures and modelling are now at the stage where recoveries and grades can be predicted along with throughput data for most commonly used equipment. Modelling is simple and gives the engineer or metallurgist an accurate understanding of the outcome of an installation under varying scenarios.
Some gravity concentration technologies have been omitted from this section due to obsolescence and/or where no accurate means of predicting performance can be made. The reader is referred to the previous edition of this handbook for this information.
Information is provided here on the capacities and characteristics of a number of items of gravity equipment. This should be sufficient to permit this equipment to be integrated in a preliminary flow sheet and allow a mass balance to be calculated. The capacities given for equipment are highly dependent on the feed being treated and are only quantified by detailed test work.
Pricing of the equipment is relatively simple, as for most gravity equipment the machine is not custom-designed to the task. Rather, multiple units are combined in a given treatment stage.
The most suitable flow sheet, and the equipment to be used in it, will be determined by the particle size to achieve efficient separation and the mineralogy of the valuable and gangue constituents. The variety of gravity circuits is such that it is not possible to comprehensively cover all available options. A few general comments are made regarding flow sheet design. It is recommended that the reader retain the services of someone with relevant gravity experience and seek information on theoretical and operating flow sheets given in the ‘References and further reading’ section of this chapter.
The prices given are in 2011 Australian dollars and include the electric motors and drives required to operate the equipment. Equipment prices are fixed and prices change according to the cost of raw materials,
equipment specification and control system options. Suppliers should be contacted for current, accurate prices.
AdvantagesFaster cash flow, higher overall recovery and lower cost-per-tonne are all significant advantages for high specific gravity minerals and especially for gold. Gravity gold recovery can:
• improve carbon-in-pulp (CIP) leach kinetics • recover coarse gold that would otherwise be slow
to leach • reduce cyanide consumption • reduce gold-in-circuit lock up • reduce the CIP feed grade.It is environmentally friendly, as no reagents are
required.
SuitabilityWhether or not gravity separation may be applicable to a particular resource can be indicated by calculating the concentration criteria (CC) as defined by Taggart (1945):
CC = (DH - DF) / (DL -DF)
where:DH specific gravity of the heavy mineralDL specific gravity of the light mineralDF specific gravity of the fluid medium
Table 12.1 indicates the heavy mineral specific gravity corresponding to the concentration criteria for a gangue specific gravity (sg) of 2.65 in water.
Modern gravity concentration equipment has considerably reduced the particle sizes corresponding
Benef iciation – Concentration
TABLE 12.1Heavy mineral specif ic gravity for a gangue of 2.65 specif ic
gravity in water.
CC DH Separation size (Taggart, 1945)
Separation size (modern)
2.5 5.1 ‘To f inest sands’
1.75 3.9 >150 �m >50 �m
1.5 3.5 >1.5 mm >250 �m
1.25 3.1 ‘At gravel sizes’ >1.0 mm
CHAPTER 12 – BENEFICIATION – CONCENTRATION
Cost Estimation Handbook268
to the concentration criteria given by Taggart (1945). These modern values should be viewed in the context that in commercial practice the concentration criteria (CC) can be improved through the use of heavy media separation techniques for particles over 500 μm (Wills, 1989). Advances in the new range of centrifugal gravity devices such as the in-line spinner; Knelson centre discharge (KC-CD) and extended duty (KC-XD) batch concentrators and continuous variable discharge (CVD) semi-continuous concentrators; Falcon semi-batch (SB), continuous (C) and fine (F) continuous concentrators; the multi-gravity separator and the Kelsey centrifugal jig have also improved CC. All of these machines can increase recovery efficiency at lower concentration criterion for finer particles.
MineralogyMineralogy determines the amenability to gravity processing. The following characteristics of the minerals present are particularly important:
• composition • degree of liberation • density differential • hydrophobicity • particle shape • particle size.Characterising the feed is the first basic step
in determining the most applicable separating equipment and developing the optimum flow sheet. Characterisation techniques include:
• optical microscopy of polished sections – useful but limited
• QEMSCAN – new technology replacing optical microscopy
• heavy liquid separation – useful especially for gold because the major problem with gold is locating sufficient numbers of particles confident that these particles represent gold occurrence
• scanning electron microscopy and gold analyses combined with diagnostic leaching – useful in understanding the nature and occurrence of the gold present; for example, the size varies from colloidal through to nugget gold, metallic gold is common, gold occurs as alloys with other metals and within sulfides.
Sample representivityRecovery based on non-representative samples is a major issue. At Mt McClure, recovery was miscalculated so a gravity circuit was installed immediately. The presence of nugget gold at Bronzewing and Granites Gold made it extremely difficult to predict likely gravity gold recovery using small test samples. The presence of sulfides (galena) and tramp iron can cause problems when cleaning up gravity concentrates for tabling. In a number of cases, gravity recoverable gold (GRG) analysis overestimated the gravity gold
recovery by some 30 per cent because of the way the test work was undertaken or interpreted. If too little of the recirculating load is allowed to be bled to the primary recovery circuit, or the primary unit is failing to perform because feed is too coarse, too dense or producing flakes, recoveries will not be achieved.
Proper sample selection, planned laboratory test work and experienced interpretation of the test work form the basis of process selection. As a minimum, test plans should include gravity test work on samples selected spatially throughout the orebody to determine the range of recoveries encountered. Test work should target samples widely dispersed throughout the oxide, transition and primary zones. Samples need to be obtained with greater definition for ores such as laterite, coffee rock, pisolite and saprolite.
Composites are not recommended, as variability of recovery is hidden. Rather, geometallurgical modelling techniques are recommended as they can directly reduce the risks associated with meeting production targets. The samples should have designated coordinates so the recovery can be assigned to a location in the block model and be used in the mine schedule. These data will be used in conjunction with the variability data and support the recovery predictions used for a particular orebody. Geometallurgy can be used to identify:
• concentration of deleterious elements • drillability • fragmentation • grindability • hardness • metallurgical recovery • mineral liberation • mineral species and mineral grade • mining recovery • reagent consumption • smelter-enabling characteristics.Electronic data can be used to evaluate various
scenarios based on comminution and ore recovery. Hence, geometallurgy can identify the likelihood of an unwanted event and the consequences, thereby permitting risk mitigation to be put in place.
Test workInterpretive techniques have advanced in the area of particle liberation in ores to the point where the minerals’ natural grain sizes and construction can be relatively simply reviewed in a piece of drill core. There are several technologies such as scanning electron microscopy coupled with mineral liberation analysis (MLA) and QEMSCAN to achieve this. Also, three-dimensional (3D) tomography can give a 3D view of the ore with grain boundaries clearly defined and discrete particles described and characterised. Particle shape plays a very large role in gravity separation and this can be explored by 3D tomography and taken into account in modelling.
Cost Estimation Handbook 269
CHAPTER 12 – BENEFICIATION – CONCENTRATION
Heavy liquid separation (HLS) is an excellent predictor of the potential for gravity concentration. Typically, HLS using tetrabromoethane provides yield, recovery and quality of the concentrate.
For gold, the typical GRG test work is to grind a 25 - 100 kg sample through three successively finer sizes (P80 of 850 μm to 75 μm) and between each step passing the tailings reground sample through a batch laboratory scale Knelson concentrator to recover gold liberated (Laplante, 2000). A single P80 75 μm GRG can also be undertaken, but this is not as accurate and does not provide any liberation data. Note that GRG predicted by this method will not reflect typical plant recovery, as 100 per cent of the GRG is recovered from the sample but only a portion of the feed is typically processed in an industrial centrifugal concentrator. Hence, only a portion of the total GRG is recovered. As with other GRG test work, over-prediction must be allowed for.
Intensive leaching of the concentrates in either a Consep Acacia or Gecko in-line reactor is typically carried out and very high gold recoveries are usually obtained.
Interpreting gravity recovery results requires a skilled person who can relate the results to plant practice. Consultation with the vendors is also very useful to ensure the correct conclusions are drawn and current pricing information is obtained.
The test work required to approximate a flow sheet varies considerably with the type of ore processed, as follows.
Gold alluvialsMetallurgical testing and ore grade determination form part of the same exercise. Due to the nugget effect, the size of sample that must be taken to achieve adequate sampling accuracy extends to several tonnes. Bulk sampling equipment is mandatory. The only matter requiring metallurgical resolution is whether exceptionally coarse or fine gold is present, as this would escape a gravity roughing stage and require separate treatment. To detect abnormally coarse gold, some test rigs are equipped with a metal detector on the trommel oversize belt. For fine gold, reliable assays can be obtained on samples of the fine fraction of the tailings due to the reduced nugget effect and concentration of the gold in this fraction by screening.
Other alluvialsTin and tantalite alluvials and beach sands are usually sampled with equipment such as Calweld or Banka drills. Material from these samples can be parted and subjected to the usual mineralogical analysis, which indicates the size distribution of the valuable mineral and more significant gangue components.
Hard rock oresThe minimum information that is required is detailed mineralogical examination and heavy liquid test work
on rolls-crushed core samples to a size determined by the mineralogy, normally 1.5 to 6 mm. The heavy liquid test work indicates the size at which the valuable mineral becomes liberated. When combined with mineralogical examination of the products, it gives a first indication of the primary grind and the regrind size at which a high recovery and/or a saleable concentrate grade is achieved. Plotting these results as a liberation curve is a valuable tool in determining whether gravity techniques are applicable. However, heavy liquid analysis will not in itself indicate whether gravity separation is practical.
Hard rock gold ores
When a gold ore is to be treated solely by gravity the comments in the preceding paragraph apply. However, more frequently gravity concentration is considered to prevent a build-up of coarse gold in the grinding circuit, reduce downstream operating costs and ensure slow-leaching coarse gold particles do not report to the tails of the leach circuit.
The performance of a batch centrifugal concentrator (BCC) in the milling circuit can be predicted using a combination of GRG test work results and modelling by either the manufacturers or by a model produced by the AJ Parker Centre in Perth, Western Australia.
The GRG content of the ore can be determined in a test developed by Laplante (2000) where 25 to 100 kg of ore sample is passed through a laboratory scale BCC and the concentrate and tailings analysed for gold content by size. The test can be carried out in three stages (most comprehensive) or as a single-stage test. The critical information required for design purposes is the concentrate mass as a percentage of the overall mass. The concentrate is assayed by size to indicate the gold deportment.
The GRG results can be input into various models to give an indication of gold recovery at varying machine sizes and percentage of recirculating load treated to determine the expected full-scale performance. Typically the full-scale performance will be between 60 and 80 per cent of the GRG result.
The performance of the low-gravity separators such as jigs and spirals is machine-specific. The manufacturers should be consulted to ensure the correct procedures are followed and data are generated to enable equipment sizing.
CoalThe response of a coal deposit to gravity separation is more easily quantified than other applications due to the ability to categorise the washability by carrying out heavy liquid tests at small specific gravity (sg) increments over the entire range of the coal and ash components of the feed. Provision of this information to an equipment supplier or reference to the treatment flow sheet for a similar coal permits a probable error of separation or Ecart probable (Ep) value to be predicted
CHAPTER 12 – BENEFICIATION – CONCENTRATION
Cost Estimation Handbook270
for specific equipment. Ep can then be used in modelling software to predict yield and product quality.
PilotingPiloting is rarely undertaken for greenfields gold project circuits. It has occurred for chromite, metallic copper or in additional specific applications where there was uncertainty. Piloting is common for brownfields projects or where retrofitting of equipment is being considered. For gold, batch testing using a Knelson or Falcon concentrator may be done. Gekko may undertake testing using the in-line pressure jig (IPJ) where very coarse gold is present.
Flow sheet designIt is only intended to discuss gravity circuit flow sheet design in very general terms due to the great variety of applications and the uniqueness of each resource. The guiding principles of all mineral dressing circuits apply:
• remove the valuable mineral as soon as it is liberated at the coarsest possible size
• reject barren or tailings-grade material as soon as it is generated and at the coarsest possible size.
The most complex gravity circuits are associated with hard rock deposits but the design principles involved for hard rock apply to any other gravity separation operation, as follows:
• For gravity processes, feed preparation is critical for efficient operation. The comminution circuit should be designed to minimise fines generation particularly when the valuable mineral tends to form slimes, as with cassiterite. This usually involves ball milling with a high circulating load if fine grinding is required.
• High recirculating loads of gold into the mill should be avoided, as flat flakes can be produced and these are not as amenable to recovery.
• Ideally the ball mill circuit should be closed with screens rather than hydrocyclones, which tend to concentrate heavy minerals in the underflow, resulting in overgrinding. The exception to this is gold, where the concentration in the underflow benefits the performance of centrifugal concentrators. It is reasonable to use screen apertures down to 0.15 mm. For example, Derrick screens give undersize streams with an 80 per cent product passing size (P80) less than 100 μm. Given a lower limit for many gravity operations of around 50 μm, it is nearly always possible to use screens for primary classification.
• Feed must be classified into different size fractions for efficient gravity separation and to remove slimes. Wills (1989) noted that the presence of slimes increases the viscosity of the slurry, which reduces the sharpness of separation. Therefore, it is usual to remove particles less than 10 μm from the feed.
• A single separator cannot treat a broad particle size range. Many items of gravity equipment like jigs rely on differential free or hindered settling rates between gangue and valuable mineral particles. Above a certain particle size spread, the coarsest light or low-density particles will have a greater settling rate than the finest heavy mineral particles.
• Greatest separation efficiency is obtained by using a large number of narrow size ranges. However, capital cost and operational considerations impose a practical limit that depends on the scale of operation and mineralogy of the specific deposit.
• As a general rule-of-thumb, a factor of two between the finest and coarsest sizes in a given fraction is an upper limit for tin, tantalite and tungsten hard rock concentrators at sizes less than 500 µm. At subscreen sizes these classifications are usually achieved in single or multiple spigot hydrosizers, cyclones or teeter columns. In the case of multiple spigot hydrosizers, the desliming operation can be carried out in the same piece of equipment.
• It is evident from the above that material classified by screens is effectively treated on any type of gravity device while products from hydraulic classification processes are most successfully treated on flowing film equipment and centrifugal concentrators.
• When gold is the valuable mineral, the size range that can be treated is greatly increased because of the higher specific gravity differential from the gangue.
• When there is a degree of natural classification of the resource, as in some alluvials, the number of size fractions to be treated is much reduced.
• Gravity equipment often has an optimal feed solids concentration. Typically, significant volumes of good-quality water are required. Therefore, the overall water management scheme for the concentrator requires considerable attention during detailed engineering. Although water rejection from a gravity circuit is often economically achieved by cyclones, in complex flow sheets a certain amount of buffer capacity in density tanks or thickeners makes the plant easier to control.
• Poor quality water may necessitate reverse osmosis plants or vacuum distillation units using waste heat from powerplants for centrifugal concentrator fluidising water.
• Apart from alluvial operations, few concentrators rely solely on gravity separation. They are often accompanied by flotation, magnetic separation, leaching or other metallurgical processes.
• One area where design concepts are changing is in the treatment of the finest size fractions (5 to 50 μm) from hard rock deposits. These fractions are typically treated using flotation. The flotation concept is now being challenged by a new generation of higher capacity gravity devices capable of separations at
Cost Estimation Handbook 271
CHAPTER 12 – BENEFICIATION – CONCENTRATION
these fine sizes, such as the multi-gravity separator, the Knelson concentrator and the Kelsey centrifugal jig. These machines use high apparent gravitational field techniques and appear on the verge of being accepted as fully developed production machines.
• The introduction of centrifugal concentrators was the single largest positive change in gravity flow sheets. The use of up to 200 g force results in higher recovery of gold at the finer sizes. This was followed by the change from a bleed of the mill discharge to a bleed of the cyclone underflow. The latest trend has been to treat cyclone feed rather than cyclone underflow because of higher gold recovery.
• The vast majority of centrifugal concentrators today are used in recirculating loads in gold grinding circuits for the recovery of free gold. Partial recoveries down to 10 μm are observed while recoveries in the size range 50 to 1000 μm is where these units excel.
• As machines became larger and able to process a greater percentage of feed, there was a move towards automatic discharge that allowed the concentrate to flow by gravity to a hopper in the goldroom, thereby restricting access and theft.
• New developments are frequently trialled in applications that have failed to be satisfactorily resolved by conventional techniques. A limited amount of information is available on the application of these new technologies to standard duties. Pricing data on this new technology is also preliminary and subject to significant change as manufacturing procedures become established. For these reasons it is recommended that consideration of new technologies in the prefeasibility assessment of a resource should be made through the suppliers directly.
JigsJigging is one of the oldest methods of gravity concentration but is still widely used today. This section presents mineral jigs and jigs for other applications.
Mineral jigsCurrently jigs are predominantly used for processing alluvials of all types where they can perform both roughing and cleaning duties. The most frequent circuit configuration encountered in practice is for the concentrate from a two or three-cell primary jig to be cleaned in a two-cell secondary jig. For gold applications the secondary jig concentrate can feed a centrifugal concentrator or Knudsen concentrator.
For some gemstone applications, product is also recovered from the top of the primary jig screens.
If significant valuable mineral occurs below the jig’s recovery size limit then an additional circuit is required to treat the fines. This circuit typically comprises spirals or, in the case of gold, Knelson concentrators.
According to Wills (1989), good separations of a fairly narrow specific gravity range (eg fluorite sg 3.2 from quartz sg 2.7) are achieved using jigs if the feed is fairly closely sized, such as 3 - 10 mm. When the specific gravity difference is larger, good concentration is possible over a wider size range. According to Campbell (1991) the typical effective operating range is from 100 μm to 16 mm and that the treatment of +16 mm material is carried out in a separate circuit to a top size of over 30 mm.
Square mineral jigs come in sizes from 300 mm square to 1200 mm square. According to Campbell (1991), they have a capacity of approximately 10 m3/h/m2 whether the cells are arranged as a single cell or two cells in series with a hutch water requirement of 22 m3/h/m2 for each cell. Jig feed is normally in the range 30 - 70 per cent solids and it is frequent practice to put a dewatering cyclone on the jig feed. It must be stressed that there are significant variations from this feed rate criterion depending on the material being treated.
It is usual on a clean placer feed to use two jig cells in series for each concentration stage. For fine feeds there is a reduction in jig efficiency, which may require a third cell.
Heavy clays resulting in a high slimes content cause a large reduction in separation efficiency, requiring additional cells and reduced throughput to obtain satisfactory recoveries.
Single cells are seldom used; an exception is for the treatment of +16 mm material in deposits with very coarse gold.
In addition to the treatment of alluvials, jigs are used to treat coal and hard rock ores where they find application at coarse sizes in the region of 700 μm to 12 mm (hard rock) and 400 mm (coal). Reichert cones and spirals, although they will handle material up to 3 mm, are most efficient below 1 mm so that jigs can be used to recover values liberated at coarser sizes.
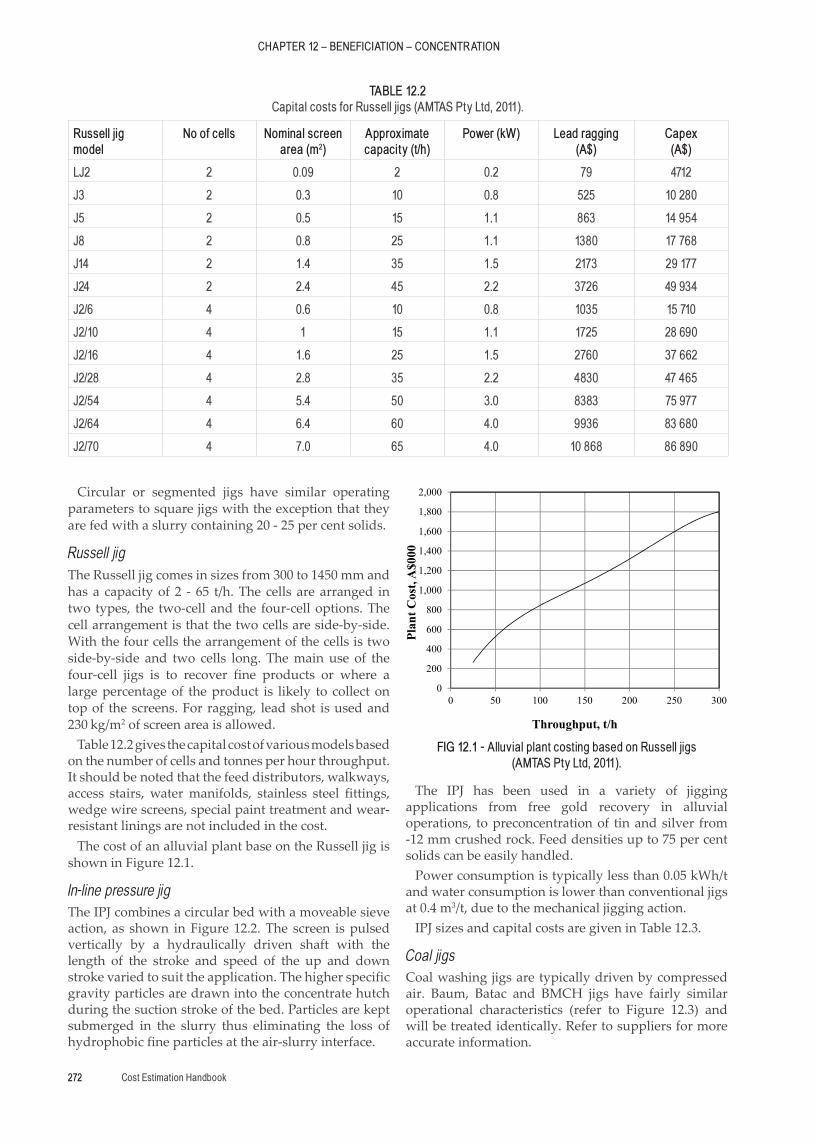
The costs and power consumptions of different configurations of square jigs are shown in Table 12.2.
In very approximate terms, jigs recover around ten per cent of the feed weight to a ten per cent solids concentrate (hard rock). However, this will be highly variable with the jig operating settings, ragging material used and ore processed. For cleaning stages the weight recovery is up to 20 per cent.
For larger scale alluvial operations circular jigs are used. The cells in these jigs are configured as the segments of a circle with central feed point and circumferential tailings collection. The largest of these jigs has an area of about 42 m2 comprising 12 cells and treats 150 - 300 m3/h. This represents a slightly lower throughput per square metre than a square jig. Note that the segmented cells of a circular jig are approximately equivalent in performance to two square jig cells in series.
CHAPTER 12 – BENEFICIATION – CONCENTRATION
Cost Estimation Handbook272
Circular or segmented jigs have similar operating parameters to square jigs with the exception that they are fed with a slurry containing 20 - 25 per cent solids.
Russell jigThe Russell jig comes in sizes from 300 to 1450 mm and has a capacity of 2 - 65 t/h. The cells are arranged in two types, the two-cell and the four-cell options. The cell arrangement is that the two cells are side-by-side. With the four cells the arrangement of the cells is two side-by-side and two cells long. The main use of the four-cell jigs is to recover fine products or where a large percentage of the product is likely to collect on top of the screens. For ragging, lead shot is used and 230 kg/m2 of screen area is allowed.
Table 12.2 gives the capital cost of various models based on the number of cells and tonnes per hour throughput. It should be noted that the feed distributors, walkways, access stairs, water manifolds, stainless steel fittings, wedge wire screens, special paint treatment and wear-resistant linings are not included in the cost.
The cost of an alluvial plant base on the Russell jig is shown in Figure 12.1.
In-line pressure jigThe IPJ combines a circular bed with a moveable sieve action, as shown in Figure 12.2. The screen is pulsed vertically by a hydraulically driven shaft with the length of the stroke and speed of the up and down stroke varied to suit the application. The higher specific gravity particles are drawn into the concentrate hutch during the suction stroke of the bed. Particles are kept submerged in the slurry thus eliminating the loss of hydrophobic fine particles at the air-slurry interface.
The IPJ has been used in a variety of jigging applications from free gold recovery in alluvial operations, to preconcentration of tin and silver from -12 mm crushed rock. Feed densities up to 75 per cent solids can be easily handled.
Power consumption is typically less than 0.05 kWh/t and water consumption is lower than conventional jigs at 0.4 m3/t, due to the mechanical jigging action.
IPJ sizes and capital costs are given in Table 12.3.
Coal jigsCoal washing jigs are typically driven by compressed air. Baum, Batac and BMCH jigs have fairly similar operational characteristics (refer to Figure 12.3) and will be treated identically. Refer to suppliers for more accurate information.
TABLE 12.2Capital costs for Russell jigs (AMTAS Pty Ltd, 2011).
Russell jig model
No of cells Nominal screen area (m2)
Approximate capacity (t/h)
Power (kW) Lead ragging (A$)
Capex (A$)
LJ2 2 0.09 2 0.2 79 4712
J3 2 0.3 10 0.8 525 10 280
J5 2 0.5 15 1.1 863 14 954
J8 2 0.8 25 1.1 1380 17 768
J14 2 1.4 35 1.5 2173 29 177
J24 2 2.4 45 2.2 3726 49 934
J2/6 4 0.6 10 0.8 1035 15 710
J2/10 4 1 15 1.1 1725 28 690
J2/16 4 1.6 25 1.5 2760 37 662
J2/28 4 2.8 35 2.2 4830 47 465
J2/54 4 5.4 50 3.0 8383 75 977
J2/64 4 6.4 60 4.0 9936 83 680
J2/70 4 7.0 65 4.0 10 868 86 890
0
200
400
600
800
1,000
1,200
1,400
1,600
1,800
2,000
0 50 100 150 200 250 300
Plan
t Cos
t, A
$000
Throughput, t/h
FIG 12.1 - Alluvial plant costing based on Russell jigs (AMTAS Pty Ltd, 2011).

Cost Estimation Handbook 273
CHAPTER 12 – BENEFICIATION – CONCENTRATION
The top size of the jig feed should be in the range of 25 - 150 mm. Classification of the feed is unnecessary although limited washing is achieved below 0.5 mm Smith (1991).
The cut point is a critical parameter in specifying coal jigs and is between sg 1.55 and 1.90.
The number of jig compartments required depends on the coal type and shale loading and varies from four or five for an easy washing coal to eight or nine for a coal with high proportions of near gravity material and -12.5 mm shale.
The split of the jig feed to the different products is entirely dependent on the nature of the coal being treated. For a typical Australian clean coal from an open cut mine, ten to 15 per cent of the feed is discarded and this proportion increases to 50 - 60 per cent for a dirty coal from an underground mine.
The water associated with discard and middlings streams is only surface moisture remaining after removal of that material by elevators and the balance of the water added reports to the washed coal stream. The amount of water required varies from about 2 to 4 m3/t depending on feed characteristics and operational variables.
Typical operating consumable costs for coal jigs are: • power consumption – 0.13 kWh/t/h coal • air consumption – 17 m3/t/h coal at 30 kPa.Figure 12.4 indicates the price-capacity relationship
for coal jigs assuming a fairly clean easily washed coal requiring five compartment jigs.
Spiral concentratorsSpirals are very widely used in a large variety of gravity separation applications with probably the
Feed
Wedgewire screen
Diaphragm
Tails discharge
Concentrate outletHydraulic ram
Hutch water
Ragging
Deceleration chamber
FIG 12.2 - In-line pressure jig.
TABLE 12.3Gekko in-line pressure jig unit costs.
Model IPJ1000 IPJ1500 IPJ2400
Maximum feed rate (t/h) 25 50 100
Maximum feed rate (m3/h) 50 100 200
Maximum feed particle size (mm) 25 25 25
Footprint areaa (m2) 1.96 3.24 6.25
Installed power (kW) 1.5 2.2 4.0
Capital cost – unitb $/(t/h) 4600 2900 2100
Capital cost – control/automation $/(t/h)
1000
Installation costc $/(t/h) 500
Maintenance cost $/t 1.1.7
Total capital cost $/(t/h) 3500
a = Plant f loor space taken up.
b = Includes star ter.
c = Capital cost of surrounding structure, valves, pipes, etc.
1
2
3
4
5
6
7
8
9
1011
12
13
14
6
1. Inlet2. Refuse outlet3. Refuse collecting hopper4. Middlings outlet5. Middlings collection hopper6. Discharge device7. Clean coal overflow8. Air chamber9. Make-up water10. Air-distributing tubes11. Air-distributing tank12. Waste-air collecting tank13. Waste-air tubes with silencers14. Valve control system
FIG 12.3 - Schematic diagram of a Batac jig.
0
100
200
300
400
500
600
700
800
900
1,000
0 100 200 300 400 500 600 700 800
Jig
Cos
t, A
$000
Coal Jig Capacity, t/h
FIG 12.4 - Cost of coal jigs.
CHAPTER 12 – BENEFICIATION – CONCENTRATION
Cost Estimation Handbook274
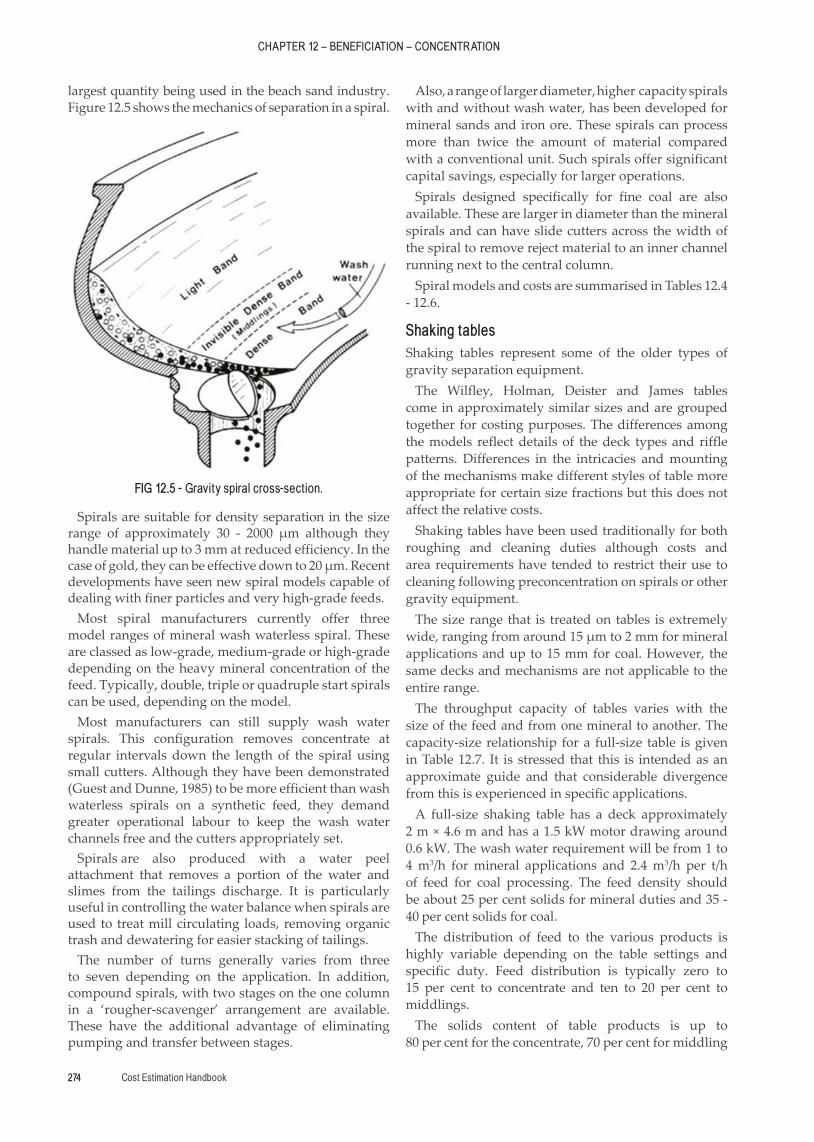
largest quantity being used in the beach sand industry. Figure 12.5 shows the mechanics of separation in a spiral.
Spirals are suitable for density separation in the size range of approximately 30 - 2000 μm although they handle material up to 3 mm at reduced efficiency. In the case of gold, they can be effective down to 20 μm. Recent developments have seen new spiral models capable of dealing with finer particles and very high-grade feeds.
Most spiral manufacturers currently offer three model ranges of mineral wash waterless spiral. These are classed as low-grade, medium-grade or high-grade depending on the heavy mineral concentration of the feed. Typically, double, triple or quadruple start spirals can be used, depending on the model.
Most manufacturers can still supply wash water spirals. This configuration removes concentrate at regular intervals down the length of the spiral using small cutters. Although they have been demonstrated (Guest and Dunne, 1985) to be more efficient than wash waterless spirals on a synthetic feed, they demand greater operational labour to keep the wash water channels free and the cutters appropriately set.
Spirals are also produced with a water peel attachment that removes a portion of the water and slimes from the tailings discharge. It is particularly useful in controlling the water balance when spirals are used to treat mill circulating loads, removing organic trash and dewatering for easier stacking of tailings.
The number of turns generally varies from three to seven depending on the application. In addition, compound spirals, with two stages on the one column in a ‘rougher-scavenger’ arrangement are available. These have the additional advantage of eliminating pumping and transfer between stages.
Also, a range of larger diameter, higher capacity spirals with and without wash water, has been developed for mineral sands and iron ore. These spirals can process more than twice the amount of material compared with a conventional unit. Such spirals offer significant capital savings, especially for larger operations.
Spirals designed specifically for fine coal are also available. These are larger in diameter than the mineral spirals and can have slide cutters across the width of the spiral to remove reject material to an inner channel running next to the central column.
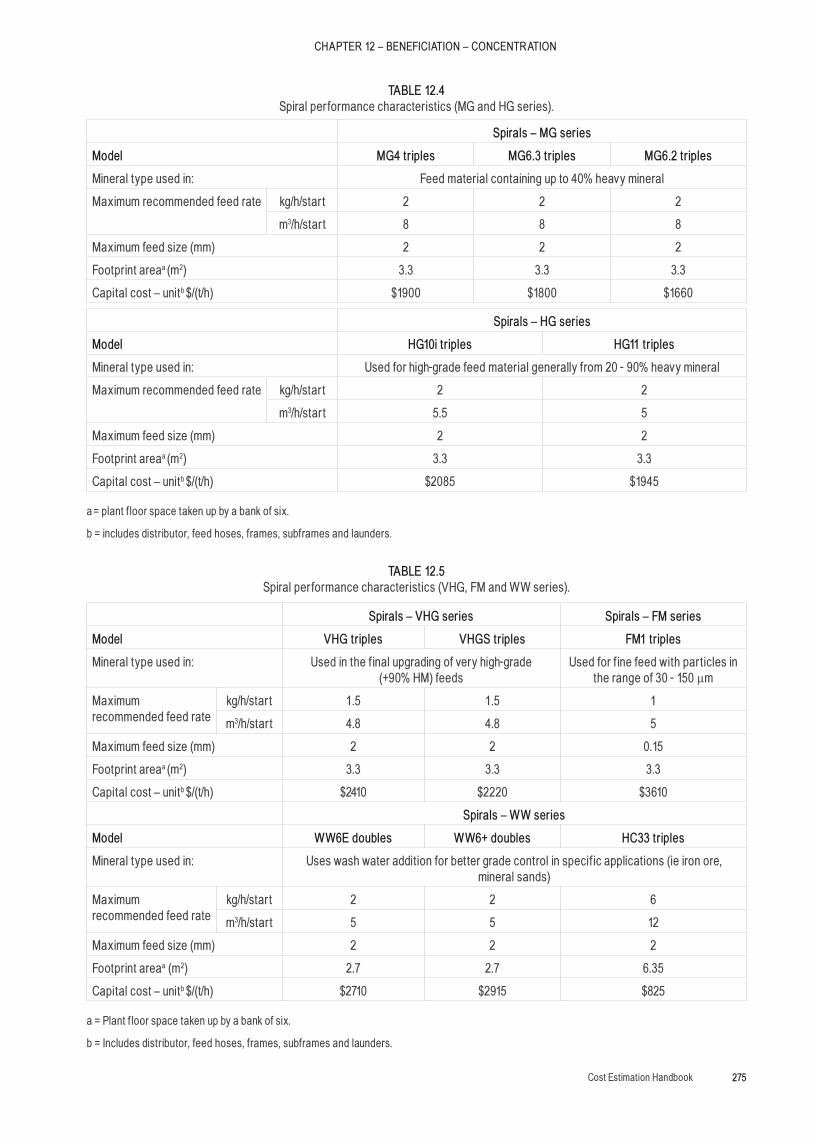
Spiral models and costs are summarised in Tables 12.4 - 12.6.
Shaking tablesShaking tables represent some of the older types of gravity separation equipment.
The Wilfley, Holman, Deister and James tables come in approximately similar sizes and are grouped together for costing purposes. The differences among the models reflect details of the deck types and riffle patterns. Differences in the intricacies and mounting of the mechanisms make different styles of table more appropriate for certain size fractions but this does not affect the relative costs.
Shaking tables have been used traditionally for both roughing and cleaning duties although costs and area requirements have tended to restrict their use to cleaning following preconcentration on spirals or other gravity equipment.
The size range that is treated on tables is extremely wide, ranging from around 15 μm to 2 mm for mineral applications and up to 15 mm for coal. However, the same decks and mechanisms are not applicable to the entire range.
The throughput capacity of tables varies with the size of the feed and from one mineral to another. The capacity-size relationship for a full-size table is given in Table 12.7. It is stressed that this is intended as an approximate guide and that considerable divergence from this is experienced in specific applications.
A full-size shaking table has a deck approximately 2 m × 4.6 m and has a 1.5 kW motor drawing around 0.6 kW. The wash water requirement will be from 1 to 4 m3/h for mineral applications and 2.4 m3/h per t/h of feed for coal processing. The feed density should be about 25 per cent solids for mineral duties and 35 - 40 per cent solids for coal.
The distribution of feed to the various products is highly variable depending on the table settings and specific duty. Feed distribution is typically zero to 15 per cent to concentrate and ten to 20 per cent to middlings.
The solids content of table products is up to 80 per cent for the concentrate, 70 per cent for middling
FIG 12.5 - Gravity spiral cross-section.
Cost Estimation Handbook 275
CHAPTER 12 – BENEFICIATION – CONCENTRATION
TABLE 12.4Spiral per formance characteristics (MG and HG series).
Spirals – MG series
Model MG4 triples MG6.3 triples MG6.2 triples
Mineral type used in: Feed material containing up to 40% heavy mineral
Maximum recommended feed rate kg/h/star t 2 2 2
m3/h/star t 8 8 8
Maximum feed size (mm) 2 2 2
Footprint areaa (m2) 3.3 3.3 3.3
Capital cost – unitb $/(t/h) $1900 $1800 $1660
Spirals – HG series
Model HG10i triples HG11 triples
Mineral type used in: Used for high-grade feed material generally from 20 - 90% heavy mineral
Maximum recommended feed rate kg/h/star t 2 2
m3/h/star t 5.5 5
Maximum feed size (mm) 2 2
Footprint areaa (m2) 3.3 3.3
Capital cost – unitb $/(t/h) $2085 $1945
a = plant f loor space taken up by a bank of six.
b = includes distributor, feed hoses, frames, subframes and launders.
TABLE 12.5Spiral per formance characteristics (VHG, FM and WW series).
Spirals – VHG series Spirals – FM series
Model VHG triples VHGS triples FM1 triples
Mineral type used in: Used in the f inal upgrading of very high-grade (+90% HM) feeds
Used for f ine feed with par ticles in the range of 30 - 150 µm
Maximum recommended feed rate
kg/h/star t 1.5 1.5 1
m3/h/star t 4.8 4.8 5
Maximum feed size (mm) 2 2 0.15
Footprint areaa (m2) 3.3 3.3 3.3
Capital cost – unitb $/(t/h) $2410 $2220 $3610
Spirals – WW series
Model WW6E doubles WW6+ doubles HC33 triples
Mineral type used in: Uses wash water addition for better grade control in specif ic applications (ie iron ore, mineral sands)
Maximum recommended feed rate
kg/h/star t 2 2 6
m3/h/star t 5 5 12
Maximum feed size (mm) 2 2 2
Footprint areaa (m2) 2.7 2.7 6.35
Capital cost – unitb $/(t/h) $2710 $2915 $825
a = Plant f loor space taken up by a bank of six.
b = Includes distributor, feed hoses, frames, subframes and launders.
CHAPTER 12 – BENEFICIATION – CONCENTRATION
Cost Estimation Handbook276
and around 20 per cent for tailings. Wash water is frequently required to mobilise the product streams.
The cost of a full-size table is around $25 000 with variations depending on whether a standard or oversize deck is used, the details of the table support structure and whether or not variable-speed control is provided.
Floor area is minimised by using double- or triple-deck tables but these do not represent an equipment cost saving.
Half-size tables with decks of approximately 1 m × 2.1 m are also available at a cost of $21 000. The capacity is approximately one-third of that of a full-sized table and wash water requirements are approximately 0.6 to 3 m3/h. The above costs reflect the price of the equipment only and tables require substantial foundations particularly if multiple decks are used.
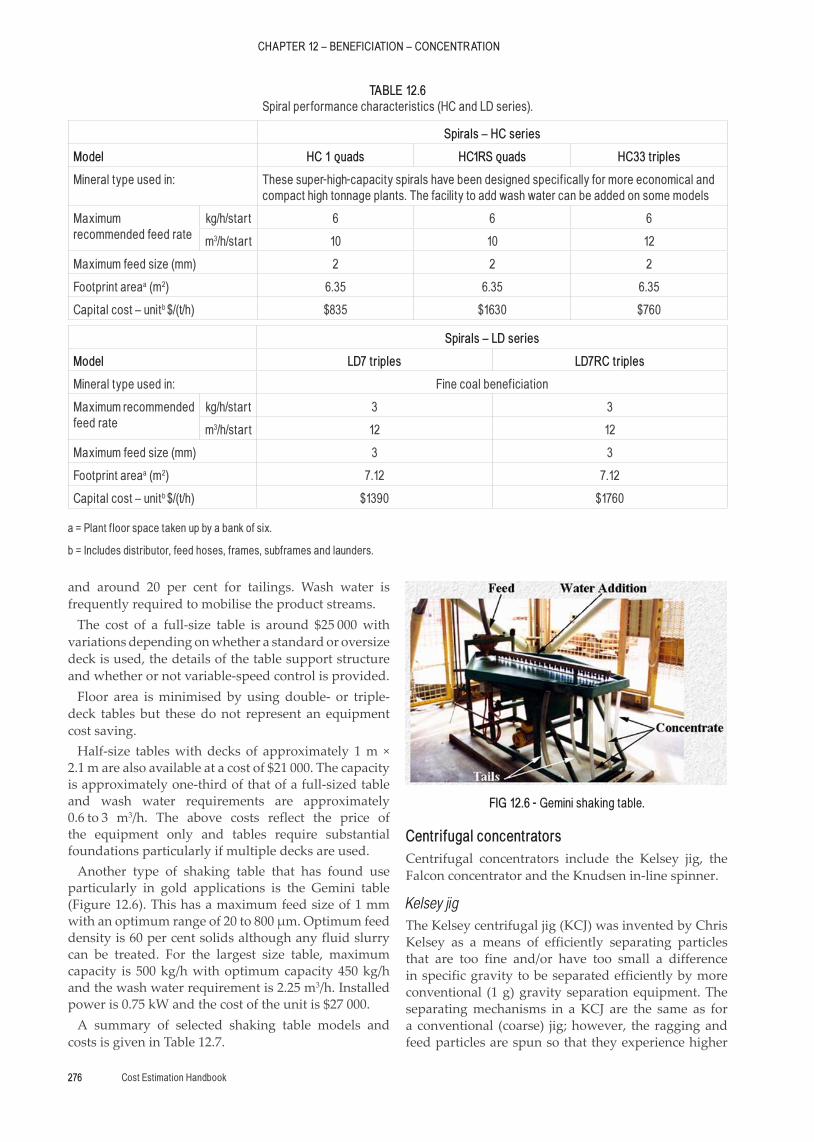
Another type of shaking table that has found use particularly in gold applications is the Gemini table (Figure 12.6). This has a maximum feed size of 1 mm with an optimum range of 20 to 800 μm. Optimum feed density is 60 per cent solids although any fluid slurry can be treated. For the largest size table, maximum capacity is 500 kg/h with optimum capacity 450 kg/h and the wash water requirement is 2.25 m3/h. Installed power is 0.75 kW and the cost of the unit is $27 000.
A summary of selected shaking table models and costs is given in Table 12.7.
Centrifugal concentratorsCentrifugal concentrators include the Kelsey jig, the Falcon concentrator and the Knudsen in-line spinner.
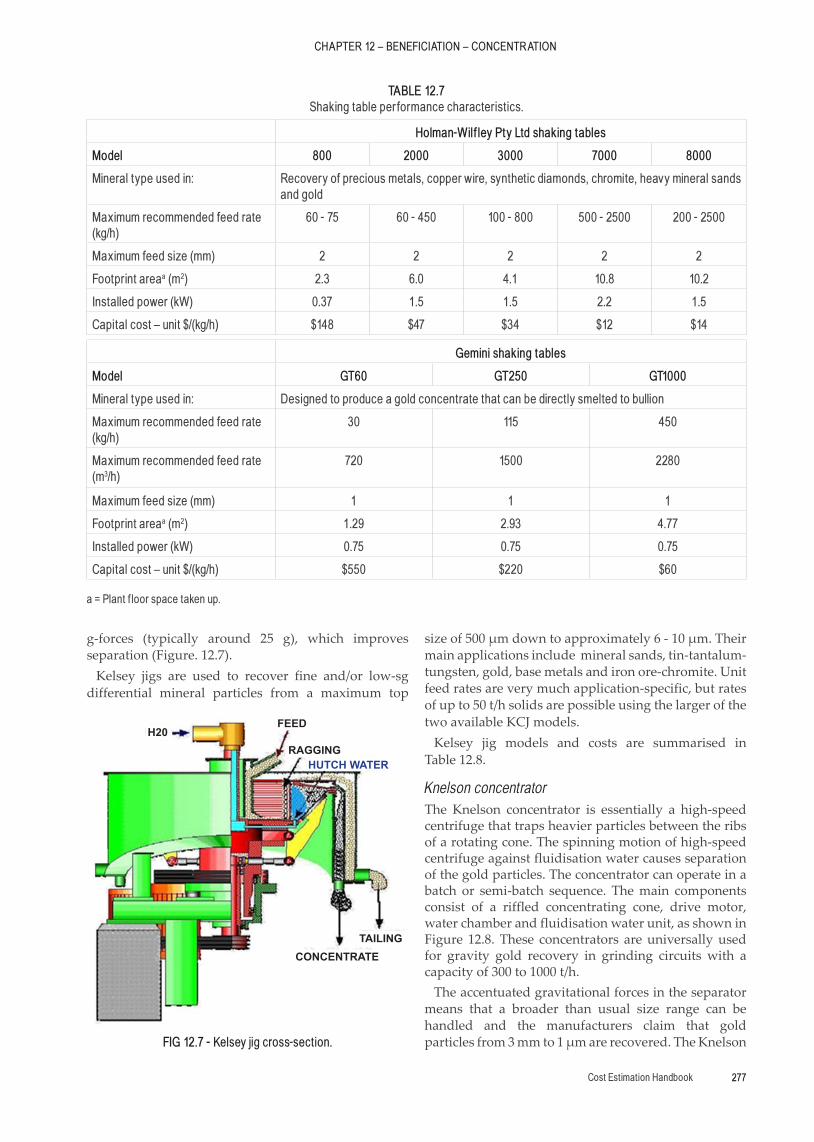
Kelsey jigThe Kelsey centrifugal jig (KCJ) was invented by Chris Kelsey as a means of efficiently separating particles that are too fine and/or have too small a difference in specific gravity to be separated efficiently by more conventional (1 g) gravity separation equipment. The separating mechanisms in a KCJ are the same as for a conventional (coarse) jig; however, the ragging and feed particles are spun so that they experience higher
TABLE 12.6Spiral per formance characteristics (HC and LD series).
Spirals – HC series
Model HC 1 quads HC1RS quads HC33 triples
Mineral type used in: These super-high-capacity spirals have been designed specif ically for more economical and compact high tonnage plants. The facility to add wash water can be added on some models
Maximum recommended feed rate
kg/h/star t 6 6 6
m3/h/star t 10 10 12
Maximum feed size (mm) 2 2 2
Footprint areaa (m2) 6.35 6.35 6.35
Capital cost – unitb $/(t/h) $835 $1630 $760
Spirals – LD series
Model LD7 triples LD7RC triples
Mineral type used in: Fine coal benef iciation
Maximum recommended feed rate
kg/h/star t 3 3
m3/h/star t 12 12
Maximum feed size (mm) 3 3
Footprint areaa (m2) 7.12 7.12
Capital cost – unitb $/(t/h) $1390 $1760
a = Plant f loor space taken up by a bank of six.
b = Includes distributor, feed hoses, frames, subframes and launders.
FIG 12.6 - Gemini shaking table.
Cost Estimation Handbook 277
CHAPTER 12 – BENEFICIATION – CONCENTRATION
g-forces (typically around 25 g), which improves separation (Figure. 12.7).
Kelsey jigs are used to recover fine and/or low-sg differential mineral particles from a maximum top
size of 500 μm down to approximately 6 - 10 μm. Their main applications include mineral sands, tin-tantalum-tungsten, gold, base metals and iron ore-chromite. Unit feed rates are very much application-specific, but rates of up to 50 t/h solids are possible using the larger of the two available KCJ models.
Kelsey jig models and costs are summarised in Table 12.8.
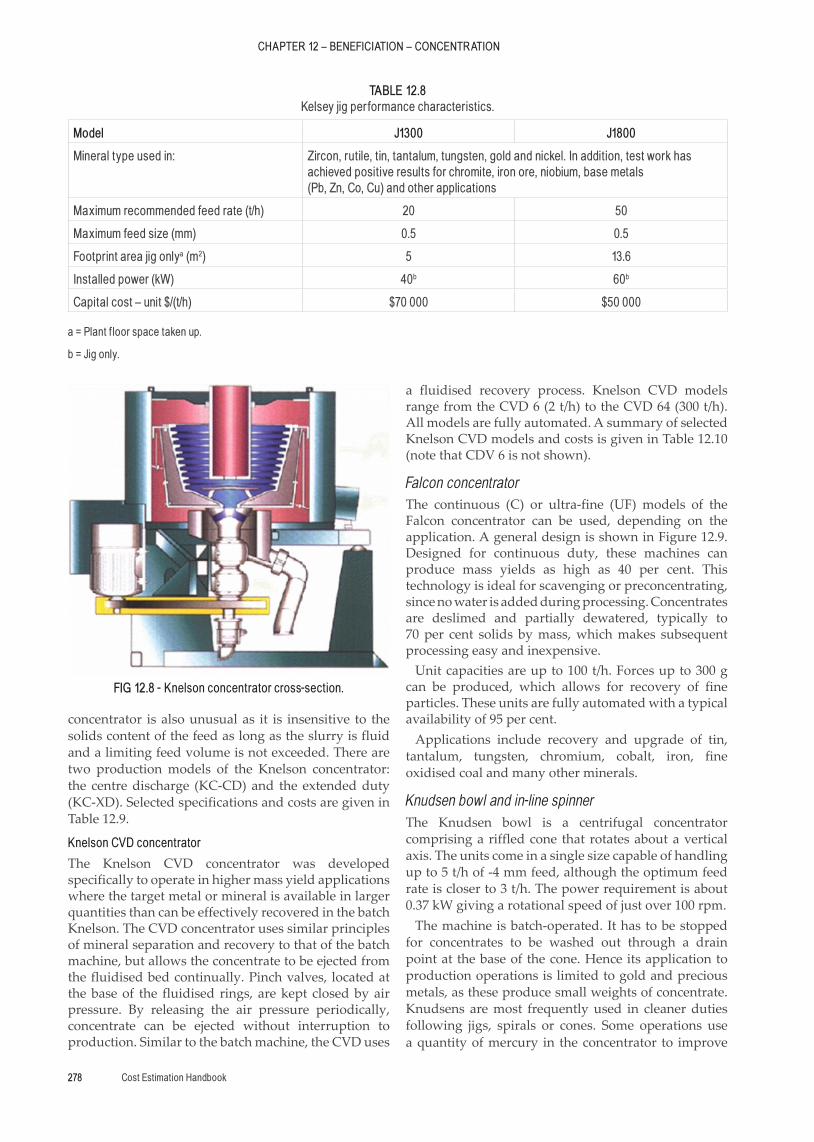
Knelson concentratorThe Knelson concentrator is essentially a high-speed centrifuge that traps heavier particles between the ribs of a rotating cone. The spinning motion of high-speed centrifuge against fluidisation water causes separation of the gold particles. The concentrator can operate in a batch or semi-batch sequence. The main components consist of a riffled concentrating cone, drive motor, water chamber and fluidisation water unit, as shown in Figure 12.8. These concentrators are universally used for gravity gold recovery in grinding circuits with a capacity of 300 to 1000 t/h.
The accentuated gravitational forces in the separator means that a broader than usual size range can be handled and the manufacturers claim that gold particles from 3 mm to 1 μm are recovered. The Knelson
TABLE 12.7Shaking table per formance characteristics.
Holman-Wilf ley Pty Ltd shaking tables
Model 800 2000 3000 7000 8000
Mineral type used in: Recovery of precious metals, copper wire, synthetic diamonds, chromite, heavy mineral sands and gold
Maximum recommended feed rate (kg/h)
60 - 75 60 - 450 100 - 800 500 - 2500 200 - 2500
Maximum feed size (mm) 2 2 2 2 2
Footprint areaa (m2) 2.3 6.0 4.1 10.8 10.2
Installed power (kW) 0.37 1.5 1.5 2.2 1.5
Capital cost – unit $/(kg/h) $148 $47 $34 $12 $14
Gemini shaking tables
Model GT60 GT250 GT1000
Mineral type used in: Designed to produce a gold concentrate that can be directly smelted to bullion
Maximum recommended feed rate (kg/h)
30 115 450
Maximum recommended feed rate (m3/h)
720 1500 2280
Maximum feed size (mm) 1 1 1
Footprint areaa (m2) 1.29 2.93 4.77
Installed power (kW) 0.75 0.75 0.75
Capital cost – unit $/(kg/h) $550 $220 $60
a = Plant f loor space taken up.
H20FEED
RAGGINGHUTCH WATER
CONCENTRATETAILING
FIG 12.7 - Kelsey jig cross-section.
CHAPTER 12 – BENEFICIATION – CONCENTRATION
Cost Estimation Handbook278
concentrator is also unusual as it is insensitive to the solids content of the feed as long as the slurry is fluid and a limiting feed volume is not exceeded. There are two production models of the Knelson concentrator: the centre discharge (KC-CD) and the extended duty (KC-XD). Selected specifications and costs are given in Table 12.9.
Knelson CVD concentrator
The Knelson CVD concentrator was developed specifically to operate in higher mass yield applications where the target metal or mineral is available in larger quantities than can be effectively recovered in the batch Knelson. The CVD concentrator uses similar principles of mineral separation and recovery to that of the batch machine, but allows the concentrate to be ejected from the fluidised bed continually. Pinch valves, located at the base of the fluidised rings, are kept closed by air pressure. By releasing the air pressure periodically, concentrate can be ejected without interruption to production. Similar to the batch machine, the CVD uses
a fluidised recovery process. Knelson CVD models range from the CVD 6 (2 t/h) to the CVD 64 (300 t/h). All models are fully automated. A summary of selected Knelson CVD models and costs is given in Table 12.10 (note that CDV 6 is not shown).
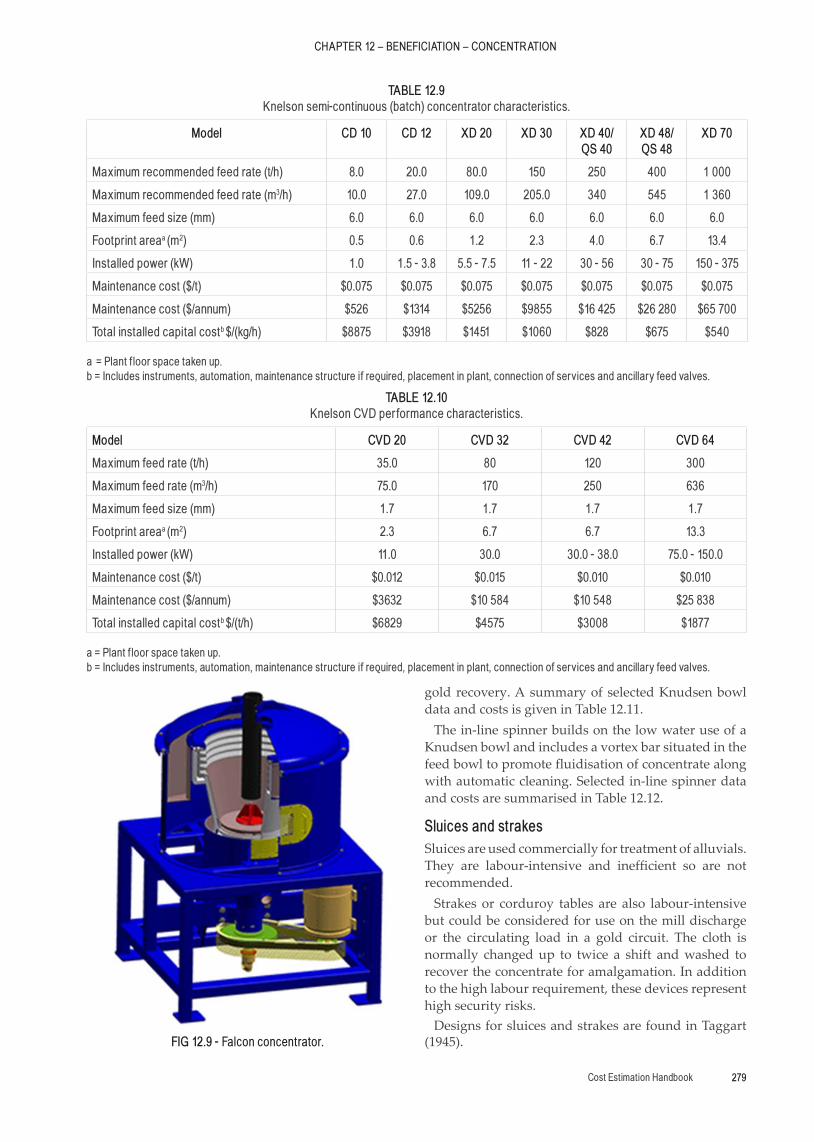
Falcon concentratorThe continuous (C) or ultra-fine (UF) models of the Falcon concentrator can be used, depending on the application. A general design is shown in Figure 12.9. Designed for continuous duty, these machines can produce mass yields as high as 40 per cent. This technology is ideal for scavenging or preconcentrating, since no water is added during processing. Concentrates are deslimed and partially dewatered, typically to 70 per cent solids by mass, which makes subsequent processing easy and inexpensive.
Unit capacities are up to 100 t/h. Forces up to 300 g can be produced, which allows for recovery of fine particles. These units are fully automated with a typical availability of 95 per cent.
Applications include recovery and upgrade of tin, tantalum, tungsten, chromium, cobalt, iron, fine oxidised coal and many other minerals.
Knudsen bowl and in-line spinnerThe Knudsen bowl is a centrifugal concentrator comprising a riffled cone that rotates about a vertical axis. The units come in a single size capable of handling up to 5 t/h of -4 mm feed, although the optimum feed rate is closer to 3 t/h. The power requirement is about 0.37 kW giving a rotational speed of just over 100 rpm.
The machine is batch-operated. It has to be stopped for concentrates to be washed out through a drain point at the base of the cone. Hence its application to production operations is limited to gold and precious metals, as these produce small weights of concentrate. Knudsens are most frequently used in cleaner duties following jigs, spirals or cones. Some operations use a quantity of mercury in the concentrator to improve
TABLE 12.8Kelsey jig per formance characteristics.
Model J1300 J1800
Mineral type used in: Zircon, rutile, tin, tantalum, tungsten, gold and nickel. In addition, test work has achieved positive results for chromite, iron ore, niobium, base metals (Pb, Zn, Co, Cu) and other applications
Maximum recommended feed rate (t/h) 20 50
Maximum feed size (mm) 0.5 0.5
Footprint area jig onlya (m2) 5 13.6
Installed power (kW) 40b 60b
Capital cost – unit $/(t/h) $70 000 $50 000
a = Plant f loor space taken up.
b = Jig only.
FIG 12.8 - Knelson concentrator cross-section.
Cost Estimation Handbook 279
CHAPTER 12 – BENEFICIATION – CONCENTRATION
gold recovery. A summary of selected Knudsen bowl data and costs is given in Table 12.11.
The in-line spinner builds on the low water use of a Knudsen bowl and includes a vortex bar situated in the feed bowl to promote fluidisation of concentrate along with automatic cleaning. Selected in-line spinner data and costs are summarised in Table 12.12.
Sluices and strakesSluices are used commercially for treatment of alluvials. They are labour-intensive and inefficient so are not recommended.
Strakes or corduroy tables are also labour-intensive but could be considered for use on the mill discharge or the circulating load in a gold circuit. The cloth is normally changed up to twice a shift and washed to recover the concentrate for amalgamation. In addition to the high labour requirement, these devices represent high security risks.
Designs for sluices and strakes are found in Taggart (1945).
TABLE 12.9Knelson semi-continuous (batch) concentrator characteristics.
Model CD 10 CD 12 XD 20 XD 30 XD 40/ QS 40
XD 48/ QS 48
XD 70
Maximum recommended feed rate (t/h) 8.0 20.0 80.0 150 250 400 1 000
Maximum recommended feed rate (m3/h) 10.0 27.0 109.0 205.0 340 545 1 360
Maximum feed size (mm) 6.0 6.0 6.0 6.0 6.0 6.0 6.0
Footprint areaa (m2) 0.5 0.6 1.2 2.3 4.0 6.7 13.4
Installed power (kW) 1.0 1.5 - 3.8 5.5 - 7.5 11 - 22 30 - 56 30 - 75 150 - 375
Maintenance cost ($/t) $0.075 $0.075 $0.075 $0.075 $0.075 $0.075 $0.075
Maintenance cost ($/annum) $526 $1314 $5256 $9855 $16 425 $26 280 $65 700
Total installed capital costb $/(kg/h) $8875 $3918 $1451 $1060 $828 $675 $540
a = Plant f loor space taken up. b = Includes instruments, automation, maintenance structure if required, placement in plant, connection of services and ancillary feed valves.
TABLE 12.10Knelson CVD per formance characteristics.
Model CVD 20 CVD 32 CVD 42 CVD 64
Maximum feed rate (t/h) 35.0 80 120 300
Maximum feed rate (m3/h) 75.0 170 250 636
Maximum feed size (mm) 1.7 1.7 1.7 1.7
Footprint areaa (m2) 2.3 6.7 6.7 13.3
Installed power (kW) 11.0 30.0 30.0 - 38.0 75.0 - 150.0
Maintenance cost ($/t) $0.012 $0.015 $0.010 $0.010
Maintenance cost ($/annum) $3632 $10 584 $10 548 $25 838
Total installed capital costb $/(t/h) $6829 $4575 $3008 $1877
a = Plant f loor space taken up. b = Includes instruments, automation, maintenance structure if required, placement in plant, connection of services and ancillary feed valves.
FIG 12.9 - Falcon concentrator.
CHAPTER 12 – BENEFICIATION – CONCENTRATION
Cost Estimation Handbook280
MAGNETIC AND ELECTROSTATIC SEPARATIONMagnetic and electrostatic separation techniques exploit differences in magnetic and electrostatic properties of particles in a feedstock. For magnetic separation the property is magnetic susceptibility, and for electrostatic separation the property is particle surface conductivity.
To provide capital costs for magnetic and electrostatic separation equipment, tests are conducted in order to confirm the:
• mineralogy of the feed • optimum circuit design • size range of the feed • optimum magnetic method (wet or dry) • tonnage rate to be processed.These tests are conducted on sizeable samples (50 kg
minimum). Equipment suppliers have test units set up that enable performance to be assessed on production-scale equipment.
In deriving these test data it is recognised that magnetic separation can be performed on either wet (slurry) or dry feeds. Further, magnetic separation equipment may have either low- or high-intensity magnetic field strengths. High-tension (electrostatic)
separations can only be successful for de-dusted, dry feeds at elevated temperatures.
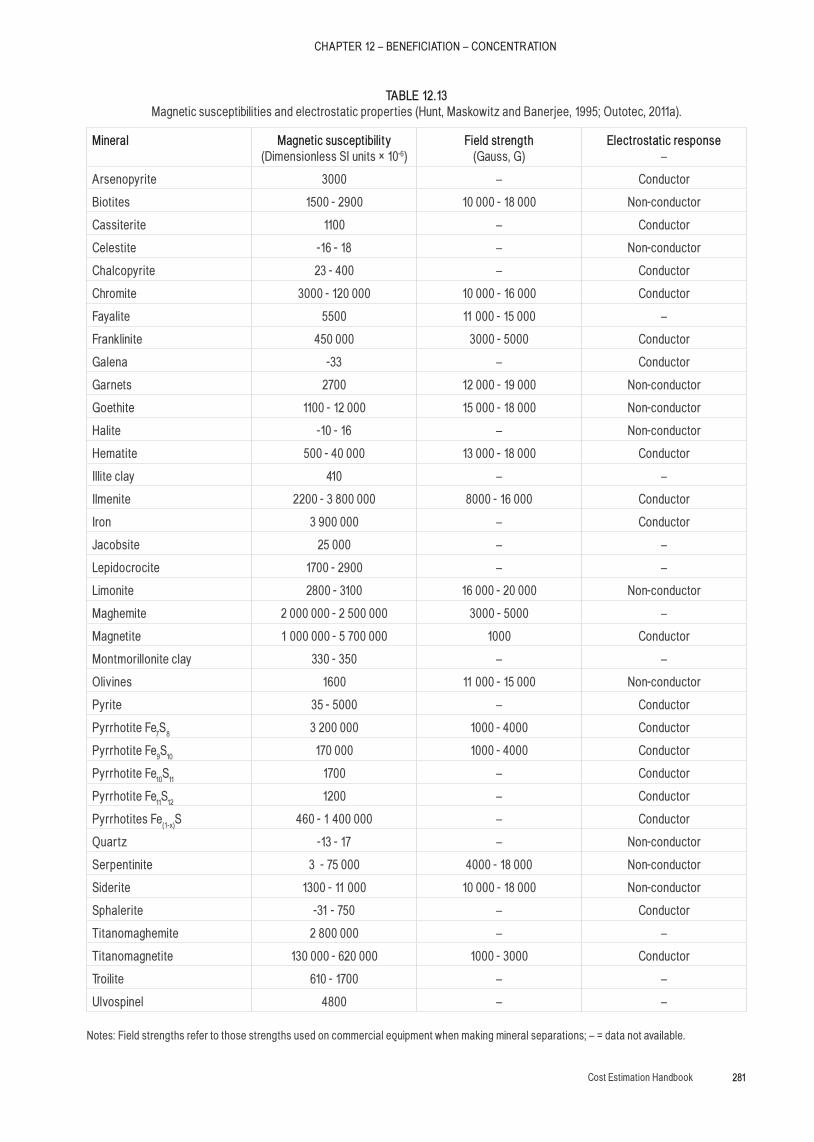
Feed characterisationMineralogical analysis of the feeds to be processed is required to confirm the minerals present and to define the gangue associated with the valuable minerals. Minerals can be broadly grouped according to their magnetic susceptibility as shown in Table 12.13. For electrostatic separations it is important that particles be suitably treated beforehand, because contaminants such as surface coatings can strongly influence the behaviour of particles.
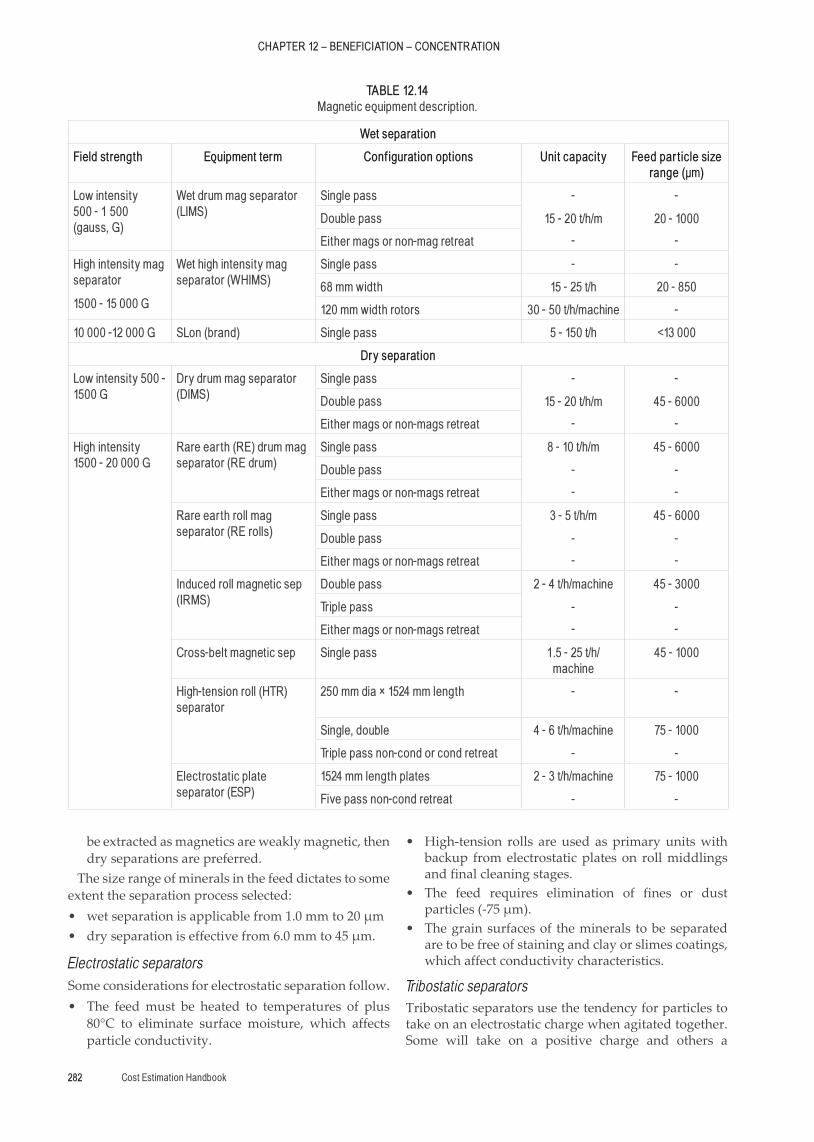
Equipment descriptionFor convenient reference, the equipment available is subdivided into groups corresponding to the broad definition of minerals given in Table 12.13. Equipment is summarised in Table 12.14.
Equipment selectionWhile the equipment separation processes are usually based on metallurgical tests, some guidelines have been derived from years of plant practice. These are summarised in this section.
Magnetic separatorsSome considerations for magnetic separation follow.
• If high-intensity separations are required, the separators must be protected from highly magnetic material such as magnetite. Passing feed material through low-intensity separators separates the highly magnetic material, with the non-magnetic stream further treated on either high-intensity magnetic separators (WHIMS) for wet feed or induced roll magnetic separators (IRMS) for dry feed.
• Wet separations are only performed when either the minerals to be recovered, or the gangue to be rejected, are strongly magnetic; refer to Table 12.13. The use of WHIMS and low-intensity magnetic separators (LIMS) constitute primary separations and in many cases either the magnetic or non-magnetic fractions are further treated in dry circuits. If the minerals to
TABLE 12.11Knudsen bowl per formance characteristics.
Mineral type used in: Specif ically designed to recover gold from alluvial or hard rock deposits, upgrading and recovery of gold from concentrates from other gravity separation stages, exploration and evaluation of gold deposits, and other mineral applications for tin, tungsten and scheelite
Maximum recommended feed rate (t/h) 3000
Maximum feed size (Mm) 8
Footprint area jig onlya (m2) 0.6
Installed power (kW) 0.37
Capital cost – unit $/(t/h) $4465
a = Plant f loor space taken up.
TABLE 12.12In-line spinner per formance characteristics.
Mineral type used in: Specif ically designed to recover gold from in-line pressure jig concentrates and from other gravity separation stages
Maximum recommended feed rate (kg/h) 2000 30 000
Maximum feed size (mm) 6 6
Footprint areaa (m2) 0.6 –
Installed power (kW) 2.2 3
Capital cost – unit $/(t/h) – –
a = Plant f loor space taken up.
– = Either not applicable or not available.
Cost Estimation Handbook 281
CHAPTER 12 – BENEFICIATION – CONCENTRATION
TABLE 12.13Magnetic susceptibilities and electrostatic proper ties (Hunt, Maskowitz and Banerjee, 1995; Outotec, 2011a).
Mineral Magnetic susceptibility (Dimensionless SI units × 10-6)
Field strength (Gauss, G)
Electrostatic response –
Arsenopyrite 3000 – Conductor
Biotites 1500 - 2900 10 000 - 18 000 Non-conductor
Cassiterite 1100 – Conductor
Celestite -16 - 18 – Non-conductor
Chalcopyrite 23 - 400 – Conductor
Chromite 3000 - 120 000 10 000 - 16 000 Conductor
Fayalite 5500 11 000 - 15 000 –
Franklinite 450 000 3000 - 5000 Conductor
Galena -33 – Conductor
Garnets 2700 12 000 - 19 000 Non-conductor
Goethite 1100 - 12 000 15 000 - 18 000 Non-conductor
Halite -10 - 16 – Non-conductor
Hematite 500 - 40 000 13 000 - 18 000 Conductor
Illite clay 410 – –
Ilmenite 2200 - 3 800 000 8000 - 16 000 Conductor
Iron 3 900 000 – Conductor
Jacobsite 25 000 – –
Lepidocrocite 1700 - 2900 – –
Limonite 2800 - 3100 16 000 - 20 000 Non-conductor
Maghemite 2 000 000 - 2 500 000 3000 - 5000 –
Magnetite 1 000 000 - 5 700 000 1000 Conductor
Montmorillonite clay 330 - 350 – –
Olivines 1600 11 000 - 15 000 Non-conductor
Pyrite 35 - 5000 – Conductor
Pyrrhotite Fe7S8 3 200 000 1000 - 4000 Conductor
Pyrrhotite Fe9S10 170 000 1000 - 4000 Conductor
Pyrrhotite Fe10S11 1700 – Conductor
Pyrrhotite Fe11S12 1200 – Conductor
Pyrrhotites Fe(1-x)S 460 - 1 400 000 – Conductor
Quar tz -13 - 17 – Non-conductor
Serpentinite 3 - 75 000 4000 - 18 000 Non-conductor
Siderite 1300 - 11 000 10 000 - 18 000 Non-conductor
Sphalerite -31 - 750 – Conductor
Titanomaghemite 2 800 000 – –
Titanomagnetite 130 000 - 620 000 1000 - 3000 Conductor
Troilite 610 - 1700 – –
Ulvospinel 4800 – –
Notes: Field strengths refer to those strengths used on commercial equipment when making mineral separations; – = data not available.
CHAPTER 12 – BENEFICIATION – CONCENTRATION
Cost Estimation Handbook282
be extracted as magnetics are weakly magnetic, then dry separations are preferred.
The size range of minerals in the feed dictates to some extent the separation process selected:
• wet separation is applicable from 1.0 mm to 20 μm • dry separation is effective from 6.0 mm to 45 μm.
Electrostatic separatorsSome considerations for electrostatic separation follow.
• The feed must be heated to temperatures of plus 80°C to eliminate surface moisture, which affects particle conductivity.
• High-tension rolls are used as primary units with backup from electrostatic plates on roll middlings and final cleaning stages.
• The feed requires elimination of fines or dust particles (-75 μm).
• The grain surfaces of the minerals to be separated are to be free of staining and clay or slimes coatings, which affect conductivity characteristics.
Tribostatic separatorsTribostatic separators use the tendency for particles to take on an electrostatic charge when agitated together. Some will take on a positive charge and others a
TABLE 12.14Magnetic equipment description.
Wet separation
Field strength Equipment term Conf iguration options Unit capacity Feed particle size range (�m)
Low intensity 500 - 1 500 (gauss, G)
Wet drum mag separator (LIMS)
Single pass -
15 - 20 t/h/m
-
-
20 - 1000
-
Double pass
Either mags or non-mag retreat
High intensity mag separator
1500 - 15 000 G
Wet high intensity mag separator (WHIMS)
Single pass - -
68 mm width 15 - 25 t/h 20 - 850
120 mm width rotors 30 - 50 t/h/machine -
10 000 -12 000 G SLon (brand) Single pass 5 - 150 t/h <13 000
Dry separation
Low intensity 500 - 1500 G
Dry drum mag separator (DIMS)
Single pass -
15 - 20 t/h/m
-
-
45 - 6000
-
Double pass
Either mags or non-mags retreat
High intensity 1500 - 20 000 G
Rare ear th (RE) drum mag separator (RE drum)
Single pass 8 - 10 t/h/m
-
-
45 - 6000
-
-
Double pass
Either mags or non-mags retreat
Rare ear th roll mag separator (RE rolls)
Single pass 3 - 5 t/h/m
-
-
45 - 6000
-
-
Double pass
Either mags or non-mags retreat
Induced roll magnetic sep (IRMS)
Double pass 2 - 4 t/h/machine
-
-
45 - 3000
-
-
Triple pass
Either mags or non-mags retreat
Cross-belt magnetic sep Single pass 1.5 - 25 t/h/machine
45 - 1000
High-tension roll (HTR) separator
250 mm dia × 1524 mm length - -
Single, double 4 - 6 t/h/machine
-
75 - 1000
-Triple pass non-cond or cond retreat
Electrostatic plate separator (ESP)
1524 mm length plates 2 - 3 t/h/machine
-
75 - 1000
-Five pass non-cond retreat
Cost Estimation Handbook 283
CHAPTER 12 – BENEFICIATION – CONCENTRATION
negative charge. These charged particles then pass between charged plates with the positively charged particles attracted towards a negatively charged plate and the negatively charged particles attracted towards the positively charged plate. Tribostatic separation is only effective when the particles are dry and at temperatures greater than 100 - 110°C.
Cost estimationThe method for cost estimation is based on the knowledge of the unit capacity of the separation equipment and estimating the number of separators required at each stage of the defined circuit. The prices for each separator are obtained from equipment suppliers (Table 12.15 shows indicative costs). The total price for separation equipment is the sum of the costs of units at each stage.
Once the total cost of separation equipment is established, then an order-of-magnitude cost of the installed plant circuit is calculated using a factor dependent on the type of circuit involved. The equipment cost may be assumed equal to 25 per cent of the installed cost if no more accurate information is available.
Worked examplesWorked examples of costings for four types of magnetic separation circuit are presented below.
Wet magnetic separationAssume that the mineralogy of the feed has been established by testing as:
Mineral Assay (%) Magnetic responseQuartz 3.0 Non-magneticMagnetite 10.0 Very magneticIlmenite 38.0 MagneticRutile 2.0 Weakly magneticLeucoxene 15.0 Non-magneticZircon 14.0 Non-magneticGarnet 13.0 Weakly magneticHornblende 3.0 Weakly magneticOthers 2.0 Non-magneticTotal 100.0
Size analysis of the feed confirms that the fraction of +850 μm material is 2.0 per cent. Laboratory tests have shown that to maximise the extraction of magnetics and minimise the loss of non-magnetics, the gauss levels required are:
• low intensity – 800 G • first pass WHIMS – 8 000 G • second pass WHIMS – 13 000 G.The requirement is to reject the magnetic minerals
leaving the valuable rutile and zircon enriched in the non-magnetics for further dry processing. The processing rate required is 50 t/h.
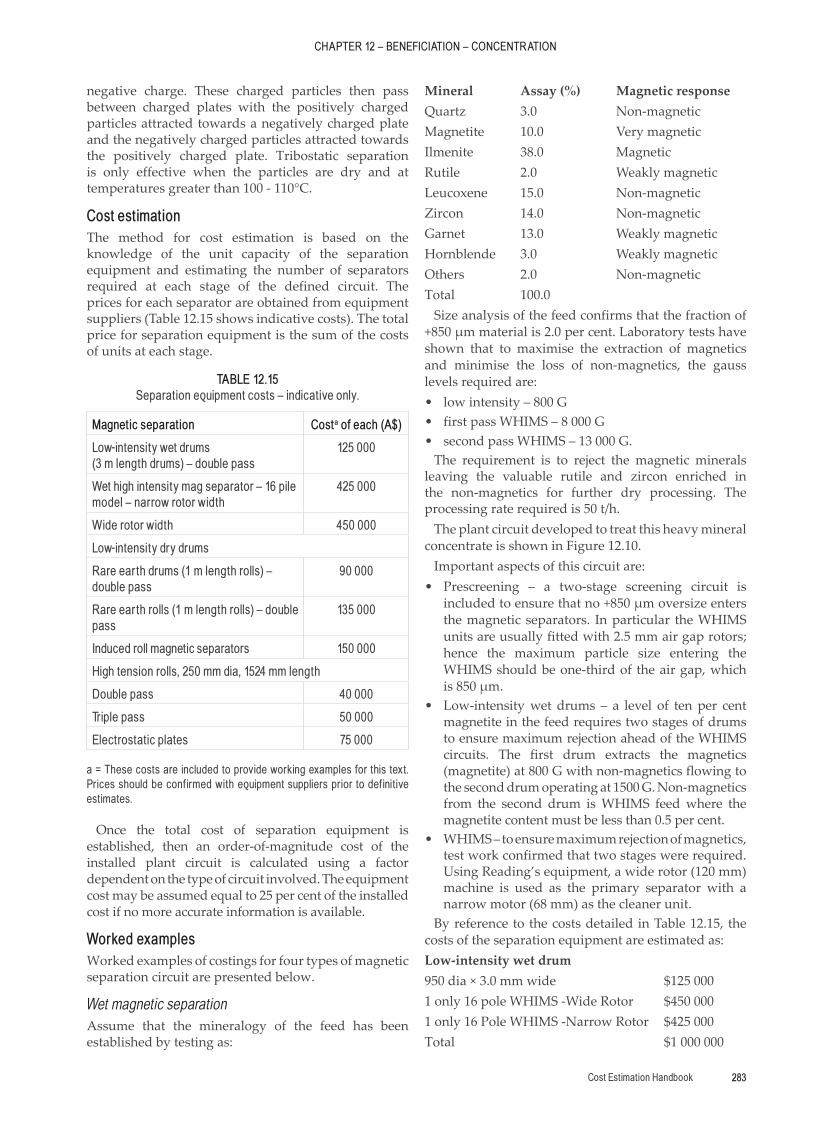
The plant circuit developed to treat this heavy mineral concentrate is shown in Figure 12.10.
Important aspects of this circuit are: • Prescreening – a two-stage screening circuit is
included to ensure that no +850 μm oversize enters the magnetic separators. In particular the WHIMS units are usually fitted with 2.5 mm air gap rotors; hence the maximum particle size entering the WHIMS should be one-third of the air gap, which is 850 μm.
• Low-intensity wet drums – a level of ten per cent magnetite in the feed requires two stages of drums to ensure maximum rejection ahead of the WHIMS circuits. The first drum extracts the magnetics (magnetite) at 800 G with non-magnetics flowing to the second drum operating at 1500 G. Non-magnetics from the second drum is WHIMS feed where the magnetite content must be less than 0.5 per cent.
• WHIMS – to ensure maximum rejection of magnetics, test work confirmed that two stages were required. Using Reading’s equipment, a wide rotor (120 mm) machine is used as the primary separator with a narrow motor (68 mm) as the cleaner unit.
By reference to the costs detailed in Table 12.15, the costs of the separation equipment are estimated as:Low-intensity wet drum950 dia × 3.0 mm wide $125 0001 only 16 pole WHIMS -Wide Rotor $450 0001 only 16 Pole WHIMS -Narrow Rotor $425 000Total $1 000 000
TABLE 12.15Separation equipment costs – indicative only.
Magnetic separation Costa of each (A$)
Low-intensity wet drums (3 m length drums) – double pass
125 000
Wet high intensity mag separator – 16 pile model – narrow rotor width
425 000
Wide rotor width 450 000
Low-intensity dry drums
Rare ear th drums (1 m length rolls) – double pass
90 000
Rare ear th rolls (1 m length rolls) – double pass
135 000
Induced roll magnetic separators 150 000
High tension rolls, 250 mm dia, 1524 mm length
Double pass 40 000
Triple pass 50 000
Electrostatic plates 75 000
a = These costs are included to provide working examples for this text. Prices should be conf irmed with equipment suppliers prior to def initive estimates.
CHAPTER 12 – BENEFICIATION – CONCENTRATION
Cost Estimation Handbook284
Applying a 25 per cent factor for equipment cost to installed capital cost for the circuit gives:
Plant cost = $1 000 000 = $4 000 000 0.25
Dry magnetic separationThe mineralogy of the feed has been established by assessing a conductor flow as:Mineral Assay (%) Magnetic responseQuartz 1.4 Non-magneticIlmenite 76.7 MagneticRutile 12.9 Non-magneticLeucoxene 3.7 Weakly magneticZircon 2.0 Non-magneticGarnet 2.1 Weakly magneticMonazite 0.1 Weakly magneticOthers 1.1 Non-magneticTotal 100.0
Dry magnetic separation is usually part of a dry separation circuit that incorporates electrostatic separation as well as magnetic separation. Rare earth (RE) drum magnetic separators are now used extensively to produce ilmenite products with RE belt and roll magnetic separators used to produce rutile and zircon products. Laboratory test work has confirmed that the ilmenite can be fractionated into a number of potential products including:
• primary ilmenite (very magnetic) – 50 - 54 per cent TiO2
• secondary ilmenite (less magnetic) – 58 - 60 per cent TiO2.
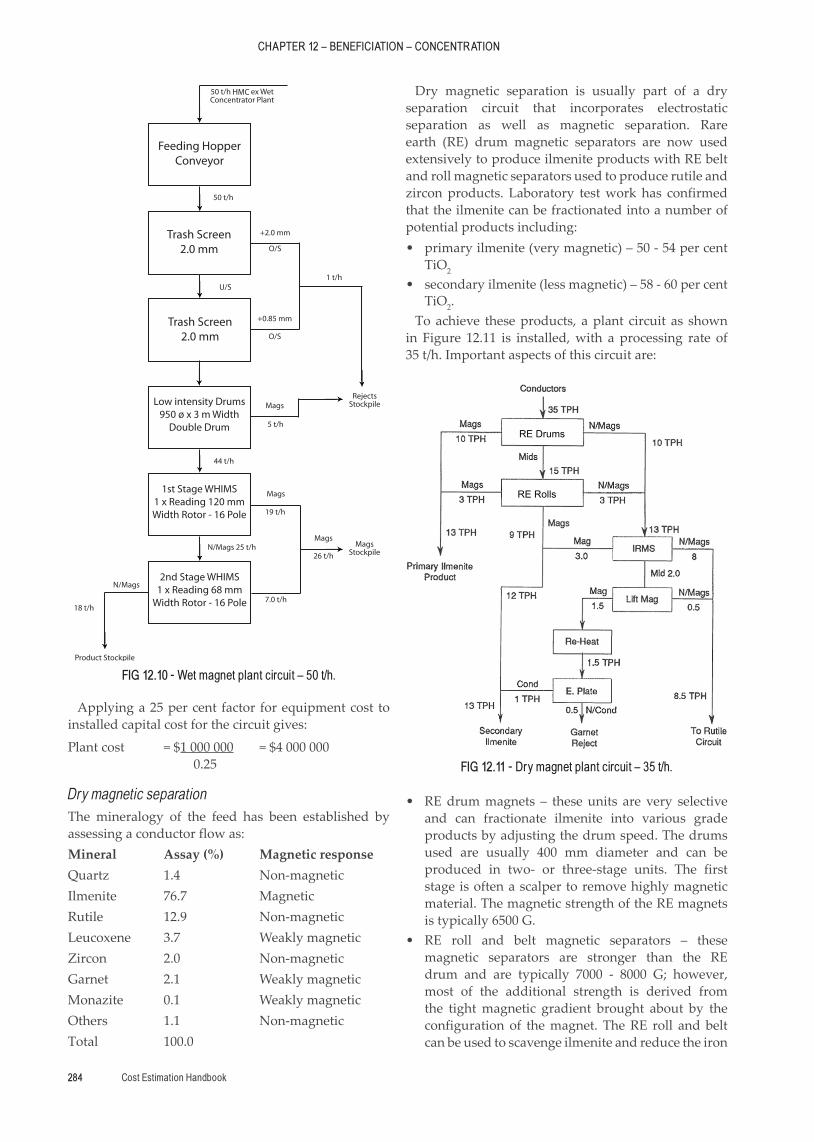
To achieve these products, a plant circuit as shown in Figure 12.11 is installed, with a processing rate of 35 t/h. Important aspects of this circuit are:
• RE drum magnets – these units are very selective and can fractionate ilmenite into various grade products by adjusting the drum speed. The drums used are usually 400 mm diameter and can be produced in two- or three-stage units. The first stage is often a scalper to remove highly magnetic material. The magnetic strength of the RE magnets is typically 6500 G.
• RE roll and belt magnetic separators – these magnetic separators are stronger than the RE drum and are typically 7000 - 8000 G; however, most of the additional strength is derived from the tight magnetic gradient brought about by the configuration of the magnet. The RE roll and belt can be used to scavenge ilmenite and reduce the iron
50 t/h HCM ex Wet Concentrator Plant
Feeding Hopper Conveyor
Trash Screen 2.0 mm
Trash Screen 2.0 mm
2nd Stage WHIMS1 x Reading 68 mm
Width Rotor - 16 Pole
1st Stage WHIMS1 x Reading 120 mmWidth Rotor - 16 Pole
Low intensity Drums950 ø x 3 m Width
Double Drum
50 t/h
U/S
+2.0 mm
O/S
O/S
5 t/h
44 t/h
19 t/h
26 t/h
7.0 t/h18 t/h
1 t/h
+0.85 mm
N/Mags 25 t/h
Mags
Mags
MagsRejects
Stockpile
MagsStockpile
Product Stockpile
N/Mags
HMC
FIG 12.10 - Wet magnet plant circuit – 50 t/h.
RE Rolls
RE Drums
FIG 12.11 - Dry magnet plant circuit – 35 t/h.
Cost Estimation Handbook 285
CHAPTER 12 – BENEFICIATION – CONCENTRATION
content of rutile and zircon products. Separation can be controlled by varying the roll speed and belt thickness.
• IRMS – to extract the remaining ilmenite and produce low iron and zircon products, induced roll magnets operating at 14 000 - 16 000 G are used.
Referring to the costs detailed in Table 12.15 the costs of the separation equipment are estimated below. A rare earth drum (RED) and a rare earth roll (RER) are indicated:2 × 1.5 m primary REDs 180 0003 × 1.5 m RERs 405 0005 only IRMS 750 0001 × 1.5 m RER 135 0001 only electrostatic plate/rectifier 75 000Total $1 545 000
Applying a 25 per cent factor for equipment cost to installed capital cost for the circuit gives:
Plant cost = $1 545 000 = $6 180 000 0.25These estimates do not include the equipment to dry
the original heavy mineral concentrate and the costs indicated refer to the separation circuit only.
Operating cost
A major component of the operating cost of a magnetic separation circuit is the power cost. As a permanent magnet, RE magnets draw no power, except for the motor drive of the roll or belt. As a result, RE magnets operate at a fraction of the cost of electromagnets. Taking into account maintenance and other costs, there is a large cost difference as shown in Table 12.16.
High-tension electrostatic separationThe mineralogy of the feed (heavy mineral concentrate) has been confirmed as:Mineral Assay (%) Magnetic responseQuartz 3.0 Non-conductorllmenite 55.0 ConductorRutile 10.0 ConductorLeucoxene 3.0 ConductorZircon 14.0 Non-conductorGarnet 10.0 Non-conductor
Monazite 1.0 Non-conductorOthers 4.0 OtherTotal 100.0
Note: total proportion of the conductor material is 68 per cent of the feed with the non-conductors 32 per cent.
The high-tension electrostatic circuit aims to produce: • a conductor-enriched fraction which feeds to a dry
magnet circuit for ilmenite-rutile separation • a non-conductor-enriched fraction which feeds to a
zircon circuit for separation of zircon away from the gangue minerals such as garnet.
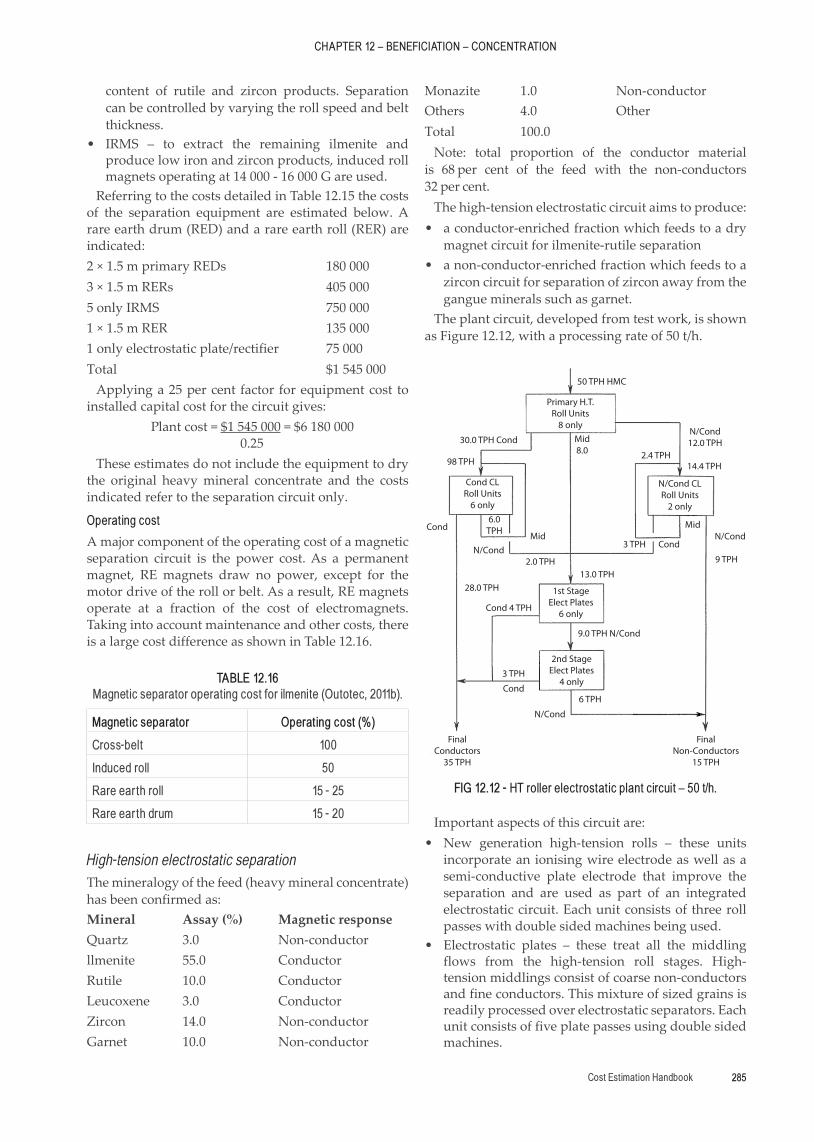
The plant circuit, developed from test work, is shown as Figure 12.12, with a processing rate of 50 t/h.
Important aspects of this circuit are: • New generation high-tension rolls – these units
incorporate an ionising wire electrode as well as a semi-conductive plate electrode that improve the separation and are used as part of an integrated electrostatic circuit. Each unit consists of three roll passes with double sided machines being used.
• Electrostatic plates – these treat all the middling flows from the high-tension roll stages. High-tension middlings consist of coarse non-conductors and fine conductors. This mixture of sized grains is readily processed over electrostatic separators. Each unit consists of five plate passes using double sided machines.
TABLE 12.16Magnetic separator operating cost for ilmenite (Outotec, 2011b).
Magnetic separator Operating cost (%)
Cross-belt 100
Induced roll 50
Rare ear th roll 15 - 25
Rare ear th drum 15 - 20
50 TPH HMC
2.4 TPH
N/Cond 12.0 TPH
14.4 TPH
N/Cond CL Roll Units
2 only
MidN/Cond
9 TPH
Cond
9.0 TPH N/Cond
3 TPH
13.0 TPH
Primary H.T. Roll Units
8 onlyMid 8.0
30.0 TPH Cond
98 TPH
Cond CL Roll Units
6 only
MidCond
6.0 TPH
28.0 TPH 1st Stage Elect Plates
6 only
2.0 TPHN/Cond
Cond
2nd Stage Elect Plates
4 only
6 TPH
Final Non-Conductors
15 TPH
N/Cond
3 TPH
Cond 4 TPH
Final Conductors
35 TPH
FIG 12.12 - HT roller electrostatic plant circuit – 50 t/h.
CHAPTER 12 – BENEFICIATION – CONCENTRATION
Cost Estimation Handbook286
• Rectifiers – solid state rectifiers provide the potential of 20 000 - 30 000 V to the HT electrode wire on the roll machines and the plate electrodes. These units convert 240 V AC supply to the 20 000 V DC for use in the machines. Rectifiers are sized on the basis of 4 mA required per HT roll (6 × 4 = 24 mA per roll separator) and 15 mA for each plate separator.
Referring to the equipment costs of Table 12.15, the separation equipment costs for this circuit are:
• primary HTR • eight only 2 × 3 × 1.8 m × 270 mm diameter
machines $1 120 000 • complete with rectifiers
• conductor cleaner HTR • six only 2 × 3 × 1.8 m × 270 mm diameter machines
$840 000 • complete with rectifiers
• non-conductor cleaner HTR • two only 2 × 3 × 1.8 m × 270 mm diameter
machines $280 000 • complete with rectifiers
• electrostatic plates • five only 2 × 5 stage × 1.8 m plates $375 000 • complete with rectifiers • total $2 615 000
Applying a 25 per cent factor for equipment cost to installed capital cost for the circuit gives:
Plant costs = $2 615 000 = $10 460 000 0.25
These estimates do not include the equipment to dry and heat the heavy mineral concentrate and the costs refer to the separation circuit only.
FLOTATIONFroth flotation is the most common beneficiation process for the recovery of sulfide and oxide minerals containing copper, lead, zinc and nickel. Including costs for concrete foundations, structural steel, flotation equipment, pipework, electric instrumentation and building costs, flotation accounts for between eight and 18 per cent of the total project direct capital costs. An estimation of costs for different size plants is also outlined by Newell (1990).
The main froth flotation processes and equipment in use in Australia today are:
• mechanical • self-aerating cells – Wemco and Denver • forced draft – OK, Dorr Oliver and Agitair
• pneumatic • column with height to diameter ratio of 10:1 • Jameson cell with height to diameter ratio of 2:1 • Imhoflot G-Cells.
This section provides the basic guidelines for selecting equipment and estimating capital costs for these flotation processes.
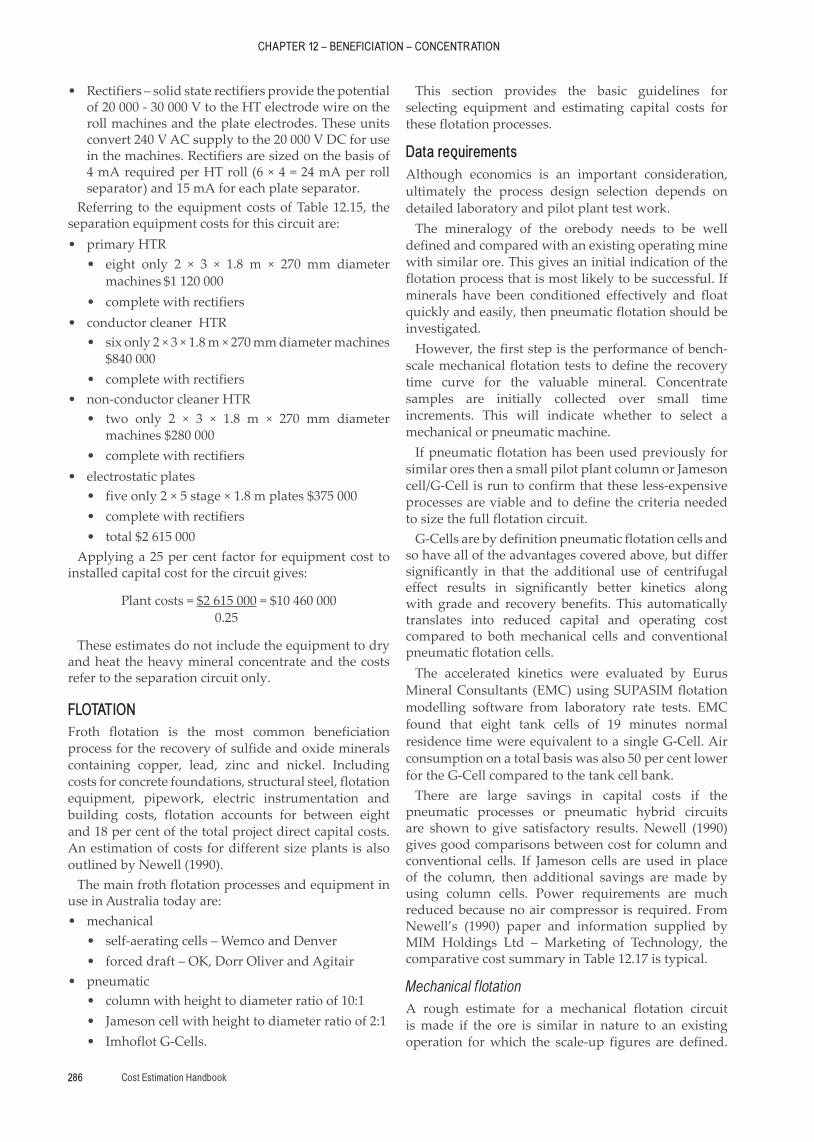
Data requirementsAlthough economics is an important consideration, ultimately the process design selection depends on detailed laboratory and pilot plant test work.
The mineralogy of the orebody needs to be well defined and compared with an existing operating mine with similar ore. This gives an initial indication of the flotation process that is most likely to be successful. If minerals have been conditioned effectively and float quickly and easily, then pneumatic flotation should be investigated.
However, the first step is the performance of bench-scale mechanical flotation tests to define the recovery time curve for the valuable mineral. Concentrate samples are initially collected over small time increments. This will indicate whether to select a mechanical or pneumatic machine.
If pneumatic flotation has been used previously for similar ores then a small pilot plant column or Jameson cell/G-Cell is run to confirm that these less-expensive processes are viable and to define the criteria needed to size the full flotation circuit.
G-Cells are by definition pneumatic flotation cells and so have all of the advantages covered above, but differ significantly in that the additional use of centrifugal effect results in significantly better kinetics along with grade and recovery benefits. This automatically translates into reduced capital and operating cost compared to both mechanical cells and conventional pneumatic flotation cells.
The accelerated kinetics were evaluated by Eurus Mineral Consultants (EMC) using SUPASIM flotation modelling software from laboratory rate tests. EMC found that eight tank cells of 19 minutes normal residence time were equivalent to a single G-Cell. Air consumption on a total basis was also 50 per cent lower for the G-Cell compared to the tank cell bank.
There are large savings in capital costs if the pneumatic processes or pneumatic hybrid circuits are shown to give satisfactory results. Newell (1990) gives good comparisons between cost for column and conventional cells. If Jameson cells are used in place of the column, then additional savings are made by using column cells. Power requirements are much reduced because no air compressor is required. From Newell’s (1990) paper and information supplied by MIM Holdings Ltd – Marketing of Technology, the comparative cost summary in Table 12.17 is typical.
Mechanical f lotationA rough estimate for a mechanical flotation circuit is made if the ore is similar in nature to an existing operation for which the scale-up figures are defined.
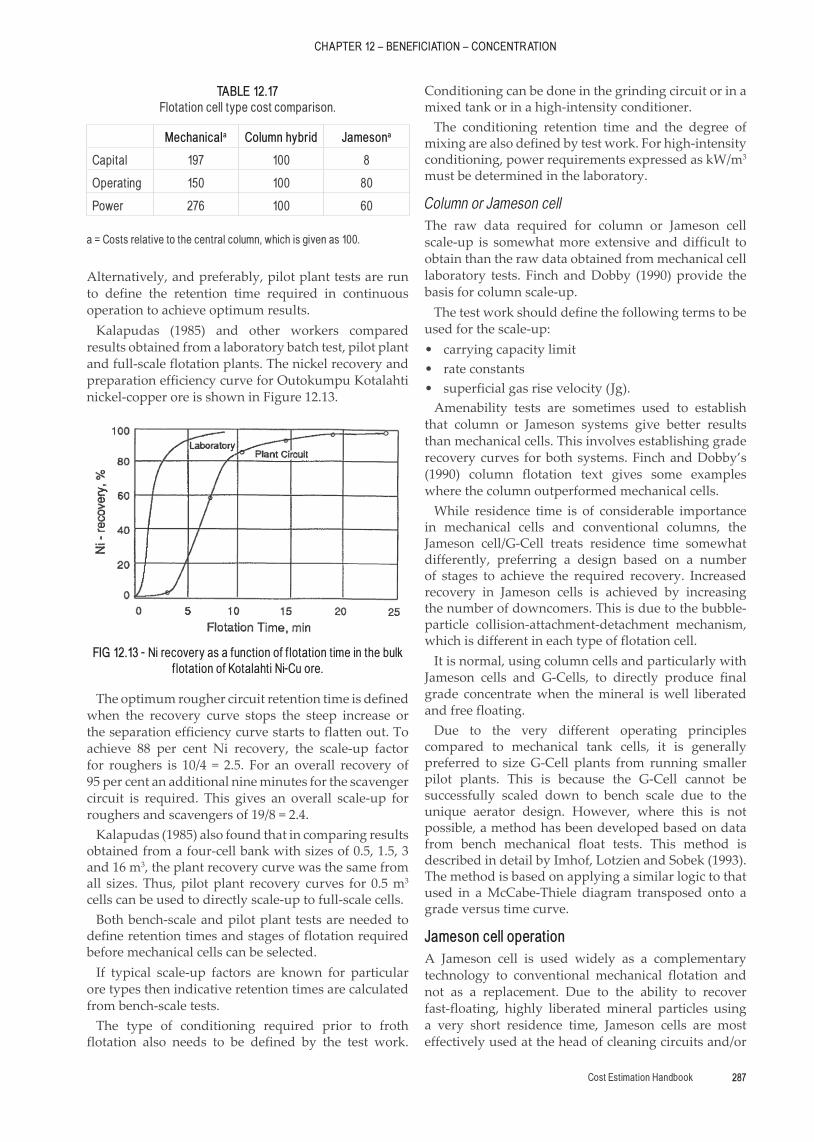
Cost Estimation Handbook 287
CHAPTER 12 – BENEFICIATION – CONCENTRATION
Alternatively, and preferably, pilot plant tests are run to define the retention time required in continuous operation to achieve optimum results.
Kalapudas (1985) and other workers compared results obtained from a laboratory batch test, pilot plant and full-scale flotation plants. The nickel recovery and preparation efficiency curve for Outokumpu Kotalahti nickel-copper ore is shown in Figure 12.13.
The optimum rougher circuit retention time is defined when the recovery curve stops the steep increase or the separation efficiency curve starts to flatten out. To achieve 88 per cent Ni recovery, the scale-up factor for roughers is 10/4 = 2.5. For an overall recovery of 95 per cent an additional nine minutes for the scavenger circuit is required. This gives an overall scale-up for roughers and scavengers of 19/8 = 2.4.
Kalapudas (1985) also found that in comparing results obtained from a four-cell bank with sizes of 0.5, 1.5, 3 and 16 m3, the plant recovery curve was the same from all sizes. Thus, pilot plant recovery curves for 0.5 m3 cells can be used to directly scale-up to full-scale cells.
Both bench-scale and pilot plant tests are needed to define retention times and stages of flotation required before mechanical cells can be selected.
If typical scale-up factors are known for particular ore types then indicative retention times are calculated from bench-scale tests.
The type of conditioning required prior to froth flotation also needs to be defined by the test work.
Conditioning can be done in the grinding circuit or in a mixed tank or in a high-intensity conditioner.
The conditioning retention time and the degree of mixing are also defined by test work. For high-intensity conditioning, power requirements expressed as kW/m3 must be determined in the laboratory.
Column or Jameson cellThe raw data required for column or Jameson cell scale-up is somewhat more extensive and difficult to obtain than the raw data obtained from mechanical cell laboratory tests. Finch and Dobby (1990) provide the basis for column scale-up.
The test work should define the following terms to be used for the scale-up:
• carrying capacity limit • rate constants • superficial gas rise velocity (Jg).Amenability tests are sometimes used to establish
that column or Jameson systems give better results than mechanical cells. This involves establishing grade recovery curves for both systems. Finch and Dobby’s (1990) column flotation text gives some examples where the column outperformed mechanical cells.
While residence time is of considerable importance in mechanical cells and conventional columns, the Jameson cell/G-Cell treats residence time somewhat differently, preferring a design based on a number of stages to achieve the required recovery. Increased recovery in Jameson cells is achieved by increasing the number of downcomers. This is due to the bubble-particle collision-attachment-detachment mechanism, which is different in each type of flotation cell.
It is normal, using column cells and particularly with Jameson cells and G-Cells, to directly produce final grade concentrate when the mineral is well liberated and free floating.
Due to the very different operating principles compared to mechanical tank cells, it is generally preferred to size G-Cell plants from running smaller pilot plants. This is because the G-Cell cannot be successfully scaled down to bench scale due to the unique aerator design. However, where this is not possible, a method has been developed based on data from bench mechanical float tests. This method is described in detail by Imhof, Lotzien and Sobek (1993). The method is based on applying a similar logic to that used in a McCabe-Thiele diagram transposed onto a grade versus time curve.
Jameson cell operationA Jameson cell is used widely as a complementary technology to conventional mechanical flotation and not as a replacement. Due to the ability to recover fast-floating, highly liberated mineral particles using a very short residence time, Jameson cells are most effectively used at the head of cleaning circuits and/or
TABLE 12.17Flotation cell type cost comparison.
Mechanicala Column hybrid Jamesona
Capital 197 100 8
Operating 150 100 80
Power 276 100 60
a = Costs relative to the central column, which is given as 100.
FIG 12.13 - Ni recovery as a function of f lotation time in the bulk f lotation of Kotalahti Ni-Cu ore.
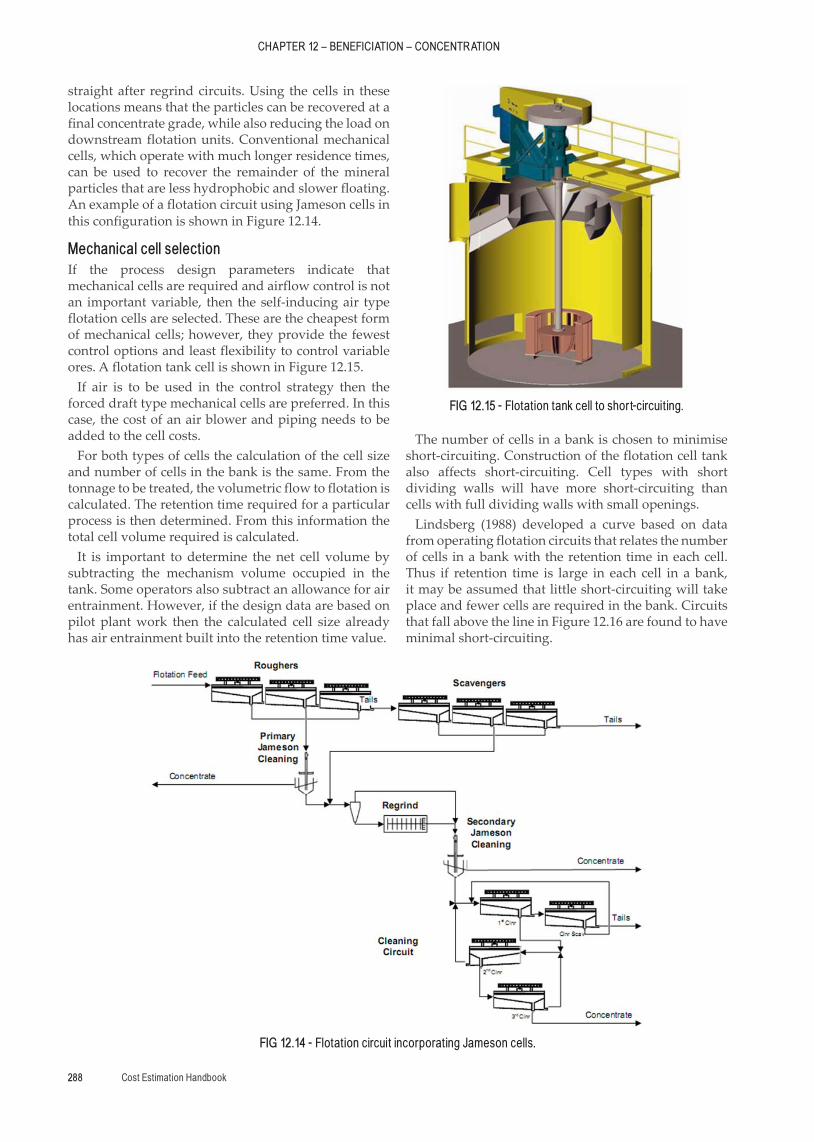
CHAPTER 12 – BENEFICIATION – CONCENTRATION
Cost Estimation Handbook288
straight after regrind circuits. Using the cells in these locations means that the particles can be recovered at a final concentrate grade, while also reducing the load on downstream flotation units. Conventional mechanical cells, which operate with much longer residence times, can be used to recover the remainder of the mineral particles that are less hydrophobic and slower floating. An example of a flotation circuit using Jameson cells in this configuration is shown in Figure 12.14.
Mechanical cell selectionIf the process design parameters indicate that mechanical cells are required and airflow control is not an important variable, then the self-inducing air type flotation cells are selected. These are the cheapest form of mechanical cells; however, they provide the fewest control options and least flexibility to control variable ores. A flotation tank cell is shown in Figure 12.15.
If air is to be used in the control strategy then the forced draft type mechanical cells are preferred. In this case, the cost of an air blower and piping needs to be added to the cell costs.
For both types of cells the calculation of the cell size and number of cells in the bank is the same. From the tonnage to be treated, the volumetric flow to flotation is calculated. The retention time required for a particular process is then determined. From this information the total cell volume required is calculated.
It is important to determine the net cell volume by subtracting the mechanism volume occupied in the tank. Some operators also subtract an allowance for air entrainment. However, if the design data are based on pilot plant work then the calculated cell size already has air entrainment built into the retention time value.
The number of cells in a bank is chosen to minimise short-circuiting. Construction of the flotation cell tank also affects short-circuiting. Cell types with short dividing walls will have more short-circuiting than cells with full dividing walls with small openings.
Lindsberg (1988) developed a curve based on data from operating flotation circuits that relates the number of cells in a bank with the retention time in each cell. Thus if retention time is large in each cell in a bank, it may be assumed that little short-circuiting will take place and fewer cells are required in the bank. Circuits that fall above the line in Figure 12.16 are found to have minimal short-circuiting.
FIG 12.14 - Flotation circuit incorporating Jameson cells.
FIG 12.15 - Flotation tank cell to shor t-circuiting.
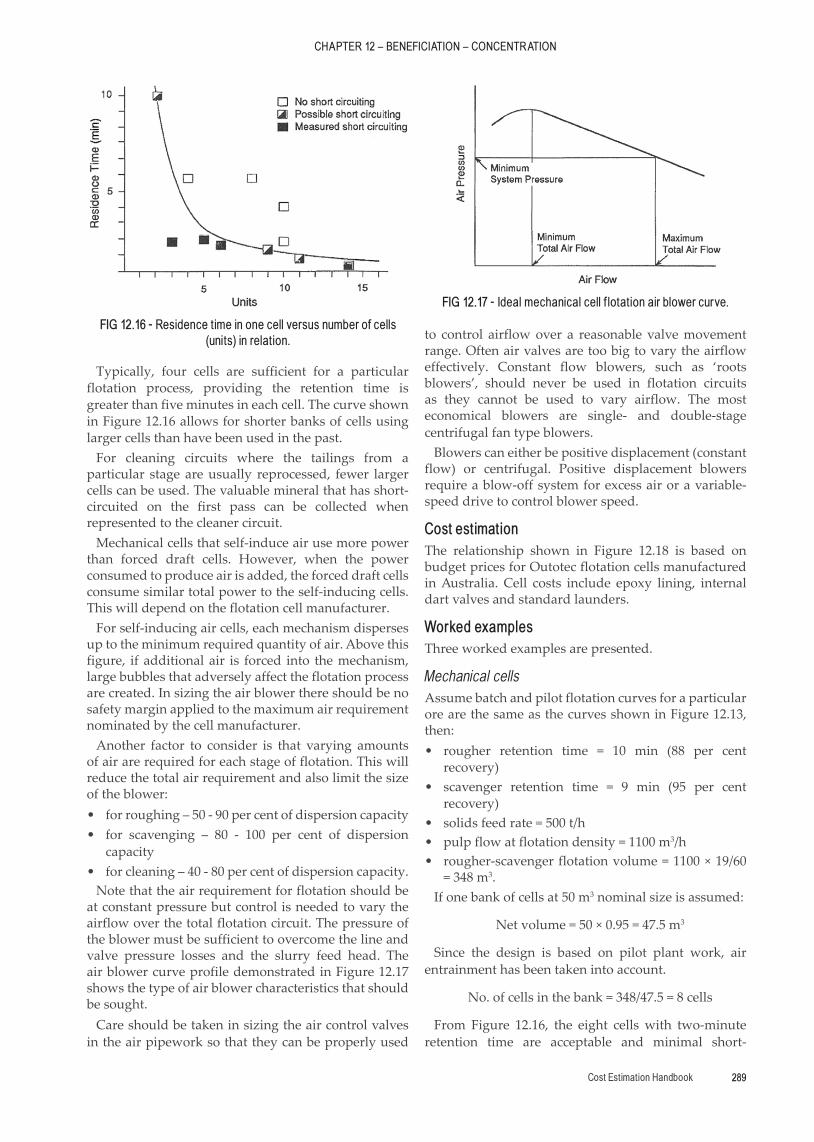
Cost Estimation Handbook 289
CHAPTER 12 – BENEFICIATION – CONCENTRATION
Typically, four cells are sufficient for a particular flotation process, providing the retention time is greater than five minutes in each cell. The curve shown in Figure 12.16 allows for shorter banks of cells using larger cells than have been used in the past.
For cleaning circuits where the tailings from a particular stage are usually reprocessed, fewer larger cells can be used. The valuable mineral that has short-circuited on the first pass can be collected when represented to the cleaner circuit.
Mechanical cells that self-induce air use more power than forced draft cells. However, when the power consumed to produce air is added, the forced draft cells consume similar total power to the self-inducing cells. This will depend on the flotation cell manufacturer.
For self-inducing air cells, each mechanism disperses up to the minimum required quantity of air. Above this figure, if additional air is forced into the mechanism, large bubbles that adversely affect the flotation process are created. In sizing the air blower there should be no safety margin applied to the maximum air requirement nominated by the cell manufacturer.
Another factor to consider is that varying amounts of air are required for each stage of flotation. This will reduce the total air requirement and also limit the size of the blower:
• for roughing – 50 - 90 per cent of dispersion capacity • for scavenging – 80 - 100 per cent of dispersion
capacity • for cleaning – 40 - 80 per cent of dispersion capacity.Note that the air requirement for flotation should be
at constant pressure but control is needed to vary the airflow over the total flotation circuit. The pressure of the blower must be sufficient to overcome the line and valve pressure losses and the slurry feed head. The air blower curve profile demonstrated in Figure 12.17 shows the type of air blower characteristics that should be sought.
Care should be taken in sizing the air control valves in the air pipework so that they can be properly used
to control airflow over a reasonable valve movement range. Often air valves are too big to vary the airflow effectively. Constant flow blowers, such as ‘roots blowers’, should never be used in flotation circuits as they cannot be used to vary airflow. The most economical blowers are single- and double-stage centrifugal fan type blowers.
Blowers can either be positive displacement (constant flow) or centrifugal. Positive displacement blowers require a blow-off system for excess air or a variable-speed drive to control blower speed.
Cost estimationThe relationship shown in Figure 12.18 is based on budget prices for Outotec flotation cells manufactured in Australia. Cell costs include epoxy lining, internal dart valves and standard launders.
Worked examplesThree worked examples are presented.
Mechanical cellsAssume batch and pilot flotation curves for a particular ore are the same as the curves shown in Figure 12.13, then:
• rougher retention time = 10 min (88 per cent recovery)
• scavenger retention time = 9 min (95 per cent recovery)
• solids feed rate = 500 t/h • pulp flow at flotation density = 1100 m3/h • rougher-scavenger flotation volume = 1100 × 19/60
= 348 m3.If one bank of cells at 50 m3 nominal size is assumed:
Net volume = 50 × 0.95 = 47.5 m3
Since the design is based on pilot plant work, air entrainment has been taken into account.
No. of cells in the bank = 348/47.5 = 8 cells
From Figure 12.16, the eight cells with two-minute retention time are acceptable and minimal short-
FIG 12.16 - Residence time in one cell versus number of cells (units) in relation.
FIG 12.17 - Ideal mechanical cell f lotation air blower curve.
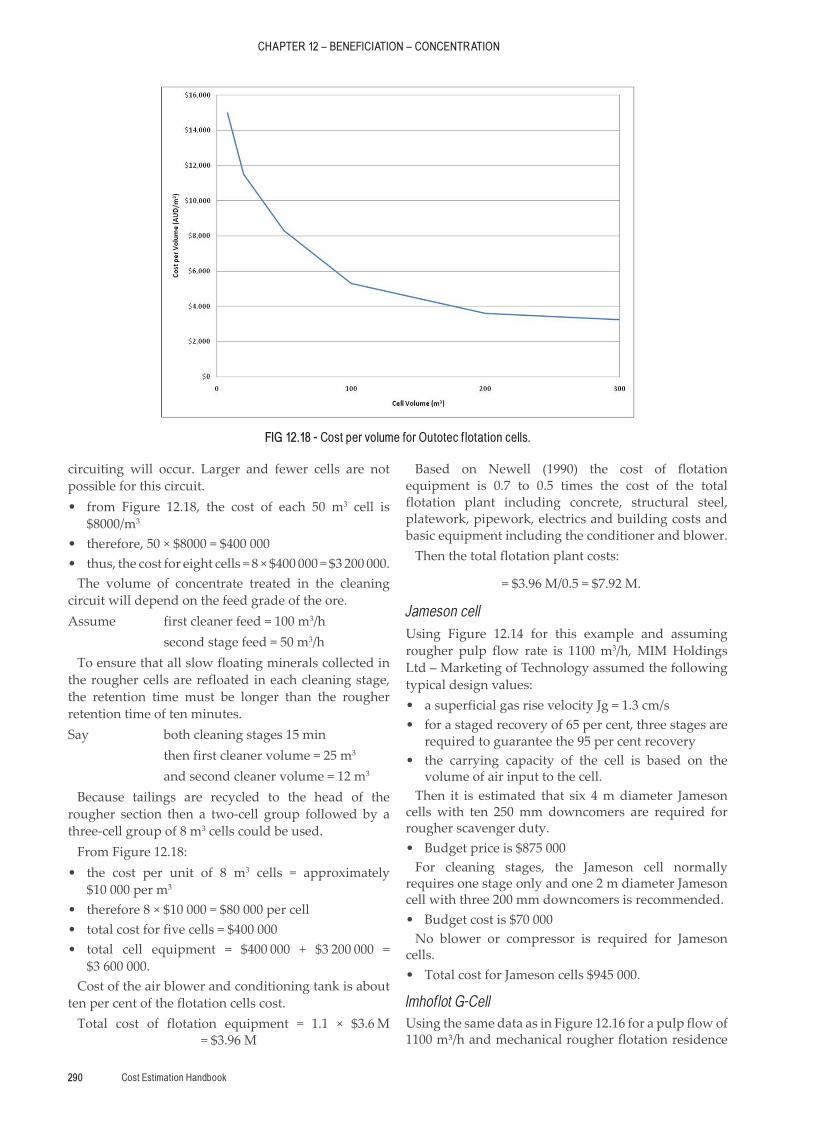
CHAPTER 12 – BENEFICIATION – CONCENTRATION
Cost Estimation Handbook290
circuiting will occur. Larger and fewer cells are not possible for this circuit.
• from Figure 12.18, the cost of each 50 m3 cell is $8000/m3
• therefore, 50 × $8000 = $400 000 • thus, the cost for eight cells = 8 × $400 000 = $3 200 000.The volume of concentrate treated in the cleaning
circuit will depend on the feed grade of the ore.Assume first cleaner feed = 100 m3/h second stage feed = 50 m3/h
To ensure that all slow floating minerals collected in the rougher cells are refloated in each cleaning stage, the retention time must be longer than the rougher retention time of ten minutes.Say both cleaning stages 15 min then first cleaner volume = 25 m3
and second cleaner volume = 12 m3
Because tailings are recycled to the head of the rougher section then a two-cell group followed by a three-cell group of 8 m3 cells could be used.
From Figure 12.18: • the cost per unit of 8 m3 cells = approximately
$10 000 per m3
• therefore 8 × $10 000 = $80 000 per cell • total cost for five cells = $400 000 • total cell equipment = $400 000 + $3 200 000 =
$3 600 000.Cost of the air blower and conditioning tank is about
ten per cent of the flotation cells cost.Total cost of flotation equipment = 1.1 × $3.6 M
= $3.96 M
Based on Newell (1990) the cost of flotation equipment is 0.7 to 0.5 times the cost of the total flotation plant including concrete, structural steel, platework, pipework, electrics and building costs and basic equipment including the conditioner and blower.
Then the total flotation plant costs:
= $3.96 M/0.5 = $7.92 M.
Jameson cellUsing Figure 12.14 for this example and assuming rougher pulp flow rate is 1100 m3/h, MIM Holdings Ltd – Marketing of Technology assumed the following typical design values:
• a superficial gas rise velocity Jg = 1.3 cm/s • for a staged recovery of 65 per cent, three stages are
required to guarantee the 95 per cent recovery • the carrying capacity of the cell is based on the
volume of air input to the cell.Then it is estimated that six 4 m diameter Jameson
cells with ten 250 mm downcomers are required for rougher scavenger duty.
• Budget price is $875 000For cleaning stages, the Jameson cell normally
requires one stage only and one 2 m diameter Jameson cell with three 200 mm downcomers is recommended.
• Budget cost is $70 000No blower or compressor is required for Jameson
cells. • Total cost for Jameson cells $945 000.
Imhoflot G-CellUsing the same data as in Figure 12.16 for a pulp flow of 1100 m³/h and mechanical rougher flotation residence
FIG 12.18 - Cost per volume for Outotec f lotation cells.
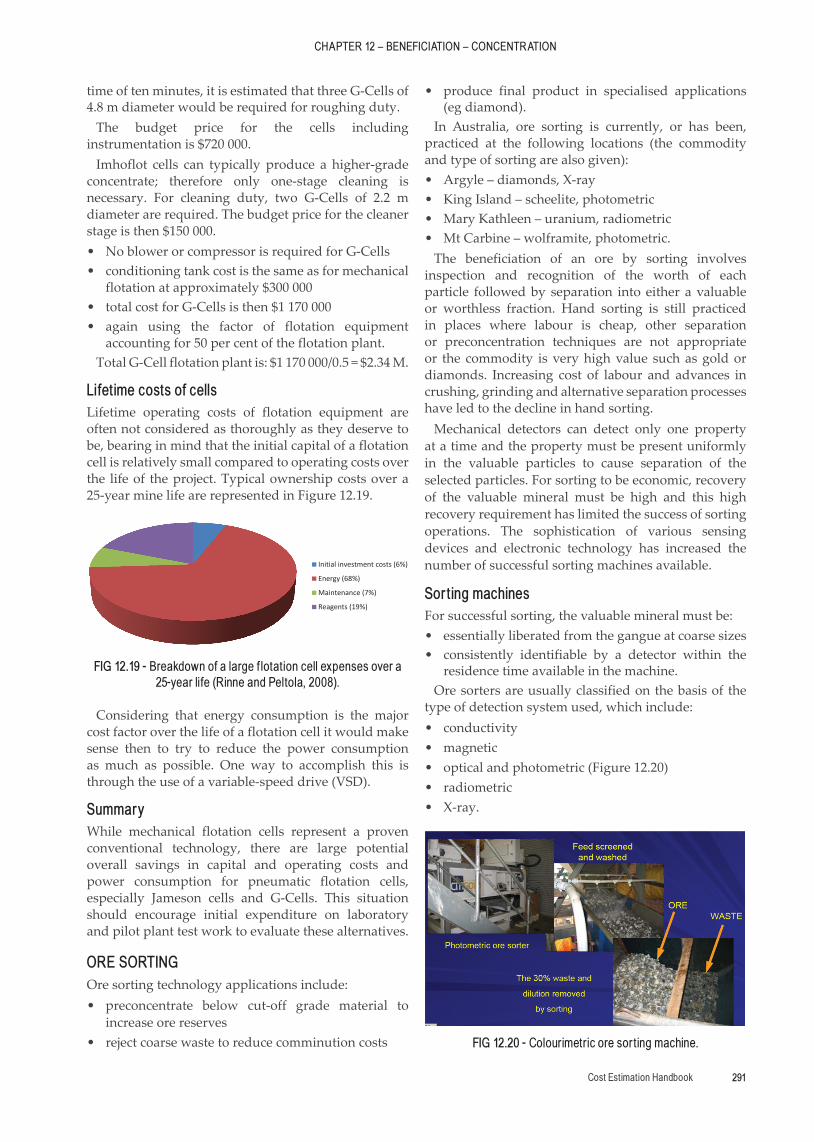
Cost Estimation Handbook 291
CHAPTER 12 – BENEFICIATION – CONCENTRATION
time of ten minutes, it is estimated that three G-Cells of 4.8 m diameter would be required for roughing duty.
The budget price for the cells including instrumentation is $720 000.
Imhoflot cells can typically produce a higher-grade concentrate; therefore only one-stage cleaning is necessary. For cleaning duty, two G-Cells of 2.2 m diameter are required. The budget price for the cleaner stage is then $150 000.
• No blower or compressor is required for G-Cells • conditioning tank cost is the same as for mechanical
flotation at approximately $300 000 • total cost for G-Cells is then $1 170 000 • again using the factor of flotation equipment
accounting for 50 per cent of the flotation plant.Total G-Cell flotation plant is: $1 170 000/0.5 = $2.34 M.
Lifetime costs of cellsLifetime operating costs of flotation equipment are often not considered as thoroughly as they deserve to be, bearing in mind that the initial capital of a flotation cell is relatively small compared to operating costs over the life of the project. Typical ownership costs over a 25-year mine life are represented in Figure 12.19.
Considering that energy consumption is the major cost factor over the life of a flotation cell it would make sense then to try to reduce the power consumption as much as possible. One way to accomplish this is through the use of a variable-speed drive (VSD).
SummaryWhile mechanical flotation cells represent a proven conventional technology, there are large potential overall savings in capital and operating costs and power consumption for pneumatic flotation cells, especially Jameson cells and G-Cells. This situation should encourage initial expenditure on laboratory and pilot plant test work to evaluate these alternatives.
ORE SORTINGOre sorting technology applications include:
• preconcentrate below cut-off grade material to increase ore reserves
• reject coarse waste to reduce comminution costs
• produce final product in specialised applications (eg diamond).
In Australia, ore sorting is currently, or has been, practiced at the following locations (the commodity and type of sorting are also given):
• Argyle – diamonds, X-ray • King Island – scheelite, photometric • Mary Kathleen – uranium, radiometric • Mt Carbine – wolframite, photometric.The beneficiation of an ore by sorting involves
inspection and recognition of the worth of each particle followed by separation into either a valuable or worthless fraction. Hand sorting is still practiced in places where labour is cheap, other separation or preconcentration techniques are not appropriate or the commodity is very high value such as gold or diamonds. Increasing cost of labour and advances in crushing, grinding and alternative separation processes have led to the decline in hand sorting.
Mechanical detectors can detect only one property at a time and the property must be present uniformly in the valuable particles to cause separation of the selected particles. For sorting to be economic, recovery of the valuable mineral must be high and this high recovery requirement has limited the success of sorting operations. The sophistication of various sensing devices and electronic technology has increased the number of successful sorting machines available.
Sorting machinesFor successful sorting, the valuable mineral must be:
• essentially liberated from the gangue at coarse sizes • consistently identifiable by a detector within the
residence time available in the machine.Ore sorters are usually classified on the basis of the
type of detection system used, which include: • conductivity • magnetic • optical and photometric (Figure 12.20) • radiometric • X-ray.
FIG 12.19
Initial investment costs (6%)
Energy (68%)
Maintenance (7%)
Reagents (19%)
FIG 12.19 - Breakdown of a large f lotation cell expenses over a 25-year life (Rinne and Peltola, 2008).
FIG 12.20 - Colourimetric ore sor ting machine.
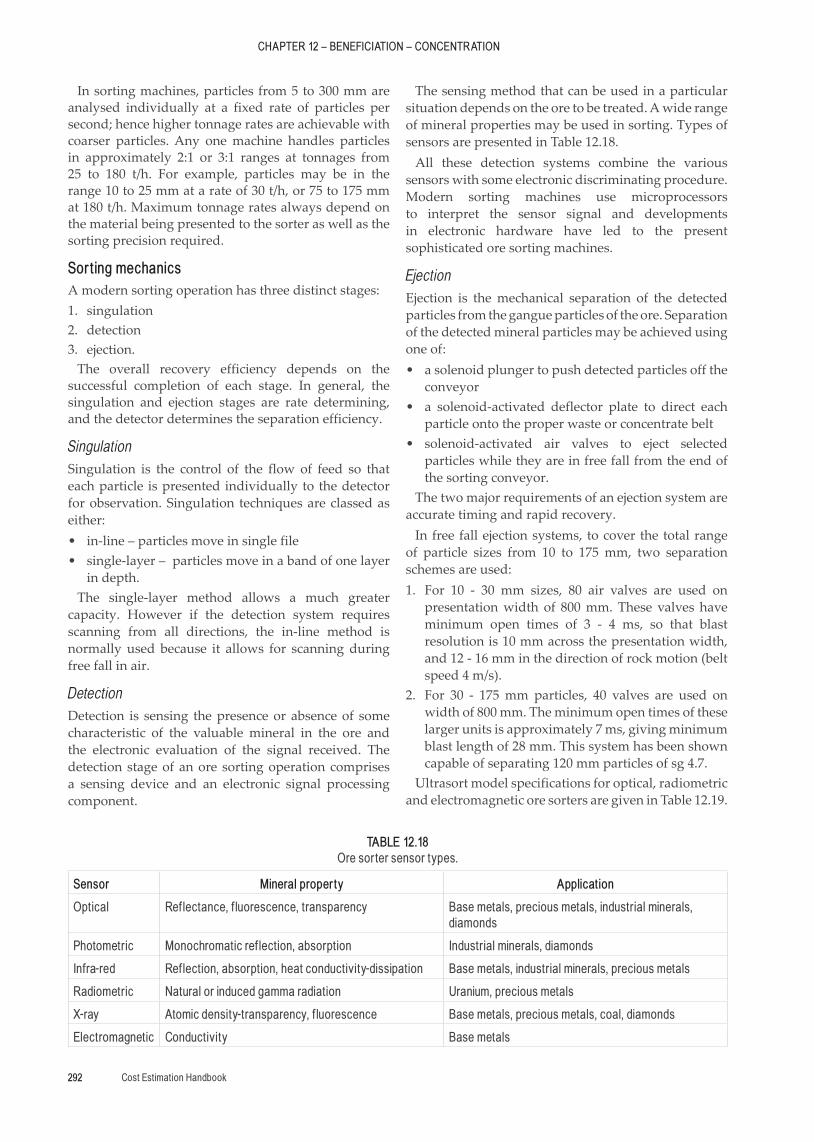
CHAPTER 12 – BENEFICIATION – CONCENTRATION
Cost Estimation Handbook292
In sorting machines, particles from 5 to 300 mm are analysed individually at a fixed rate of particles per second; hence higher tonnage rates are achievable with coarser particles. Any one machine handles particles in approximately 2:1 or 3:1 ranges at tonnages from 25 to 180 t/h. For example, particles may be in the range 10 to 25 mm at a rate of 30 t/h, or 75 to 175 mm at 180 t/h. Maximum tonnage rates always depend on the material being presented to the sorter as well as the sorting precision required.
Sorting mechanicsA modern sorting operation has three distinct stages:1. singulation2. detection3. ejection.
The overall recovery efficiency depends on the successful completion of each stage. In general, the singulation and ejection stages are rate determining, and the detector determines the separation efficiency.
SingulationSingulation is the control of the flow of feed so that each particle is presented individually to the detector for observation. Singulation techniques are classed as either:
• in-line – particles move in single file • single-layer – particles move in a band of one layer
in depth.The single-layer method allows a much greater
capacity. However if the detection system requires scanning from all directions, the in-line method is normally used because it allows for scanning during free fall in air.
DetectionDetection is sensing the presence or absence of some characteristic of the valuable mineral in the ore and the electronic evaluation of the signal received. The detection stage of an ore sorting operation comprises a sensing device and an electronic signal processing component.
The sensing method that can be used in a particular situation depends on the ore to be treated. A wide range of mineral properties may be used in sorting. Types of sensors are presented in Table 12.18.
All these detection systems combine the various sensors with some electronic discriminating procedure. Modern sorting machines use microprocessors to interpret the sensor signal and developments in electronic hardware have led to the present sophisticated ore sorting machines.
EjectionEjection is the mechanical separation of the detected particles from the gangue particles of the ore. Separation of the detected mineral particles may be achieved using one of:
• a solenoid plunger to push detected particles off the conveyor
• a solenoid-activated deflector plate to direct each particle onto the proper waste or concentrate belt
• solenoid-activated air valves to eject selected particles while they are in free fall from the end of the sorting conveyor.
The two major requirements of an ejection system are accurate timing and rapid recovery.
In free fall ejection systems, to cover the total range of particle sizes from 10 to 175 mm, two separation schemes are used:1. For 10 - 30 mm sizes, 80 air valves are used on
presentation width of 800 mm. These valves have minimum open times of 3 - 4 ms, so that blast resolution is 10 mm across the presentation width, and 12 - 16 mm in the direction of rock motion (belt speed 4 m/s).
2. For 30 - 175 mm particles, 40 valves are used on width of 800 mm. The minimum open times of these larger units is approximately 7 ms, giving minimum blast length of 28 mm. This system has been shown capable of separating 120 mm particles of sg 4.7.
Ultrasort model specifications for optical, radiometric and electromagnetic ore sorters are given in Table 12.19.
TABLE 12.18Ore sor ter sensor types.
Sensor Mineral property Application
Optical Ref lectance, f luorescence, transparency Base metals, precious metals, industrial minerals, diamonds
Photometric Monochromatic ref lection, absorption Industrial minerals, diamonds
Infra-red Ref lection, absorption, heat conductivity-dissipation Base metals, industrial minerals, precious metals
Radiometric Natural or induced gamma radiation Uranium, precious metals
X-ray Atomic density-transparency, f luorescence Base metals, precious metals, coal, diamonds
Electromagnetic Conductivity Base metals
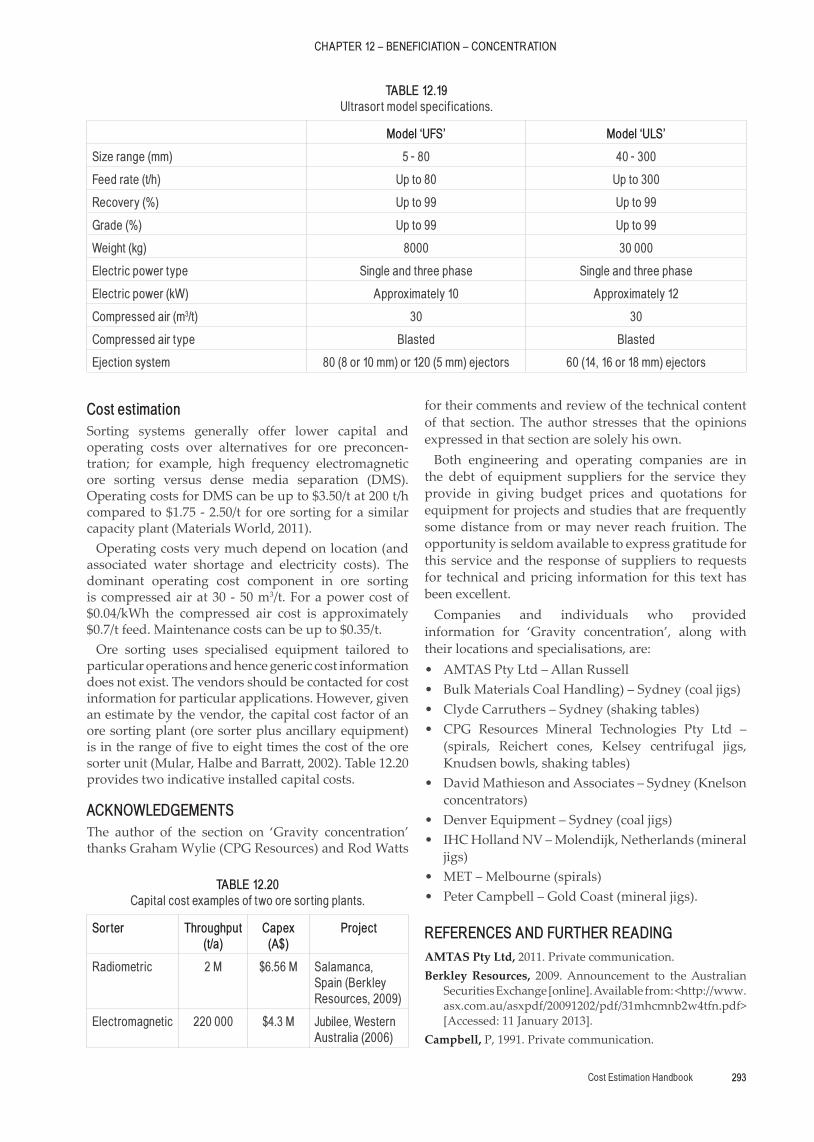
Cost Estimation Handbook 293
CHAPTER 12 – BENEFICIATION – CONCENTRATION
Cost estimationSorting systems generally offer lower capital and operating costs over alternatives for ore preconcen-tration; for example, high frequency electromagnetic ore sorting versus dense media separation (DMS). Operating costs for DMS can be up to $3.50/t at 200 t/h compared to $1.75 - 2.50/t for ore sorting for a similar capacity plant (Materials World, 2011).
Operating costs very much depend on location (and associated water shortage and electricity costs). The dominant operating cost component in ore sorting is compressed air at 30 - 50 m3/t. For a power cost of $0.04/kWh the compressed air cost is approximately $0.7/t feed. Maintenance costs can be up to $0.35/t.
Ore sorting uses specialised equipment tailored to particular operations and hence generic cost information does not exist. The vendors should be contacted for cost information for particular applications. However, given an estimate by the vendor, the capital cost factor of an ore sorting plant (ore sorter plus ancillary equipment) is in the range of five to eight times the cost of the ore sorter unit (Mular, Halbe and Barratt, 2002). Table 12.20 provides two indicative installed capital costs.
ACKNOWLEDGEMENTSThe author of the section on ‘Gravity concentration’ thanks Graham Wylie (CPG Resources) and Rod Watts
for their comments and review of the technical content of that section. The author stresses that the opinions expressed in that section are solely his own.
Both engineering and operating companies are in the debt of equipment suppliers for the service they provide in giving budget prices and quotations for equipment for projects and studies that are frequently some distance from or may never reach fruition. The opportunity is seldom available to express gratitude for this service and the response of suppliers to requests for technical and pricing information for this text has been excellent.
Companies and individuals who provided information for ‘Gravity concentration’, along with their locations and specialisations, are:
• AMTAS Pty Ltd – Allan Russell • Bulk Materials Coal Handling) – Sydney (coal jigs) • Clyde Carruthers – Sydney (shaking tables) • CPG Resources Mineral Technologies Pty Ltd –
(spirals, Reichert cones, Kelsey centrifugal jigs, Knudsen bowls, shaking tables)
• David Mathieson and Associates – Sydney (Knelson concentrators)
• Denver Equipment – Sydney (coal jigs) • IHC Holland NV – Molendijk, Netherlands (mineral
jigs) • MET – Melbourne (spirals) • Peter Campbell – Gold Coast (mineral jigs).
REFERENCES AND FURTHER READINGAMTAS Pty Ltd, 2011. Private communication.Berkley Resources, 2009. Announcement to the Australian
Securities Exchange [online]. Available from: <http://www.asx.com.au/asxpdf/20091202/pdf/31mhcmnb2w4tfn.pdf> [Accessed: 11 January 2013].
Campbell, P, 1991. Private communication.
TABLE 12.20Capital cost examples of two ore sor ting plants.
Sorter Throughput (t/a)
Capex (A$)
Project
Radiometric 2 M $6.56 M Salamanca, Spain (Berkley Resources, 2009)
Electromagnetic 220 000 $4.3 M Jubilee, Western Australia (2006)
TABLE 12.19Ultrasor t model specif ications.
Model ‘UFS’ Model ‘ULS’
Size range (mm) 5 - 80 40 - 300
Feed rate (t/h) Up to 80 Up to 300
Recovery (%) Up to 99 Up to 99
Grade (%) Up to 99 Up to 99
Weight (kg) 8000 30 000
Electric power type Single and three phase Single and three phase
Electric power (kW) Approximately 10 Approximately 12
Compressed air (m3/t) 30 30
Compressed air type Blasted Blasted
Ejection system 80 (8 or 10 mm) or 120 (5 mm) ejectors 60 (14, 16 or 18 mm) ejectors
CHAPTER 12 – BENEFICIATION – CONCENTRATION
Cost Estimation Handbook294
Collier, D, Dwyer, F B, Thompson, R and Wulff, E, 1973. Ore sorters for asbestos and scheelite, in Proceedings International Conference on Mining and Metallurgy, London, pp 1007-1022.
Finch, J A and Dobby, G S, 1990. Column Flotation, first edition (Pergamon Press: Oxford).
French, R R, 1968. Beneficiation of low-grade gypsum by electronic color sorting, Transactions Society Mining Engineers, 241(Sept):331-334.
Goode, J R, 1975. Recent coarse ore sorting advances, Canadian Mining Journal, June, pp 49-50.
Goodman, R H and O’Keefe, K F, 1980. Tin ore treatment at Renison Ltd, Renison, Tas, in Mining and Metallurgical Practices in Australasia: The Sir Maurice Mawby Memorial Volume (The Australasian Institute of Mining and Metallurgy: Melbourne).
Guest, R N and Dunne, R C, 1985. An evaluation of gravity separators by use of a synthetic ore, Journal of the South African Institute of Mining and Metallurgy, June.
Hunt, H, Maskowitz, B and Banerjee, S, 1995. Magnetic properties of rocks and minerals, in Rock Physics and Phase Relations (ed: T Ahrens), (AGU: Washington DC).
Imhof, R M, Lotzien, R and Sobek, S, 1993. Pneumatic flotation: A reliable procedure for a correct plant layout, in Proceedings XVIII International Mineral Processing Congress, pp 971-978 (The Australasian Institute of Mining and Metallurgy: Melbourne).
Jenkinson, D E, Gough, P B, King, H G and Daykin, K W, 1974. Coal sorting by X-ray transmission, in Proceedings Tenth International Mineral Processing Congress, London, pp 1023-1041.
Jubilee Mining, 2006. Mined products made responsibly [online]. Available from: <http://www.infomine.com/publications/docs/InternationalMining/Chadwick2006j.pdf> [Accessed: 15 November 2011).
Kalapudas, R, 1985. A study on scaling up of laboratory batch flotation data to industrial size flotation, in Proceedings XV International Mineral Processing Congress, France.
Kelly, E G and Spottiswood, D J, 1982. Introduction to Mineral Processing, pp 237-242 (John Wiley and Sons: New York).
Laplante, A R, 2000. A standardized test to determine gravity recoverable gold, McGill University.
Lindsberg, R, 1988. Column flotation of various process stages, SME Annual Meeting, Phoenix, Arizona.
Materials World, 2011. Sorting out low-grade nickel ores [online]. Available from: <http://www.iom3.org/news/sorting-out-low-grade-nickel-ores> [Accessed: 7 April 2011].
Miller, V R, Nash, R and Schwaneke, A E, 1974. Detecting and sorting disseminated native copper ores, US Bureau of Mines, report of investigations RI7904.
Mular, A, Halbe, D and Barratt, D, 2002. Mineral Processing Plant Design, Practice and Control Proceedings (Society for Mining, Metallurgy, and Exploration: New York).
Newell, A, 1990. Column flotation versus conventional flotation, a comparison of costs, in Proceedings Mining Industry Capital and Operating Cost Estimation Conference (The Australasian Institute of Mining and Metallurgy: Melbourne).
Newman, P C and Whelm, P F, 1953. Photometric separation of ores in lump form, in Recent Developments in Mineral Dressing, pp 359-381 (The Australasian Institute of Mining and Metallurgy: Melbourne).
Private correspondence with flotation machine manufacturers.
Rinne, A and Peltola, A, 2008. On lifetime costs of flotation operations, Minerals Engineering, 21:846-850.
Robinson, R I, 1980. Tin-copper ore treatment at Cleveland Tin Ltd, Luina, Tas, in Mining and Metallurgical Practices in Australasia: The Sir Maurice Mawby Memorial Volume (The Australasian Institute of Mining and Metallurgy: Melbourne).
Schapper, M A, 1977. Beneficiation at large particle size using photometric sorting techniques, Australian Mining, April, pp 44-53.
Smith, C, 1991. Private communication.Taggart, A F, 1945. Handbook of Mineral Dressing, tenth
printing 1967, p 11-02 (John Wiley & Sons: New York).Wills, B A, 1985. Mineral Processing Technology, third edition,
pp 522-530 (Pergamon Press: Oxford).Wills, B A, 1989. Minerals Processing Technology, fourth edition
(Pergamon Press: Oxford).Woodcock, J T (ed), 1980. Mining and Metallurgical Practices
in Australasia: The Sir Maurice Mawby Memorial Volume, contains descriptions of hard rock and alluvial tin, tungsten, tantalum, beach sands and coal circuits (The Australasian Institute of Mining and Metallurgy: Melbourne).