Bend Oregon Monthly Real Estate Trends - September 2011
3
1033 NW NEWPORT AVE BEND, OR 97701 TEL (541) 383-1426 FAX (866) 552-3220 WWW.BENDPROPERTYLISTINGS.COM STATISTICS COMPILED BY TEAM TERRY SKJERSAA. INFORMATION DEEMED RELIABLE BUT NOT GUARANTEED. TEAM TERRY JASON BOONE - PRINCIPAL BROKER, CRIS JASON@GOTEAMTERRY.COM MOLLIE HOGAN - PRINCIPAL BROKER MOLLIE@GOTEAMTERRY.COM TERRY SKJERSAA - PRINCIPAL BROKER, CRS TERRY@GOTEAMTERRY.COM :: Bend Oregon Residential Real Estate Market Trends Monthly Report :: 6/1/11 through 6/30/11 Price Range # Active # New # Pending # Reduced # Sold Avg SP/LP Avg DOM Months of Inv. $125,000 $225,000 105 95 72 39 47 99% 143 2.2 $225,100 $325,000 101 66 39 22 35 97% 94 2.9 $325,100 $425,000 95 39 21 33 17 97% 156 5.6 $425,100 $525,000 63 26 3 24 3 101% 366 21.0 $525,100 $625,000 36 14 2 5 2 92% 815 18.0 $625,100 & up 86 26 5 19 4 93% 198 21.5 Totals/Averages 486 266 142 142 108 97% 295 11.9 7/1/11 through 7/31/11 Price Range # Active # New # Pending # Reduced # Sold Avg SP/LP Avg DOM Months of Inv. $125,000 $225,000 142 68 70 57 52 98% 92 2.7 $225,100 $325,000 115 46 40 41 25 98% 98 4.6 $325,100 $425,000 111 29 14 32 12 98% 120 9.3 $425,100 $525,000 75 24 15 26 6 98% 123 12.5 $525,100 $625,000 43 12 5 15 1 100% 79 43.0 $625,100 & up 102 23 5 16 4 91% 319 25.5 Totals/Averages 588 202 149 187 100 97% 139 16.3 8/1/11 through 8/31/11 Price Range # Active # New # Pending # Reduced # Sold Avg SP/LP Avg DOM Months of Inv. $125,000 $225,000 132 73 64 71 65 97% 110 2.0 $225,100 $325,000 115 35 38 42 38 97% 134 3.0 $325,100 $425,000 116 19 22 35 12 97% 106 9.7 $425,100 $525,000 89 15 13 35 14 96% 124 6.4 $525,100 $625,000 44 4 2 19 0 $625,100 & up 114 20 5 19 3 92% 249 38.0 Totals/Averages 610 166 144 221 132 96% 145 11.8 9/1/11 through 9/30/11 Price Range # Active # New # Pending # Reduced # Sold Avg SP/LP Avg DOM Months of Inv. $125,000 $225,000 138 62 61 57 60 98% 116 2.3 $225,100 $325,000 117 21 26 44 22 97% 139 5.3 $325,100 $425,000 107 26 21 29 18 96% 117 5.9 $425,100 $525,000 86 9 5 17 8 97% 82 10.8 $525,100 $625,000 38 3 3 14 2 94% 222 19.0 $625,100 & up 115 10 3 16 4 99% 195 28.8 Totals/Averages 601 131 119 177 114 97% 145 12.0 Active $125 $225 $225 $325 $325 $425 $425 $525 $525 $625 $625 & up Total 10/1/11 134 108 111 73 37 96 559 Date Range Date Range Date Range Date Range
-
Upload
duke-warner-realty -
Category
Documents
-
view
213 -
download
0
description
Monthly real estate statistics and trends for Bend, Oregon. A detailed analysis of sales activity and inventory of residential homes, homes on acreage and bare land.
Transcript of Bend Oregon Monthly Real Estate Trends - September 2011
1033 NW NeWport Ave BeNd, or 97701tel (541) 383-1426 FAx (866) 552-3220 WWW.BeNdpropertylistiNgs.com
stAtistics compiled By teAm terry skjersAA. iNFormAtioN deemed reliABle But Not guArANteed.
Team Terry
jAsoN BooNe - priNcipAl Broker, [email protected]
mollie HogAN - priNcipAl [email protected]
terry skjersAA - priNcipAl Broker, [email protected]
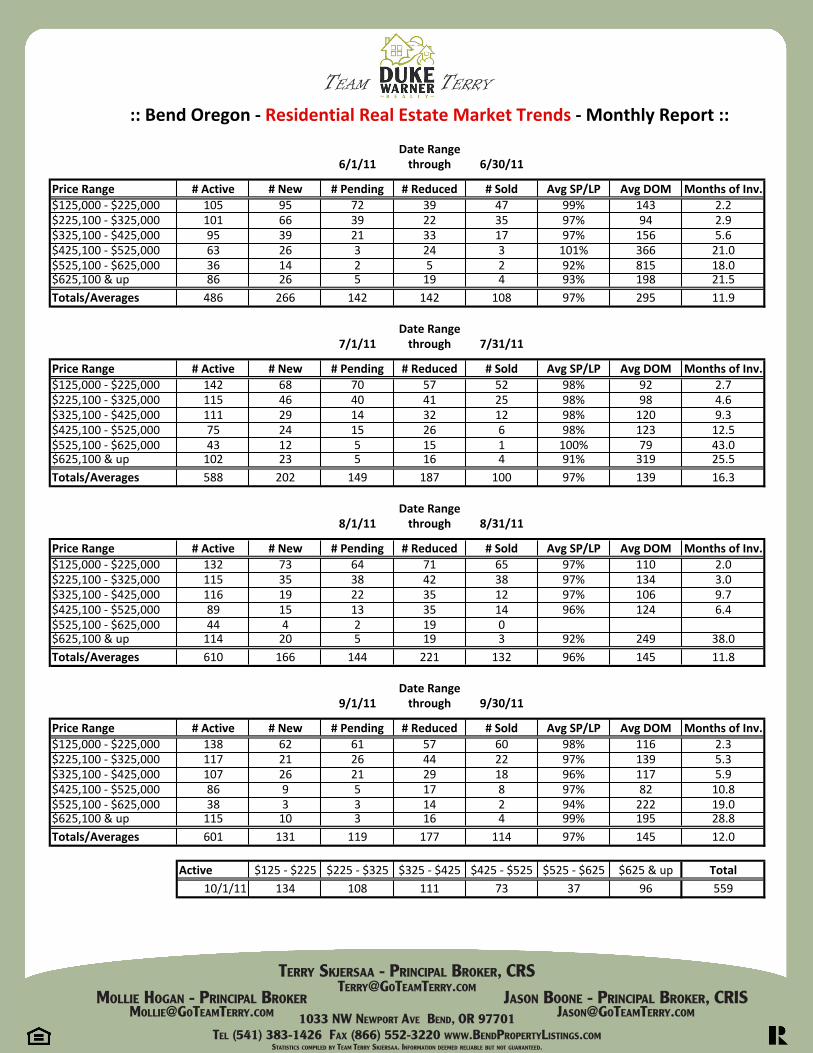
:: Bend Oregon -‐ Residential Real Estate Market Trends -‐ Monthly Report ::
6/1/11 through 6/30/11
Price Range # Active # New # Pending # Reduced # Sold Avg SP/LP Avg DOM Months of Inv.$125,000 -‐ $225,000 105 95 72 39 47 99% 143 2.2$225,100 -‐ $325,000 101 66 39 22 35 97% 94 2.9$325,100 -‐ $425,000 95 39 21 33 17 97% 156 5.6$425,100 -‐ $525,000 63 26 3 24 3 101% 366 21.0$525,100 -‐ $625,000 36 14 2 5 2 92% 815 18.0$625,100 & up 86 26 5 19 4 93% 198 21.5Totals/Averages 486 266 142 142 108 97% 295 11.9
7/1/11 through 7/31/11
Price Range # Active # New # Pending # Reduced # Sold Avg SP/LP Avg DOM Months of Inv.$125,000 -‐ $225,000 142 68 70 57 52 98% 92 2.7$225,100 -‐ $325,000 115 46 40 41 25 98% 98 4.6$325,100 -‐ $425,000 111 29 14 32 12 98% 120 9.3$425,100 -‐ $525,000 75 24 15 26 6 98% 123 12.5$525,100 -‐ $625,000 43 12 5 15 1 100% 79 43.0$625,100 & up 102 23 5 16 4 91% 319 25.5Totals/Averages 588 202 149 187 100 97% 139 16.3
8/1/11 through 8/31/11
Price Range # Active # New # Pending # Reduced # Sold Avg SP/LP Avg DOM Months of Inv.$125,000 -‐ $225,000 132 73 64 71 65 97% 110 2.0$225,100 -‐ $325,000 115 35 38 42 38 97% 134 3.0$325,100 -‐ $425,000 116 19 22 35 12 97% 106 9.7$425,100 -‐ $525,000 89 15 13 35 14 96% 124 6.4$525,100 -‐ $625,000 44 4 2 19 0$625,100 & up 114 20 5 19 3 92% 249 38.0Totals/Averages 610 166 144 221 132 96% 145 11.8
9/1/11 through 9/30/11
Price Range # Active # New # Pending # Reduced # Sold Avg SP/LP Avg DOM Months of Inv.$125,000 -‐ $225,000 138 62 61 57 60 98% 116 2.3$225,100 -‐ $325,000 117 21 26 44 22 97% 139 5.3$325,100 -‐ $425,000 107 26 21 29 18 96% 117 5.9$425,100 -‐ $525,000 86 9 5 17 8 97% 82 10.8$525,100 -‐ $625,000 38 3 3 14 2 94% 222 19.0$625,100 & up 115 10 3 16 4 99% 195 28.8Totals/Averages 601 131 119 177 114 97% 145 12.0
Active $125 -‐ $225 $225 -‐ $325 $325 -‐ $425 $425 -‐ $525 $525 -‐ $625 $625 & up Total10/1/11 134 108 111 73 37 96 559
Date Range
Date Range
Date Range
Date Range
1033 NW NeWport Ave BeNd, or 97701tel (541) 383-1426 FAx (866) 552-3220 WWW.BeNdpropertylistiNgs.com
stAtistics compiled By teAm terry skjersAA. iNFormAtioN deemed reliABle But Not guArANteed.
Team Terry
jAsoN BooNe - priNcipAl Broker, [email protected]
mollie HogAN - priNcipAl [email protected]
terry skjersAA - priNcipAl Broker, [email protected]
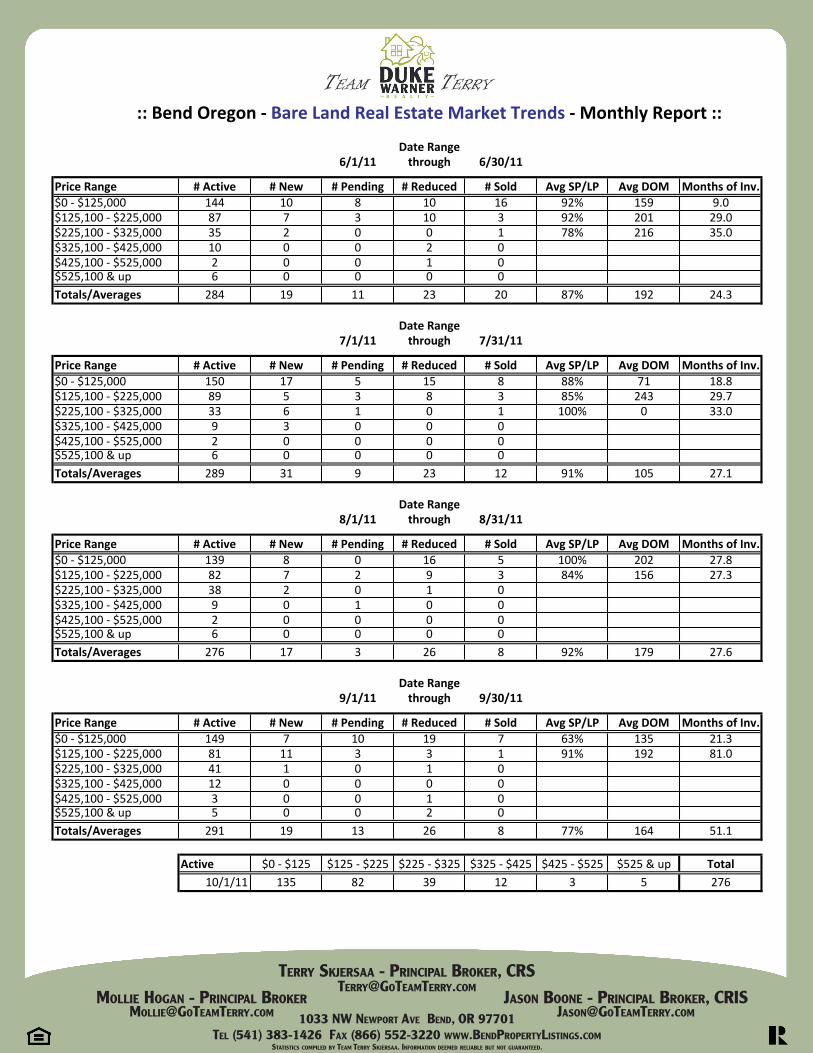
:: Bend Oregon -‐ Bare Land Real Estate Market Trends -‐ Monthly Report ::
6/1/11 through 6/30/11
Price Range # Active # New # Pending # Reduced # Sold Avg SP/LP Avg DOM Months of Inv.$0 -‐ $125,000 144 10 8 10 16 92% 159 9.0$125,100 -‐ $225,000 87 7 3 10 3 92% 201 29.0$225,100 -‐ $325,000 35 2 0 0 1 78% 216 35.0$325,100 -‐ $425,000 10 0 0 2 0$425,100 -‐ $525,000 2 0 0 1 0$525,100 & up 6 0 0 0 0Totals/Averages 284 19 11 23 20 87% 192 24.3
7/1/11 through 7/31/11
Price Range # Active # New # Pending # Reduced # Sold Avg SP/LP Avg DOM Months of Inv.$0 -‐ $125,000 150 17 5 15 8 88% 71 18.8$125,100 -‐ $225,000 89 5 3 8 3 85% 243 29.7$225,100 -‐ $325,000 33 6 1 0 1 100% 0 33.0$325,100 -‐ $425,000 9 3 0 0 0$425,100 -‐ $525,000 2 0 0 0 0$525,100 & up 6 0 0 0 0Totals/Averages 289 31 9 23 12 91% 105 27.1
8/1/11 through 8/31/11
Price Range # Active # New # Pending # Reduced # Sold Avg SP/LP Avg DOM Months of Inv.$0 -‐ $125,000 139 8 0 16 5 100% 202 27.8$125,100 -‐ $225,000 82 7 2 9 3 84% 156 27.3$225,100 -‐ $325,000 38 2 0 1 0$325,100 -‐ $425,000 9 0 1 0 0$425,100 -‐ $525,000 2 0 0 0 0$525,100 & up 6 0 0 0 0Totals/Averages 276 17 3 26 8 92% 179 27.6
9/1/11 through 9/30/11
Price Range # Active # New # Pending # Reduced # Sold Avg SP/LP Avg DOM Months of Inv.$0 -‐ $125,000 149 7 10 19 7 63% 135 21.3$125,100 -‐ $225,000 81 11 3 3 1 91% 192 81.0$225,100 -‐ $325,000 41 1 0 1 0$325,100 -‐ $425,000 12 0 0 0 0$425,100 -‐ $525,000 3 0 0 1 0$525,100 & up 5 0 0 2 0Totals/Averages 291 19 13 26 8 77% 164 51.1
Active $0 -‐ $125 $125 -‐ $225 $225 -‐ $325 $325 -‐ $425 $425 -‐ $525 $525 & up Total10/1/11 135 82 39 12 3 5 276
Date Range
Date Range
Date Range
Date Range
1033 NW NeWport Ave BeNd, or 97701tel (541) 383-1426 FAx (866) 552-3220 WWW.BeNdpropertylistiNgs.com
stAtistics compiled By teAm terry skjersAA. iNFormAtioN deemed reliABle But Not guArANteed.
Team Terry
terry skjersAA - priNcipAl Broker, [email protected]
jAsoN BooNe - priNcipAl Broker, [email protected]
mollie HogAN - priNcipAl [email protected]
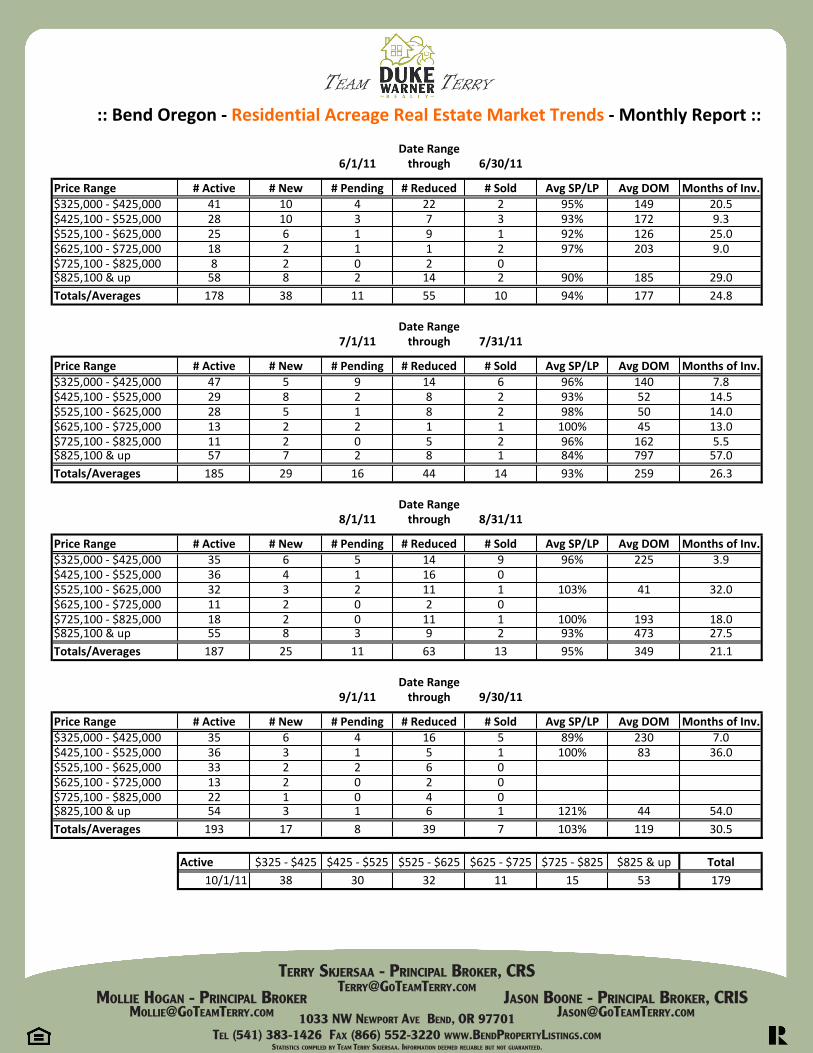
:: Bend Oregon -‐ Residential Acreage Real Estate Market Trends -‐ Monthly Report ::
6/1/11 through 6/30/11
Price Range # Active # New # Pending # Reduced # Sold Avg SP/LP Avg DOM Months of Inv.$325,000 -‐ $425,000 41 10 4 22 2 95% 149 20.5$425,100 -‐ $525,000 28 10 3 7 3 93% 172 9.3$525,100 -‐ $625,000 25 6 1 9 1 92% 126 25.0$625,100 -‐ $725,000 18 2 1 1 2 97% 203 9.0$725,100 -‐ $825,000 8 2 0 2 0$825,100 & up 58 8 2 14 2 90% 185 29.0Totals/Averages 178 38 11 55 10 94% 177 24.8
7/1/11 through 7/31/11
Price Range # Active # New # Pending # Reduced # Sold Avg SP/LP Avg DOM Months of Inv.$325,000 -‐ $425,000 47 5 9 14 6 96% 140 7.8$425,100 -‐ $525,000 29 8 2 8 2 93% 52 14.5$525,100 -‐ $625,000 28 5 1 8 2 98% 50 14.0$625,100 -‐ $725,000 13 2 2 1 1 100% 45 13.0$725,100 -‐ $825,000 11 2 0 5 2 96% 162 5.5$825,100 & up 57 7 2 8 1 84% 797 57.0Totals/Averages 185 29 16 44 14 93% 259 26.3
8/1/11 through 8/31/11
Price Range # Active # New # Pending # Reduced # Sold Avg SP/LP Avg DOM Months of Inv.$325,000 -‐ $425,000 35 6 5 14 9 96% 225 3.9$425,100 -‐ $525,000 36 4 1 16 0$525,100 -‐ $625,000 32 3 2 11 1 103% 41 32.0$625,100 -‐ $725,000 11 2 0 2 0$725,100 -‐ $825,000 18 2 0 11 1 100% 193 18.0$825,100 & up 55 8 3 9 2 93% 473 27.5Totals/Averages 187 25 11 63 13 95% 349 21.1
9/1/11 through 9/30/11
Price Range # Active # New # Pending # Reduced # Sold Avg SP/LP Avg DOM Months of Inv.$325,000 -‐ $425,000 35 6 4 16 5 89% 230 7.0$425,100 -‐ $525,000 36 3 1 5 1 100% 83 36.0$525,100 -‐ $625,000 33 2 2 6 0$625,100 -‐ $725,000 13 2 0 2 0$725,100 -‐ $825,000 22 1 0 4 0$825,100 & up 54 3 1 6 1 121% 44 54.0Totals/Averages 193 17 8 39 7 103% 119 30.5
Active $325 -‐ $425 $425 -‐ $525 $525 -‐ $625 $625 -‐ $725 $725 -‐ $825 $825 & up Total10/1/11 38 30 32 11 15 53 179
Date Range
Date Range
Date Range
Date Range