Bend Oregon Monthly Real Estate Trends - May 2011
3
1033 NW NEWPORT AVE BEND, OR 97701 TEL (541) 383-1426 FAX (866) 552-3220 WWW.BENDPROPERTYLISTINGS.COM STATISTICS COMPILED BY TEAM TERRY SKJERSAA. INFORMATION DEEMED RELIABLE BUT NOT GUARANTEED. TEAM TERRY JASON BOONE - PRINCIPAL BROKER, CRIS JASON@GOTEAMTERRY.COM MOLLIE HOGAN - PRINCIPAL BROKER MOLLIE@GOTEAMTERRY.COM TERRY SKJERSAA - PRINCIPAL BROKER, CRS TERRY@GOTEAMTERRY.COM :: Bend Oregon Residential Real Estate Market Trends Monthly Report :: 2/1/11 through 2/28/11 Price Range # Active # New # Pending # Reduced # Sold Avg SP/LP Avg DOM Months of Inv. $125,000 $225,000 146 56 59 36 43 100% 111 3.4 $225,100 $325,000 84 31 24 15 24 98% 161 3.5 $325,100 $425,000 65 22 13 8 8 97% 143 8.1 $425,100 $525,000 47 8 8 12 4 95% 271 11.8 $525,100 $625,000 21 8 4 6 1 95% 294 21.0 $625,100 & up 70 17 5 9 1 89% 330 70.0 Totals/Averages 433 142 113 86 81 96% 218 19.6 3/1/11 through 3/31/11 Price Range # Active # New # Pending # Reduced # Sold Avg SP/LP Avg DOM Months of Inv. $125,000 $225,000 127 80 68 52 55 98% 140 2.3 $225,100 $325,000 76 54 29 14 32 98% 131 2.4 $325,100 $425,000 73 38 21 10 13 96% 191 5.6 $425,100 $525,000 41 11 9 13 6 99% 216 6.8 $525,100 $625,000 24 4 1 7 2 96% 150 12.0 $625,100 & up 70 21 8 10 9 89% 170 7.8 Totals/Averages 411 208 136 106 117 96% 166 6.2 4/1/11 through 4/30/11 Price Range # Active # New # Pending # Reduced # Sold Avg SP/LP Avg DOM Months of Inv. $125,000 $225,000 120 55 66 40 63 98% 133 1.9 $225,100 $325,000 73 46 45 28 20 98% 137 3.7 $325,100 $425,000 79 25 19 20 15 97% 183 5.3 $425,100 $525,000 37 30 8 4 8 97% 174 4.6 $525,100 $625,000 24 12 2 7 4 95% 131 6.0 $625,100 & up 80 20 6 10 0 Totals/Averages 413 188 146 109 110 97% 152 4.3 5/1/11 through 5/31/11 Price Range # Active # New # Pending # Reduced # Sold Avg SP/LP Avg DOM Months of Inv. $125,000 $225,000 111 61 57 38 81 98% 149 1.4 $225,100 $325,000 101 44 38 42 28 97% 104 3.6 $325,100 $425,000 86 30 14 21 17 97% 162 5.1 $425,100 $525,000 56 14 5 20 5 98% 97 11.2 $525,100 $625,000 27 9 6 9 6 97% 35 4.5 $625,100 & up 90 19 8 16 7 89% 369 12.9 Totals/Averages 471 177 128 146 144 96% 153 6.4 Active $125 $225 $225 $325 $325 $425 $425 $525 $525 $625 $625 & up Total 6/1/11 105 101 95 63 36 86 486 Date Range Date Range Date Range Date Range
-
Upload
duke-warner-realty -
Category
Documents
-
view
215 -
download
1
description
Monthly real estate statistics and trends for Bend, Oregon. A detailed analysis of sales activity and inventory of residential homes, homes on acreage and bare land.
Transcript of Bend Oregon Monthly Real Estate Trends - May 2011

1033 NW NeWport Ave BeNd, or 97701tel (541) 383-1426 FAx (866) 552-3220 WWW.BeNdpropertylistiNgs.com
stAtistics compiled By teAm terry skjersAA. iNFormAtioN deemed reliABle But Not guArANteed.
Team Terry
jAsoN BooNe - priNcipAl Broker, [email protected]
mollie HogAN - priNcipAl [email protected]
terry skjersAA - priNcipAl Broker, [email protected]
:: Bend Oregon -‐ Residential Real Estate Market Trends -‐ Monthly Report ::
2/1/11 through 2/28/11
Price Range # Active # New # Pending # Reduced # Sold Avg SP/LP Avg DOM Months of Inv.$125,000 -‐ $225,000 146 56 59 36 43 100% 111 3.4$225,100 -‐ $325,000 84 31 24 15 24 98% 161 3.5$325,100 -‐ $425,000 65 22 13 8 8 97% 143 8.1$425,100 -‐ $525,000 47 8 8 12 4 95% 271 11.8$525,100 -‐ $625,000 21 8 4 6 1 95% 294 21.0$625,100 & up 70 17 5 9 1 89% 330 70.0Totals/Averages 433 142 113 86 81 96% 218 19.6
3/1/11 through 3/31/11
Price Range # Active # New # Pending # Reduced # Sold Avg SP/LP Avg DOM Months of Inv.$125,000 -‐ $225,000 127 80 68 52 55 98% 140 2.3$225,100 -‐ $325,000 76 54 29 14 32 98% 131 2.4$325,100 -‐ $425,000 73 38 21 10 13 96% 191 5.6$425,100 -‐ $525,000 41 11 9 13 6 99% 216 6.8$525,100 -‐ $625,000 24 4 1 7 2 96% 150 12.0$625,100 & up 70 21 8 10 9 89% 170 7.8Totals/Averages 411 208 136 106 117 96% 166 6.2
4/1/11 through 4/30/11
Price Range # Active # New # Pending # Reduced # Sold Avg SP/LP Avg DOM Months of Inv.$125,000 -‐ $225,000 120 55 66 40 63 98% 133 1.9$225,100 -‐ $325,000 73 46 45 28 20 98% 137 3.7$325,100 -‐ $425,000 79 25 19 20 15 97% 183 5.3$425,100 -‐ $525,000 37 30 8 4 8 97% 174 4.6$525,100 -‐ $625,000 24 12 2 7 4 95% 131 6.0$625,100 & up 80 20 6 10 0Totals/Averages 413 188 146 109 110 97% 152 4.3
5/1/11 through 5/31/11
Price Range # Active # New # Pending # Reduced # Sold Avg SP/LP Avg DOM Months of Inv.$125,000 -‐ $225,000 111 61 57 38 81 98% 149 1.4$225,100 -‐ $325,000 101 44 38 42 28 97% 104 3.6$325,100 -‐ $425,000 86 30 14 21 17 97% 162 5.1$425,100 -‐ $525,000 56 14 5 20 5 98% 97 11.2$525,100 -‐ $625,000 27 9 6 9 6 97% 35 4.5$625,100 & up 90 19 8 16 7 89% 369 12.9Totals/Averages 471 177 128 146 144 96% 153 6.4
Active $125 -‐ $225 $225 -‐ $325 $325 -‐ $425 $425 -‐ $525 $525 -‐ $625 $625 & up Total6/1/11 105 101 95 63 36 86 486
Date Range
Date Range
Date Range
Date Range

1033 NW NeWport Ave BeNd, or 97701tel (541) 383-1426 FAx (866) 552-3220 WWW.BeNdpropertylistiNgs.com
stAtistics compiled By teAm terry skjersAA. iNFormAtioN deemed reliABle But Not guArANteed.
Team Terry
jAsoN BooNe - priNcipAl Broker, [email protected]
mollie HogAN - priNcipAl [email protected]
terry skjersAA - priNcipAl Broker, [email protected]
:: Bend Oregon -‐ Bare Land Real Estate Market Trends -‐ Monthly Report ::
2/1/11 through 2/28/11
Price Range # Active # New # Pending # Reduced # Sold Avg SP/LP Avg DOM Months of Inv.$0 -‐ $125,000 136 4 16 11 11 98% 94 12.4$125,100 -‐ $225,000 74 10 0 2 0$225,100 -‐ $325,000 36 7 1 2 0$325,100 -‐ $425,000 16 3 1 2 0$425,100 -‐ $525,000 4 1 0 1 0$525,100 & up 10 0 0 0 0Totals/Averages 276 25 18 18 11 98% 94 12.4
3/1/11 through 3/31/11
Price Range # Active # New # Pending # Reduced # Sold Avg SP/LP Avg DOM Months of Inv.$0 -‐ $125,000 123 13 19 6 13 95% 216 9.5$125,100 -‐ $225,000 78 13 2 3 3 94% 91 26.0$225,100 -‐ $325,000 38 3 0 4 2 88% 62 19.0$325,100 -‐ $425,000 14 0 0 0 0$425,100 -‐ $525,000 4 0 0 0 0$525,100 & up 9 0 0 0 0Totals/Averages 266 29 21 13 18 92% 123 18.2
4/1/11 through 4/30/11
Price Range # Active # New # Pending # Reduced # Sold Avg SP/LP Avg DOM Months of Inv.$0 -‐ $125,000 120 29 11 21 16 88% 236 7.5$125,100 -‐ $225,000 84 16 3 7 3 88% 306 28.0$225,100 -‐ $325,000 37 3 1 1 0$325,100 -‐ $425,000 15 1 0 1 0$425,100 -‐ $525,000 2 0 0 0 0$525,100 & up 9 0 0 0 0Totals/Averages 267 49 15 30 19 88% 271 17.8
5/1/11 through 5/31/11
Price Range # Active # New # Pending # Reduced # Sold Avg SP/LP Avg DOM Months of Inv.$0 -‐ $125,000 129 44 14 8 12 86% 226 10.8$125,100 -‐ $225,000 85 13 6 3 4 92% 457 21.3$225,100 -‐ $325,000 37 4 2 3 1 85% 111 37.0$325,100 -‐ $425,000 14 0 0 0 0$425,100 -‐ $525,000 2 0 0 0 0$525,100 & up 8 0 0 0 0Totals/Averages 275 61 22 14 17 88% 265 23.0
Active $0 -‐ $125 $125 -‐ $225 $225 -‐ $325 $325 -‐ $425 $425 -‐ $525 $525 & up Total6/1/11 144 87 35 10 2 6 284
Date Range
Date Range
Date Range
Date Range
1033 NW NeWport Ave BeNd, or 97701tel (541) 383-1426 FAx (866) 552-3220 WWW.BeNdpropertylistiNgs.com
stAtistics compiled By teAm terry skjersAA. iNFormAtioN deemed reliABle But Not guArANteed.
Team Terry
terry skjersAA - priNcipAl Broker, [email protected]
jAsoN BooNe - priNcipAl Broker, [email protected]
mollie HogAN - priNcipAl [email protected]
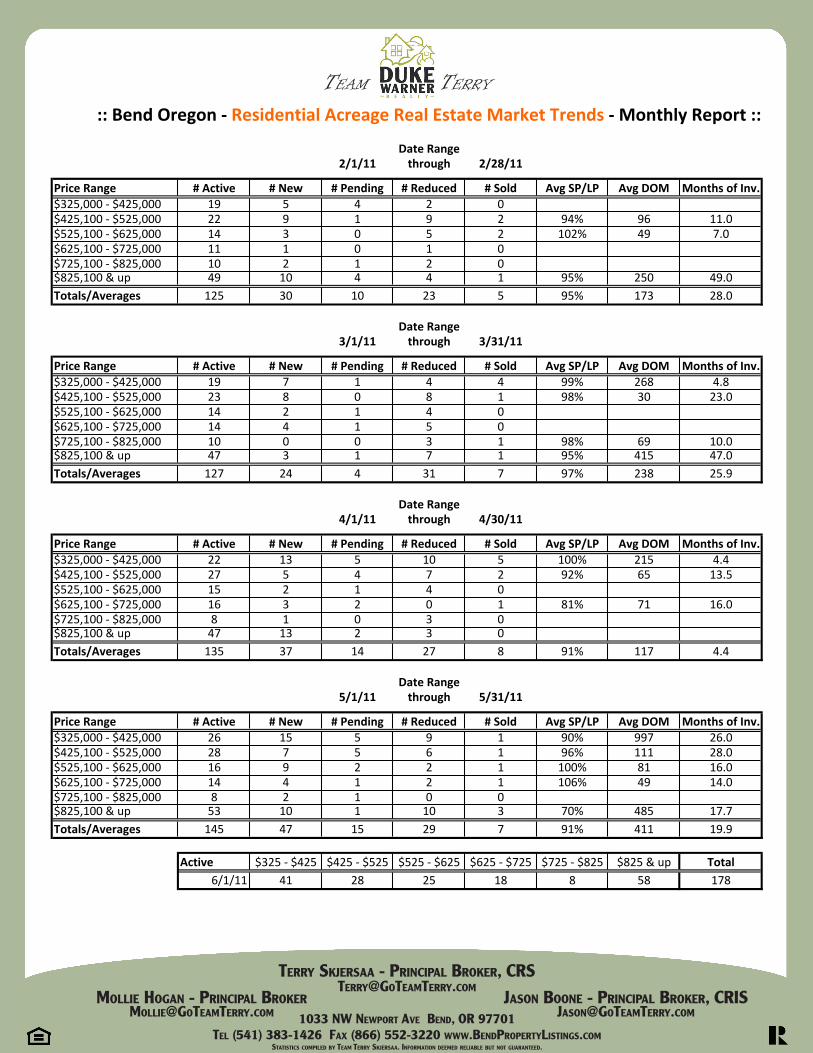
:: Bend Oregon -‐ Residential Acreage Real Estate Market Trends -‐ Monthly Report ::
2/1/11 through 2/28/11
Price Range # Active # New # Pending # Reduced # Sold Avg SP/LP Avg DOM Months of Inv.$325,000 -‐ $425,000 19 5 4 2 0$425,100 -‐ $525,000 22 9 1 9 2 94% 96 11.0$525,100 -‐ $625,000 14 3 0 5 2 102% 49 7.0$625,100 -‐ $725,000 11 1 0 1 0$725,100 -‐ $825,000 10 2 1 2 0$825,100 & up 49 10 4 4 1 95% 250 49.0Totals/Averages 125 30 10 23 5 95% 173 28.0
3/1/11 through 3/31/11
Price Range # Active # New # Pending # Reduced # Sold Avg SP/LP Avg DOM Months of Inv.$325,000 -‐ $425,000 19 7 1 4 4 99% 268 4.8$425,100 -‐ $525,000 23 8 0 8 1 98% 30 23.0$525,100 -‐ $625,000 14 2 1 4 0$625,100 -‐ $725,000 14 4 1 5 0$725,100 -‐ $825,000 10 0 0 3 1 98% 69 10.0$825,100 & up 47 3 1 7 1 95% 415 47.0Totals/Averages 127 24 4 31 7 97% 238 25.9
4/1/11 through 4/30/11
Price Range # Active # New # Pending # Reduced # Sold Avg SP/LP Avg DOM Months of Inv.$325,000 -‐ $425,000 22 13 5 10 5 100% 215 4.4$425,100 -‐ $525,000 27 5 4 7 2 92% 65 13.5$525,100 -‐ $625,000 15 2 1 4 0$625,100 -‐ $725,000 16 3 2 0 1 81% 71 16.0$725,100 -‐ $825,000 8 1 0 3 0$825,100 & up 47 13 2 3 0Totals/Averages 135 37 14 27 8 91% 117 4.4
5/1/11 through 5/31/11
Price Range # Active # New # Pending # Reduced # Sold Avg SP/LP Avg DOM Months of Inv.$325,000 -‐ $425,000 26 15 5 9 1 90% 997 26.0$425,100 -‐ $525,000 28 7 5 6 1 96% 111 28.0$525,100 -‐ $625,000 16 9 2 2 1 100% 81 16.0$625,100 -‐ $725,000 14 4 1 2 1 106% 49 14.0$725,100 -‐ $825,000 8 2 1 0 0$825,100 & up 53 10 1 10 3 70% 485 17.7Totals/Averages 145 47 15 29 7 91% 411 19.9
Active $325 -‐ $425 $425 -‐ $525 $525 -‐ $625 $625 -‐ $725 $725 -‐ $825 $825 & up Total6/1/11 41 28 25 18 8 58 178
Date Range
Date Range
Date Range
Date Range