Agenda Introduction Benchmarks Benchmarking Survey data and benchmarking.
BENCHMARKING REPORT – FOR THE REPORTING PERIOD 01 JULY 2011 TO 30 JUNE 2012
PUBLISHED JANUARY 2013
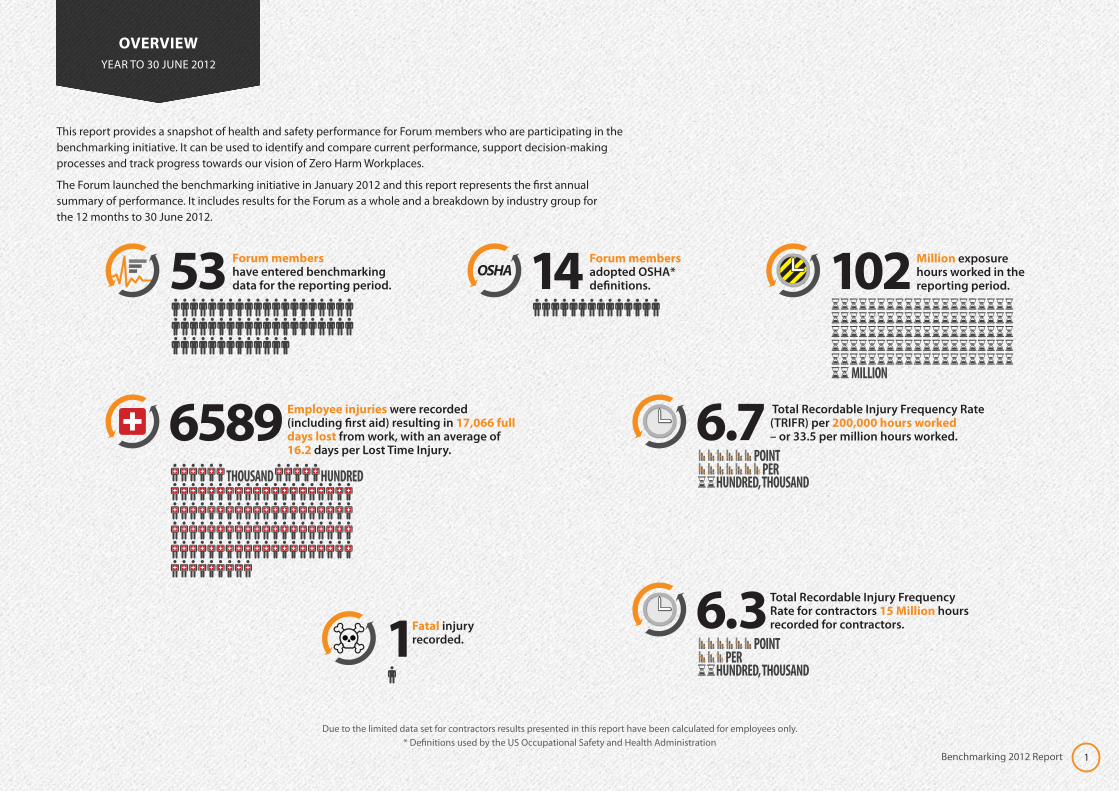
This report provides a snapshot of health and safety performance for Forum members who are participating in the benchmarking initiative. It can be used to identify and compare current performance, support decision-making processes and track progress towards our vision of Zero Harm Workplaces.
The Forum launched the benchmarking initiative in January 2012 and this report represents the first annual summary of performance. It includes results for the Forum as a whole and a breakdown by industry group for the 12 months to 30 June 2012.
OVERVIEWYEAR TO 30 JUNE 2012
Due to the limited data set for contractors results presented in this report have been calculated for employees only.* Definitions used by the US Occupational Safety and Health Administration
1Benchmarking 2012 Report
14 Forum members adopted OSHA* definitions.
OSHAMillion exposure hours worked in the reporting period.102
MILLION
53 Forum members have entered benchmarking data for the reporting period.
Employee injuries were recorded (including first aid) resulting in 17,066 full days lost from work, with an average of 16.2 days per Lost Time Injury.
6589THOUSAND HUNDRED
Total Recordable Injury Frequency Rate (TRIFR) per 200,000 hours worked – or 33.5 per million hours worked.6.7
HUNDRED, THOUSAND
POINTPER
Total Recordable Injury Frequency Rate for contractors 15 Million hours recorded for contractors.6.3
POINTPER
Fatal injury recorded.1
HUNDRED, THOUSAND
WHO’S INVOLVED
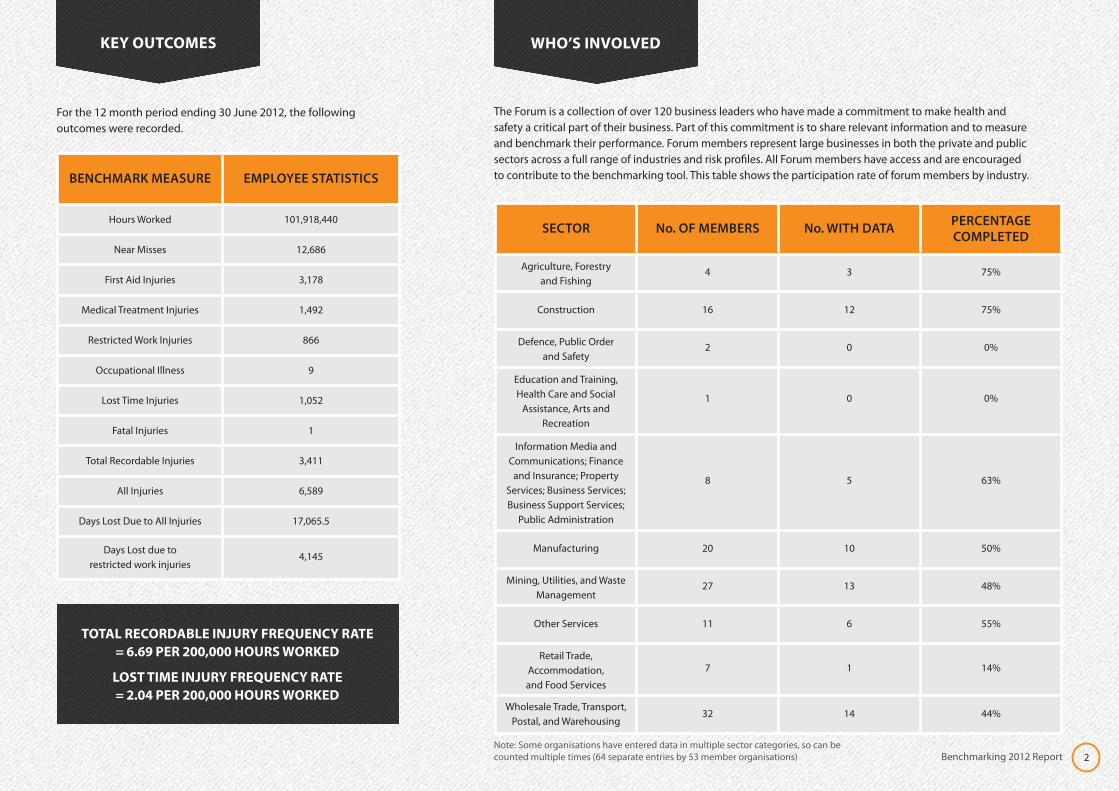
The Forum is a collection of over 120 business leaders who have made a commitment to make health and safety a critical part of their business. Part of this commitment is to share relevant information and to measure and benchmark their performance. Forum members represent large businesses in both the private and public sectors across a full range of industries and risk profiles. All Forum members have access and are encouraged to contribute to the benchmarking tool. This table shows the participation rate of forum members by industry.
KEY OUTCOMES
BENCHMARK MEASURE EMPLOYEE STATISTICS
Hours Worked 101,918,440
Near Misses 12,686
First Aid Injuries 3,178
Medical Treatment Injuries 1,492
Restricted Work Injuries 866
Occupational Illness 9
Lost Time Injuries 1,052
Fatal Injuries 1
Total Recordable Injuries 3,411
All Injuries 6,589
Days Lost Due to All Injuries 17,065.5
Days Lost due to restricted work injuries
4,145
TOTAL RECORDABLE INJURY FREQUENCY RATE = 6.69 PER 200,000 HOURS WORKED
LOST TIME INJURY FREQUENCY RATE = 2.04 PER 200,000 HOURS WORKED
For the 12 month period ending 30 June 2012, the following outcomes were recorded.
2Benchmarking 2012 Report
SECTOR No. OF MEMBERS No. WITH DATA PERCENTAGE COMPLETED
Agriculture, Forestry and Fishing
4 3 75%
Construction 16 12 75%
Defence, Public Order and Safety
2 0 0%
Education and Training, Health Care and Social
Assistance, Arts and Recreation
1 0 0%
Information Media and Communications; Finance
and Insurance; Property Services; Business Services; Business Support Services;
Public Administration
8 5 63%
Manufacturing 20 10 50%
Mining, Utilities, and Waste Management
27 13 48%
Other Services 11 6 55%
Retail Trade, Accommodation, and Food Services
7 1 14%
Wholesale Trade, Transport, Postal, and Warehousing
32 14 44%
Note: Some organisations have entered data in multiple sector categories, so can be counted multiple times (64 separate entries by 53 member organisations)

TOTAL RECORDABLE INJURY FREQUENCY
RATE (TRIFR)
3Benchmarking 2012 Report
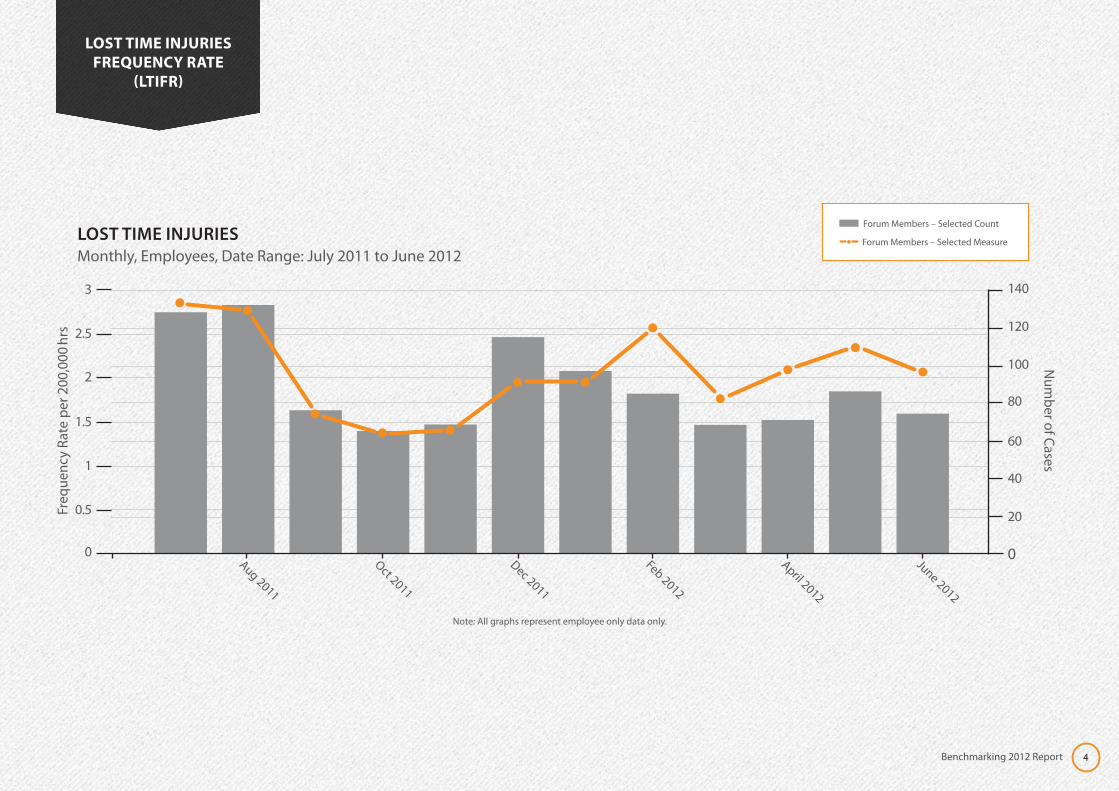
This report presents Total Recordable Injuries Frequency Rate (TRIFR) and Lost Time Injury Frequency Rate (LTIFR) as measures of performance. TRIFR captures reported medical treatment, restricted work, lost time and fatal injuries and is the most comprehensive and reliable lagging measure of performance at this early stage of benchmarking development. It is proposed that the Forum will use a wider range of performance measures in the future reports. LTIFR captures reported injuries that resulted in at least one day being lost from work after the day on the injury or illness.
The Forums TRIFR and LTIFR for the 12 month period to 30 June 2012 is presented as a monthly average.
The limited data range (12 months) is insufficient to make any real comment on the trend of injury frequency, however it is expected this will be possible once 2-3 years of data has been collected. By way of comparison the Oil and Gas industry reported TRIFRs and LTIFRs in 2010 that were between 10 to 20 times lower than the Forum’s injury rate – (see International Association of Oil and Gas Producers report 455 May 2011 available at http://www.ogp.org.uk/pubs/455.pdf )
TOTAL RECORDABLE INJURIESMonthly, Employees, Date Range: July 2011 to June 2012
Forum Members – Selected Measure
Forum Members – Selected Count
Aug 2011
Oct 2011
Dec 2011
Feb 2012
April 2012
June 2012
Freq
uenc
y Ra
te p
er 2
00,0
00 h
rsN
umber of Cases
0
300
0
2
4
6
8
10 350
250
200
150
100
50
LOST TIME INJURIES FREQUENCY RATE
(LTIFR)
4Benchmarking 2012 Report
LOST TIME INJURIESMonthly, Employees, Date Range: July 2011 to June 2012
Forum Members – Selected Measure
Forum Members – Selected Count
Note: All graphs represent employee only data only.
Aug 2011
Oct 2011
Dec 2011
Feb 2012
April 2012
June 2012
Freq
uenc
y Ra
te p
er 2
00,0
00 h
rsN
umber of Cases
0
120
0
0.5
1
1.5
2
2.5
3 140
100
80
60
40
20

INDUSTRY SECTORSHOURS
WORKEDNEAR MISS FAI MTI RWI OCC
ILLNESS LTI FATAL TRI AI DAYS LOST LTI
DAYS LOST RWI
Wholesale Trade, Transport, Postal, and Warehousing
29,314,392 2,845 1,239 453 636 3 348 1 1,438 2,677 7,059 3,924
Manufacturing 34,475,655 503 245 341 95 4 461 0 897 1142 8,607 25
Mining, Utilities, and Waste Management 11,256,054 3,687 718 221 66 2 45 0 332 1,050 239 74
Other Services 10,688,867 1,752 421 148 25 0 102 0 275 696 754 39
Construction 8,812,282 2,675 419 199 39 0 45 0 283 702 171 73
Information Media and Communications; Finance and Insurance; Property Services;
Business Services; Business Support Services; Public Administration
3,107,192 402 78 27 1 0 3 0 31 109 38 10
Retail Trade, Accommodation, and Food Services
Agriculture, Forestry and Fishing
TOTAL 101,918,440 12,686 3,178 1,492 866 9 1,052 1 3,411 6,589 17,066 4,145
This table displays the aggregated raw data for each of the reporting industry sectors and includes the number of exposure hours and injuries. Manufacturing represents the largest sector based on hours worked. The Wholesale/Trade/Transport/Postal and Warehousing sector is recording the highest number of injuries and the Mining, Utilities and Waste Sector has the highest number of near miss incidents reported.
5Benchmarking 2012 Report
SECTOR RESULTSINJURY NUMBERS
FAI – First Aid Injury; MTI – Medical Treatment Injury; RWI – Return to Work Injury (where an injury prevents a return
to work on normal duties for 1 day/shift or more); OCC Illness – Confirmed Occupational Illness; LTI – Lost Time Injury (where an injury prevents a return to
work for 1 day/shift or more); TRI – Total Recordable Injury (includes MTIs, RWIs, LTIs and
Fatal injuries) AI – All reported Injuries (Includes TRI plus first aid injuries)
Note: Defense, Public Order and Safety and Education and Training, Health Care and Social Assistance, Arts and Recreation have no data for the reporting period.
Industry participation numbers inadequate to display data
Industry numbers too low to be significant

INDUSTRY SECTORS HOURS WORKED
NEAR MISS FAI FR MTI FR RWI FR
OCC ILLNESS
FRLTI FR FATAL
FR TRI FR AI FRDAYS
LOST LTI FR
DAYS LOST
RWI FR
Wholesale Trade, Transport, Postal, and Warehousing
29,314,392 19.41 8.45 3.09 4.34 0.02 2.37 0.01 9.81 18.26 48.16 26.77
Manufacturing 34,475,655 2.92 1.42 1.98 0.55 0.02 2.67 0.00 5.20 6.62 49.93 0.15
Mining, Utilities, and Waste Management 11,256,054 65.51 12.76 3.93 1.17 0.04 0.80 0.00 5.90 18.66 4.25 1.31
Other Services 10,688,867 32.78 7.88 2.77 0.47 0.00 1.91 0.00 5.15 13.02 14.11 0.73
Construction 8,812,282 60.71 9.51 4.52 0.89 0.00 1.02 0.00 6.42 15.93 3.87 1.66
Information Media and Communications; Finance and Insurance; Property Services;
Business Services; Business Support Services; Public Administration
3,107,192 25.88 5.02 1.74 0.06 0.00 0.19 0.00 2.00 7.02 2.45 0.64
Retail Trade, Accommodation, and Food Services
Agriculture, Forestry and Fishing
The table below displays frequency rate data for each measure, based on 200,000 hours worked. Wholesale trade, transport, postal and warehousing sector had the highest rate for the 12 month period (TRIFR of 9.81). The highest number of “near miss” reports was achieved in the Mining/Utilities and Waste management sectors followed by Construction.
6Benchmarking 2012 Report
SECTOR RESULTSFREQUENCY RATES
FAI – First Aid Injury; MTI – Medical Treatment Injury; RWI – Return to Work Injury (where an injury prevents a return
to work on normal duties for 1 day/shift or more); OCC Illness – Confirmed Occupational Illness; LTI – Lost Time Injury (where an injury prevents a return to
work for 1 day/shift or more); TRI – Total Recordable Injury (includes MTIs, RWIs, LTIs and
Fatal injuries) AI – All reported Injuries (Includes TRI plus first aid injuries)
Note: Defense, Public Order and Safety and Education and Training, Health Care and Social Assistance, Arts and Recreation have no data for the reporting period.
Industry participation numbers inadequate to display data
Industry numbers too low to be significant

7Benchmarking 2012 Report
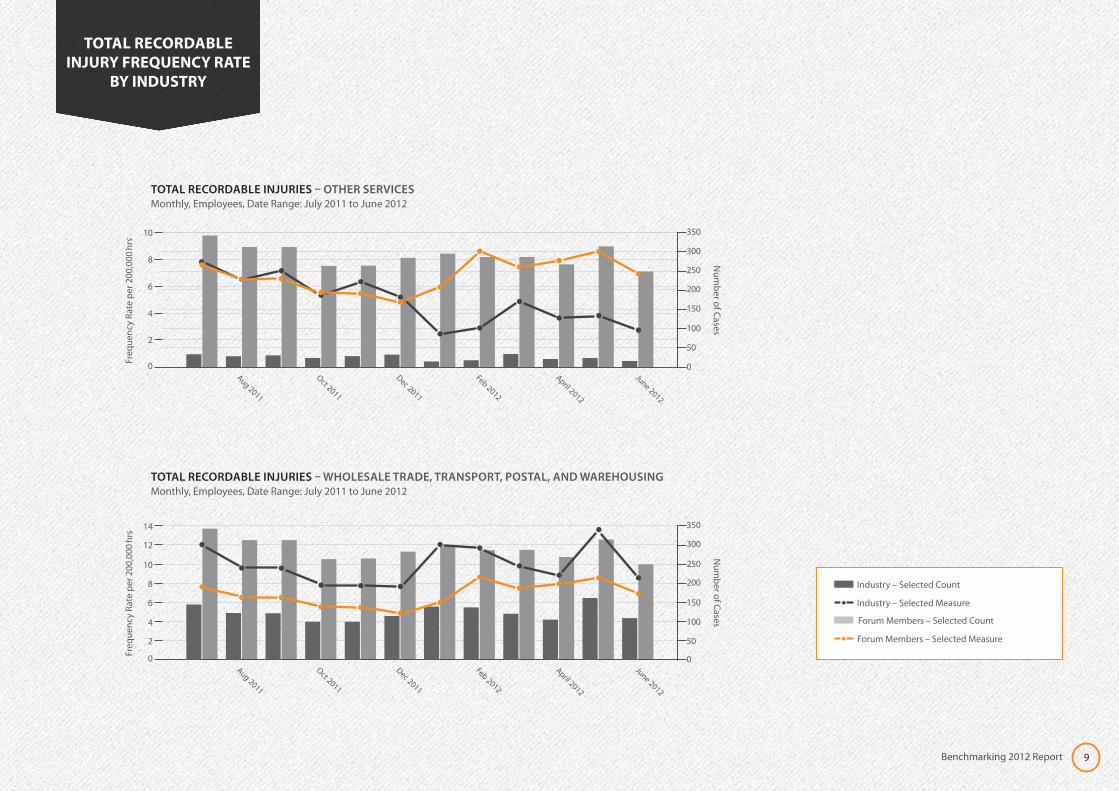
The TRIFR for six industry sectors is shown below. Each graph shows the number of reported injuries and the TRIFR per month for the sector and compares this with overall Forum performance. Only industries where three or more members participated have been shown to ensure the information remains anonymous. The TRIFR is shown as a monthly average. As expected industries with a lower risk profiles appear to have lower injury frequency rates. The Wholesale trade, warehousing and transport sector has reported a TRIFR that is consistently above the Forum average.
Industry – Selected Count
Industry – Selected Measure
Forum Members – Selected Measure
Forum Members – Selected Count
TOTAL RECORDABLE INJURY FREQUENCY RATE
BY INDUSTRY
TOTAL RECORDABLE INJURIES – CONSTRUCTIONMonthly, Employees, Date Range: Jan 2011 to Dec 2011
Num
ber of Cases
Freq
uenc
y Ra
te p
er 2
00,0
00 h
rs
Aug 2011
Oct 2011
Dec 2011
Feb 2012
April 2012
June 2012
0 0
2 50
4 100
6 150
8 200
10
12
14
250
300
350
TOTAL RECORDABLE INJURIES – INFORMATION MEDIA AND COMMUNICATIONS; FINANCE AND INSURANCE; PROPERTY SERVICES; BUSINESS SERVICES; BUSINESS SUPPORT SERVICES; PUBLIC ADMINISTRATIONMonthly, Employees, Date Range: July 2011 to June 2012
Num
ber of Cases
Freq
uenc
y Ra
te p
er 2
00,0
00 h
rs
Aug 2011
Oct 2011
Dec 2011
Feb 2012
April 2012
Jan 2012
00
10
8
6
4
2
350
300
250
200
150
100
50

8Benchmarking 2012 Report
Industry – Selected Count
Industry – Selected Measure
Forum Members – Selected Measure
Forum Members – Selected Count
TOTAL RECORDABLE INJURY FREQUENCY RATE
BY INDUSTRY
TOTAL RECORDABLE INJURIES – MANUFACTURINGMonthly, Employees, Date Range: July 2011 to June 2012
Num
ber of Cases
Freq
uenc
y Ra
te p
er 2
00,0
00 h
rs
Aug 2011
Oct 2011
Dec 2011
Feb 2012
April 2012
June 2012
0 0
50
100
150
200
250
300
350
2
8
6
4
10
12
TOTAL RECORDABLE INJURIES – MINING, UTILITIES, AND WASTE MANAGEMENTMonthly, Employees, Date Range: July 2011 to June 2012
Num
ber of Cases
Freq
uenc
y Ra
te p
er 2
00,0
00 h
rs
Aug 2011
Oct 2011
Dec 2011
Feb 2012
April 2012
June 2012
00
10
12
8
6
4
2
350
300
250
200
150
100
50
9Benchmarking 2012 Report
Industry – Selected Count
Industry – Selected Measure
Forum Members – Selected Measure
Forum Members – Selected Count
TOTAL RECORDABLE INJURY FREQUENCY RATE
BY INDUSTRY
TOTAL RECORDABLE INJURIES – OTHER SERVICESMonthly, Employees, Date Range: July 2011 to June 2012
Num
ber of Cases
Freq
uenc
y Ra
te p
er 2
00,0
00 h
rs
Aug 2011
Oct 2011
Dec 2011
Feb 2012
April 2012
June 2012
0 0
2
6
4
8
10 350
300
250
200
150
100
50
TOTAL RECORDABLE INJURIES – WHOLESALE TRADE, TRANSPORT, POSTAL, AND WAREHOUSINGMonthly, Employees, Date Range: July 2011 to June 2012
Num
ber of Cases
Freq
uenc
y Ra
te p
er 2
00,0
00 h
rs
Aug 2011
Oct 2011
Dec 2011
Feb 2012
April 2012
June 2012
00
12
14
10
8
4
6
2
350
300
250
200
150
100
50

The Forum adopted a common injury reporting standard (OSHA) and industry classification standard (based on ANZSIC level 1) in December 2011 to improve the quality and reliability of benchmarking outcomes.
Data can be collected for employees and contractors – this report presents employee only data.
The data in this report may be subject to errors relating to the way it is collected, classified and reported by member organisations. It is anticipated that errors will reduce over time.
In particular, it may have been affected by the fact that many Forum members do not yet use the OSHA definitions for reporting injury outcomes. The Forum is working towards adoption of the OSHA definitions by Forum members over the next 3-5 years.
10Benchmarking 2012 Report
PARTICIPANTS
SECTOR BUSINESS
Agriculture, Forestry and Fishing • Ernslaw One • PF Olsen • Stevensons Group – Agriculture
Construction• Brightwater Engineering Group • Citycare – Construction • DELTA Utility Services • EIS Group • Kiwi Rail – Construction
• Mainzeal • McConnell Dowell • NZ Crane Group • PAE (New Zealand) Limited – Construction • Stevensons Group – Construction & Business Services • Whittaker Civil Engineering
Information Media and Communications; Finance and Insurance; Property Services; Business Services; Business Support Services; Public Administration
• Department of Labour (Prior to merger within MBIE) • GNS Science • Kiwirail – Corporate Business Services • PAE (New Zealand) Limited • Stevensons Group – Property Bus Support
Manufacturing • Coca Cola Amatil (NZ) • Fonterra • GEON Print & Communication Services • Huhtamaki Henderson Limited • Refining NZ • Orica Chemicals • Ravensdown • Silver Fern Farms • Stevensons Group – Manufacturing • Tenon
Mining, Utilities, and Waste Management • Citycare – Mining, Utilities and Waste • Contact Energy • Envirowaste Services Ltd • Northpower Ltd • Origin Energy New Zealand • Powerco • Shell Todd Oil Services Ltd. (STOS) • Siemens New Zealand
• Stevensons Group Mining • Todd Corporation • United Water • International • Wellington City Council • Wel Networks
Other Services • BECA • Citycare – Parks Maintenance • OCS • Opus International Consultants • SGS New Zealand • Transfield Worley
Retail Trade, Accommodation, and Food Services • Restaurant Brands
Wholesale Trade, Transport, Postal, and Warehousing• Auckland International Airport • Air NZ • BP Oil NZ • CentrePort • CHEP New Zealand
• Christchurch International Airport Limited • Cold Storage Nelson Limited • Kiwi Rail – Freight Transport • Kiwi Rail – Interislander Transport • NZ Oil Services • NZL Group • Port of Napier • Red Bus Ltd • Z Energy
Some members with diverse operations contributed data in more than one sector.

BUSINESS LEADERS’ HEALTH AND
SAFETY FORUM
BUSINESS LEADERS’ HEALTH AND SAFETY FORUM:
ADDRESS: Level 1, 2-12 Allen Street, Wellington
COPIES OF THIS REPORT ARE AVAILABLE ON REQUEST. TO OBTAIN A COPY:
EMAIL: [email protected] PHONE: +64 4 802 7069
COPIES CAN ALSO BE DOWNLOADED FROM OUR WEBSITE:
WEBSITE: www.zeroharm.org.nz