Benchmarking Regional Innovation: A Comparison of Bavaria ...
42
1 41 st Congress of the European Regional Science Association Benchmarking Regional Innovation: A Comparison of Bavaria, Northern Ireland and the Republic of Ireland Stephen Roper School of Management and Economics and Northern Ireland Economic Research Centre, Queen’s University Belfast, BT7 1NN. E-mail: [email protected] Fax: 0044-2890-439435 Abstract: Regional regeneration strategies based on developing innovation capability have received much support in recent years. Evaluation of the effectiveness of such initiatives has, however, been limited largely to an assessment of the impact of such strategies on policy frameworks and attitudes. Based on innovation survey data covering nearly a decade, this paper outlines a number of external innovation benchmarks for core and peripheral regions within the EU. The benchmarks considered cover the innovation objectives, constraints, resources, linkages and outputs of manufacturing firms. Despite considerable efforts in recent years to develop the innovation capability and institutional support framework for innovation in Northern Ireland and the Republic of Ireland, the benchmarks still point to a substantial performance gap between the Irish and German study regions, and provide little evidence of convergence over the 1991-99 period. The benchmarks also suggest other more general points emphasising a general shortening of product lifecycles 1 and a related shift towards more radical innovation. More disappointing is in that in each of the study regions the development of environmentally friendly products is given a low and diminishing priority by manufacturing firms.
Transcript of Benchmarking Regional Innovation: A Comparison of Bavaria ...

1
41st Congress of the European Regional Science Association
Benchmarking Regional Innovation: A Comparison ofBavaria, Northern Ireland and the Republic of Ireland
Stephen Roper
School of Management and Economics and Northern Ireland Economic ResearchCentre, Queen’s University Belfast, BT7 1NN.
E-mail: [email protected]: 0044-2890-439435
Abstract:Regional regeneration strategies based on developing innovation capability havereceived much support in recent years. Evaluation of the effectiveness of suchinitiatives has, however, been limited largely to an assessment of the impact of suchstrategies on policy frameworks and attitudes. Based on innovation survey datacovering nearly a decade, this paper outlines a number of external innovationbenchmarks for core and peripheral regions within the EU. The benchmarksconsidered cover the innovation objectives, constraints, resources, linkages andoutputs of manufacturing firms.
Despite considerable efforts in recent years to develop the innovation capability andinstitutional support framework for innovation in Northern Ireland and the Republicof Ireland, the benchmarks still point to a substantial performance gap between theIrish and German study regions, and provide little evidence of convergence over the1991-99 period. The benchmarks also suggest other more general points emphasisinga general shortening of product lifecycles1 and a related shift towards more radicalinnovation. More disappointing is in that in each of the study regions the developmentof environmentally friendly products is given a low and diminishing priority bymanufacturing firms.

2
Benchmarking Regional Innovation: A Comparison of Bavaria, NorthernIreland and the Republic of Ireland
1. IntroductionInterest in the effects of location on firms’ innovation activity is longstanding. Writing
in 1992, for example, Alfred Kleinknecht and Tom Poot asked ‘Do Regions Matter
for R&D?’ and examined whether firms’ location in the Netherlands shaped the extent
or nature of their R&D investments. While they found no evidence that firms in urban
agglomerations undertook more R&D than similar companies in rural areas, they did
find that firms in rural areas placed more emphasis on process related R&D
(Kleinknecht and Poot, 1992, pp. 230-231). Subsequent empirical studies provide
more conflicting evidence about the importance of location as an influence on firms’
innovation activity1. Recent conceptual developments, particularly associated with the
literature on endogenous growth driven by technological change, have, however,
prompted a different question, namely ‘Does R&D matter for regions?’ In other words
to what extent can R&D, or more generally technological development, provide a
basis for regional economic development (e.g. Frenkel, 1997)? Interest in the
potential for technology-led, regional development strategies has also been stimulated
by the example of successful regions (e.g. Heidenreich and Krauss, 1998; Yun, 1998),
and the search by regional governments for more effective alternatives to traditional
regional policy (e.g. Hassink, 1993). In particular, within the EU the policy debate has
focussed on initiatives designed to stimulate regional technological development,
notably through the Regional Innovation Strategies (RIS), Regional Technology
Partnership (RTP) and Regional Innovation and Technology Transfer Strategies
(RITTS) programmes. Evaluation of these programmes has been extensive but has
typically been limited to the operational aspects of the projects and their effects on
regional policy agendas (e.g. ECOTEC, 1999). One underdeveloped aspect of the
monitoring or evaluation of such initiatives, and indeed the success or otherwise of
1 Other subsequent studies addressing similar issues also provide conflicting evidence.Studies by Shefer and Frenkel (1998) on Northern Israel, Brouwer and Kleinknecht(1996) on the Netherlands, Harris and Trainor (1995) on Northern Ireland andMcCartney and Teague (1997) on the Republic of Ireland have suggested the potentialimportance of agglomeration economies linked to urban or metropolitan locations.Devlaar and Nijkamp (1989, 1992) for the Netherlands, Koschatzky et al. (1998) forGermany and Roper (1999) for Ireland provide contradictory evidence.

3
other regional supports for innovation etc., has been the development of external
innovation benchmarks. Our focus here is therefore on the development of a set of
survey-based regional innovation benchmarks. These are applied using information
from company surveys conducted over the last decade to compare innovation activity
in the EU ‘core’ region of Bavaria and the more peripheral areas of Northern Ireland
and the Republic of Ireland. Key questions relate to the objectives of firms’
innovation activities, measures of innovation capability and innovation activity, and
whether, given the alternative regional strategies adopted, there is any evidence of
convergence.
In a UK context, the timing of these comparisons is opportune given the increasing
level of regional autonomy resulting from the creation of the Regional Development
Agencies (RDAs) in England (Roberts, 2000), and the devolution of control of
economic development policy to the Scottish parliament and assemblies in Northern
Ireland and Wales (Ashcroft, 1998; Birnie and Hitchens, 1998). Indeed, David North
recently highlighted the role of innovation promotion in regional economic strategies
of the RDAs; “the ‘sine qua non’ of regional economic development (North, 2000, p.
10)2. Similar sentiments are echoed in Northern Ireland’s ‘Strategy 2010’ which
stresses the imperative for Northern Ireland to become ‘an innovative society
receptive to the creation, assimilation and exploitation of new ideas’. (DETI, 1999, p.
159).
The remainder of the paper is organised as follows. Section 2 outlines the main
conceptual foundations focussing on the evolutionary nature of innovation and the
importance of the institutional context (or Regional Innovation System) within which
firms innovate. Section 3 provides an overview of the economic, policy and
institutional environment of the study regions over the last decade, and section 4 and
describes the innovation data. Sections 5, 6 and 7 present the main empirical results
focussing on the aims of firms’ innovative activities, the resource base for innovation
(both within and around each plant) and the level of innovation outputs respectively.
2 North (2000), p. 10, for example, quotes from the Regional Economic Strategy of the East MidlandsDevelopment Agency their aspiration to ‘develop a strong culture of enterprise and innovation, puttingthe region at the leading edge in Europe in our exploitation of research, recognised for our spirit ofinnovation.

4
Section 8 summarises the main findings of the regional benchmarking exercise and
draws out the methodological and policy implications.
2. Innovation and Regional DevelopmentUnderlying the regional innovation benchmarks is the evolutionary nature of the
process of innovation (Nelson and Winter, 1982; Metcalfe, 1997). In any area the
nature and direction of technological change will be shaped by the decision rules,
learning capabilities and adaptive behaviour of local firms (Metcalfe, 1997), social
conventions (Morgan, 1997), and the intensity and extent of organisational and inter-
personal interactions (Maillat, 1995; Grabher and Stark, 1997). Regional comparisons
of innovation will therefore depend on the learning capabilities and adaptive
behaviours of individual firms, the inter-connectedness of innovating organisations
and the wider institutional structure which supports the innovative activity of firms
(Metcalfe, 1995, pp. 447-449).
In this view, firms have limited competence or knowledge in the face of a complex
operating environment and so develop routines for decision making (Nelson and
Winter, 1982). Metcalfe (1995, p. 450) then argues that ’important corollaries of the
routine-based approach are the inertial nature of decision rules, their insensitivity to
small changes in the environment and the adaptation of routines as a consequence of
learning behaviour’. In other words, firms have bundles of capabilities or resources
that determine the sophistication and/or effectiveness of their decision making
routines, and perhaps more importantly, their ability to learn or modify routines in
response to their success (Morgan, 1997; Rees, 2000). The presence of an R&D
function within a firm, for example, may stimulate innovation directly through the
type of technology-push process envisaged in linear models of innovation. R&D staff
may also, however, contribute to firms’ creativity as part of multi-functional groups
(Song et al., 1997), or may allow firms to utilise extra-mural networks or information
sources more effectively (Veugelers and Cassiman, 1999)3. Other studies have
stressed the potential importance of high-grade human resources for generating 3 Relatively few empirical studies have until recently included variables explicitly reflecting the skillcomposition of firms’ workforces as a determinant of innovation. See, for example, the materialreviewed in Cohen (1995) and the papers included in Kleinknecht (1996). More recent studies based on

5
diversity and innovation. Commenting on their comparison of UK and German
engineering and chemicals firms, Mason and Wagner, for example, commented that
‘… even those firms who have no aspirations to do more than adopt innovations
developed elsewhere now increasingly require the services of highly qualified
engineers and scientists in order to identify and make use of relevant information if
they are to have any hope of staying in touch with more advanced competitors’
(Mason and Wagner, 1994, p. 68).
While the strength and co-ordination of firms’ internal resource-base may be crucial
in determining their innovation capability, external linkages or networks also play a
potentially important role (Oerlemans et al., 1998). Alongside their ability to release
resource constraints, external linkages may also help by stimulating creativity,
reducing risk, accelerating or upgrading the quality of the innovations made,
signalling the quality of firms’ innovation activities (Powell, 1998) and increasing
firms’ ability to appropriate the returns from innovation (Gemser and Wijnberg,
1995). The qualitative characteristics or ‘quality’ of firms’ external links may also be
important, however4.
Another important element of this evolutionary view of the innovation process – in
contrast to the more deterministic linear model – is that firms’ innovation activity is,
at least to some extent, shaped by their strategic and commercial aspirations (Roper,
1997)5. Firms’ innovation objectives will in turn be shaped by the attractiveness of the
markets in which firm is operating and particularly by issues of appropriability and
technological opportunity (Cohen, 1995, pp. 214-231). Demand conditions in firms’
home and export markets may, for example, also affect firms’ expected post-
innovation returns and therefore their willingness to invest in innovative activity
(Cohen, 1995, 211-214), a factor that may be particularly important in international
comparisons.
firm-level surveys have addressed the question, e. g. Shefer and Frenkel (1998), Love and Roper(2000).4 Buckley and Carter (1999), for example, consider the general issues raised in the management ofknowledge-co-ordination between firms while Stewart and Conway (1998) address similar issues in amore specific discussion related to innovation networks.5 Felder et al., (1996), for example, demonstrate the importance of firms’ innovation objectives on theR&D and innovation investments of German manufacturing firms (see Table 5.3, p. 142-143), whileVeugelers and Cassiman (1999) highlight the importance of firms’ innovation objectives in the externalsourcing decisions of Belgian firms.

6
Supporting the innovative capabilities of individual firms are the local and national
institutional frameworks embodied in the notions of the national system of innovation
(NSI) (e.g. Nelson, 1993) and regional innovation system (RIS) (e.g. Braczyk et al.,
1998). To quote Metcalfe, (1997, pp. 461-462) a national or regional system of
innovation is ‘that set of distinct institutions which jointly and individually contribute
to the development and diffusion of new technologies and which provides the
framework within which governments form and implement policies to influence the
innovation process. As such it is a system of interconnected institutions to create,
store and transfer the knowledge, skills and artefacts which define new technology.
The element of nationality follows not only from the domain of technology policy but
from elements of shared language and culture which bind the system together, and
from the national focus of other policies laws and regulations which condition the
innovative environment'. Within an NSI or RIS, organisations fulfil three main
functions:
(a) Knowledge applying organisations including private firms, consultancies etc. seek
to identify market openings and translate knowledge into an explicit form to
address profitably these opportunities.
(b) Knowledge generating or sourcing institutions such as universities, research
institutes and government or industry research laboratories. Generally such
organisations have humanitarian or social objectives, are publicly funded, and
conduct their activities largely independently of immediate market needs or
requirements.
(c) Knowledge mediating or co-ordinating institutions – which seek to identify and
bring together knowledge applying and knowledge generating organisations. This
may be on a bespoke basis, e.g. by assisting firms to identify potential higher
education partners or vice-versa, or through the provision of network services by
professional societies, chambers of commerce etc. Typically such institutions are
publicly or collaboratively funded or not-for-profit organisations with either
national, regional or industry development objectives.

7
The effectiveness of a NSI or RIS will, however, depend not only on the capability of
its component institutions but also on the extent to which these institutions are
connected through formal or informal networks6. The institutional context for
innovation in any locality will also have both national and regional elements.
Beyond the national or regionally specific characteristics of the NSI/RIS, the level of
innovative activity will also be influenced by what Hassink (1993) calls the ‘ongoing
shift from Fordist mass production to post-Fordist flexible specialisation’ (p. 1009) or
what Best (1991) less prosaically describes as the shift towards the ‘New
Competition’. Both emphasise profound changes in firms’ competitive environment,
dominated by the internationalisation of production activity, rapid technological
change, and shifts in consumer demands. For the individual firm these changes
emphasise the importance of innovation and flexibility as the basis for creating and
sustaining competitive advantage. For regions, changes in the competitive
environment also pose new challenges epitomised by the emergence of new high
growth regions focussing on high-tech development and/or tertiary activity, while
regions whose economies are based on more traditional, structurally-weak sectors
continue to decline7.
Hassink (1993) also suggests, however, that these ongoing changes in production
organisation bring with them the potential for the type of local agglomeration
economies epitomised by the literatures on clusters and industrial districts8. This
potential – it can be argued – creates a new policy opportunity for regions to generate
new business and growth trajectories. By enhancing the learning process in, and
between, companies and other institutions, regional governments or development
authorities can enhance the innovative capability of the region, generating variety or,
in more concrete terms, a broad range of innovative behaviours and innovations
(Metcalfe, 1997). Morgan (1997), for example, arguing from a Welsh perspective,
6 The UK NSI, for example, has been criticised for having strong knowledge generating institutions butweak mediating and co-ordinating institutions and connectivity (Walker, 1993).7 Hassink (1993) contrasts, in particular, developments in the Ruhr and Baden-Wurttemberg regions ofGermany, while others have documented the high-tech developments of Silicon Valley (Saxenian,1996), Cambridge (e.g. Druilhe and Garnsey, 2000), Israel and the Republic of Ireland (Roper andFrenkel, 2000).8 Others suggest that globalising pressures are more important as multinational companies internalisetransaction costs and develop competitive advantages based on proprietary technologies (see, forexample, the discussion in Dunning, 1993, pp. 597-617).

8
advocates the potential of a regional regeneration strategy based on the development
of networks of companies and links between companies and other development
organisations.
3. The Study RegionsThe study regions were chosen to highlight core-periphery differences within the EU,
and to illustrate the impact of different types of RIS. Bavaria is both within the ‘core’
group of EU regions, with GDP per capita consistently above the EU average.
Northern Ireland and the Republic of Ireland both had GDP per capita significantly
below the EU average in 1990-1991 but have since experienced very different growth
profiles. In Northern Ireland, GDP per capita has continued to lag 20-25 per cent
below the EU average while dramatic economic growth rates in the Republic of
Ireland have seen GDP per capita rise sharply. Indeed, by 1996, GDP per capita in the
Republic of Ireland was 96 per cent of the EU average, compared to only 80 per cent
in Northern Ireland (Table 1)9. Similar patterns are evident in unemployment rates
with Bavaria having consistently less unemployment than the EU average. In
Northern Ireland and the Republic of Ireland, unemployment rates were above the EU
average until the mid-1990s, but have fallen more recently reaching 8-9 per cent by
1998 (Table 1).
Some other contrasts between the study regions may also be important in terms of
their impact on the regions’ innovation potential. First, higher levels of per capita
income in Bavaria may mean that firms in Bavaria face a local demand for higher
quality, more sophisticated and perhaps more innovative products than firms in
Northern Ireland and the Republic of Ireland (Gudgin, 1995). Secondly, population
densities, which have been positively linked to higher rates of innovative activity
particularly in high-tech industries (e.g. Frenkel and Shefer, 1998), are notably higher
in the German region (Table 1). Thirdly, in 1996, the German region had higher levels
of R&D investment and patent applications per capita than Northern Ireland or the
9 Some care is necessary in interpreting these GDP figures for the Republic of Ireland due to theimportance of profits repatriated by externally-owned companies. In 1996, this meant that GNP atmarket prices was only 88.8 per cent of GDP (Source: CSO, Table 2, NIE Dept of Finance). In 1990the same figure was 89.7 per cent. In other words while the GDP figures for the Republic of Irelandoverestimate the average level of per capita income in the Republic of Ireland the growth profile from1991 onwards does give a realistic impression of welfare changes.

9
Republic of Ireland (Table 1). In terms of R&D spending the most significant
differences exist in the business and government sectors, where R&D expenditure as a
percentage of GDP in Bavaria was double that in Ireland. R&D spending by higher
education was more evenly spread across the study regions at 0.34-0.56 per cent of
GDP.
Fourthly, important differences exist between the structure and development of the
regional innovation systems of the study regions. In the Republic of Ireland, for
example, as the low level of public investment in R&D suggests, "The attention to
R&D in the public sector and universities in the Republic of Ireland still lags far
behind other EU and OCED countries, and the R&D innovation system relies heavily
on the private business sector, especially multinational corporation inward investors"
(NIEC, 1999, p. 74). In Northern Ireland, the imbalance is instead towards the
dominance of local R&D by the public sector and higher education with relatively low
levels of R&D investment by locally-based businesses. Hence: "Imbalance in the
Northern Ireland system lies in the dominance of public-sector R&D capabilities in
Government and the lack of research institutions outside government and the
universities" (NIEC, 1999, p. 125). In contrast, Bavaria benefits from the fact that
Germany is a ’highly industrialised country with a well-developed innovative
infrastructure’ (Grupp et al., 1998).
Although the largest of the study regions in terms of total population, Bavaria has a
mixed industrial structure with significant mechanical engineering, aerospace,
automotive and electronic engineering sectors. Another feature of Bavarian industry is
the prevalence of widely dispersed small- to medium-sized manufacturing plants. The
average size of establishment in 1990 was 70.2 workers compared to a West German
average of 153.7 (Jones and Wild, 1994). The RIS of Bavaria has attracted
substantially less attention than that of its neighbour Baden-Württemberg, however,
Bavaria comes second overall in Germany, in patent intensity per 1000 employees in
1996 (see Blind and Grupp, 1999) and has comparable levels of R&D spending
(Table 1). The geographically and sectoral dispersion of Bavarian industry, and the
importance of small to medium enterprises, poses particular problems for innovation
and technology transfer.

10
4 Data Sources
The regional innovation benchmarks are based on three related surveys of innovation
activity among manufacturing plants carried out over last decade. The first of these
(the Product Development Survey or PDS) was a postal survey conducted between
October 1994 and April 1995 relating to plants’ innovation activities over the 1991-93
period (Roper et al., 1996). The PDS survey covered all regions in the UK, the
Republic of Ireland and Germany with the following response rates: 23.7 per cent
(1300 responses) in Germany, 20.6 per cent (1700 responses) in the UK and 32 per
cent (520 responses) in the Republic of Ireland. For the regional benchmark analysis
we focus on the respondent plants in Northern Ireland (348), the Republic of Ireland
(529) and Bavaria (229).
Our second survey of innovative activity (the Product and Process Development
Survey or PPDS) covered Northern Ireland and Republic of Ireland only and related
to plants’ innovation activity over the 1994-96 period. The survey was conducted
between November 1996 and March 1997 and response rates were 43 per cent (293
responses in Northern Ireland and 28.6 per cent (459 responses) in Republic of Ireland
(see Roper and Hewitt-Dundas, 1998). Our most recent survey the Product and
Process Development Survey 3 or PPDS3) covered Northern Ireland, the Republic of
Ireland, and Bavaria and was undertaken between October 1999 and April 2000
(Roper and Anderson, 2000). Plants were asked about their innovation activity over
the 1997 to 1999 period with response rates as follows: Northern Ireland, 41 per cent
(419 responses); the Republic of Ireland, 29 per cent (624 responses); and Bavaria 16
per cent (345 responses).
The three surveys have a number of common features which make them ideal for
deriving regional innovation benchmarks. First, the surveys were structured to be
regionally representative, or as in the case of the PDS in Germany, were constructed
with large enough sampling fractions to enable regionally representative results to be
derived (see Love and Roper, 2000). Second, within each region, sample structures
were constructed to expose differences in innovation behaviours between plants in
different employment sizebands (Acs and Audretsch, 1988, 1993) and manufacturing
sectors (Geroski, 1990). Perhaps more important, however, is the fact that each of the
surveys were conducted at plant (or establishment) level rather than at the level of

11
company. The advantage of this approach is that all stages of the innovation process
will be present from the initial idea to the production of final products and that the
surveys would therefore identify issues raised by plant managers in undertaking each
stage of the innovation process. From the UK perspective, at least, this issue of the
capability of plants to exploit research results is of particular importance. The risk
inherent in a plant-based approach is that it might miss intra-company technology
transfers, particularly between centralised R&D or development facilities and
manufacturing sites. In the survey questionnaires, however, allowance is made for
relationships between innovating sites and other group plants or resources.
Other commonalities relate to the survey instruments themselves. In each case the
original questionnaire was compiled in English and pilot tested in the UK and/or
Ireland. In the 1993 survey, for example, a UK pilot survey of 200 plants was
undertaken (Roper et al., 1996, p. 63), while the 1996 survey was pilot tested with 100
plants (Roper and Hewitt-Dundas, 1998, p. 64)10. Following the pilot surveys and
subsequent minor changes to the questionnaires German research staff with
considerable experience of innovation surveys undertook translation into German.
The German questionnaires were pilot tested in Germany and, wherever possible,
back-translated by a native German speaker into English.
5. Benchmarks: Innovation Objectives and ConstraintsIn 1999, and perhaps reflecting the increasingly globalisation of markets for
manufacturing goods (e.g. Best, 1991), plants’ innovation objectives were broadly
similar across the study regions. Figure 1 gives the proportion of all manufacturing
plants in the study regions indicating that each innovation objective was either
‘important’ or ‘very important’ in 1999. More than three-quarters of manufacturing
plants in each area give priority to extending their product ranges and increasing
market share (Table 2, Figure 1). Surprisingly, however, given its prominence in
recent EU policy documents such as Agenda 2000, the development of
environmentally friendly products was plants’ lowest priority with only a quarter of
plants in each study region seeing this as ‘important’ or ‘very important’ (Figure 1).
10 No pilot survey was undertaken for the 1999 survey in the UK and Ireland as the questionnaire wasalmost identical to that used in the 1996 survey.

12
Other differences between local operating conditions may be shaping plants’ other
innovation priorities. For example, high labour costs in Germany mean that reducing
production costs is seen as a priority by around 60 per cent of plants in Bavaria but
only 40-49 per cent of plants in Northern Ireland and the Republic of Ireland.
Conversely, matching competitors, which was seen as a priority by 55-62 per cent of
businesses in Northern Ireland and Republic of Ireland, was emphasised by only 23-
26 per cent of plants in Bavaria (Table 2). This latter point reflects the incremental
nature of innovative activity undertaken by many German plants in contrast to the
more radical and market responsive approach adopted by UK and Irish plants (e.g.
Culpepper, 1999, p.47; Roper, 1997).
In terms of the changes in plants’ innovation objectives over the 1991 to 1999 period
(Figure 2):
• In Northern Ireland, increasing priority has been given to product replacement and
extending plants’ product range, with a reduced emphasis on improving product
quality, cost reduction and the introduction of environmentally friendly products.
• In the Republic of Ireland, as in Northern Ireland, extending the product range
increased in importance while quality improvement, cost reduction and increasing
market share decreased in importance.
• In Bavaria, increasing priority was given to replacing and extending plants’
product ranges, cost reduction and entering new markets. Matching competitors
and developing environmentally friendly products again declined in importance.
Two pieces of evidence here suggest shorting product lifetimes and the increasing
importance of radical rather than incremental innovation. First, plants gave increasing
priority to product replacement, and secondly the decline in the importance of quality
improvement suggests that plants are placing more emphasis on developing new
products rather than improving their existing product ranges. This move towards more
radical innovation may pose particular problems for German firms which have
historically maintained their competitive position through incremental innovation or
customisation rather than more radical innovation (see, for example, the references in
Culpepper, 1999, p. 44). Some differences in innovation priorities were evident,

13
however, between plants in Northern Ireland and Republic of Ireland and those in
Bavaria. In particular, reducing cost pressures was increasingly important in Bavaria
but seen as of declining importance in Northern Ireland and Republic of Ireland.
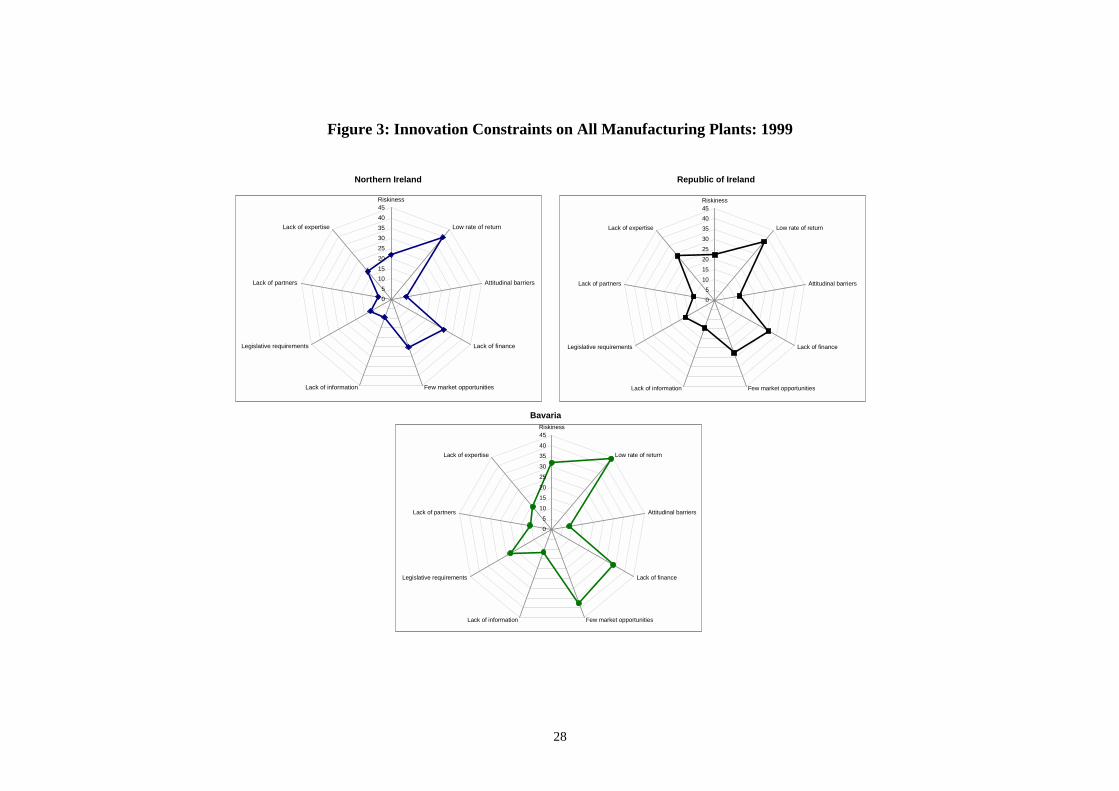
Constraints on plants’ innovation activity may be important in limiting plants’ ability
to achieve these changing objectives. Benchmarks for the constraints on innovation
activity were derived as the proportion of plants indicating that each factor was either
‘important’ or ‘very important’. Figure 3 gives the percentage of all manufacturing
plants in each study region highlighting each innovation constraint in 1999. As
expected, and like previous studies (e.g. Roper et al., 1996), low expected rates of
return, the riskiness of undertaking innovation and lack of finance predominate, along
with a perception that market opportunities were limited (Figure 3). Other factors (i.e.
legislative requirements, attitudinal barriers, and lack of information) were seen as
less important barriers to innovation in each study region.
Some differences in the barriers to innovation did exist, however, between the study
regions. First, while a lack of expertise for innovation was not evident in Northern
Ireland it was highlighted by a significantly larger proportion of manufacturing
businesses in Republic of Ireland (Figure 3). One possibility is that this may reflect
the influence on innovation of ‘Celtic Tiger’ growth rates that have led to tight labour
markets in the Republic of Ireland. Secondly, 32 per cent of plants in Bavaria
highlighted the riskiness of innovation compared to 22 per cent in Northern Ireland
and Republic of Ireland, and thirdly a lack of opportunities for innovation was
highlighted by 41 per cent of plants in Bavaria but only 25-28 per cent in Northern
Ireland and Republic of Ireland. Combined with the fact that German plants also
indicated that a low rate of return was an important barrier to innovation, this suggests
that market conditions in Germany at the time of the 1999 survey may have been
more difficult than that in the other study regions11.
11 OECD (1999), for example, indicates that GDP and investment growth in Germany in 1999 wereexpected to be well below trend and that business confidence and industrial orders fell sharply in 1999.

14
Considering the way in which plants’ perceptions of innovation constraints have
changed through time suggests a much more dynamic picture in Northern Ireland and
the Republic of Ireland than in Bavaria (Figure 4). In Bavaria, the percentage of
manufacturing plants regarding each innovation constraint as either ‘important’ or
‘very important’ has remained broadly similar suggesting stability in both the quality
of plants’ internal resource base and the support offered by the institutions of the local
RIS. In the Republic of Ireland and more notably in Northern Ireland, however, the
percentage of plants highlighting each innovation constraint has declined rapidly since
the early-1990s. For example, in 1993, 41-42 per cent of plants in Northern Ireland
and the Republic of Ireland highlighted the riskiness of innovation as an important
constraint, a level higher than that in Bavaria. By 1999, the proportion of plants in
Northern Ireland and the Republic of Ireland citing the riskiness of innovation as an
important constraint had fallen to 21-22 per cent, a level below that of Bavaria.
Similar trends were also evident in terms of the lack of finance, lack of information,
and lack of partners.
Again two explanations are possible. First, if the innovation intentions of plants in
Northern Ireland and the Republic of Ireland had declined this might have meant
barriers to innovation were less important. This is unlikely, however, as Figure 2
suggests the stability of plants’ innovation objectives in each of study regions.
Perhaps more likely is that the reduction in the barriers to innovation in Northern
Ireland and the Republic of Ireland reflects policies in both regions to improve the
innovation capability of firms and strengthen the RIS through the provision of grant
assistance for innovation, improvements in the availability of information and help for
potential innovators to find commercial or research partners. In Northern Ireland, for
example, grant-based measures such as Compete, which primarily supports near-
market R&D by manufacturing businesses, have worked to reduce the riskiness and
increase the potential returns from innovation (Roper, 1998). Measures designed to
stimulate innovative partnerships are better developed in Republic of Ireland with the
Projects in Advanced Technologies (PATs) encouraging university-industry co-
operation in R&D and the National Linkages Programme (Tomaney, 1995) designed
to improve co-operation along the supply chain. Supplementing both measures – and
also covering Bavaria, of course, are related EU initiatives such as the network of

15
Innovation Relay Centres, collaborative research projects and framework
programmes.
6. Benchmarks: Inputs and Organisation of InnovationIn this section we consider benchmarks for plants’ innovation resources (i.e. R&D,
graduate employment), the internal organisation of the innovation process (i.e. the
extent of multi-functional working) and the strength and nature of plants’ external
linkages. Each of these factors has been shown to be important in determining both
whether or not a plant undertakes innovation and the subsequent market success of
that innovative product or process (e.g. Brouwer and Kleinknecht, 1996; Love and
Roper, 2000)
In terms of R&D spending, earlier regional comparisons have suggested that in 1996,
aggregate levels of R&D investments by business, government and higher education
were higher in Bavaria than in Northern Ireland and the Republic of Ireland (Table 1).
Survey data provides some insight into the distribution of this R&D activity between
plants, with the proportion of manufacturing plants undertaking some R&D also being
higher (62 per cent) in Bavaria than in either Northern Ireland (51 per cent) and the
Republic of Ireland (56 per cent, Table 2). Figure 5 summarises changes in the
proportions of plants undertaking R&D since 1993 for all plants. In Bavaria there has
been a small overall decline in the proportion of plants undertaking R&D over this
period, a pattern repeated across each of the three plant sizebands (Figure 5). In
contrast, although the overall proportion of plants undertaking R&D in Northern
Ireland and Republic of Ireland remains below that of the German study region, it has
increased since 1993. In the Republic of Ireland, this increase was due to a rise in the
proportion of plants with 100 plus employees undertaking R&D, while proportion of
smaller plants undertaking R&D fell marginally. In Northern Ireland the pattern was
slightly different, with an increase in the proportion of R&D performers in the 20-99
and 500 plus employee sizebands outweighing a decline in the 100-499 sizeband
(Figure 5).
The increase in the proportion of plants undertaking R&D in Northern Ireland and the
Republic of Ireland is welcome given longstanding concerns in both areas about the

16
relatively low level of R&D spending by businesses (e.g. Industrial Research and
Technology Unit, 1992; STIAC, 1995). And, given the declines in the proportion of
plants undertaking R&D in Bavaria, some regional convergence has occurred. In part
at least this convergence may reflect similar factors to those influencing the
constraints on innovation activity discussed earlier. Steps have been taken in both
Northern Ireland and the Republic of Ireland to boost the level of business R&D
spending while economic conditions in Germany at the time of the 1999 survey were
probably discouraging R&D investments (OECD, 1999).
Another factor which has in the past been shown to be strongly linked to plants’
innovation potential, and is, perhaps, less likely to be sensitive to the business cycle
than R&D investments, is the level of graduate employment (Figure 6). Overall, the
lowest level of graduate employment in the study regions is now found in Northern
Ireland (7.1 per cent) compared to 7.7 per cent in Bavaria and 8.9 per cent in both the
Republic of Ireland (Table 1). This, however, is a marked contrast to the situation in
1993 when levels of graduate employment in Northern Ireland (6.7 per cent) and the
Republic of Ireland (8.8 per cent) were actually above that in Bavaria (4.7 per cent).
In other words, from 1993-99, Bavaria had overtaken Northern Ireland in terms of the
level of graduate employment (Figure 6). In part this may reflect global trends
towards a more highly skilled manufacturing workforce but may also reflect pressures
within Germany as further and higher education become more attractive compared to
traditional apprenticeship training (Culpepper, 1999, p. 49).
Clearly, however, undertaking R&D and having a high level of graduate employment
are not sufficient to generate innovation. Also necessary is efficient co-ordination and
information sharing within the firm, one reflection of which is the extent of multi-
functional working. Although not covered by the 1996 and 1999 surveys, information
on the extent of multi-functional involvement in the innovation process is available
from the 1993 survey (see also Roper, 1997; Love, 2000). Figure 7 summarises the
percentage of all manufacturing involving more than one functional group in seven
elements of the product innovation process in 1993. Multi-functional involvement in
the innovation process was most common in each region in product testing and least
common in the marketing phases of the product development process (Figure 7). As
expected from previous studies using PDS data, multi-functional working was more

17
common among plants in Northern Ireland and the Republic of Ireland than in the
Bavaria (Figure 7). Previous studies have linked the difficulties of implementing
multi-functional working in Germany to rigidities stemming from apprenticeship
based training (e.g. Streeck, 1996; Finegold and Wagner, 2000) and the more
incremental and developmental nature of innovation activity in Germany (e.g. Roper,
1997). Culpepper (1999, p. 53) summarises the situation as follows: ’the organisation
of work in multi-functional teams rejects the concept at the heart of the German skills
system, that a skilled worker brings to the process a (portable) technical skill that is
his or her contribution to production’. The weakness of the UK and Irish
apprenticeship systems, and progress towards flexibility within the UK and Irish
labour markets, are likely to have made any such barriers in Northern Ireland and the
Republic of Ireland less important.
One possible approach to overcoming any such internal rigidities is for plants to
develop links with outside organisations with complimentary or reinforcing
competencies (e.g. Buckley and Carter, 1999; Crone and Roper, 2000). Figure 8
summarises the percentage of all manufacturing plants involving external
organisations of varying types in their innovation activity from 1996-99 (see also
Veugelers and Cassiman, 1999). In each of the study regions the most common
innovation links (covering 25-35 per cent of innovators) are, unsurprisingly, along the
supply chain to either customers or suppliers (Figure 8). Links to other group
companies existed for around 20 per cent of all manufacturing plants, but were more
common in the Republic of Ireland reflecting the importance of externally-owned
businesses particularly in the high-tech sectors (Gorg and Ruane, 1997). Links to
consultants were also notably more common in the Republic of Ireland than in either
Bavaria or Northern Ireland, however, horizontal linkages to competitors were equally
common in each of the study regions existing for 5-10 per cent of innovating plants
(Figure 8). In terms of plant’ innovation links to the non-business sector, very similar
levels of interaction were noted in each of the study regions (Figure 8). Around 20 per
cent of plants in each of the study regions had links to universities, while fewer than
one in ten plants had links to private research institutions. More marked differences
existed between the study regions in the strength of plants’ links to industry and
government operated laboratories.

18
7. Benchmarks: The Extent and Success of InnovationWe consider two main innovation output measures: the proportion of plants
introducing new or improved products during each three year period (i.e. 1991-93,
1994-96, 1997-99); and, the percentage of sales accounted for by new products. The
former can be interpreted as an indicator of the extent of innovation activity in the
region and the latter as an indication of innovation success.
As we might expect from the earlier discussion of increasing competitive pressures,
the extent of innovation activity increased in overall terms from 1991-93 to 1997-99
period in Northern Ireland and, most sharply, in Bavaria (Figure 9). Increases in the
extent of innovation activity in Northern Ireland, and Bavaria suggest some regional
convergence. One consequence of the overall increases in the extent of innovative
activity, combined with the tendency towards shorter product lifetimes and intensified
global competition, might be an increase in innovation ‘success’ or the percentage of
plants’ sales derived from innovative products (Figure 10). What we observe,
however, is a marked contrast between Northern Ireland and Republic of Ireland on
one hand, where the percentage of sales derived from innovative products has actually
fallen since 1991, in Bavaria, where the percentage of sales of new products has
increased (Figure 10). Even more striking is that in 1991 Northern Ireland and the
Republic of Ireland actually had higher overall proportions of new products in sales
(22-23 per cent) than Bavaria (15 per cent), an advantage they had lost by 1999.
Taken together these measures of the extent and success of innovation imply a similar
situation in Northern Ireland and the Republic of Ireland, i.e. an increase in the overall
extent of innovation but a decline in innovation success. This itself reflects a marked
contrast between SMEs on one hand and larger firms on other. For SMEs in Northern
Ireland and the Republic of Ireland a decline in the extent of innovative activity is
consistent with a decline in innovation success (or the percentage of sales derived
from new products). The situation for larger firms is more worrying as the extent of
innovation has increased but innovation success declined. One clear possibility is that
– for whatever reason – larger firms in Northern Ireland and the Republic of Ireland
were introducing more marginal innovations over this period which achieved limited
market success.

19
8. Discussion
The complex social and systemic influences that drive innovation in any specific
region defy simple categorisation. In multi-regional comparisons the situation is
complicated further by the influence of national market conditions such as high levels
of GDP in Bavaria, and high rates of economic growth in the Republic of Ireland.
Also important are national and regional differences in institutional structures relating
to vocational training, technology transfer, venture capital etc. Despite this complexity
some clear commonalities and contrasts emerge between the study regions.
Perhaps reflecting the type of global trends in competition highlighted by Best (1991),
plants’ innovation objectives were very similar in each of the study regions. A general
trend was notable, however, towards more radical innovation, with plants increasingly
emphasising the development of new products rather than the improvement of their
existing product range. One more worrying element of plants’ innovation objectives
was that the development of environmentally friendly products was given a low and
diminishing priority. Businesses identified a number of factors that constrain their
ability to achieve these objectives. Risk, lack of finance, and limited market
opportunities were highlighted by plants in each area throughout the 1991-99 period
but marked contrasts exist in the changing importance of innovation constraints.
Plants in Bavaria highlighted very similar constraints throughout the period while
there was a sharp decline in the proportion of plants in Northern Ireland and the
Republic of Ireland reporting that their innovation activity was being constrained.
Contrasting macro-economic conditions in the study regions may be part of the
explanation along with attempts by government in Northern Ireland and the Republic
of Ireland to improve firms’ innovation capability and develop the institutional
support structure for innovation.
The next group of regional benchmarks relates to the scale and organisation of plants’
innovation resources. In terms of the scale of their R&D investments, for example,
firms in Bavaria have been consistently invested more than those in Northern Ireland
and Republic of Ireland. In addition, a larger proportion of plants in Bavaria undertake
R&D than in either Northern Ireland and the Republic of Ireland although there has
been some convergence since 1991. In terms of graduate employment, plants in
Northern Ireland and Republic of Ireland had some advantage in 1991. By 1999,

20
however, a more rapid expansion of the number of graduates in German plants meant
that Northern Ireland and the Republic of Ireland were overtaken by Bavarian plants.
This meant that both in terms of the scale and extent of R&D activity and graduate
employment, plants in Bavaria had the strongest resource base for innovation. There
is evidence, however, that the co-ordination of these resources may be less effective in
Germany with fewer plants operating multi-functional groups as part of their
innovation activity. More uniformity was evident between the study regions in terms
of plants’ external links to other businesses and universities.
For plants in Northern Ireland there does seem to have been something of an
improvement in the environment for innovation during the 1990s. A perception of
fewer innovation constraints has contributed to an increase in the extent of R&D
activity, although this continues to lag well behind that in Germany. Intra-plant and
inter-firm co-ordination during the innovation process in Northern Ireland at least
matches that in Germany. The increase in the extent of R&D activity and the
improvement in the environment for innovation in Northern Ireland are less apparent
in the benchmarks for innovation outputs. The extent of innovation in Northern
Ireland has increased, but has fallen further below that in Bavaria (from 3.0 to 7.5 pp).
Like the Republic of Ireland, however, a perhaps more worrying result is that
innovative products introduced by Northern Ireland plants were proving less
successful than previously. For smaller plants this may reflect a decline in the extent
of innovation in Northern Ireland, for larger plants, however, it suggests that the
innovations being made are more marginal. One possibility, evident in case-study
evaluations of R&D support measures (e.g. Roper, 1998), is that government support
for R&D activity is encouraging innovations which are technically feasible but lack
market applicability.
The situation in the Republic of Ireland reflects that in Northern Ireland, with plants’
difficulties exacerbated by shortages of appropriately skilled labour. As in Northern
Ireland the extent and scale of firms’ R&D activity has increased but remains well
below that in Bavaria. Also like Northern Ireland, multi-functional working in the
innovation process is more common than in Bavaria, with similar levels of inter-firm
linkages. The extent of innovation in the Republic of Ireland is consistently above that
in Northern Ireland, although the gap has narrowed from 8.1 pp in 1993 to 4.4 pp in

21
1999. In general terms the benchmarks therefore suggest a stronger innovation profile
in the Republic of Ireland than in Northern Ireland but innovative activity continues to
lag well behind that in the German study regions. The need – recognised in recent
policy statements and expenditure announcements – is to significantly increase the
level of R&D spending and to continue the process of institutional capabilities to
support firms’ innovative activity.
Of the three study regions, however, Bavaria is alone in achieving increases in the
extent and success of product innovation for each plant sizeband over the 1993-99
period. While this may reflect the development of more high-tech industry in the
region, it is a development which has been accompanied by significant government
spending and institutional developments. For example, from 1992-97 there was a
sharp increase in the basic support by Lander and Federal government in Germany for
science in Bavaria, with spending increasing 25 per cent in nominal terms compared
to a 12.7 per cent increase in the old Lander and a 12.2 per cent rise in Baden-
Württemberg. Similarly, institutional developments in Bavaria were made to support
high-tech industry and innovation including the establishment of the Bavarian
Research Foundation in 1991 to foster collaborative research in new technologies,
Bayern Innovativ (1995) set up to stimulate technology transfer to SMEs and parallel
developments in provision of venture capital (e.g. Bayern Kapital Landshut). Despite
these developments links between firms and institutional innovation partners in
Bavaria remain relatively underdeveloped as does the extent of multi-functional
working.
In more general terms, the benchmark comparisons suggest little evidence of
convergence between innovative activity in the study regions. In terms of the extent of
innovation, Northern Ireland and the Republic of Ireland continue to lag increasingly
behind plants in Bavaria. In terms of the success of innovation the situation is even
more stark with Northern Ireland and the Republic of Ireland losing ground relative to
Bavaria. Accounting for these performance differences in terms of the efficiency with
which plants in each area innovate is difficult given the overall similarity (or
advantage of Northern Ireland and the Republic of Ireland) in terms of intra-firm co-
ordination and inter-firm linkages. More convincing are arguments related simply to
the extent of the regions’ commitment and investments in R&D and innovation. To

22
illustrate the extent of the differences between the study regions Table 3 gives R&D
expenditure by performing sector in 1996. Part A of the table expresses R&D
spending as a proportion of each region’s GDP. As indicated previously business and
government R&D spending in Northern Ireland and the Republic of Ireland in 1996 as
a percentage of GDP was between half and two thirds of that of Bavaria, with R&D in
higher education at similar levels. This comparison, however, underestimates the real
difference in spending due to higher GDP per capita in Bavaria (Table 1). For
Northern Ireland this would involve a trebling of business spending on R&D, a three
to four-fold increase in government R&D spending and a doubling of spending on
research in higher education. For the Republic of Ireland a similar doubling of
business spending and three to four-fold increase in government spending would be
necessary. High levels of spending on research in higher education in the Republic of
Ireland mean that this is already in line with levels in Germany.
Even an expansion of R&D investment of this scale, however, is unlikely to be
sufficient for Northern Ireland or the Republic of Ireland to ‘catch-up’ with Bavaria
over a ten or even twenty-year horizon. Because of past investments German plants
have effectively built up a stock of R&D expertise and knowledge that it will be
difficult for Northern Ireland and the Republic of Ireland to match. To achieve faster
convergence would require even higher levels of R&D investment.

23
Table 1: Basic Regional Indicators, R&D and Patent Comparisons
Bavaria Republicof Ireland
NorthernIreland
FederalRepublic ofGermany
UnitedKingdom
Population 1996 (000s) 12018.7 3626.1 1663.3 81914.8 58801.5
Population Density 1996Persons/km2 170.4 51.6 117.5 229.4 241.2
GDP per capita 1995-97 (EU15=100) 127 96 80 110 99
Unemployment rateApril 1998 (%) 5.7 7.9 8.8 9.8 6.2
Patent applicationsPer capita 1996 270.91 39.38 16.05 181.47 82.25
R&D Expenditure as % ofGDP in 1996 1.60 1.30 0.96 1.50 1.93
Of which:Business Sector 1.04 0.64 0.48 0.83 1.27
Government Sector 0.22 0.10 0.14 0.25 0.28
Higher Education 0.34 0.56 0.34 0.42 0.38
Note: GDP per capita figures were originally in ECU per capita and expressed as apercentage of the EU15.
Source: Statistics in Focus, Eurostat

24
Table 2: Regional Innovation Benchmarks: 1999
Northern Ireland
Republic ofIreland
Bavaria
Constraints on Innovation (% plants)Riskiness of Innovation 21.9 22.3 31.8Low Expected Rate of return 39.7 37.6 44.2Attitudinal barriers 7.5 12.4 8.5Lack of finance 29.9 30.3 33.9Few market opportunities 25.1 27.5 37.7Lack of information 9.5 14.5 11.6Legislative requirements 11.7 16.8 22.8Lack of partners 6.4 10.6 10.6Lack of expertise 17.8 28.4 14.1
Objectives of Innovation (% plants)Replace existing products 54.7 48.7 47.3Extend product range 77.9 78.9 77.3Increase market share 80.9 75.5 92.3Enter new mkts 69.6 63.5 64.9Reduce production costs 48.7 40.5 57.9Environmentally friendly products 23.9 27.6 28.1Improve product quality 71.3 64.8 74.6Match competitors 61.6 54.9 27.6
Undertaking R&D (% of Plants) 51.9 56.3 55.0Graduates (% of workforce) 7.1 8.9 8.0
Multifunctional Working (% plants)Identifying New Products 60.6 65.3 42.1Prototype Development 52.2 60.9 32.1Final Product Design 65.8 62.5 45.9Product Testing 74.1 74.0 55.5Production Engineering 54.0 41.7 18.2Market Research 25.7 24.2 7.5Developing Market Strategy 27.4 23.8 6.0
Links to Innovation Partners (% plants)Other Group Companies 22.5 28.9 17.0Clients/Customers 31.4 32.8 23.3Suppliers 31.0 34.6 28.4Competitors 8.6 9.3 5..3Consultants 16.2 25.4 11.6Govt Research Labs 8.3 12.1 5.9Industry Operated Labs 7.8 9.9 7.5Private Research Institutes 8.2 9.8 4.2University/Higher Education 18.3 19.1 14.4
Product Innovation (% plants) 62.8 67.2 70.3Sales as % New Products 15.9 17.4 20.5
Sources: See text.

25
Table 3: R&D Expenditure By Study Region Corrected For Differences in GDPper Capita
R&D Performing SectorBusiness Government Higher
EducationTotal
R&D Spending as % of GDPBavaria 1.04 0.22 0.34 1.60Northern Ireland 0.48 0.14 0.34 0.96Republic of Ireland 0.64 0.10 0.56 1.30
As % of Northern Ireland GDPBavaria 1.65 0.35 0.54 2.54
As % Republic of Ireland GDPBavaria 1.38 0.29 0.45 2.12
Notes: Parts B and C are derived by scaling figures in part A by the ratio of NorthernIreland or Republic of Ireland GDP per capita to that of Bavaria.
Source: Table 1

26
Figure 1: Innovation Objectives of All Manufacturing Plants: 1999Northern Ireland Republic of Ireland
Bavaria
0102030405060708090
100Replace out-dated prods
Extend product range
Increase mkt share
Enter new markets
Reduce production costs
Envir friendly products
Improve prod quality
Match competitors
0102030405060708090
100Replace out-dated prods
Extend product range
Increase mkt share
Enter new markets
Reduce production costs
Envir friendly products
Improve prod quality
Match competitors
0102030405060708090
100Replace out-dated prods
Extend product range
Increase mkt share
Enter new markets
Reduce production costs
Envir friendly products
Improve prod quality
Match competitors

27
Figure 2: Objectives of All Product Innovators: 1993-1999
Northern Ireland Republic of Ireland Bavaria
Northern Ireland Republic of Ireland Bavaria
Improve Quality
Match Competitors
Extend Product Range
Increase market share
New Markets
Reduce Production Costs
Replace products
Environmentally Friendly Products
65
70
75
80
85
1993 1996 199965
70
75
80
85
1993 1996 1999
70
75
80
85
90
95
1993 1996 199970
75
80
85
90
95
1993 1996 1999
55
60
65
70
75
1993 1996 1999
30
35
40
45
50
55
60
1993 1996 1999
55
60
65
70
75
1993 1996 1999
30
35
40
45
50
55
60
1993 1996 1999
35
40
45
50
55
60
65
1993 1996 199935
40
45
50
55
60
65
1993 1996 1999
20
25
30
35
40
45
1993 1996 199920
25
30
35
40
45
1993 1996 1999
60
65
70
75
80
85
90
1993 1996 199960
65
70
75
80
85
90
1993 1996 1999
20
30
40
50
60
70
1993 1996 199920
30
40
50
60
70
1993 1996 1999
65
70
75
80
85
1993 1996 1999
70
75
80
85
90
95
1993 1996 1999
55
60
65
70
75
1993 1996 1999
30
35
40
45
50
55
60
1993 1996 1999
35
40
45
50
55
60
65
1993 1996 1999
20
25
30
35
40
45
1993 1996 1999
60
65
70
75
80
85
90
1993 1996 1999
20
30
40
50
60
70
1993 1996 1999
28
Figure 3: Innovation Constraints on All Manufacturing Plants: 1999
Northern Ireland Republic of Ireland
Bavaria
05
1015202530354045Riskiness
Low rate of return
Attitudinal barriers
Lack of finance
Few market opportunitiesLack of information
Legislative requirements
Lack of partners
Lack of expertise
05
1015202530354045Riskiness
Low rate of return
Attitudinal barriers
Lack of finance
Few market opportunitiesLack of information
Legislative requirements
Lack of partners
Lack of expertise
0
5
10
15
20
25
30
35
40
45Riskiness
Low rate of return
Attitudinal barriers
Lack of finance
Few market opportunitiesLack of information
Legislative requirements
Lack of partners
Lack of expertise

29
Figure 4: Changing Innovation Constraints on All Plants: 1993-99Northern Ireland Republic of Ireland Bavaria
Riskiness
Lack of Information
Legislative Requirements
Lack of Partners
Lack of Expertise
Low Rate of Return
Attitudinal Barriers
Lack of Finance
Few Market Opportunities
30
35
40
45
50
1993 1996 199930
35
40
45
50
1993 1996 1999
5
7
9
11
13
15
1993 1996 19995
7
9
11
13
15
1993 1996 1999
20
25
30
35
40
45
50
1993 1996 1999
20
25
30
35
40
45
1993 1996 1999
20
25
30
35
40
45
50
1993 1996 1999
20
25
30
35
40
45
1993 1996 1999
30
35
40
45
50
1993 1996 1999
5
7
9
11
13
15
1993 1996 1999
20
25
30
35
40
45
50
1993 1996 1999
20
25
30
35
40
45
1993 1996 1999
20
25
30
35
40
1993 1996 199920
25
30
35
40
1993 1996 199920
25
30
35
40
1993 1996 1999
5
10
15
20
25
1993 1996 19995
10
15
20
25
1993 1996 19995
10
15
20
25
1993 1996 1999
1012141618202224
1993 1996 19991012141618202224
1993 1996 19991012141618202224
1993 1996 1999
579
1113151719
1993 1996 1999579
1113151719
1993 1996 1999579
1113151719
1993 1996 1999
05
101520253035
1993 1996 199905
101520253035
1993 1996 199905
101520253035
1993 1996 1999


31
Figure 5: Percentage of Plants Undertaking R&D
Northern Ireland Republic of Ireland Bavaria
Overall
20-99
100-499
500 Plus
40
45
50
55
60
65
70
1993 1996 199940
45
50
55
60
65
70
1993 1996 1999
55
60
65
70
75
80
85
1993 1996 199955
60
65
70
75
80
85
1993 1996 1999
50
60
70
80
90
100
1993 1996 1999
45
50
55
60
65
70
75
1993 1996 1999
50
60
70
80
90
100
1993 1996 1999
45
50
5560
65
70
75
1993 1996 1999
40
45
50
55
60
65
70
1993 1996 1999
55
60
65
70
75
80
85
1993 1996 1999
50
60
70
80
90
100
1993 1996 1999
45
50
55
60
65
70
75
1993 1996 1999

32
Figure 6: Percentage of Workforce Which Are Graduates: All ManufacturingPlants
Northern Ireland Republic of Ireland Bavaria
Overall
20-99
100-499
500 Plus
0
2
4
6
8
10
1993 1996 19990
2
4
6
8
10
1993 1996 1999
0
2
4
6
8
10
1993 1996 19990
2
4
6
8
10
1993 1996 1999
0
5
10
15
20
1993 1996 1999
0
2
4
6
8
10
1993 1996 1999
0
5
10
15
20
1993 1996 1999
0
2
4
6
8
10
1993 1996 1999
0
2
4
6
8
10
1993 1996 1999
0
2
4
6
8
10
1993 1996 1999
0
5
10
15
20
1993 1996 1999
0
2
4
6
8
10
1993 1996 1999

33
Figure 7: Percentage of All Innovators with Multi-Functional Working: 1993
Northern Ireland Republic of Ireland
Bavaria
0
10
20
30
40
50
60
70
80Identifying New Products
Prototype Development
Final Product Desig
Product Testing Production Engineering
Market Research
Developing Market Strategy
0
10
20
30
40
50
60
70
80Identifying New Products
Prototype Development
Final Product Design
Product Testing Production Engineering
Market Research
Developing Market Strategy
0
10
20
30
40
50
60
70
80Identifying New Products
Prototype Development
Final Product Design
Product Testing Production Engineering
Market Research
Developing Market Strategy

34
Figure 8: Percentage of All Plants with External Links for Innovation:Republic of IrelandNorthern Ireland
Bavaria
0
5
10
15
20
25
30
35Other Group Companies
Clients/Customers
Suppliers
Competitors
ConsultantsGovt Research Labs
Ind Operated Labs
Private Research Instit
Uni/Higher Educ
0
5
10
15
20
25
30
35Other Group Companies
Clients/Customers
Suppliers
Competitors
ConsultantsGovt Research Labs
Ind Operated Labs
Private Research Instit
Uni/Higher Educ
0
5
10
15
20
25
30
35Other Group Companies
Clients/Customers
Suppliers
Competitors
ConsultantsGovt Research Labs
Ind Operated Labs
Private Research Instit
Uni/Higher Educ

35
Figure 9: Percentage of Plants Undertaking Product Innovation
Northern Ireland Republic of Ireland Bavaria
Overall
20-99
100-499
500 Plus
50
55
60
65
70
1993 1996 199950
55
60
65
70
1993 1996 1999
60
65
70
75
80
85
90
1993 1996 199960
65
70
75
80
85
90
1993 1996 1999
80
85
90
95
100
1993 1996 1999
55
60
65
70
75
1993 1996 1999
80
85
90
95
100
1993 1996 1999
55
60
65
70
75
1993 1996 1999
50
55
60
65
70
1993 1996 1999
60657075808590
1993 1996 1999
80
85
90
95
100
1993 1996 1999
55
60
65
70
75
1993 1996 1999

36
Figure 10: Percentage of Sales that are new Products
Northern Ireland Republic of Ireland Bavaria
Overall
20-99
100-499
500 Plus
10
15
20
25
30
1993 1996 199910
15
20
25
30
1993 1996 1999
10
15
20
25
30
1993 1996 199910
15
20
25
30
1993 1996 1999
0
5
10
15
20
25
30
1993 1996 1999
10
15
20
25
30
1993 1996 1999
0
5
10
15
20
25
30
1993 1996 1999
10
15
20
25
30
1993 1996 1999
10
15
20
25
30
1993 1996 1999
10
15
20
25
30
1993 1996 1999
0
5
10
15
20
25
30
1993 1996 1999
10
15
20
25
30
1993 1996 1999

37
AcknowledgementsThis paper draws on a number of collaborative research projects which have involvedBrian Ashcroft (University of Strathclyde), Ken Low (University of Strathclyde),Stewart Dunlop (University of Strathclyde), James H Love (University of Aston),Nola Hewitt-Dundas (NIERC), Julie Anderson (NIERC), Kurt Vogler-Ludwig (ifo-Institut), and Herbert Hofmann (ifo-Institut). I am grateful to each individual for theircollaboration and to the funders of the various research projects (the EU Konverinitiative, the Royal Irish Academy, IRTU and Scottish Enterprise) for their support.Julie Anderson and Lisa Bradley provided valuable help in the preparation of thispaper.
References
Acs, Z J and Audretsch, D B (1988) ‘Innovation in Large and Small Firms’, AmericanEconomic Review, 78, 678-90.
Acs, Z J and Audretsch, D B (1993) ‘Innovation and Firm Size - The New Learning’,International Journal of Technology Management, Special Publication on SmallFirms and Innovation.
Ashcroft, B S Dunlop, S and Love, J H (1994) ‘Innovation in ScottishManufacturing’, Research Paper No 6. Scottish Foundation For EconomicResearch, Glasgow Caledonian University.
Ashcroft, B (1998) ‘The Economic Possibilities for a Scottish Parliament’, RegionalStudies, 32,2, April.
Audretsch, D B (1995) Innovation and Industry Evolution, MIT Press, Cambridge,Mass.
Best, M H (1991) ‘The New Competition: Institutions of Industrial Restructuring’,Polity Press, Cambridge.
Birnie, E Hitchens, D (1998) ‘An Economic Agenda for the Northern IrelandAssembly’, Regional Studies, 32.
Blind, K and Grupp, H (1999) ‘Interdependencies Between the Science andTechnology Infrastructure and Innovation Activities in German Regions:Empirical Findings and Policy Consequences’, Research Policy, 28, 451-468.
Braczyk, H-J, Cooke, P and Heidenreich, M (1998) ‘Regional Innovation Systems’,UCL Press, London.
Brouwer, E Kleinknecht, A (1996) ‘Determinants of innovation: a microeconometricanalysis of three alternative innovation output indicators’, in A Kleinknecht,(ed.), Determinants of Innovation: the Message from New Indicators. London andBasingstoke: Macmillan Press.

38
Buckley, P J and Carter, M J (1999) ‘Managing Cross Border ComplementaryKnowledge’, International Studies of Management and Change, 29, 1, 80-104.
Cohen, W (1995) ‘Empirical Studies of Innovative Activity’ in ‘Handbook of theEconomics of Innovation and Technological Change’ Stoneman, P (ed), BasilBlackwell, Oxford.
Crone, M and Roper, S (2000) ‘Local Learning from Multinational Plants:Knowledge Transfers in the Supply Chain’, Regional Studies, forthcoming.
Culpepper, P D (1999) ‘The future of the high-skill equilibrium in Germany’, Oxfordreview of economic policy, Spring 1999, Vol.15, No.1, pp.43-59
DETI (1999) ‘Strategy 2010’, Belfast.
Develaar E and Nijkamp, P (1989) ‘Spatial Dispersion of Technological Innovation:A Case Study for the Netherlands By Means of Partial Least Squares’, Journal ofRegional Science, 29, 3, 325-346.
Develaar, E and Nijkamp, P (1992) ‘Operational Models on Industrial Innovation andSpatial Development: A Case Study for the Netherlands’, Journal of Scientificand Industrial Research, 51, 253-284.
Druilhe, C Garnsey, E (2000) ‘Emergence and growth of high-tech activity inCambridge and Grenoble’ Entrepreneurship & regional development, 12, 2, 163-177.
Dunning, J H (1993) Multinational Enterprises and the Global Economy, Addison-Wesley, Wokingham.
ECOTEC (1999) ‘Final Report of the On-Going Evaluation of the RegionalInnovation Strategies Under Article 10 of the ERDF – Pilot Projects’,Birmingham.
Felder, J Licht, G Nerlinger, E and Stahl, H (1996) ‘Factors Determining R&D andInnovation Expenditure in German Manufacturing Industries’, in Kleinknecht, A(ed) ‘Determinants of Innovation – The Message from New Indicators’,Macmillan Press, London.
Finegold, D and Wagner, K (2000) ‘The German Skill Creation System and TeamBased Production: Competitive Asset or Liability?’, forthcoming in Culpepper, Pand Finegold, D (eds) ‘The German Skill Machine: Comparative Perspectives onSystems of Education and Training’, Berghahn Books.
Frenkel, A. (1997), ‘Can Regional Policy Affect Firms' Innovation Potential inLagging Regions?’, paper presented to the 37th European Congress of theRegional Science Association, Rome, Italy, 26-29 August.
Gudgin, G (1995), “Regional Problems and Policy in the UK”, Oxford Review ofEconomic Policy, 11, 2, 18-63.

39
Gemser, G and Wijnberg, N M (1995) ‘Horizontal Networks, AppropriabilityConditions and Industry Life Cycles, Journal of Industry Studies, 2, 2, 129-140.
Geroski, P A (1990) ‘Innovation, technological opportunity, and market structure’,Oxford Economic Papers, 42, 586-602.
Gospel, H (1996) ‘Industrial Training and Technological Innovation’, Routledge,London.
Grabher, G and Stark, D (1997) ‘Organising Diversity - Evolutionary Theory,Network Analysis and Post-socialism, Regional Studies, 31, 533-544.
Grupp, H Schmoch, U and Koschatzky, K (1998) ‘Science and TechnologyInfrastructure in Baden-Württemberg and Its Orientation towards Future RegionalDevelopment', Journal of the American Society for Information Science’, 49, 1,18-29.
Harris R I D and Trainor M (1995) ‘Innovations and R&D in Northern Irelandmanufacturing: a Schumpeterian approach’, Regional Studies, 29, 593-604.
Hassink, R (1993) ‘Regional Innovation Policies Compared’, Urban Studies, 30, 6,1009-1024.
Jones, P N and Wild, T (1994) ‘Opening the Frontier; Recent Spatial Impacts in theFormer Inner-German Border Zone’, Regional Studies, 28, 3, 259-273.
Kleinknecht, A (1996) Determinants of Innovation the Message from New Indicators,Macmillan, London and Basingstoke.
Kleinknecht, A and Poot, T P (1992) ‘Do Regions Matter for R&D?’, RegionalStudies, 32, 221-32.
Koschatzky, K Frenkel, A Walter, G H and Shefer, D (1998) ‘Regional Concentrationand Dynamics of Fast Growing Industries in Baden-Wurttemberg and Israel’, ISI-Arbeitspapiere Regionalforschung, Nr 14.
Love, J. H. (2000) “Patterns of Networking in the Innovation Process: A ComparativeStudy of the UK, Germany and Ireland”, in O Jones, S Conway and F Steward(eds) Social Interaction and Organisational Change: Aston Perspectives onInnovation Networks, Imperial College Press, London.
Love, J H and Roper, S (1999) “The determinants of innovation: R&D, technologytransfer and networking effects”, Review of Industrial Organisation, 15, 43-64.
Love, J H and Roper, S (2000) “Scale, Appropriability Conditions and theOrganisation of R&D , Working Paper 42, NIERC, Belfast.

40
Love, J H and Roper, S (2001) “Location and Network Effects on Innovation Success:Evidence for UK, German and Irish Manufacturing Plants”, Research Policy, 30,643-661.
Maillat, D (1995) ‘Territorial Dynamic, Innovative Milieus and Regional Policy’,Entrepreneurship and Regional Development, 7, 157-65.
Mason, C and Wagner, K (1994) ‘Innovation and the Skill Mix: Chemicals andEngineering in Britain and Germany’, National Institute Economic Review, May,61-72.
Morgan, K (1997) ‘The learning region: institutions, innovation and regionalrenewal’, Regional studies, 31, 5, 491-504.
McCartney, J and Teague, P (1997) ‘Workplace Innovations in the Republic ofIreland’, The Economic and Social Review, 28, 4, 381-399.
Metcalfe, S (1997) ‘Technology Systems and Technology Policy in an EvolutionaryFramework’, in ‘Technology, Globalisation and Economic Performance’,Archibugi, D and Michie, J (eds.), Cambridge University Press.
Morgan K. (1997) The learning region: institutions, innovation and regional renewal,Regional Studies 31, 491-504.
Nelson, R R and Winter, S G (1982) ‘An Evolutionary Theory of Economic Change’,Harvard University Press, Cambridge, Mass.
Nelson, R.R. (1993), National Innovation Systems, New York, Oxford UniversityPress.
NIEC (1999) ‘Publicly Funded R&D and Economic Development in NorthernIreland’, Report 133, Belfast.
OECD (1999) ‘Economic Outlook – Germany’, Organisation for Economic Co-operation and Development, Issue 65, pp. 49-52, June, Paris.
Oerlemans, L A G Meus, M T H and Boekema, F W M (1998) ‘Do Networks Matterfor Innovation? The Usefulness of the Economic Network Approach in AnalysingInnovation’, Tijdschrift voor Economische en Sociale Geografie, 89, 3, 298-309.
Powell, W W (1998) ‘Learning from Collaboration: Knowledge and Networks in theBiotechnology and Pharmaceutical Industries’, California Management Review,40, 3, 28-240.
Rees, T (2000) ‘The learning region? Integrating gender equality into regionaleconomic development’, Policy and politics, 28, 2, 179-191.
Roper, S (1997) ‘Product Innovation and Small Business Growth: a Comparison of theStrategies of German, UK and Irish Companies’, Small Business Economics, 9,523-37.

41
Roper, S (1998) ‘Public Support for Near-Market R&D: The Northern IrelandExperience’, Regional Studies, 32, 3, 295-299.
Roper, S. (2001) ‘Innovation, Networks and Plant Location; Evidence for Ireland’,Regional Studies, 35, 3, 215-228.
Roper, S, Ashcroft, B, Love, J H, Dunlop, S, Hofmann, H and Vogler-Ludwig K(1996) Product Innovation and Development in UK, Irish and GermanManufacturing, Queen’s University of Belfast/University of Strathclyde, Belfastand Glasgow.
Roper, S and Anderson, J (2000) ‘Innovation and E-Commerce: A Cross-BorderComparison of Irish Manufacturing Plants’, NIERC, Research Report 17,Belfast.
Roper, S and Frenkel, A (2000) ‘Different Paths to Success: Electronics Growth inIreland and Israel’, Environment and Planning C, 18, 651-65.
Roper, S and Hewitt-Dundas, N (1998) ‘Innovation, Networks and the Diffusion ofManufacturing Best Practice: A Comparison of Northern Ireland and theRepublic of Ireland’, NIERC, Belfast.
Rosenberg, N (1982) ‘Inside the Black Box’, Cambridge University Press, Cambridge.
Ruane, F and Gorg, H (1997), “Reflections on Irish Industrial Policy Towards ForeignDirect Investment”, Trinity Economic Papers Series, 97/3, Dublin.
Saxenian, A (1996) ‘Regional Advantage –Culture and Competition in Silicon Valleyand Route 128’, Harvard University Press.
Shefer, D and Frenkel, A (1998) ‘Local Milieu and Innovations: Some EmpiricalResults’, Annals of Regional Science, 32, 185-200.
Song, XM Montoya-Weiss, M M, Schmidt, J B (1997) ‘Antecedents andConsequences of Cross Functional Co-operation: A Comparison of R&D,Manufacturing and Marketing Perspectives’, Journal of Product InnovationManagement, 14, 35-47.
Sternberg, R (1999) ‘Innovative Linkages and Proximity: Empirical Results fromRecent Surveys of Small and Medium Sized Firms in German Regions’, RegionalStudies, 33, 6, 529-540.
Steward, F and Conway, S (1998) ‘Mapping Innovation Networks’, InternationalJournal of Innovation Management, 2, 2, 223-254.
STIAC (1995) ‘Making Knowledge Work for Us – A Strategic View of Science,Technology and Innovation in Ireland’, Report of the Science Technology andInnovation Advisory Council, Dublin.

42
Streeck, W (1996) ‘Lean Production in the German Automobile Industry: A Test Casefor Convergence Theory’, in Berger, S and Dore, R (eds) ‘National Diversity andGlobal Capitalism’, Cornell University Press, Ithaca, NY.
Tomaney J. (1995) ‘Recent developments in Irish industrial policy’, EuropeanPlanning Studies, 3, 99-113.
Veugelers, R and Cassiman, B (1999) ‘Make and Buy in Innovation Strategies:Evidence from Belgian Manufacturing Firms’, Research Policy, 28, 63-80.
Walker, W (1993) ‘National Innovation Systems: Britain’, in Nelson, R R (ed)‘National Innovation Systems: A Comparative Analysis’, Oxford UniversityPress, 1993.
Wrynn, J (1997) ‘Foreign Direct Investment to a Peripheral Country – The Case ofIreland’ in Fynes, B and Ennis, S (eds) ‘Competing From the Periphery’, OaktreePress, Dublin.
Yun, H A (1998) ‘Innovative Milieu and Co-operation Networks – State Initiativesand Partnership for Restructuring in Singapore’, in Braczyk, H-J, Cooke, P andHeidenreich, M (eds) ‘Regional Innovation Systems’, UCL Press, London.