Benchmarking of the Manual Handling assessment Charts - HSE
49
Broad Lane, Sheffield, S3 7HQ Telephone: +44 (0)114 289 2000 Facsimile: +44 (0)114 289 2500 Project Leader: Mr SC Monnington Author: Dr Andrew DJ Pinder Science Group: Human Factors Group Crown Copyright 2002 Benchmarking of the Manual Handling assessment Charts (MAC) HSL/2002/31
Transcript of Benchmarking of the Manual Handling assessment Charts - HSE
Broad Lane, Sheffield, S3 7HQTelephone: +44 (0)114 289 2000Facsimile: +44 (0)114 289 2500
Project Leader: Mr SC Monnington
Author: Dr Andrew DJ Pinder
Science Group: Human Factors Group
Crown Copyright 2002
Benchmarking of the Manual Handlingassessment Charts (MAC)
HSL/2002/31
PRIVACY MARKING
Available to the public
\\ganu\ergonomics\adjp\emm\benchmarking\benchmark report.lwpElectronic filename:
EP/RE/128/2001Registry file:
JS4000906Job number:
December 2002Date of issue:
Mr MI GrayHSL report approval:
Crown Copyright 2002
(ii)
CONTENTS
416 Bibliography . . . . . . . . . . . . . . . . . . . . . . . . . . . . . . . . . . . . . . . . . . . . . . . . . . . . . . .
385 Discussion and conclusions . . . . . . . . . . . . . . . . . . . . . . . . . . . . . . . . . . . . . . . . . .
324.7 Comparison of scoring systems used by the different risk assessment
tools . . . . . . . . . . . . . . . . . . . . . . . . . . . . . . . . . . . . . . . . . . . . . . . . . . . . . . . . . . . . . .
304.6 The 1991 NIOSH Revised Lifting Equation . . . . . . . . . . . . . . . . . . . . . . . . . . . . .
284.5 OWAS . . . . . . . . . . . . . . . . . . . . . . . . . . . . . . . . . . . . . . . . . . . . . . . . . . . . . . . . . . . .
214.4 REBA . . . . . . . . . . . . . . . . . . . . . . . . . . . . . . . . . . . . . . . . . . . . . . . . . . . . . . . . . . . . .
164.3 The Quick Exposure Check (QEC) . . . . . . . . . . . . . . . . . . . . . . . . . . . . . . . . . . . .
144.2 The HSE Manual handling Assessment Charts (MAC) . . . . . . . . . . . . . . . . . . .
144.1 Introduction . . . . . . . . . . . . . . . . . . . . . . . . . . . . . . . . . . . . . . . . . . . . . . . . . . . . . . . .
144 Models underlying manual handling risk assessment tools . . . . . . . . . . . . . . .
83.3 Results of benchmarking by experts . . . . . . . . . . . . . . . . . . . . . . . . . . . . . . . . . . . .
73.2 Analysis of results of task assessments . . . . . . . . . . . . . . . . . . . . . . . . . . . . . . . . .
63.1 Approach adopted . . . . . . . . . . . . . . . . . . . . . . . . . . . . . . . . . . . . . . . . . . . . . . . . . . .
63 Benchmarking of the MAC . . . . . . . . . . . . . . . . . . . . . . . . . . . . . . . . . . . . . . . . . . . .
32.10 Rodgers’ Job Analysis . . . . . . . . . . . . . . . . . . . . . . . . . . . . . . . . . . . . . . . . . . . . . . . .
32.9 PLIBEL . . . . . . . . . . . . . . . . . . . . . . . . . . . . . . . . . . . . . . . . . . . . . . . . . . . . . . . . . . . . .
32.8 PEO . . . . . . . . . . . . . . . . . . . . . . . . . . . . . . . . . . . . . . . . . . . . . . . . . . . . . . . . . . . . . . .
32.7 OWAS . . . . . . . . . . . . . . . . . . . . . . . . . . . . . . . . . . . . . . . . . . . . . . . . . . . . . . . . . . . . .
22.6 2D and 3D SSPP . . . . . . . . . . . . . . . . . . . . . . . . . . . . . . . . . . . . . . . . . . . . . . . . . . . .
22.5 Snook Psychophysical Tables . . . . . . . . . . . . . . . . . . . . . . . . . . . . . . . . . . . . . . . . .
22.4 Rapid Entire Body Assessment (REBA) . . . . . . . . . . . . . . . . . . . . . . . . . . . . . . . . .
22.3 The Quick Exposure Check (QEC) . . . . . . . . . . . . . . . . . . . . . . . . . . . . . . . . . . . . .
22.2 The 1991 NIOSH revised lifting equation . . . . . . . . . . . . . . . . . . . . . . . . . . . . . . . .
22.1 The HSL/HSE MAC . . . . . . . . . . . . . . . . . . . . . . . . . . . . . . . . . . . . . . . . . . . . . . . . . .
22 Extant tools for assessing risk of work-related musculoskeletal
disorders . . . . . . . . . . . . . . . . . . . . . . . . . . . . . . . . . . . . . . . . . . . . . . . . . . . . . . . . . . .
11.2 Aims and objectives . . . . . . . . . . . . . . . . . . . . . . . . . . . . . . . . . . . . . . . . . . . . . . . . . .
11.1 Background . . . . . . . . . . . . . . . . . . . . . . . . . . . . . . . . . . . . . . . . . . . . . . . . . . . . . . . . .
11 Introduction . . . . . . . . . . . . . . . . . . . . . . . . . . . . . . . . . . . . . . . . . . . . . . . . . . . . . . . . .
Crown Copyright 2002
(iii)
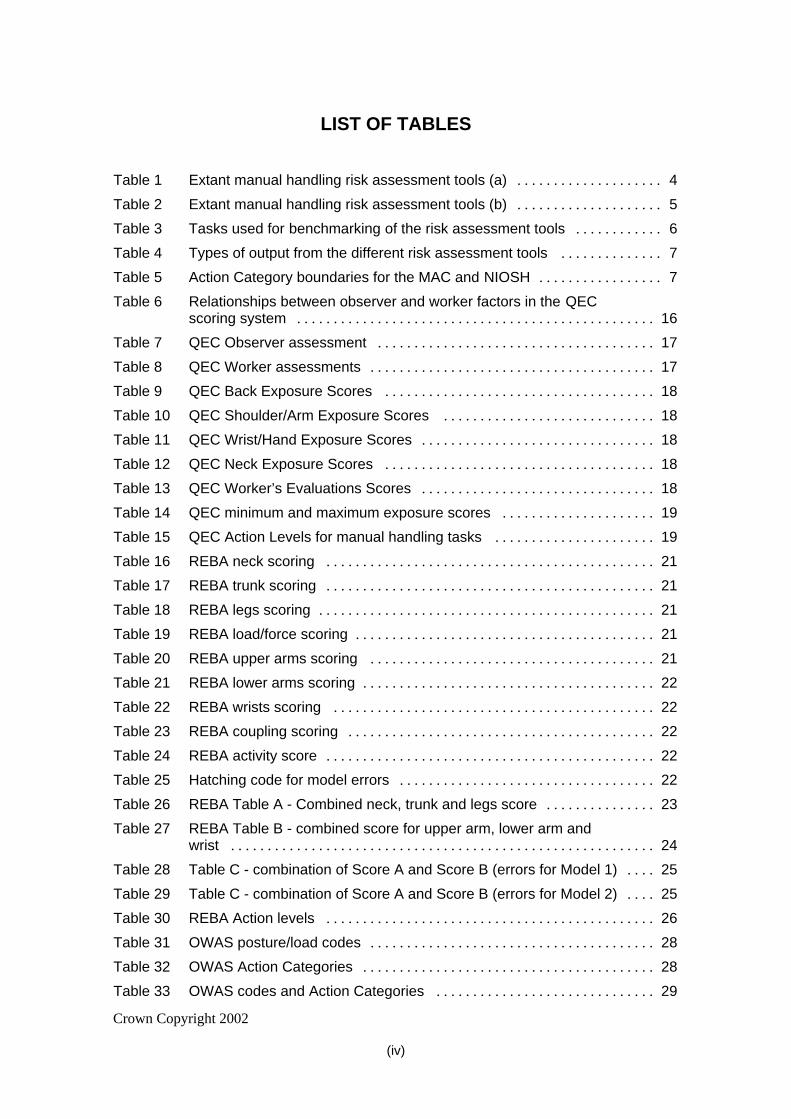
LIST OF TABLES
29Table 33 OWAS codes and Action Categories . . . . . . . . . . . . . . . . . . . . . . . . . . . . . .
28Table 32 OWAS Action Categories . . . . . . . . . . . . . . . . . . . . . . . . . . . . . . . . . . . . . . . .
28Table 31 OWAS posture/load codes . . . . . . . . . . . . . . . . . . . . . . . . . . . . . . . . . . . . . . .
26Table 30 REBA Action levels . . . . . . . . . . . . . . . . . . . . . . . . . . . . . . . . . . . . . . . . . . . . .
25Table 29 Table C - combination of Score A and Score B (errors for Model 2) . . . .
25Table 28 Table C - combination of Score A and Score B (errors for Model 1) . . . .
24Table 27 REBA Table B - combined score for upper arm, lower arm and
wrist . . . . . . . . . . . . . . . . . . . . . . . . . . . . . . . . . . . . . . . . . . . . . . . . . . . . . . . . . .
23Table 26 REBA Table A - Combined neck, trunk and legs score . . . . . . . . . . . . . . .
22Table 25 Hatching code for model errors . . . . . . . . . . . . . . . . . . . . . . . . . . . . . . . . . . .
22Table 24 REBA activity score . . . . . . . . . . . . . . . . . . . . . . . . . . . . . . . . . . . . . . . . . . . . .
22Table 23 REBA coupling scoring . . . . . . . . . . . . . . . . . . . . . . . . . . . . . . . . . . . . . . . . . .
22Table 22 REBA wrists scoring . . . . . . . . . . . . . . . . . . . . . . . . . . . . . . . . . . . . . . . . . . . .
22Table 21 REBA lower arms scoring . . . . . . . . . . . . . . . . . . . . . . . . . . . . . . . . . . . . . . . .
21Table 20 REBA upper arms scoring . . . . . . . . . . . . . . . . . . . . . . . . . . . . . . . . . . . . . . .
21Table 19 REBA load/force scoring . . . . . . . . . . . . . . . . . . . . . . . . . . . . . . . . . . . . . . . . .
21Table 18 REBA legs scoring . . . . . . . . . . . . . . . . . . . . . . . . . . . . . . . . . . . . . . . . . . . . . .
21Table 17 REBA trunk scoring . . . . . . . . . . . . . . . . . . . . . . . . . . . . . . . . . . . . . . . . . . . . .
21Table 16 REBA neck scoring . . . . . . . . . . . . . . . . . . . . . . . . . . . . . . . . . . . . . . . . . . . . .
19Table 15 QEC Action Levels for manual handling tasks . . . . . . . . . . . . . . . . . . . . . .
19Table 14 QEC minimum and maximum exposure scores . . . . . . . . . . . . . . . . . . . . .
18Table 13 QEC Worker’s Evaluations Scores . . . . . . . . . . . . . . . . . . . . . . . . . . . . . . . .
18Table 12 QEC Neck Exposure Scores . . . . . . . . . . . . . . . . . . . . . . . . . . . . . . . . . . . . .
18Table 11 QEC Wrist/Hand Exposure Scores . . . . . . . . . . . . . . . . . . . . . . . . . . . . . . . .
18Table 10 QEC Shoulder/Arm Exposure Scores . . . . . . . . . . . . . . . . . . . . . . . . . . . . .
18Table 9 QEC Back Exposure Scores . . . . . . . . . . . . . . . . . . . . . . . . . . . . . . . . . . . . .
17Table 8 QEC Worker assessments . . . . . . . . . . . . . . . . . . . . . . . . . . . . . . . . . . . . . . .
17Table 7 QEC Observer assessment . . . . . . . . . . . . . . . . . . . . . . . . . . . . . . . . . . . . . .
16Table 6 Relationships between observer and worker factors in the QEC
scoring system . . . . . . . . . . . . . . . . . . . . . . . . . . . . . . . . . . . . . . . . . . . . . . . . .
7Table 5 Action Category boundaries for the MAC and NIOSH . . . . . . . . . . . . . . . . .
7Table 4 Types of output from the different risk assessment tools . . . . . . . . . . . . . .
6Table 3 Tasks used for benchmarking of the risk assessment tools . . . . . . . . . . . .
5Table 2 Extant manual handling risk assessment tools (b) . . . . . . . . . . . . . . . . . . . .
4Table 1 Extant manual handling risk assessment tools (a) . . . . . . . . . . . . . . . . . . . .
Crown Copyright 2002
(iv)

37Table 40 Other factors in the MAC lifting flowchart . . . . . . . . . . . . . . . . . . . . . . . . . . .
36Table 39 Grip scoring . . . . . . . . . . . . . . . . . . . . . . . . . . . . . . . . . . . . . . . . . . . . . . . . . . .
35Table 38 Trunk twisting/sideways bending scoring . . . . . . . . . . . . . . . . . . . . . . . . . . .
34Table 37 Hand height/vertical distance scoring . . . . . . . . . . . . . . . . . . . . . . . . . . . . . .
33Table 36 Hand distance/back flexion scoring . . . . . . . . . . . . . . . . . . . . . . . . . . . . . . .
33Table 35 Load scoring at 1 lift every 30 minutes . . . . . . . . . . . . . . . . . . . . . . . . . . . . .
32Table 34 Load scoring at 1 lift every minute . . . . . . . . . . . . . . . . . . . . . . . . . . . . . . . .
Crown Copyright 2002
(v)
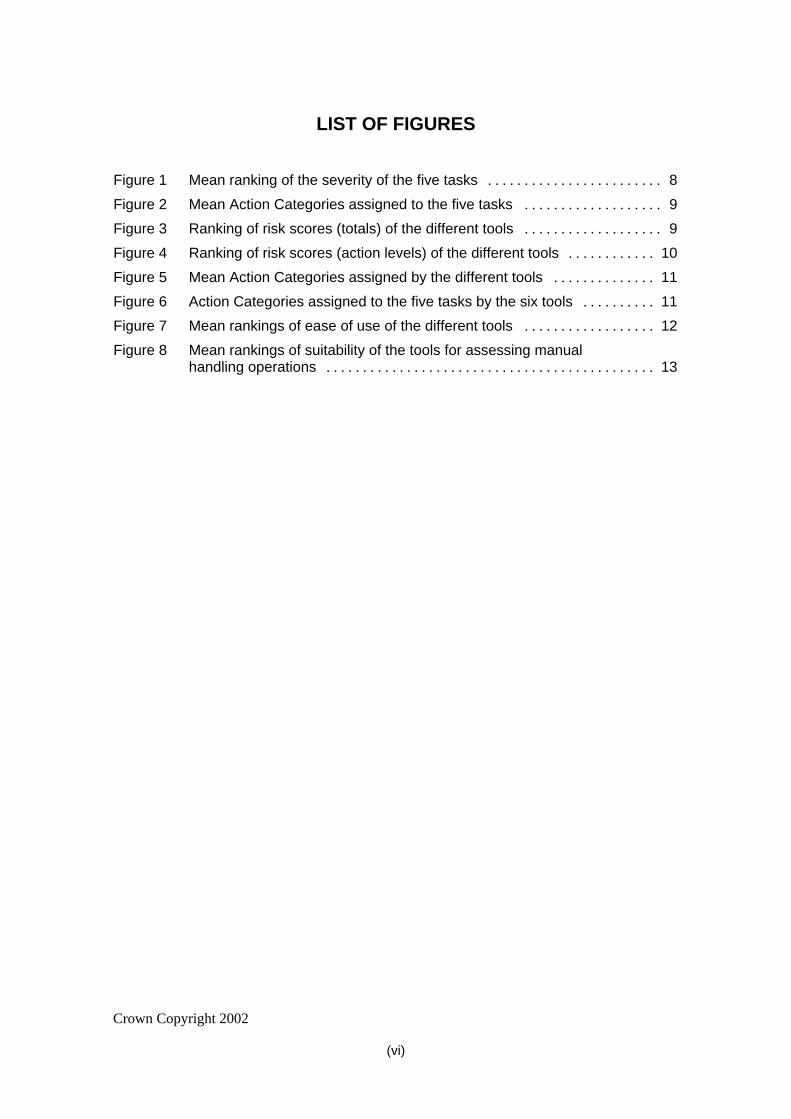
LIST OF FIGURES
13Figure 8 Mean rankings of suitability of the tools for assessing manual
handling operations . . . . . . . . . . . . . . . . . . . . . . . . . . . . . . . . . . . . . . . . . . . . .
12Figure 7 Mean rankings of ease of use of the different tools . . . . . . . . . . . . . . . . . .
11Figure 6 Action Categories assigned to the five tasks by the six tools . . . . . . . . . .
11Figure 5 Mean Action Categories assigned by the different tools . . . . . . . . . . . . . .
10Figure 4 Ranking of risk scores (action levels) of the different tools . . . . . . . . . . . .
9Figure 3 Ranking of risk scores (totals) of the different tools . . . . . . . . . . . . . . . . . . .
9Figure 2 Mean Action Categories assigned to the five tasks . . . . . . . . . . . . . . . . . . .
8Figure 1 Mean ranking of the severity of the five tasks . . . . . . . . . . . . . . . . . . . . . . . .
Crown Copyright 2002
(vi)

EXECUTIVE SUMMARY
OBJECTIVES
To benchmark the Manual handling Assessment Charts (MAC) developed by HSL/HSE againstexisting tools used for risk assessment of manual handling operations. The Quick ExposureCheck (QEC), Rapid Entire Body Assessment (REBA), Ovako Working posture AnalysisSystem (OWAS) and the 1991 NIOSH lifting equation were used.
MAIN FINDINGS
(1) Measuring exposure to musculoskeletal risk factors is both conceptually and practicallycomplex and a wide variety of methods of assessing risk from manual handling have beendeveloped and described in the scientific literature. Most of these risk assessment toolsrely on snapshot assessments of single postures, often those believed to be hazardous orproblematic. Time-sampling and weighting of measurements are possible but time-consuming and offer further difficulties in interpretation.
(2) There are clear links between the methods reviewed, with concepts and scoring systemsfrom previous methods being reused, often in modified forms, in later methods. The statusof the different tools is variable, with further work on the QEC still underway. Theamount of validation of any form on any of the tools is still quite small and none have beenformally validated as predictors of risk of injury or sickness absence.
(3) A benchmarking exercise was carried out by a small number of ergonomists who used fiverisk assessment tools to assess five tasks. The MAC was ranked as one of the easiest touse and one of the most appropriate methods for assessing manual handling operations.There were no systematic differences in how the different methods ranked the levels of riskof the tasks studied but the way that the severity of tasks was ranked was random. Thetools appear to be assessing risk in different ways and so cannot be compared easily.
(4) The conceptual model on which the MAC is based assumes that risk values due to separatefactors can be added and that there are no interactions between the factors except for loadand frequency of handling. OWAS, REBA and the QEC use ordinal scoring systems andthen combine the scores for different risk factors. OWAS and REBA were designed toproduce an assessment of the urgency of remedial action for the task being assessed using“Action Categories”.
(5) The QEC has an exact mathematical model implicit in its structure. Recently, ActionLevels have been proposed based on the total score across all parts of the body. Theadoption of this approach is unfortunate because it confuses risk across different parts ofthe body.
(6) The 1991 NIOSH lifting equation is based on a parametric multiplicative model of riskrelative to a reference load of 23 kg lifted under ideal circumstances. The focus is the tasknot the posture of the individual. It is possible to convert the NIOSH equation into anadditive model but the form is quite different to those underlying the MAC and the QECdue to it calculating a relative risk. Both additive and multiplicative models are theoreti-cally valid approaches to the issue of assessing risk of manual handling. However, the lackof epidemiological validation means that the accuracy of the scoring systems is unknown.The MAC seeks to assess when an individual risk factor is beyond safe limits without
Crown Copyright 2002
(vii)
attempting to assign an overall risk level to the whole task and is therefore a much sounderbasis for risk assessment than methods that seek to assess the overall risk since any real jobis likely to contain several independent risks.
(7) There is therefore a clear need for risk assessment tools to distinguish between risk to thelow-back and risks to the upper limbs. Both REBA and the QEC are flawed because theycreate overall scores from a mixture of risk factors specific to the upper limb and specificto the low back. The MAC is focussed on the risk of injury to the low back from manualhandling and does not attempt to score risk to the upper limb.
RECOMMENDATIONS
HSL is currently running a longitudinal study to test the ability of the NIOSH equation topredict work absence due to low back pain caused by workplace lifting operations. Once thisproject has been completed the data collected should be used to test the ability of the MAC topredict this outcome.
Crown Copyright 2002
(viii)
1 INTRODUCTION
1.1 BACKGROUND
Prevention and control of work related musculoskeletal disorders (WRMSDs) is one of theHealth and Safety Commission’s (HSC) priorities. Success in this area is vital if the targets inSecuring Health Together (HSC, 2000) of reducing by 2010 the incidence of work-related illhealth by 20% and reducing the number of work days lost due to work-related ill health by 30%.
Health and Safety Executive (HSE) and local authority inspectors enforce health and safety law,and provide advice on risk factors and control measures on a wide range of health and safetyissues. Therefore, they need to be able to quickly identify high risk activities likely to causeWRMSDs. However, it can be particularly difficult to establish the degree of risk in relation toWRMSD because of the lack of quantitative exposure-response relationships, the wide range ofrisk factors, and the interactions between them.
Risk assessment is fundamental to the hierarchy of controls specified in the 1992 ManualHandling Operations Regulations. Therefore, a concern of HSE is to ensure that suitable andsufficient methods of risk assessment are available for duty holders to use. As an enforcingauthority, HSE has to provide guidance for its field professionals in determining whether aparticular work activity, such as a manual handling operation, poses a significant risk of injuryto the workers performing it.
1.2 AIMS AND OBJECTIVES
The Ergonomics Section of HSL has worked on behalf of, and in co-operation with, the HumanFactors Unit of HSE’s Health Directorate, and with other Divisions and Directorates withinHSE, to develop a risk assessment tool for HSE inspectors to use when inspecting premiseswhere manual handling operations are carried out by the workforce.
The tool is known as the Manual handling Assessment Charts (MAC). It focuses on manualhandling operations involving lifting by individuals, lifting by teams of up to four people, andcarrying by individuals. Monnington et al. (2002) reported the development of the tool from itsinitial conceptualisation up to its formal release to HSE inspectors in November 2002. Testingof the usability of the tool is reported by Care et al. (2002); testing of the reliability is reportedby Tapley (2002).
The purpose of this document is to report an exercise undertaken to benchmark the MAC bycomparing it with existing tools used for risk assessment of manual handling operations.
1
2 EXTANT TOOLS FOR ASSESSING RISK OFWORK-RELATED MUSCULOSKELETAL DISORDERS
Tables 1 and 2 summarise a number published methods of assessing risk of WMSDs for manualhandling operations.
2.1 THE HSL/HSE MAC
These are the flowcharts being benchmarked in this study. Attention is focussed primarily onthe Lifting flowchart, but many of the factors in the Team Handling and Carrying flowchart arecommon to it.
2.2 THE 1991 NIOSH REVISED LIFTING EQUATION
This is a revision of the 1981 NIOSH Lifting Equation. It was developed by the NationalInstitute of Occupational Safety and Health in the USA. It is a multiplicative equation that usesparameters of the job to predict a Recommended Weight Limit which is believed to be safe formost workers to handle (Waters et al., 1994, NIOSH 1981).
2.3 THE QUICK EXPOSURE CHECK (QEC)
This was developed by the Robens Institute at the University of Surrey with funding from HSE.Its purpose is to be a user friendly practical tool for the assessment of physical exposure to risksfor work-related musculoskeletal disorders (Li and Buckle, 1999).
2.4 RAPID ENTIRE BODY ASSESSMENT (REBA)
This was developed as a postural analysis tool to be sensitive to the type of unpredictableworking postures found in health care and other service industries (Hignett and McAtamney,2000). Its approach and scoring system are clearly based on RULA (Rapid Upper LimbAssessment) (McAtamney and Corlett, 1993).
2.5 SNOOK PSYCHOPHYSICAL TABLES
These are tables of maximum acceptable weights and forces for a variety of manual handlingoperations, including lifting, lowering, pushing and pulling. They are based on extensiveexperiments using industrial workers adjusting the loads being handled until they had selectedloads that they considered they could handle for the duration of a work shift without excessivestrain or fatigue (Snook and Ciriello, 1991; Snook, 1978).
2.6 2D AND 3D SSPP
These are two-dimensional and three-dimensional linked segment models of the human bodythat can be used to predict the percentage of the industrial population that can exert a specifiedforce at the hands in a specified static posture (Chaffin, 1969; Garg and Chaffin, 1975; Chaffinet al., 1987; Chaffin, 1988; Chaffin and Erig, 1991).
2.7 OWAS
This is a method of coding the posture of a worker that allows the harmfulness of the posture tobe categorised into four Action Categories of increasing urgency. It is based upon expert
2

judgements of the harmfulness of particular postures. A time-based sampling approach can beused with it so that the categorisation can take account of the length of time spent in anyparticular posture (Karhu et al., 1977, 1981, Kivi and Mattila, 1991, Vedder, 1998).
2.8 PEO
This is a method of continuously recording postures and manual handling operations in realtime on a portable computer. It allows durations and numbers of manual handling operationsand occurrences of particular postures to be calculated. The aim is to produce an estimate of thetypical weekly exposure to physical stress from manual handling and posture (Fransson-Hall etal., 1995; Karlqvist, 1994; Leskinen, 1997).
2.9 PLIBEL
This is a “method for the identification of musculoskeletal stress factors that may have injuriouseffects”. It consists of a checklist designed to help experienced observers with screeningworkplaces for risk factors. Hazards are linked to five body areas (Kemmlert, 1995).
2.10 RODGERS’ JOB ANALYSIS
This is a method of evaluating the physiological demands of a task against published criteria ofacceptable levels of oxygen consumption for whole body or upper body work (Rodgers, 1997;Rodgers and Yates, 1990; Rodgers, 1978).
3

Table 1 Extant manual handling risk assessment tools (a)
NoYesYesNoNoFactor interactions
NA4 categoriesNANALeg posture/actions
NA3 categories2 categoriesNANAHand/wrist posture
NA2 categoriesNANAForearm posture
NA6 categories3 categoriesNACombined withhorizontal reach
Upper arm posture
NA2 categoriesCombined withtrunk flexion
Task asymmetryTrunk twisting /sideways bending
Trunk asymmetry
NA4 categories3 categoriesNACombined withhorizontal reach
Trunk flexion
NA4 categories3 categoriesNANANeck rotation
NA2 categories (3 withlateral flexion)
3 categoriesNANANeck flexion
NANA4 categoriesNA3 categoriesOther environ-mental factors
NANANANA3 categoriesFloor surface
NA4 categoriesNA3 categories3 categoriesQuality of grip
No2 categories3 categoriesYesNoDuration/recovery
Lifts per minute2 categories3 categoriesLifts per minuteLifts per minuteFrequency
YesNANANANAObject size
YesNANAYesNoDistance of lift
3 object depthsNANAYesYesHorizontal handdistance
NoNANAYesNoEnd height of lift
3 rangesNA3 categoriesYes5 categoriesStart height of lift
Yes4 categories4 categoriesYesYesLoad/force
TaskPosturePostureTaskTask, posture,environment
Assessment
One-offOne-offOne-offOne-offOne offSampling
Lift, lower, push,pull, carry
Health care tasksAllLifting, loweringLift, carry, team liftTypes of MHO
N/AWMSDsWMSDsL5/S1Low backInjury focus
OwnNoneNoneSnook, Garg, HerrinSnookUnderlying data
YesNoSemiYesSemiQuantitative?
Weight acceptable toworkforce %age
Ordinal codesSum of scoresMultiplicativeAdditiveOutput type
MaximumAcceptable Weightof Lift (MAWL)
Action LevelsAction LevelsLifting IndexRisk scoreOutput
1977, 1991200019991981, 19912002Date
Snook psycho-physical tables
REBAQECNIOSHMAC
4

Table 2 Extant manual handling risk assessment tools (b)
?NoYesNoNoFactor interactions
NA4 categories2 categories7 categoriesNALeg posture/actions
NA2 categories3 categories relatedto shoulder height
3 categories relatedto shoulder height
NAHand/wrist posture
NANANANANAForearm posture
NANANANANAUpper arm posture
NA3 categories2 categories2 categories (3 withtrunk flexion)
No (2D) Yes (3D)Trunk asymmetry
NA3 categories3 categories2 categories (3 withtrunk rotation)
YesTrunk flexion
NA3 categories2 categoriesNANANeck rotation
NA3 categories2 categoriesNANANeck flexion
TemperatureSpace, toolsNANANAOther environ-mental factors
NA2 categoriesNANANAFloor surface
NA2 categoriesNANANAQuality of grip
YesNAYesNANADuration/recovery
Lifts/minNAYesNANAFrequency
NANANANANAObject size
NANANANANADistance of lift
NA2 categoriesNANAYesHorizontal handdistance
Back vs. arm work3 categoriesNANANAEnd height of lift
Back vs. arm work3 categoriesNANAYesStart height of lift
NA2 categories4 categories3 categoriesMeasuredLoad/force
VO2PosturePosture/forcePosture/loadStrengthAssessment
Representativeperiod
One-offContinuousTime lapse orcontinuous
One-offSampling
Dynamic wholebody
AllAllAllStatic sagittal planeand 3D exertions
Types of MHO
Whole body fatigueWhole body in 5regions
Musculoskeletalsystem
Range of jointsInjury focus
Astrand, Rodhal,Rodgers
AETNoneNoneChaffinUnderlying data
YesNoNoNoYesQuantitative?
MeasuredDichotomousNAOrdinal codesPredictionOutput type
Rate of oxygenconsumption (VO2)
ChecklistNo single metricAction Categories% capableOutput
1960-19971995 (1986)199519771969-1991Date
Rodgers JobAnalysis
PLIBELPEOOWAS2D and 3D SSPP
5

3 BENCHMARKING OF THE MAC
3.1 APPROACH ADOPTED
A small number of the existing assessment methods listed in Tables 1 and 2 were selected fordetailed comparison with the MAC. These were:
The Quick Exposure Check (QEC)
Rapid Entire Body Assessment (REBA)
Ovako Working posture Analysis System (OWAS)
The 1991 NIOSH Revised Lifting Equation
A small number of ergonomists experienced in assessing industrial manual handling tasks usedthe five methods to assess five single-person manual handling tasks (Table 3). This was doneusing video clips to ensure that the information presented to each expert was consistent.Information was given on weights and frequencies and durations of handling where these couldnot be observed from the video.
Table 3 Tasks used for benchmarking of the risk assessment tools
20 kgLoading wire bobbins onto machineE
15 kgPicking of cases from pallets onto conveyorD
25 kgPicking of cases from pallets onto conveyorC
15 kgRemoval of welded mesh from machine and transfer to stackB
50 kgTransfer of compost bale, slicing packaging and tipping into hopperA
WeightDescriptionTask
They firstly used a four-point scale give a personal expert opinion of the severity of the risk ofinjury from the manual lifting operations/need for action to reduce it:
(a) No action required
(b) Action required in the near future
(c) Action required as soon as possible
(d) Action required immediately
They then scored each of the tasks using the different manual handling risk assessment tools.
Finally, they were asked to rank the five risk assessment methods for:
(a) Ease of use
(b) Suitability
6
3.2 ANALYSIS OF RESULTS OF TASK ASSESSMENTS
With the inclusion of the Expert Opinions of each task, six assessments were made of each task.Of these, REBA and the QEC arrive at a score which is then converted into a recommendationfor action. This is done on a four- (QEC) or five-point (REBA) ordinal scale, based on thatoriginally used by OWAS. This has the effect of reducing the variability of the scores andtherefore of introducing more ties into a ranking system. The QEC total scores were convertedinto Action Levels using score boundaries recommended by Li (2002b).
Table 4 Types of output from the different risk assessment tools
Ratioscale
Ordinal 4point scale
Ordinal 5point scale
Ordinalscale
Ordinal 4point scale
Integerscale
Ordinalintegerscale
Ordinal 4point scale
Scaletype
ActionLevel
ScoreActionLevel
Total
NIOSHLiftingIndex
OWASActionCategory
REBAQECMAC TotalExpertopinion
Direct comparison of the “raw” scores provided by the different tools was not possible due tothe different types of data returned by the tools (see Table 4 for data types). Therefore, thenon-parametric Friedman test was used for statistical analysis. This compares the rank orders ofthe scores using the R2 statistic.
Because four of the tools (Expert Opinion, QEC Action Level, REBA Action Level, OWASAction Category) were scored using what was effectively the same four-point ordinal scale ofurgency of action that originated with OWAS, it was decided to facilitate comparison byconverting the MAC scores and the NIOSH Lifting Indices into four point scores described asthe MAC Action Category and the NIOSH LI Action Category. This was done using the rangesin Table 5. It was also decided to use the generic term ‘Action Categories’ (AC) to describeboth Action Levels (QEC and REBA) and Action Categories (OWAS, Expert opinion, MACand NIOSH). The REBA Action Levels of 0 and 1 were combined into Action Level 1 sinceAction Levels of 0 can occur in only very few circumstances.
Table 5 Action Category boundaries for the MAC and NIOSH
6 ñ LI21 ñ MAC total ñ 31Action required immediately4
3 ñ LI < 613 ñ MAC total ñ 20Action required soon3
1 ñ LI < 35 ñ MAC total ñ 12Action required in the near future2
0 ñ LI < 10 ñ MAC total ñ 4No action required1
NIOSH LI ACMAC ACMeaningAction Category
While it was possible to define the NIOSH LI AC in relation to the NIOSH (1981) Action Limit(AL) (LI = 1) and Maximum Permissible Limit (MPL) (MPL = 3 × AL: LI = 3), an arbitrarydecision had to be made as to the boundary between the third and fourth Action Categories.With the MAC, all the boundaries between Action Categories are somewhat arbitrary but werechosen to allow a task with only one amber score to fall into Category 1 and equal sizes toAction Categories 2 and 3.
7
3.3 RESULTS OF BENCHMARKING BY EXPERTS
Four ergonomists completed the exercise to compare the five tools. After validation of the datathey were entered into a spreadsheet. It was noted that there were wide discrepancies betweenthe scores recorded by the different individuals. This was partly attributed to a lack of directexperience of some of the tools and to the difficulty of assessing tasks from a short video clip.
3.3.1 Comparison of severity of the five tasks
Task B Task A Task E Task C Task D1
2
3
4
5
Mea
n ra
nkin
g (1
= le
ast s
ever
e)
Risk Scores Action Categories
Figure 1 Mean ranking of the severity of the five tasks
In order to provide background information on the benchmarking exercise the severities of thefive tasks were examined by comparing, across the tasks, the mean rankings of the risk scoresand the Action Categories using the Friedman test. The results are shown graphically in Figure1. For the comparison of the risk scores, R2 = 6.3 (N = 6, C = 5), P > 0.05. However, theconversion to Action Categories increased R2 to 9.067, P = 0.05 which is therefore on theborder of significance. It appears from Figure 2 that this is due to Task B being ranked as theleast severe task while the differences between the rankings of the other tasks are much smaller.The actual mean Action Categories for the five tasks are shown in Figure 2. The mean AC forTask B was 2.5 and the means for the other four tasks ranged between 3.0 and 3.3. Thus Task Bwas seen as being midway between needing action at some point and action soon and the otherfour tasks were seen as needing action more urgently than soon but not instantly.
8
Task B Task A Task C Task E Task D1
2
3
4M
ean
Act
ion
Cat
egor
y
Figure 2 Mean Action Categories assigned to the five tasks
3.3.2 Assessment of raw risk scores
Figures 3 and 4 show how the different tools ranked the different tasks, averaged across the fourexperts. Figure 3 uses the QEC total and the REBA score whereas Figure 4 uses the QEC ALand the REBA AL.
Expert OpinionMAC total
QEC TotalREBA Score
OWAS ACNIOSH LI
1
2
3
4
5
Mea
n ra
nkin
g (1
= le
ast s
ever
e)
Task A Task B Task C Task D Task E
Figure 3 Ranking of risk scores (totals) of the different tools
9

Expert OpinionMAC total
QEC Action LevelREBA Action Level
OWAS ACNIOSH LI
1
2
3
4
5M
ean
rank
ing
(1 =
leas
t sev
ere)
Task A Task B Task C Task D Task E
Figure 4 Ranking of risk scores (action levels) of the different tools
As can be seen, there are no systematic patterns in these charts. This random variation isreflected in the values of R2 of 8.4 and 5.4 respectively (both N = 6, C = 5), P > 0.05, obtainedfrom the Friedman test. Therefore, the lack of significant differences between how the toolsrank the severity of the tasks reflects the variation in the scoring systems of the different riskassessment tools used. It is also clear that the effect of converting the QEC total and the REBAscore to their respective Action Levels is to reduce the ability of those tools to rank tasks sincemuch of the variation between the scores given to the tasks has been removed. Therefore, theprinciple of using both scores should be adopted both to permit detailed ranking of the taskswhile still providing an overall indication of the urgency of action.
3.3.3 Comparison of the different tools
Because the NIOSH LI values and the MAC scores were converted into Action Categories itbecame possible to compare all six assessment methods on the same four point ordinal scale.The mean of the Action Categories assigned by each tool after averaging across both the fourexperts and the five tasks are shown in Figure 5.
Analysis with the Friedman test gave a R2 value of 7.3 (N = 6, C = 5), P > 0.05 when thescores from each tool were ranked across the tasks. In other words, the tools did not producesignificantly different Action Categories.
10

Expert OpinionMAC AC
REBA ALOWAS AC
NIOSH LI ACQEC AL
1
2
3
4M
ean
Act
ion
Cat
egor
y
Figure 5 Mean Action Categories assigned by the different tools
Figure 6 shows how the different tools individually assigned Action Categories to the five tasks,averaged over the four experts. The Friedman test gave R2 = 10.0 (N = 5, C = 6), P > 0.05when the scores from each task were ranked across the tools. This means that there were nostatistically significant differences in the way that the different tools assigned Action Categoriesto the tasks.
Expert OpinionMAC AC
QEC ALREBA AL
OWAS ACNIOSH LI AC
1
2
3
4
Mea
n A
ctio
n C
ateg
ory
Task A Task B Task C Task D Task E
Figure 6 Action Categories assigned to the five tasks by the six tools
Effectively, therefore, the sequence of severity of tasks within each tool was random. Theimplication is that the tools are assessing risk in different ways and are therefore not directlycomparable. In interpreting these results it must be recalled that arbitrary boundaries were
11
chosen for the MAC and NIOSH LI Acs. It is possible that if different boundaries had beenchosen that different results would have been obtained. However, because of the variation inthe scores from the other tools this would be unlikely to have a major effect.
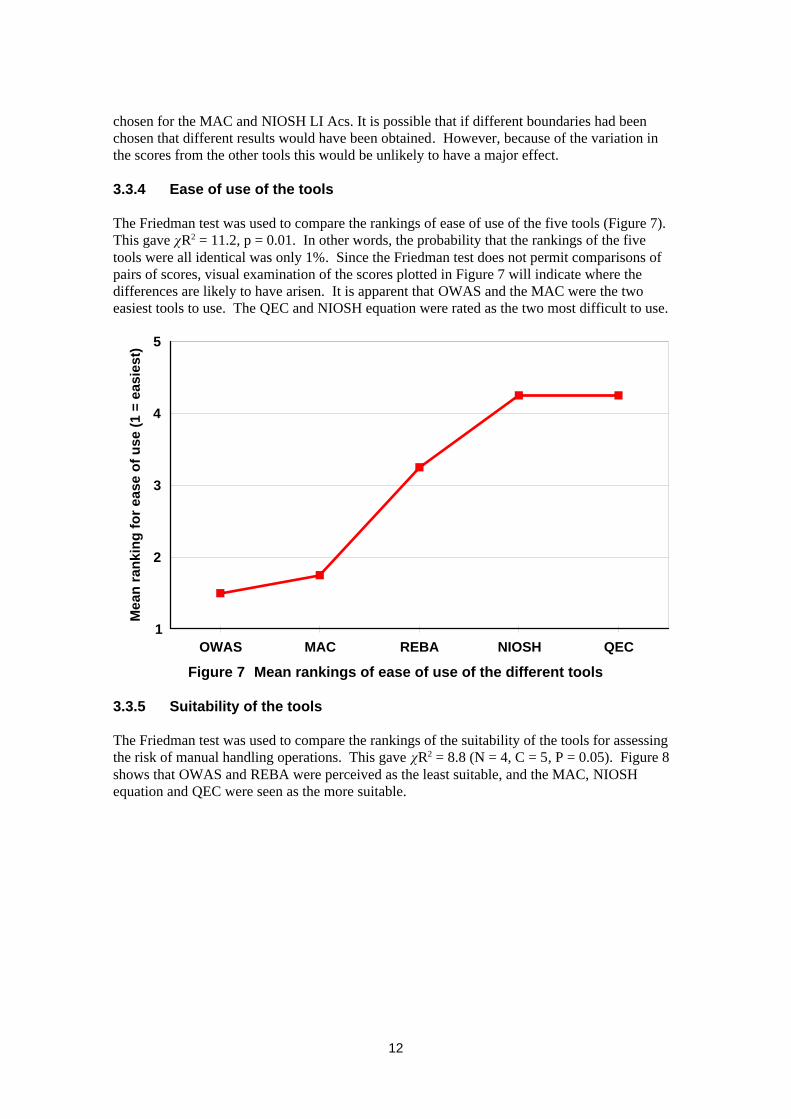
3.3.4 Ease of use of the tools
The Friedman test was used to compare the rankings of ease of use of the five tools (Figure 7).This gave R2 = 11.2, p = 0.01. In other words, the probability that the rankings of the fivetools were all identical was only 1%. Since the Friedman test does not permit comparisons ofpairs of scores, visual examination of the scores plotted in Figure 7 will indicate where thedifferences are likely to have arisen. It is apparent that OWAS and the MAC were the twoeasiest tools to use. The QEC and NIOSH equation were rated as the two most difficult to use.
OWAS MAC REBA NIOSH QEC1
2
3
4
5
Mea
n ra
nkin
g fo
r eas
e of
use
(1 =
eas
iest
)
Figure 7 Mean rankings of ease of use of the different tools
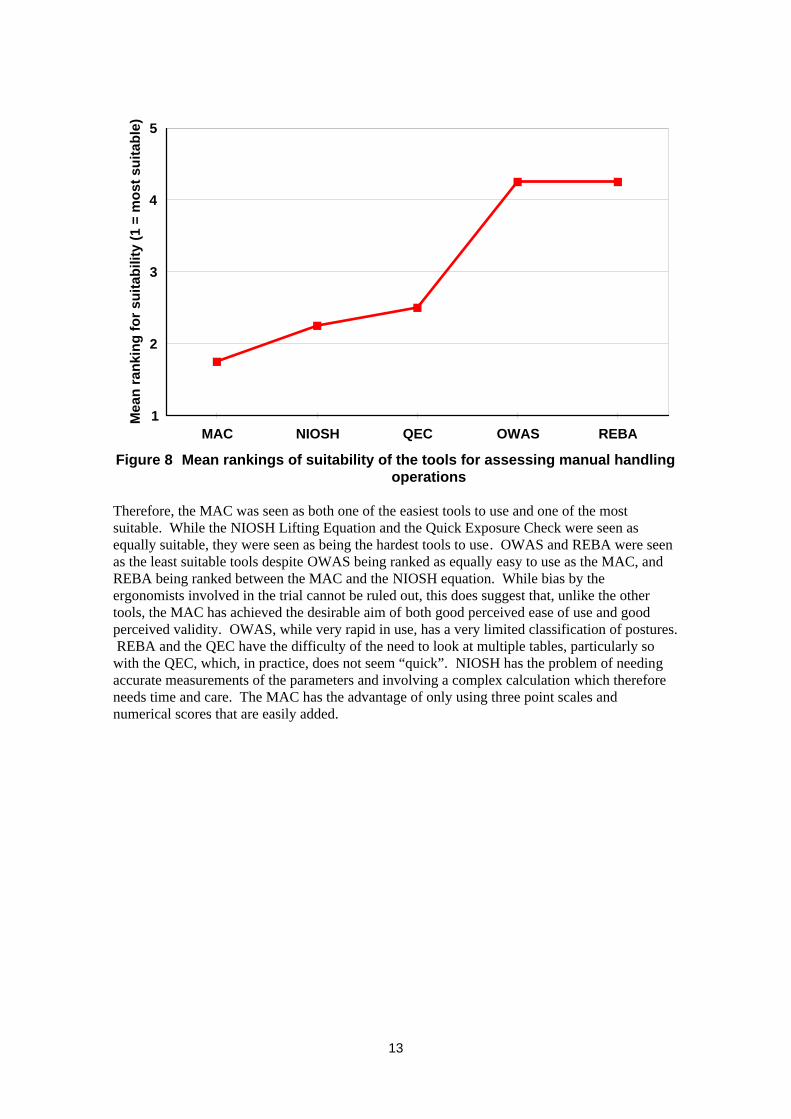
3.3.5 Suitability of the tools
The Friedman test was used to compare the rankings of the suitability of the tools for assessingthe risk of manual handling operations. This gave R2 = 8.8 (N = 4, C = 5, P = 0.05). Figure 8shows that OWAS and REBA were perceived as the least suitable, and the MAC, NIOSHequation and QEC were seen as the more suitable.
12
MAC NIOSH QEC OWAS REBA1
2
3
4
5M
ean
rank
ing
for s
uita
bilit
y (1
= m
ost s
uita
ble)
Figure 8 Mean rankings of suitability of the tools for assessing manual handlingoperations
Therefore, the MAC was seen as both one of the easiest tools to use and one of the mostsuitable. While the NIOSH Lifting Equation and the Quick Exposure Check were seen asequally suitable, they were seen as being the hardest tools to use. OWAS and REBA were seenas the least suitable tools despite OWAS being ranked as equally easy to use as the MAC, andREBA being ranked between the MAC and the NIOSH equation. While bias by theergonomists involved in the trial cannot be ruled out, this does suggest that, unlike the othertools, the MAC has achieved the desirable aim of both good perceived ease of use and goodperceived validity. OWAS, while very rapid in use, has a very limited classification of postures. REBA and the QEC have the difficulty of the need to look at multiple tables, particularly sowith the QEC, which, in practice, does not seem “quick”. NIOSH has the problem of needingaccurate measurements of the parameters and involving a complex calculation which thereforeneeds time and care. The MAC has the advantage of only using three point scales andnumerical scores that are easily added.
13

4 MODELS UNDERLYING MANUAL HANDLING RISKASSESSMENT TOOLS
4.1 INTRODUCTION
Analysis was carried out of the scoring systems of the five tools to identify underlyingassumptions and mathematical models.
4.2 THE HSE MANUAL HANDLING ASSESSMENT CHARTS (MAC)
Underlying the MAC is the assumption that the risk of MSDs from manual handling can bequantified using an additive model. In other words, a value representing risk due to handdistance from the load can be added to the risk from the weight and frequency of handling togive a combined risk score for the two risk factors. Clearly this can be extended for as manyfactors as are believed to be relevant and it is, of course, impossible to take into account allpossible risk factors so there will always be risk that is unattributed as well as the inevitableerror term in the model.
A mathematical representation is as follows:
(1) Risk score = True risk - Unattributed risk - Error
(2) Risk score = Load×frequency risk + hand distance risk + lift zone risk + trunkasymmetry risk + postural constraints risk + grip on load risk + floorsurface risk + environmental factors risk
Symbolically, these equations can be written as:
(3) R’TASK = RTASK - RU - e
(4) R’TASK = RLF + RH + RLZ + RA + RP + RG +RF + RE
Therefore, the True Risk can be expressed as:
(5) RTASK = R’TASK + RU + e
or
(6) RTASK = RLF + RH + RLZ + RA + RP + RG +RF + RE + RU + e
The units of risk are unspecified. Suitable units would be a measure of pain incidence, ameasure of the rate that work days are lost, or a measure of the incidence of manual handlingaccidents. For the equation to be dimensionally correct, the units of each term must be thesame.
It is also implicit that, apart from the load/frequency interaction, there are no interactionsbetween risk factors. In other words, for example, there is assumed to be no interaction betweenthe risk due to the horizontal reach and the risk due to trunk asymmetry. Therefore, whilehandling with a bent trunk due to a large reach and with a twisted trunk are both risk factors, thecombination of bending and twisting while worse than bending or twisting on their own, doesnot increase the risk disproportionately.
14
The current system of scoring the MAC provides different weightings to the risk factors. Thusgreater weight (6) is given to a Red load/frequency combination than to a Red lifting zone (3).While these weightings are based on expert judgement as to the relative risks of the differentfactors, they are as yet unvalidated against injury data. On the same basis, and as a result of areview of an earlier draft, no attempt has been made to link total scores to recommendations forremedial actions or enforcement action by HSE field professionals except for the purposes ofthe comparisons made in Section 3 of this report.
4.3 THE QUICK EXPOSURE CHECK (QEC)
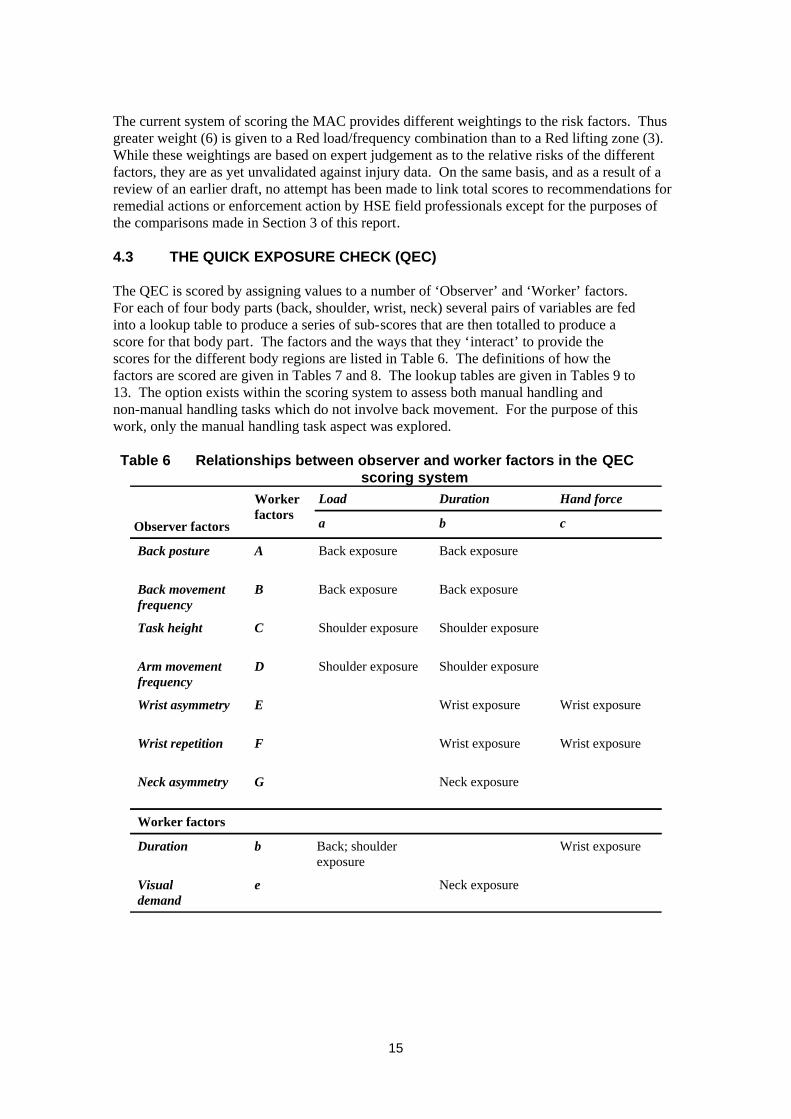
The QEC is scored by assigning values to a number of ‘Observer’ and ‘Worker’ factors.For each of four body parts (back, shoulder, wrist, neck) several pairs of variables are fedinto a lookup table to produce a series of sub-scores that are then totalled to produce ascore for that body part. The factors and the ways that they ‘interact’ to provide thescores for the different body regions are listed in Table 6. The definitions of how thefactors are scored are given in Tables 7 and 8. The lookup tables are given in Tables 9 to13. The option exists within the scoring system to assess both manual handling andnon-manual handling tasks which do not involve back movement. For the purpose of thiswork, only the manual handling task aspect was explored.
Table 6 Relationships between observer and worker factors in the QECscoring system
Neck exposureeVisualdemand
Wrist exposureBack; shoulderexposure
bDuration
Worker factors
Neck exposureGNeck asymmetry
Wrist exposureWrist exposureFWrist repetition
Wrist exposureWrist exposureEWrist asymmetry
Shoulder exposureShoulder exposureDArm movementfrequency
Shoulder exposureShoulder exposureCTask height
Back exposureBack exposureBBack movementfrequency
Back exposureBack exposureABack posture
cba
Hand forceDurationLoadWorkerfactors
Observer factors
15
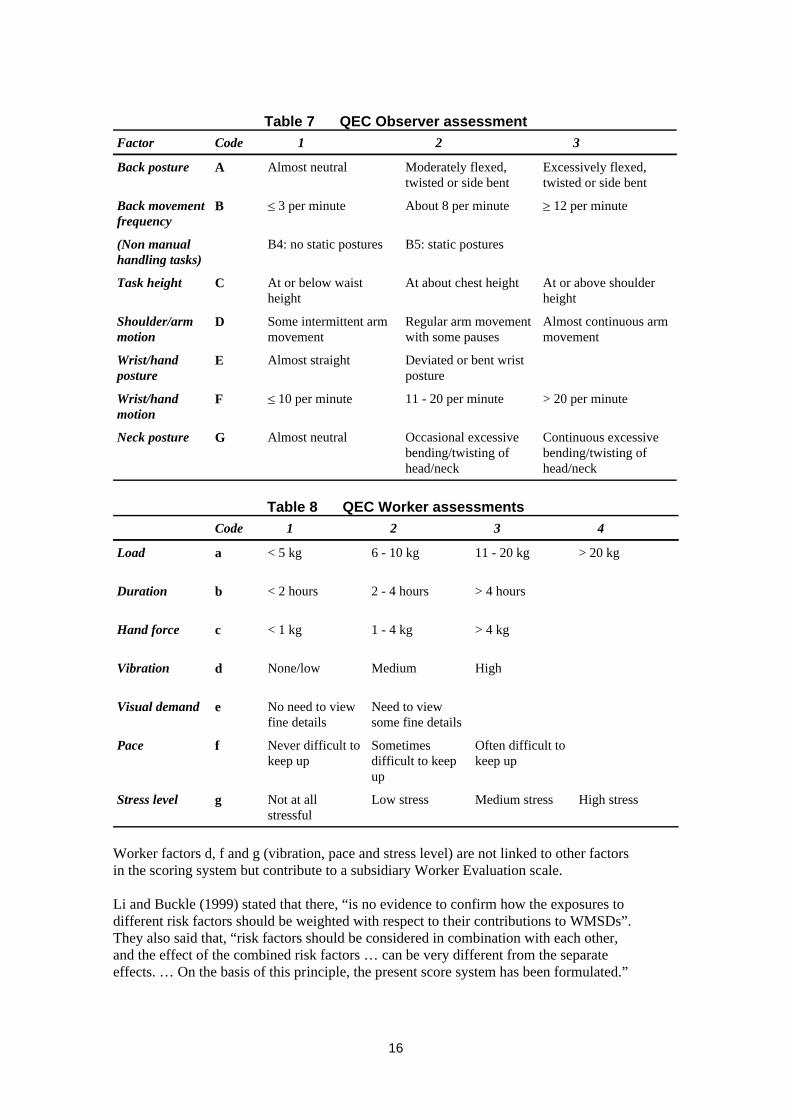
Table 7 QEC Observer assessment
Continuous excessivebending/twisting ofhead/neck
Occasional excessivebending/twisting ofhead/neck
Almost neutralGNeck posture
> 20 per minute11 - 20 per minute[ 10 per minuteFWrist/handmotion
Deviated or bent wristposture
Almost straightEWrist/handposture
Almost continuous armmovement
Regular arm movementwith some pauses
Some intermittent armmovement
DShoulder/armmotion
At or above shoulderheight
At about chest heightAt or below waistheight
CTask height
B5: static posturesB4: no static postures(Non manualhandling tasks)
m 12 per minuteAbout 8 per minute[ 3 per minuteBBack movementfrequency
Excessively flexed,twisted or side bent
Moderately flexed,twisted or side bent
Almost neutralABack posture
321CodeFactor
Table 8 QEC Worker assessments
High stressMedium stressLow stressNot at allstressful
gStress level
Often difficult tokeep up
Sometimesdifficult to keepup
Never difficult tokeep up
fPace
Need to viewsome fine details
No need to viewfine details
eVisual demand
HighMediumNone/lowdVibration
> 4 kg1 - 4 kg< 1 kgcHand force
> 4 hours2 - 4 hours< 2 hoursbDuration
> 20 kg11 - 20 kg6 - 10 kg< 5 kgaLoad
4321Code
Worker factors d, f and g (vibration, pace and stress level) are not linked to other factorsin the scoring system but contribute to a subsidiary Worker Evaluation scale.
Li and Buckle (1999) stated that there, “is no evidence to confirm how the exposures todifferent risk factors should be weighted with respect to their contributions to WMSDs”.They also said that, “risk factors should be considered in combination with each other,and the effect of the combined risk factors … can be very different from the separateeffects. … On the basis of this principle, the present score system has been formulated.”
16
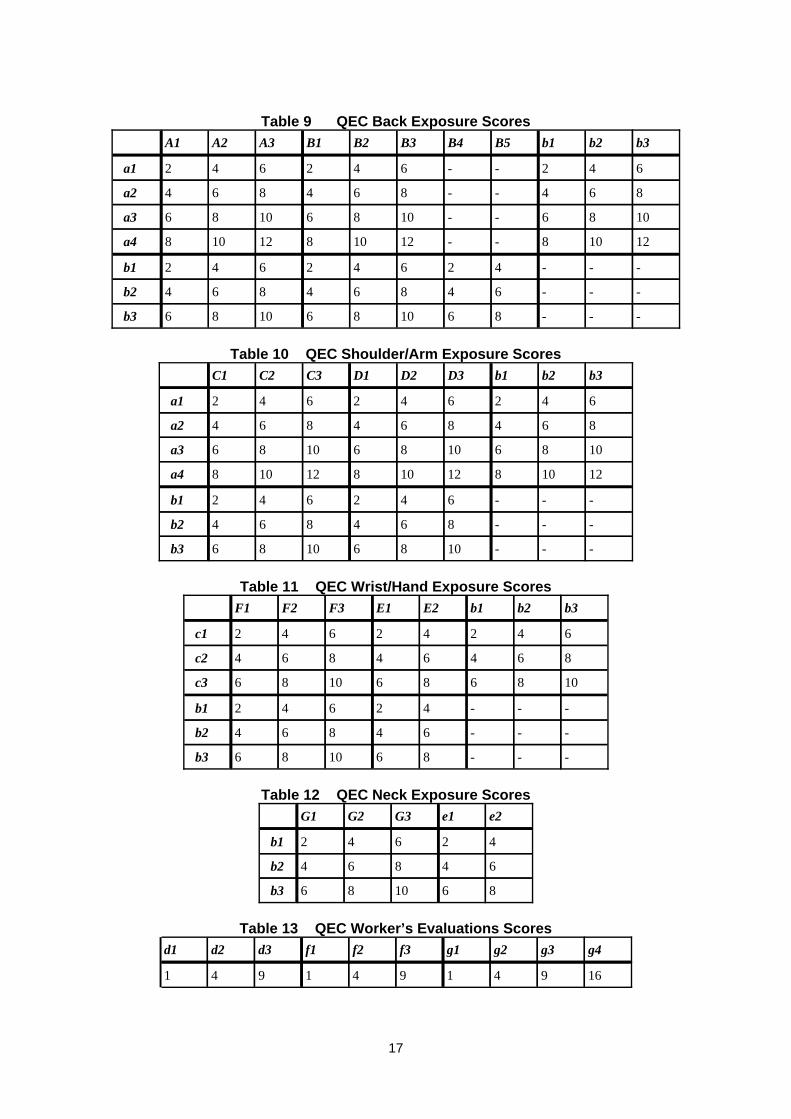
Table 9 QEC Back Exposure Scores
---8610861086b3
---64864864b2
---42642642b1
12108--1210812108a4
1086--10861086a3
864--864864a2
642--642642a1
b3b2b1B5B4B3B2B1A3A2A1
Table 10 QEC Shoulder/Arm Exposure Scores
---10861086b3
---864864b2
---642642b1
121081210812108a4
108610861086a3
864864864a2
642642642a1
b3b2b1D3D2D1C3C2C1
Table 11 QEC Wrist/Hand Exposure Scores
---861086b3
---64864b2
---42642b1
1086861086c3
86464864c2
64242642c1
b3b2b1E2E1F3F2F1
Table 12 QEC Neck Exposure Scores
861086b3
64864b2
42642b1
e2e1G3G2G1
Table 13 QEC Worker’s Evaluations Scores
16941941941
g4g3g2g1f3f2f1d3d2d1
17
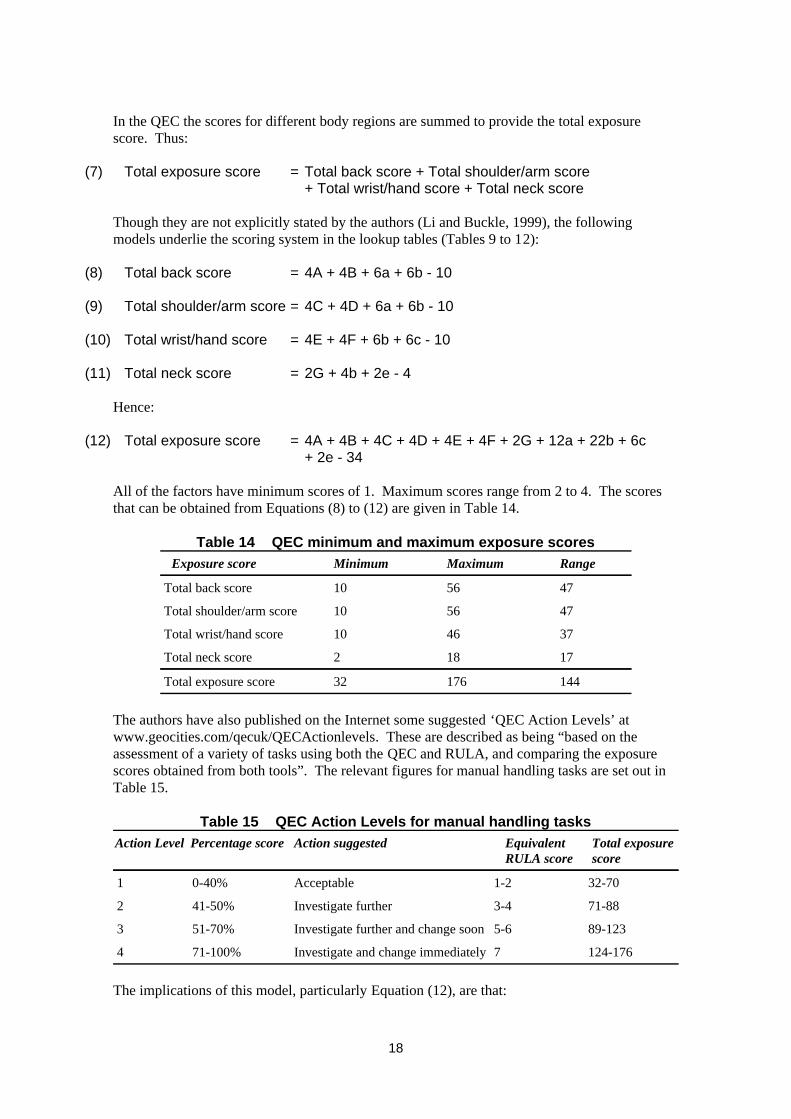
In the QEC the scores for different body regions are summed to provide the total exposurescore. Thus:
(7) Total exposure score = Total back score + Total shoulder/arm score + Total wrist/hand score + Total neck score
Though they are not explicitly stated by the authors (Li and Buckle, 1999), the followingmodels underlie the scoring system in the lookup tables (Tables 9 to 12):
(8) Total back score = 4A + 4B + 6a + 6b - 10
(9) Total shoulder/arm score = 4C + 4D + 6a + 6b - 10
(10) Total wrist/hand score = 4E + 4F + 6b + 6c - 10
(11) Total neck score = 2G + 4b + 2e - 4
Hence:
(12) Total exposure score = 4A + 4B + 4C + 4D + 4E + 4F + 2G + 12a + 22b + 6c + 2e - 34
All of the factors have minimum scores of 1. Maximum scores range from 2 to 4. The scoresthat can be obtained from Equations (8) to (12) are given in Table 14.
Table 14 QEC minimum and maximum exposure scores
14417632Total exposure score
17182Total neck score
374610Total wrist/hand score
475610Total shoulder/arm score
475610Total back score
RangeMaximumMinimumExposure score
The authors have also published on the Internet some suggested ‘QEC Action Levels’ atwww.geocities.com/qecuk/QECActionlevels. These are described as being “based on theassessment of a variety of tasks using both the QEC and RULA, and comparing the exposurescores obtained from both tools”. The relevant figures for manual handling tasks are set out inTable 15.
Table 15 QEC Action Levels for manual handling tasks
124-1767Investigate and change immediately71-100%4
89-1235-6Investigate further and change soon51-70%3
71-883-4Investigate further41-50%2
32-701-2Acceptable0-40%1
Total exposurescore
EquivalentRULA score
Action suggestedPercentage scoreAction Level
The implications of this model, particularly Equation (12), are that:
18
The most crucial factor in the model is duration (b) which contributes to all foursub-scores. A score of 1 is given for a task with a duration of less than 2 hours. Thescore is 2 for a task lasting between 2-4 hours and 3 for a task lasting more than 4 hours.Thus if the duration of an otherwise ideal task is increased from 2 to 4 hours then thetotal score increases from 32 to 54. If it increases to more than 4 hours, the totalincreases to 74, forcing it into Action Level 2.
The second most important factor is the load (a) which contributes to both the back andshoulder/arm score.
The third most important factor is the hand force (c).
The ‘observer factors’: back posture (A), back movement frequency (B), task height(C), arm movement frequency (D), wrist asymmetry (E) and wrist repetition (F) all haveequal weightings, except that neck asymmetry (G) has a lower weighting.
There are no interactions in this model, even though the authors were seeking to create amodel that took into account the effects of combining risk factors. Even though thescores are read from two-way tables, the score due to one factor does not vary with thescore due to another factor. In other words the model is purely additive, and no factorsare multiplied by other factors.
The nature of the model restricts the values that can be obtained from it. In particular,all the scores could be divided by two without affecting the model. Also, the minimumtotal score that can be obtained is 32 so the total range of scores is 144.
The mapping of the total scores onto Action Levels is non-linear and therefore ordinal.
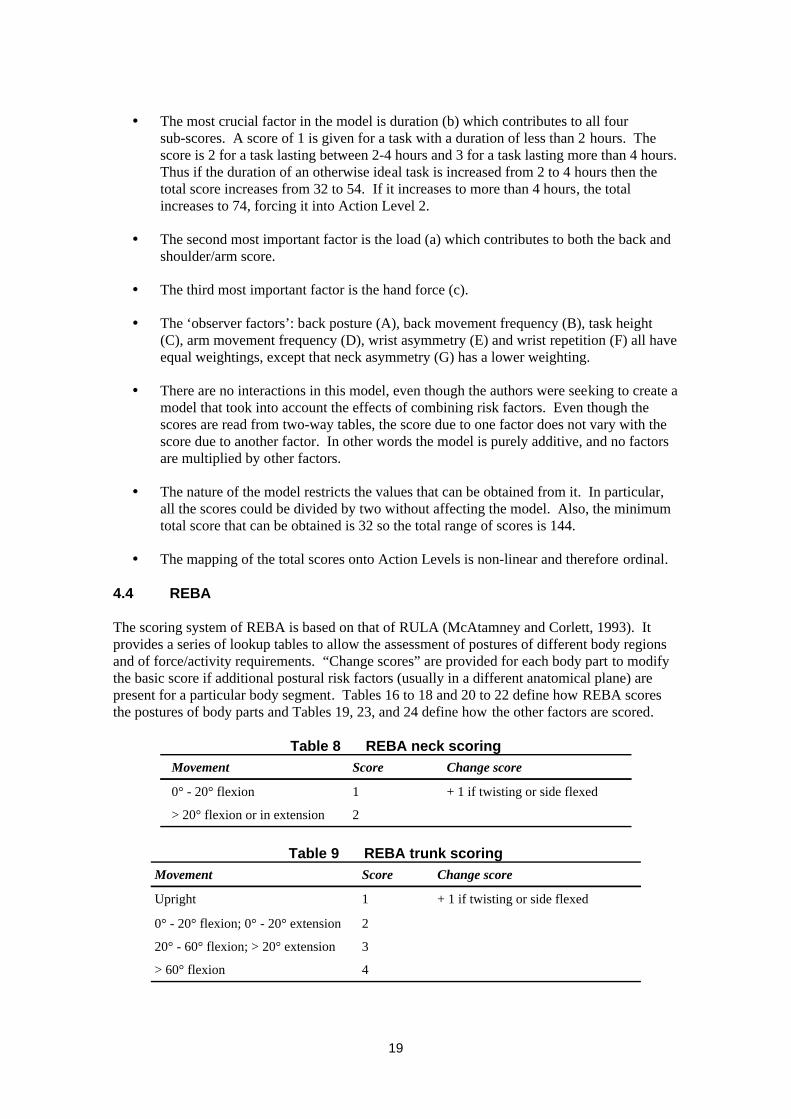
4.4 REBA
The scoring system of REBA is based on that of RULA (McAtamney and Corlett, 1993). Itprovides a series of lookup tables to allow the assessment of postures of different body regionsand of force/activity requirements. “Change scores” are provided for each body part to modifythe basic score if additional postural risk factors (usually in a different anatomical plane) arepresent for a particular body segment. Tables 16 to 18 and 20 to 22 define how REBA scoresthe postures of body parts and Tables 19, 23, and 24 define how the other factors are scored.
Table 8 REBA neck scoring
2> 20° flexion or in extension
+ 1 if twisting or side flexed10° - 20° flexion
Change scoreScoreMovement
Table 9 REBA trunk scoring
4> 60° flexion
320° - 60° flexion; > 20° extension
20° - 20° flexion; 0° - 20° extension
+ 1 if twisting or side flexed1Upright
Change scoreScoreMovement
19
Table 10 REBA legs scoring
+ 2 if knees are > 60° flexion (N.B.,Not for sitting)
2Unilateral weight bearing;Feather weight bearing or anunstable posture
+ 1 if knees between 30° and 60°flexion
1Bilateral weight bearing, walking orsitting
Change scoreScorePosition
Table 11 REBA load/force scoring
2> 10 kg
15 - 10 kg
+1 if shock or rapid build up of forceoccurs
0< 5 kg
Change scoreScoreLoad
Table 12 REBA upper arms scoring
4> 90° flexion
345° - 90° flexion
2> 20° extension; 20° - 45° flexion
+ 1 if arm is abducted and/or rotated+ 1 if shoulder is raised- 1 if leaning, supporting weight of
arm or if posture is gravityassisted
120° extension to 20° flexion
Change scoreScorePosition
Table 13 REBA lower arms scoring
2< 60° flexion or > 100° flexion
160° - 100° flexion
ScoreMovement
Table 14 REBA wrists scoring
2> 15° flexion/extension
+ 1 if wrist is deviated or twisted10° - 15° flexion/extension
Change scoreScoreMovement
Table 15 REBA coupling scoring
Awkward, unsafe grip, no handles. Coupling isunacceptable using other parts of the body
3Unacceptable
Hand hold not acceptable although possible2Poor
Hand hold acceptable but not ideal or coupling isacceptable via another part of the body
1Fair
Well-fitting handle and a mid-range power grasp0Good
DescriptionScoreCoupling
20
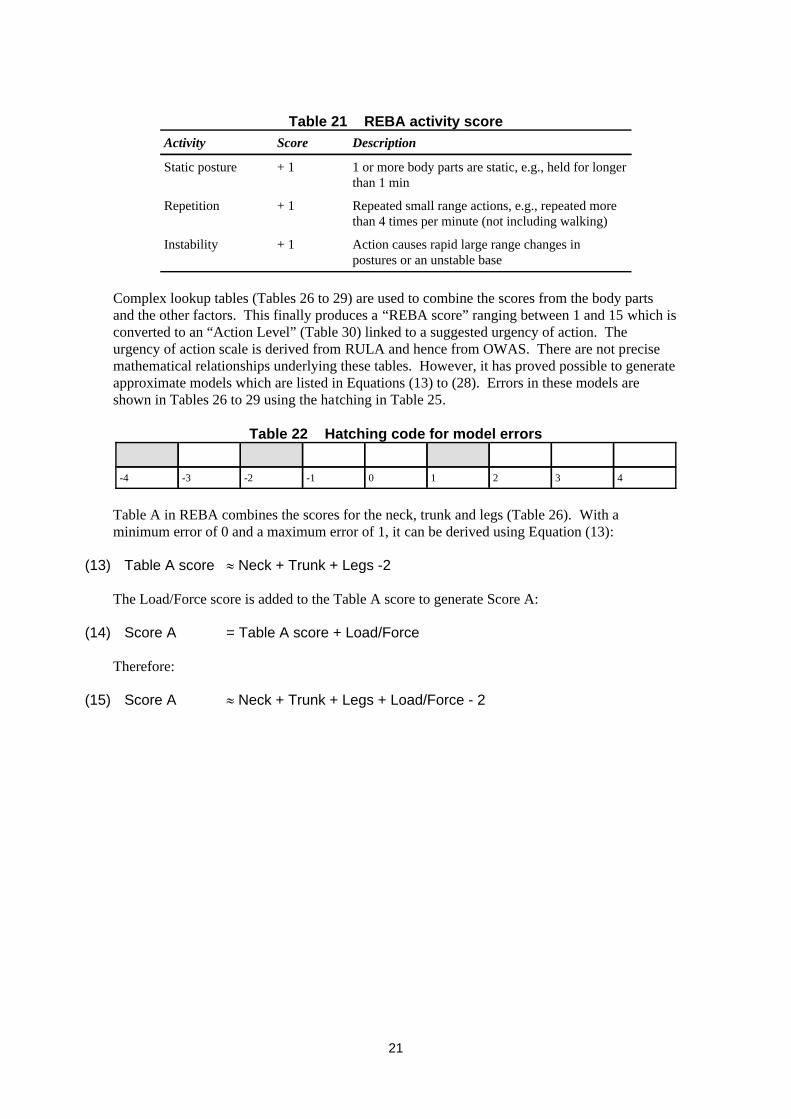
Table 21 REBA activity score
Action causes rapid large range changes inpostures or an unstable base
+ 1Instability
Repeated small range actions, e.g., repeated morethan 4 times per minute (not including walking)
+ 1Repetition
1 or more body parts are static, e.g., held for longerthan 1 min
+ 1Static posture
DescriptionScoreActivity
Complex lookup tables (Tables 26 to 29) are used to combine the scores from the body partsand the other factors. This finally produces a “REBA score” ranging between 1 and 15 which isconverted to an “Action Level” (Table 30) linked to a suggested urgency of action. Theurgency of action scale is derived from RULA and hence from OWAS. There are not precisemathematical relationships underlying these tables. However, it has proved possible to generateapproximate models which are listed in Equations (13) to (28). Errors in these models areshown in Tables 26 to 29 using the hatching in Table 25.
Table 22 Hatching code for model errors
43210-1-2-3-4
Table A in REBA combines the scores for the neck, trunk and legs (Table 26). With aminimum error of 0 and a maximum error of 1, it can be derived using Equation (13):
(13) Table A score l Neck + Trunk + Legs -2
The Load/Force score is added to the Table A score to generate Score A:
(14) Score A = Table A score + Load/Force
Therefore:
(15) Score A l Neck + Trunk + Legs + Load/Force - 2
21
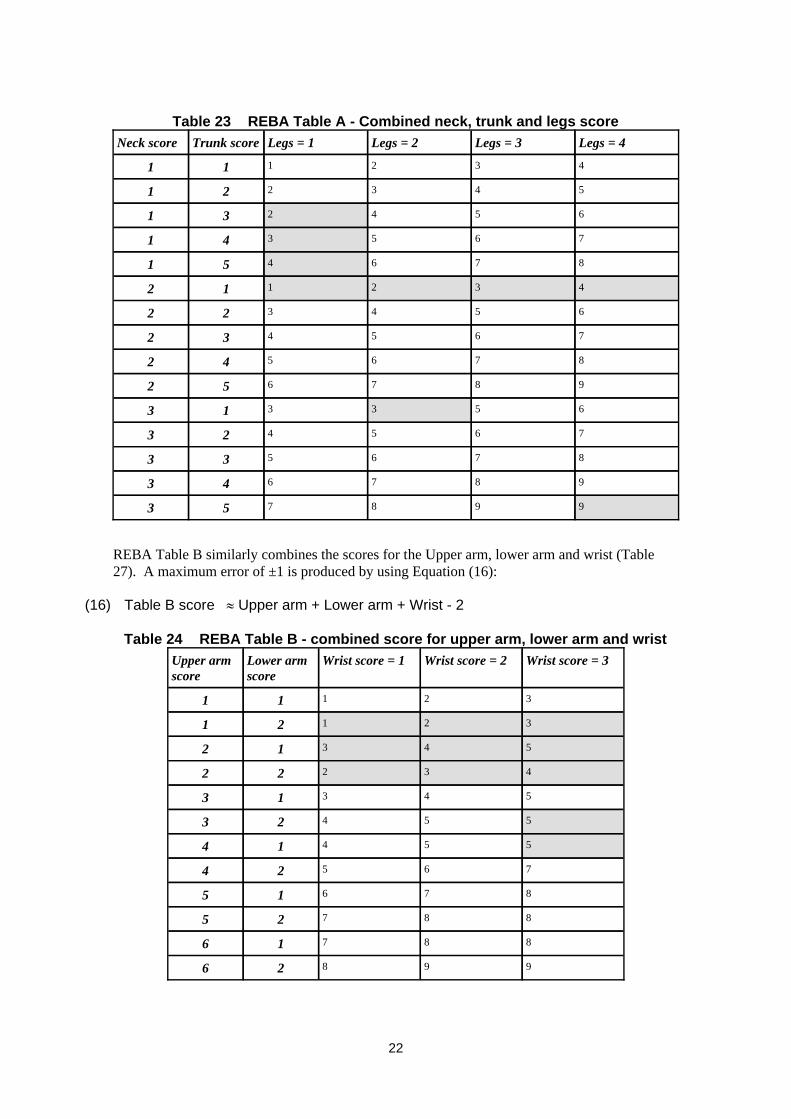
Table 23 REBA Table A - Combined neck, trunk and legs score
998753
987643
876533
765423
653313
987652
876542
765432
654322
432112
876451
765341
654231
543221
432111
Legs = 4Legs = 3Legs = 2Legs = 1Trunk scoreNeck score
REBA Table B similarly combines the scores for the Upper arm, lower arm and wrist (Table27). A maximum error of ±1 is produced by using Equation (16):
(16) Table B score l Upper arm + Lower arm + Wrist - 2
Table 24 REBA Table B - combined score for upper arm, lower arm and wrist
99826
88716
88725
87615
76524
55414
55423
54313
43222
54312
32121
32111
Wrist score = 3Wrist score = 2Wrist score = 1Lower armscore
Upper armscore
22
A Coupling score is added to the Table B score to generate Score B:
(17) Score B = Table B score + Coupling
Therefore:
(18) Score B l Upper arm + Lower arm + Wrist + Coupling - 2
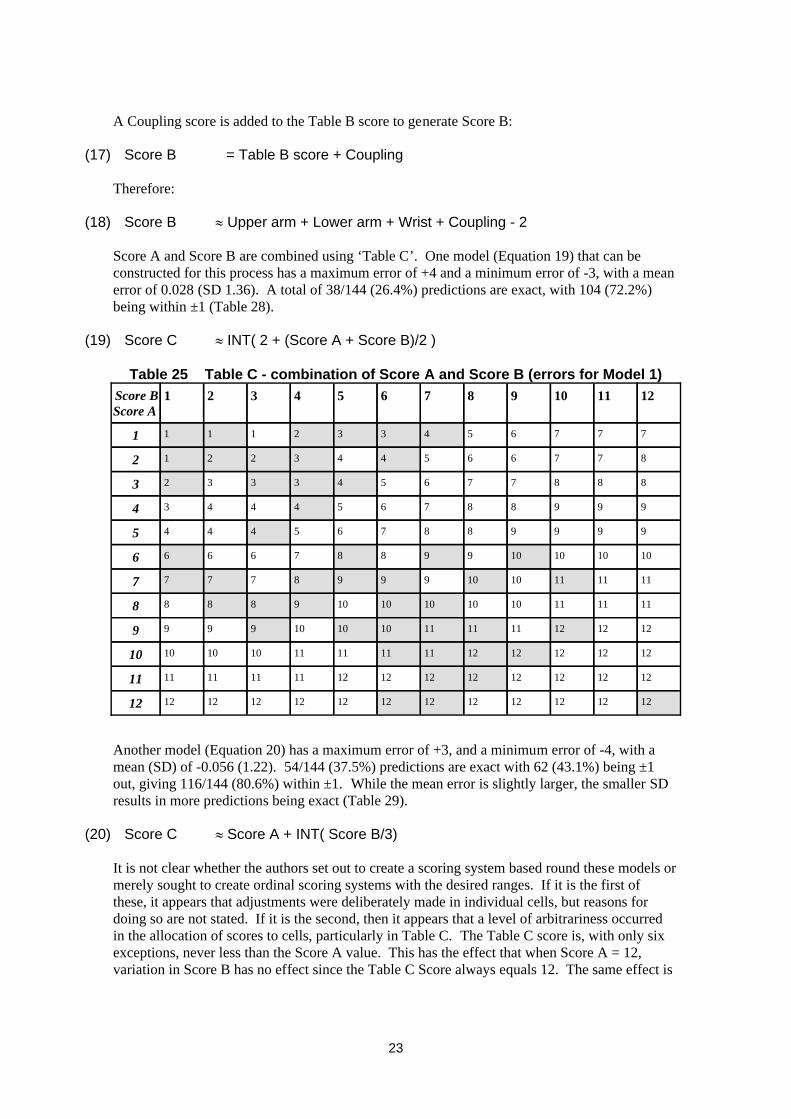
Score A and Score B are combined using ‘Table C’. One model (Equation 19) that can beconstructed for this process has a maximum error of +4 and a minimum error of -3, with a meanerror of 0.028 (SD 1.36). A total of 38/144 (26.4%) predictions are exact, with 104 (72.2%)being within ±1 (Table 28).
(19) Score C l INT( 2 + (Score A + Score B)/2 )
Table 25 Table C - combination of Score A and Score B (errors for Model 1)
12121212121212121212121212
12121212121212121111111111
12121212121111111110101010
1212121111111010109999
111111101010101098888
111111101099987777
10101010998876666
9999887654445
9998876544434
8887765433323
8776654432212
7776543321111
121110987654321Score BScore A
Another model (Equation 20) has a maximum error of +3, and a minimum error of -4, with amean (SD) of -0.056 (1.22). 54/144 (37.5%) predictions are exact with 62 (43.1%) being ±1out, giving 116/144 (80.6%) within ±1. While the mean error is slightly larger, the smaller SDresults in more predictions being exact (Table 29).
(20) Score C l Score A + INT( Score B/3)
It is not clear whether the authors set out to create a scoring system based round these models ormerely sought to create ordinal scoring systems with the desired ranges. If it is the first ofthese, it appears that adjustments were deliberately made in individual cells, but reasons fordoing so are not stated. If it is the second, then it appears that a level of arbitrariness occurredin the allocation of scores to cells, particularly in Table C. The Table C score is, with only sixexceptions, never less than the Score A value. This has the effect that when Score A = 12,variation in Score B has no effect since the Table C Score always equals 12. The same effect is
23

not obtained with Score B since the Table C score is less than Score B in 41/144 cases. Thesecond Score C model (Equation 20) reflects these features.
Table 26 Table C - combination of Score A and Score B (errors for Model 2)
12121212121212121212121212
12121212121212121111111111
12121212121111111110101010
1212121111111010109999
111111101010101098888
111111101099987777
10101010998876666
9999887654445
9998876544434
8887765433323
8776654432212
7776543321111
121110987654321Score BScore A
Substituting for Score A and Score B in Equation (19) gives:
(21) Score C l INT ((Neck + Trunk + Legs + Load/Force + Upper arm + Lower arm+ Wrist + Coupling) / 2)
And in Equation (20)
(22) Score C l Neck + Trunk + Legs + Load/Force - 2 + INT ((Upper arm + Lowerarm + Wrist + Coupling - 2) / 3)
The initial REBA score is obtained by adding an “Activity” score to Score C, i.e.:
(23) REBA Score = Score C + Activity Score
Expansion of Equation (23) using the models in Equations (21) and (22) gives:
(24) REBA Score l INT ((Neck + Trunk + Legs + Load/Force + Upper arm + Lower arm+ Wrist + Coupling) / 2) + Activity score
or
(25) REBA Score l Neck + Trunk + Legs + Load/Force - 2 + INT ((Upper arm + Lowerarm + Wrist + Coupling - 2) / 3) + Activity score
24

Table 27 REBA Action levels
Necessary NOW4Very high11-15
Necessary soon3High8-10
Necessary2Medium4-7
May be necessary1Low2-3
None necessary0Negligible1
ActionAction levelRisk levelREBA score
The mapping of REBA scores onto Action Levels in Table 30 also appears to be based round anordinal relationship rather than a mathematically defined one. The best equation that can befitted to the relationship is correct for 13 of the 15 REBA Scores, having an error of 1 for REBAScores of 1 and 11:
(26) REBA Action Level l INT (REBA Score/4 + 1)
Therefore, in terms of the two models in Equations (24) and (25):
(27) REBA Action Level l INT( INT( (Neck + Trunk + Legs + Load/Force + Upper arm + Lower arm + Wrist + Coupling) / 2) + Activity Score) / 4 + 1)
or
(28) REBA Action Level l INT( (Neck + Trunk + Legs + Load/Force - 2 + INT ((Upper arm + Lower arm + Wrist + Coupling - 2) / 3) + Activity Level) / 4 + 1)
The problem with Equation (26) is that one of the errors is crucial in that a REBA Score of 1 isconverted to an Action Level of 1 when it should be zero, and there is no other REBA Scorethat equates to an Action Level of Zero.
It must be remembered that no evidence is yet available to validate the REBA scoring systemnor the allocation of recommendations for action to particular REBA scores/Action levels andthe authors stress the need for further validation of the tool. Therefore, it is necessary to treatsuch scoring systems as no more than ordinal scales designed to rank tasks by severity andprovide a preliminary guide to the level of remedial action needed.
4.5 OWAS
OWAS does not have any kind of underlying mathematical model. Instead it relies on a lookuptable that converts four digit posture codes into Action Categories. Table 31 gives the OWAScodes for individual body segments. The overall posture code is formed by putting the codesfor the four segments in the sequence of Back, Arms, Legs and Load. Table 32 list thedefinitions of the Action Categories. Table 33 converts the posture codes into ActionCategories.
25
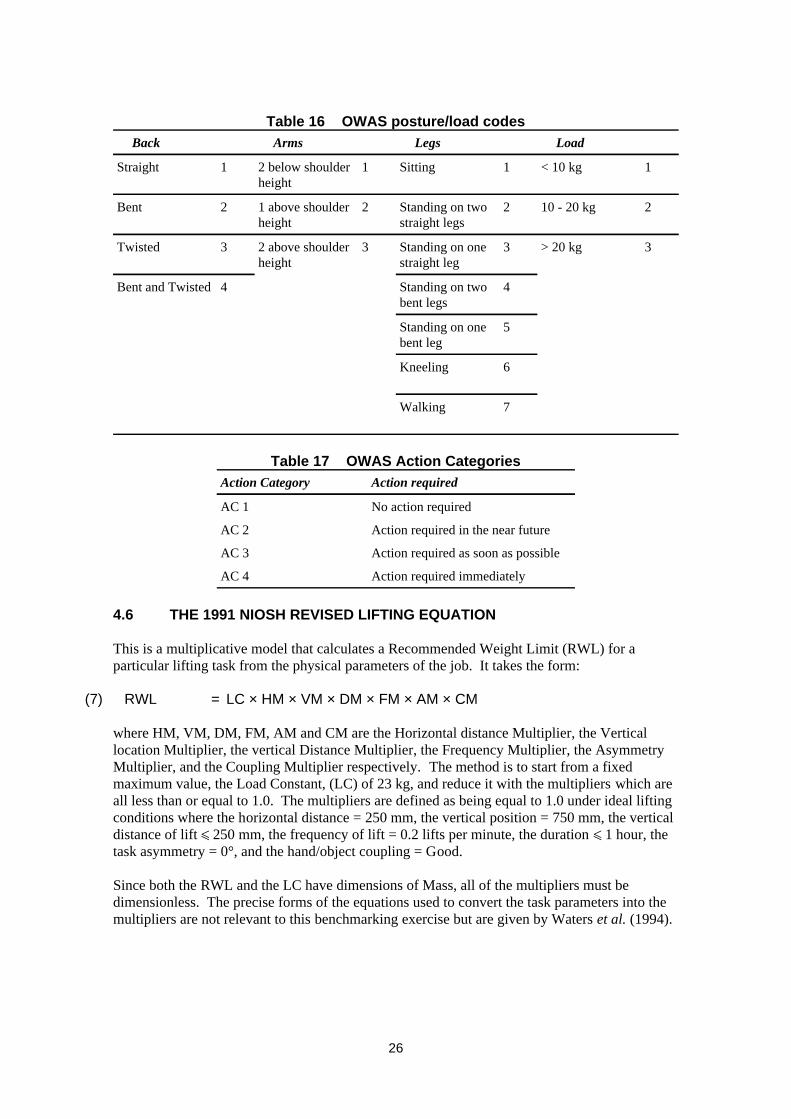
Table 16 OWAS posture/load codes
7Walking
6Kneeling
5Standing on onebent leg
4Standing on twobent legs
4Bent and Twisted
3> 20 kg3Standing on onestraight leg
32 above shoulderheight
3Twisted
210 - 20 kg2Standing on twostraight legs
21 above shoulderheight
2Bent
1< 10 kg1Sitting12 below shoulderheight
1Straight
LoadLegsArmsBack
Table 17 OWAS Action Categories
Action required immediatelyAC 4
Action required as soon as possibleAC 3
Action required in the near futureAC 2
No action requiredAC 1
Action requiredAction Category
4.6 THE 1991 NIOSH REVISED LIFTING EQUATION
This is a multiplicative model that calculates a Recommended Weight Limit (RWL) for aparticular lifting task from the physical parameters of the job. It takes the form:
(7) RWL = LC × HM × VM × DM × FM × AM × CM
where HM, VM, DM, FM, AM and CM are the Horizontal distance Multiplier, the Verticallocation Multiplier, the vertical Distance Multiplier, the Frequency Multiplier, the AsymmetryMultiplier, and the Coupling Multiplier respectively. The method is to start from a fixedmaximum value, the Load Constant, (LC) of 23 kg, and reduce it with the multipliers which areall less than or equal to 1.0. The multipliers are defined as being equal to 1.0 under ideal liftingconditions where the horizontal distance = 250 mm, the vertical position = 750 mm, the verticaldistance of lift ñ 250 mm, the frequency of lift = 0.2 lifts per minute, the duration ñ 1 hour, thetask asymmetry = 0°, and the hand/object coupling = Good.
Since both the RWL and the LC have dimensions of Mass, all of the multipliers must bedimensionless. The precise forms of the equations used to convert the task parameters into themultipliers are not relevant to this benchmarking exercise but are given by Waters et al. (1994).
26
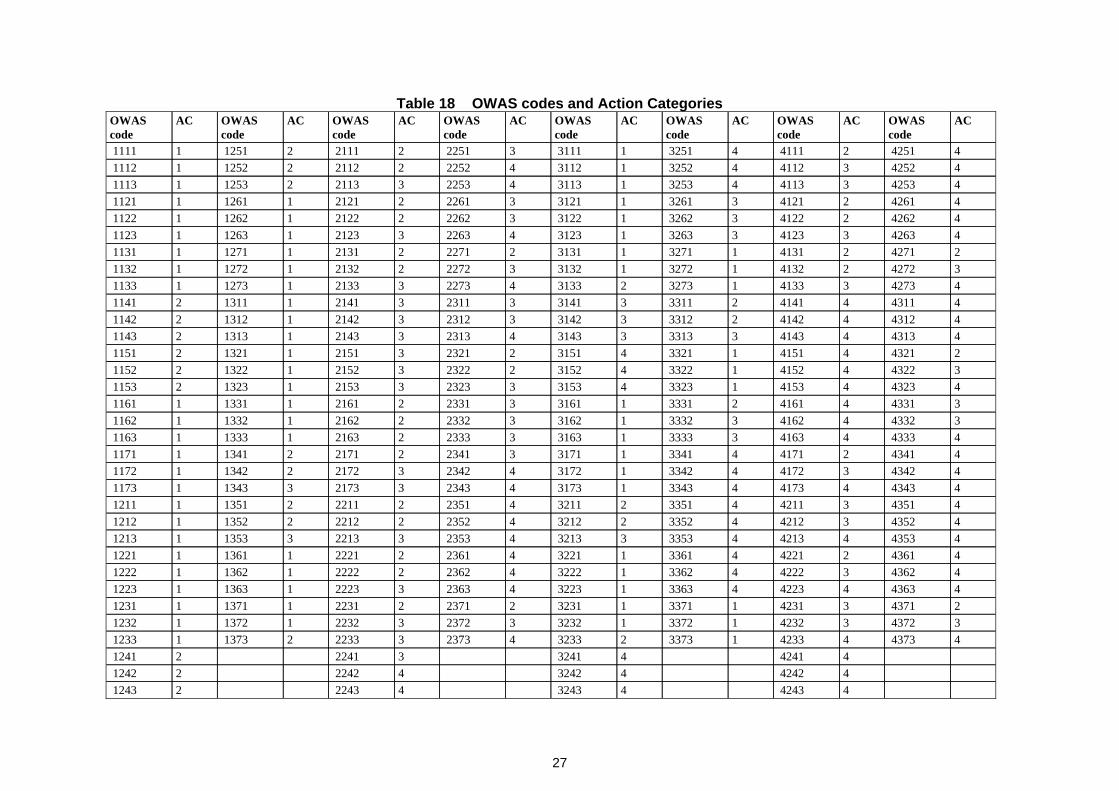
Table 18 OWAS codes and Action Categories
4 42434 32434 22432 12434 42424 32424 22422 12424 42414 32413 22412 1241
4 43734 42331 33732 32334 23733 22332 13731 12333 43723 42321 33721 32323 23723 22321 13721 12322 43713 42311 33711 32312 23712 22311 13711 12314 43634 42234 33631 32234 23633 22231 13631 12234 43623 42224 33621 32224 23622 22221 13621 12224 43612 42214 33611 32214 23612 22211 13611 12214 43534 42134 33533 32134 23533 22133 13531 12134 43523 42124 33522 32124 23522 22122 13521 12124 43513 42114 33512 32114 23512 22112 13511 12114 43434 41734 33431 31734 23433 21733 13431 11734 43423 41724 33421 31724 23423 21722 13421 11724 43412 41714 33411 31713 23412 21712 13411 11714 43334 41633 33331 31633 23332 21631 13331 11633 43324 41623 33321 31623 23322 21621 13321 11623 43314 41612 33311 31613 23312 21611 13311 11614 43234 41531 33234 31533 23233 21531 13232 11533 43224 41521 33224 31522 23223 21521 13222 11522 43214 41511 33214 31512 23213 21511 13212 11514 43134 41433 33133 31434 23133 21431 13132 11434 43124 41422 33123 31423 23123 21421 13122 11424 43114 41412 33113 31413 23113 21411 13112 11414 42733 41331 32732 31334 22733 21331 12731 11333 42722 41321 32721 31323 22722 21321 12721 11322 42712 41311 32711 31312 22712 21311 12711 11314 42633 41233 32631 31234 22633 21231 12631 11234 42622 41223 32621 31223 22622 21221 12621 11224 42612 41213 32611 31213 22612 21211 12611 11214 42533 41134 32531 31134 22533 21132 12531 11134 42523 41124 32521 31124 22522 21122 12521 11124 42512 41114 32511 31113 22512 21112 12511 1111
ACOWAScode
ACOWAScode
ACOWAScode
ACOWAScode
ACOWAScode
ACOWAScode
ACOWAScode
ACOWAScode
27
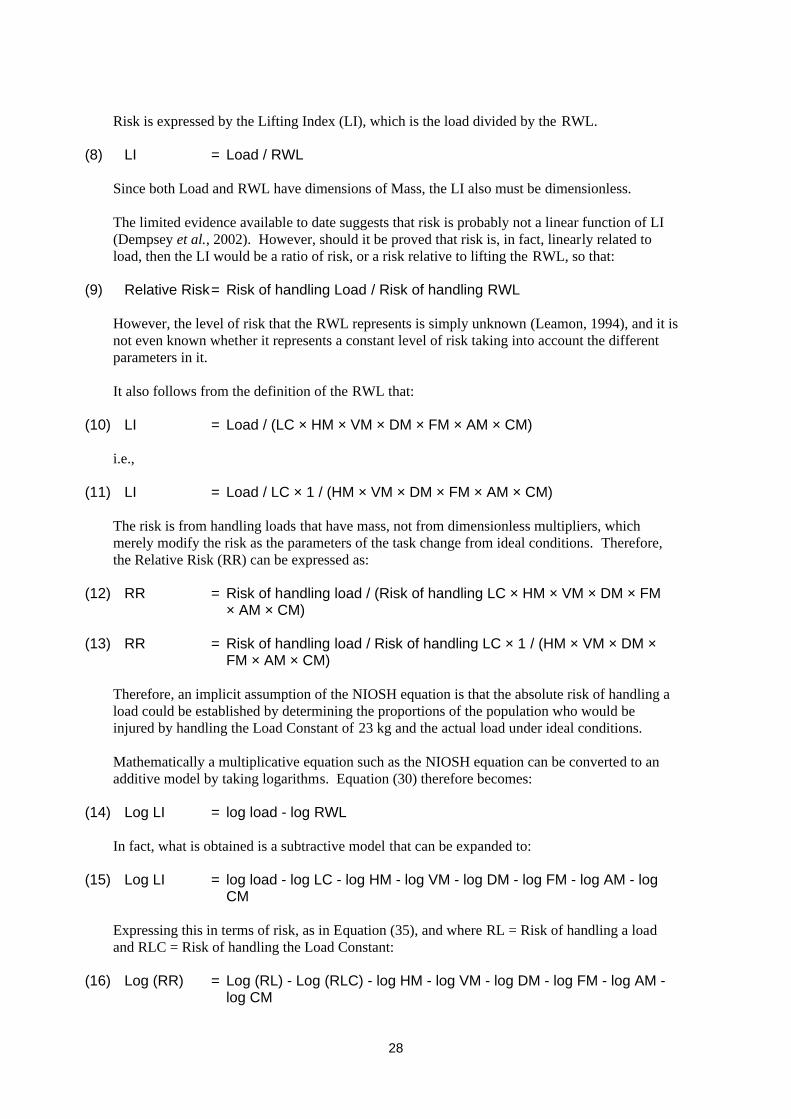
Risk is expressed by the Lifting Index (LI), which is the load divided by the RWL.
(8) LI = Load / RWL
Since both Load and RWL have dimensions of Mass, the LI also must be dimensionless.
The limited evidence available to date suggests that risk is probably not a linear function of LI(Dempsey et al., 2002). However, should it be proved that risk is, in fact, linearly related toload, then the LI would be a ratio of risk, or a risk relative to lifting the RWL, so that:
(9) Relative Risk= Risk of handling Load / Risk of handling RWL
However, the level of risk that the RWL represents is simply unknown (Leamon, 1994), and it isnot even known whether it represents a constant level of risk taking into account the differentparameters in it.
It also follows from the definition of the RWL that:
(10) LI = Load / (LC × HM × VM × DM × FM × AM × CM)
i.e.,
(11) LI = Load / LC × 1 / (HM × VM × DM × FM × AM × CM)
The risk is from handling loads that have mass, not from dimensionless multipliers, whichmerely modify the risk as the parameters of the task change from ideal conditions. Therefore,the Relative Risk (RR) can be expressed as:
(12) RR = Risk of handling load / (Risk of handling LC × HM × VM × DM × FM× AM × CM)
(13) RR = Risk of handling load / Risk of handling LC × 1 / (HM × VM × DM ×FM × AM × CM)
Therefore, an implicit assumption of the NIOSH equation is that the absolute risk of handling aload could be established by determining the proportions of the population who would beinjured by handling the Load Constant of 23 kg and the actual load under ideal conditions.
Mathematically a multiplicative equation such as the NIOSH equation can be converted to anadditive model by taking logarithms. Equation (30) therefore becomes:
(14) Log LI = log load - log RWL
In fact, what is obtained is a subtractive model that can be expanded to:
(15) Log LI = log load - log LC - log HM - log VM - log DM - log FM - log AM - logCM
Expressing this in terms of risk, as in Equation (35), and where RL = Risk of handling a loadand RLC = Risk of handling the Load Constant:
(16) Log (RR) = Log (RL) - Log (RLC) - log HM - log VM - log DM - log FM - log AM -log CM
28

However, because each multiplier is ñ 1.0 the log of it will be either zero (multiplier = 1.0) ornegative (multiplier < 1.0). This means that an additive model, using functions of theunderlying variables (H, V, D, F, A, C) rather than the multipliers, is:
(17) Log (RR) = Log (Risk of handling load) - Log (Risk of handling LC) + f(H) + f(V)+ f(D) + f(F) + f(A) + f(C)
Manipulating Equation (39) gives the following expression for absolute risk of handling a load:
(18) Log (RL) = Log (RR) + Log (Risk of handling LC) + log HM + log VM + log DM+ log FM + log AM + log CM
Comparing this with Equation (6), the model underlying the MAC, shows that fundamentallydifferent approaches have been taken because the NIOSH equation uses risk relative to handlingthe Load Constant under ideal conditions which is then adjusted using the task parameterswhereas the MAC attempts to estimate absolute risk from the parameters of the task.
4.7 COMPARISON OF SCORING SYSTEMS USED BY THE DIFFERENT RISKASSESSMENT TOOLS
4.7.1 Load and frequency of handling
Table 19 Load scoring at 1 lift every minute
LI > 32 < LI ñ 31 < LI ñ 2LI ñ 1Score> 65 kg43.2 - 64.9 kg21.6 - 43.2 kg0 - 21.6 kgLoadNIOSH
AC1 22; AC2 8;AC3 21; AC4 33
AC1 25; AC217; AC3 21;AC4 21
AC1 25; AC228; AC3 13;AC4 18
ACdistribution
321Score> 20 kg10 - 20 kg< 10 kgLoadOWAS
3210Score
> 10 kg withimpulse
> 10 kg; 5 - 10kg with impulse
5 - 10 kg; 0 - 5kg with impulse
0 - 5 kgLoadREBA4321ScoreVery heavyHeavyModerateLightDescription> 20 kg11 - 20 kg6 - 10 kg0 - 5 kgLoadQEC10640ScorePurpleRedAmberGreenColour> 44 kg30 - 44 kg14 - 30 kg0 - 14 kgLoadMAC lifting
flowchart
Category 4Category 3Category 2Category 1
Table 34 compares the way the tools score the load at a frequency of one lift every minute.Since QEC, REBA and OWAS do not adjust their scores to take account of frequency, Table 35compares only the MAC and the NIOSH equation at a frequency of one lift every 30 minutes.Calculations of the NIOSH Lifting Index are based on the assumption that the multipliers otherthan frequency are equal to 1.0 and therefore do not affect the RWL. The loads given arecalculated from the boundaries of the stated LI categories.
29

Whereas the other tools increase the score monotonically as the load increases, this is not true ofOWAS Action Categories (AC). Any load can fall into any AC, depending on the other factorsassessed by OWAS. Therefore, in Table 34, each load category is classified by the number ofpostures that fall into each AC. For each level of load, 84 OWAS scores are defined by theother three variables. As the load increases there is a general tendency to increase the numberof postures in the higher ACs and therefore increase the urgency of remedial action. This isdone particularly by reducing the number in AC2.
The coding ranges for the load/force vary widely. Thus, REBA classifies any load over 10 kgin the highest load category. This is despite it being aimed at health care/patient handling taskswhere the loads are almost inevitably many times this figure. The QEC classifies loads over20 kg as “Very heavy”. The MAC tends to follow the NIOSH equation in accepting muchgreater loads. For the infrequent lifts (once every 30 minutes), 18 kg is considered acceptable.For the QEC this is “Heavy”; for REBA this is in the highest category; for OWAS this is in thesecond category; and for NIOSH, assuming all other factors are ideal, the LI is less than 1.0.
Table 20 Load scoring at 1 lift every 30 minutes
LI > 32 < LI ñ 31 < LI ñ 2LI ñ 1Score> 69 kg46 - 69 kg23 - 46 kg0 - 23 kgLoadNIOSH10640ScorePurpleRedAmberGreenColour> 50 kg39 - 50 kg18 - 39 kg0 - 18 kgLoadMAC lifting
flowchart
Category 4Category 3Category 2Category 1
4.7.2 Horizontal distance of the load
Table 36 compares the ways the different tools assess the lever arm that the load exerts aboutthe low back of the handler. All except the NIOSH equation do this by assessing the posture ofthe trunk. The MAC also utilises the posture of the upper arms in the assessment. The NIOSHequation uses the horizontal distance from the hands to the point mid way between the ankles asa surrogate for the distance between the hands and the low back.
The MAC and OWAS descriptions are purely qualitative. REBA relies on estimates of trunkangle, but the first two categories overlap, leading to confusion in coding. Also, the intervalsare not equal, making the scoring ordinal. The QEC combines qualitative descriptions withnumerical estimates of trunk angle, using the same intervals as categories 2 to 4 of REBA. Thereliance of the NIOSH equation on measurements of hand distance from the mid ankle positionand the way that this value is divided into a reference distance makes it very sensitive tomeasurement error, especially since the horizontal multiplier is the most important multiplier inthe equation. OWAS does not define the boundary between a straight trunk and a “bent” trunk,but where trunk bending occurs the Action Category is never 1.
The LI values for the NIOSH equation are calculated for the nearest and farthest values of therange that the equation specifies for the horizontal distance, and also for two intermediatevalues. The load was assumed to be equal to the Load Constant and all of the other multiplierswere assumed to be equal to 1.0 and therefore to not affect the RWL and LI.
30

Table 21 Hand distance/back flexion scoring
LI = 2.5LI = 2LI = 1.5LI = 1Score
Hands 625 mmfrom mid ankle
Hands 500 mmfrom mid ankle
Hands 375 mmfrom mid ankle
Hands 250 mmfrom mid ankle
LoadNIOSH
AC1 0; AC2 10;AC3 15; AC4 38
AC1 0; AC2 19;AC3 28; AC4 16
AC1 44; AC2 17;AC3 2; AC4 0
ACdistribution
421Score
Trunk bent andtwisted
Bent trunkStraight trunkLoadOWAS
4321Score
> 60° trunkflexion
20°- 60° trunkflexion
0° - 20° trunkflexion
Upright trunkLoadREBA
321Score
> 60°20° - 60°0° - 20°Angle
Excessivelyflexed back
Moderately flexedback
Almost neutralback
DescriptionQEC
630Score
RedAmberGreenColour
Far - upper armangled and trunkbent forward
Moderate - upperarm angled ortrunk bentforward
Close - upper armvertical and/ortrunk upright
DescriptionMACliftingflowchart
Category 4Category 3Category 2Category 1
4.7.3 Height/distance of handling
Table 37 compares the methods of assessing a complex of factors related to the vertical locationof the load and the vertical distance it travels through during the lift. The different assessmentmethods use very different approaches to assessment of these factors. NIOSH carefullydistinguishes between the vertical height of the hands and the vertical lift distance whereasREBA does not assess either factor at all, only assessing trunk and arm posture.
The zones in the MAC relate to the need for stooping and reaching upwards so the ideal zone isspecified as being between knee and elbow height. In the QEC, by contrast, a different modelof risk, based on shoulder posture, has been used which largely matches patterns of liftingstrength so that the strongest region below waist height is least hazardous. The QEC does notincrease the risk assigned when the lift occurs from below knee height in the way that the MACdoes. Like the QEC, OWAS takes the approach of comparing the hand position with shoulderheight, therefore assigning increased risk when handling occurs above the shoulders.
NIOSH works around an “ideal” lifting height of 750 mm, which is approximately knuckleheight. The RWL decreases as the absolute distance away from the 750 mm height increasesand as the distance lifted through increases. The LI has been calculated for the vertical positionusing the “ideal” lifting height and for both the minimum or maximum heights specified. Forthe distance multiplier, LI values were calculated for the minimum or maximum distances oflift. In both cases all other multipliers were set to 1.0 and the load set to 23 kg.
31

Table 22 Hand height/vertical distance scoring
LI = 1.18LI = 1Score
Lift distance (D) of1750 mm
Lift distance (D) of250 mm
Description
LI = 1.6LI = 1.29LI = 1Score
Start or end height (V)of 2000 mm
Start or end height (V)of 0 mm
Start or end height (V)of 750 mm
DescriptionNIOSH
AC1 20; AC2 13;AC3 17; AC4 34
AC1 23; AC2 17;AC3 19; AC4 25
AC1 29; AC2 23;AC3 19; AC4 14
ACdistribution
321Score
Two hands aboveshoulder height
One hand aboveshoulder height
Two hands belowshoulder height
DescriptionOWAS
321Score
Task performed at orabove shoulder height
Task performed at aboutchest height
Task performed at orbelow waist height
DescriptionQEC
630Score
RedAmberGreenColour
Lift from floor level orbelow and/or above headheight
Lift from below kneeand/or above elbowheight
Lift from above kneeand/or below elbowheight
DescriptionMACliftingflowchart
Category 3Category 2Category 1
4.7.4 Trunk asymmetry
Table 38 compares the different methods of assessing the postural asymmetry that occurs inmanual handling. This can have several sources: trunk axial rotation, trunk lateral flexion, andupper limb asymmetry. It is distinct from trunk flexion in the sagittal plane (‘back bending’).Also, a task may be asymmetrical, but if the worker moves his or her feet, postural asymmetrymay not occur.
The MAC scores trunk asymmetry separately to trunk flexion but does not distinguish betweentrunk rotation and trunk lateral flexion. The QEC, on the other hand, combines the trunkasymmetry assessment with the assessment of trunk flexion so a posture that is both bent andtwisted will be coded the same as one that is either bent or twisted. REBA takes the approach ofincreasing the trunk score by 1 if either form of trunk asymmetry occurs. OWAS treats thecombination of trunk flexion and rotation as significantly worse than either trunk flexion byitself or trunk rotation by itself. It does not take account of trunk lateral flexion.
NIOSH uses a linear relationship to decrease the RWL as task asymmetry increases. Taskasymmetry is, strictly, not a measure of trunk asymmetry since it includes asymmetry due toupper limb postures. LI values were calculated for asymmetries of 0° and 135°, which are theends of the range specified by the equation. As before, the load was set to 23 kg and all othermultipliers to 1.0.
32
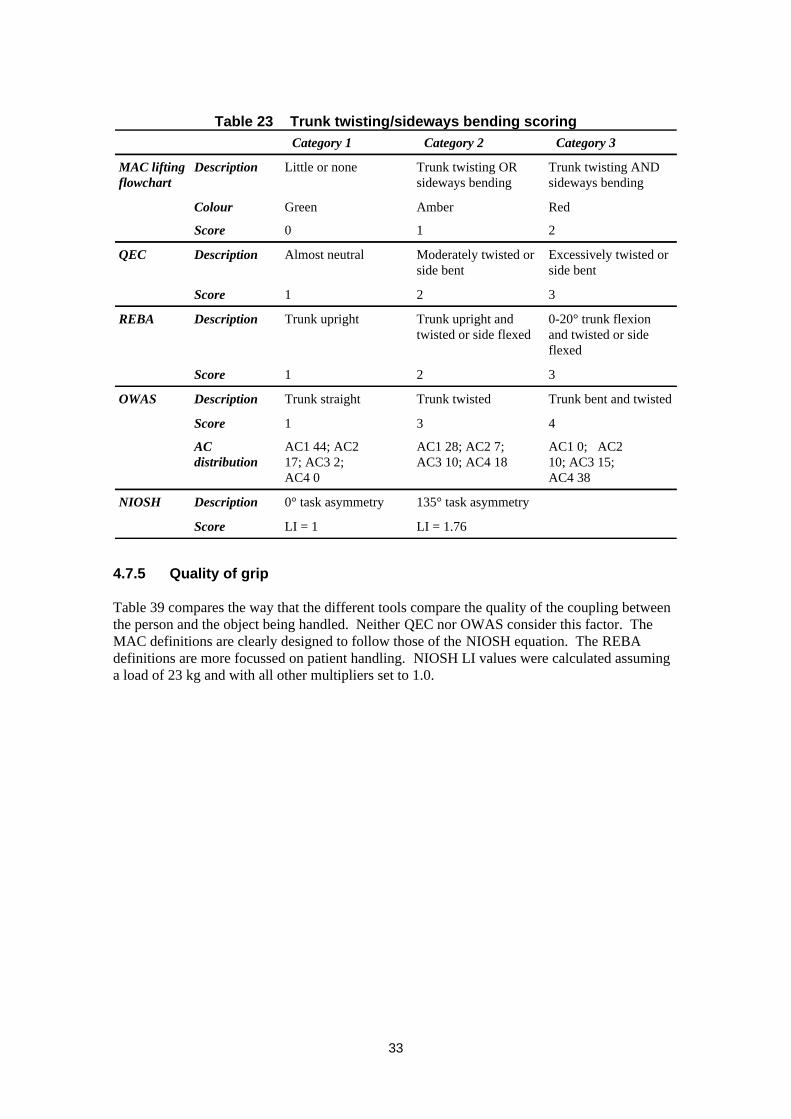
Table 23 Trunk twisting/sideways bending scoring
LI = 1.76LI = 1Score
135° task asymmetry0° task asymmetryDescriptionNIOSH
AC1 0; AC210; AC3 15;AC4 38
AC1 28; AC2 7;AC3 10; AC4 18
AC1 44; AC217; AC3 2; AC4 0
ACdistribution
431Score
Trunk bent and twistedTrunk twistedTrunk straightDescriptionOWAS
321Score
0-20° trunk flexionand twisted or sideflexed
Trunk upright andtwisted or side flexed
Trunk uprightDescriptionREBA
321Score
Excessively twisted orside bent
Moderately twisted orside bent
Almost neutralDescriptionQEC
210Score
RedAmberGreenColour
Trunk twisting ANDsideways bending
Trunk twisting ORsideways bending
Little or noneDescriptionMAC liftingflowchart
Category 3Category 2Category 1
4.7.5 Quality of grip
Table 39 compares the way that the different tools compare the quality of the coupling betweenthe person and the object being handled. Neither QEC nor OWAS consider this factor. TheMAC definitions are clearly designed to follow those of the NIOSH equation. The REBAdefinitions are more focussed on patient handling. NIOSH LI values were calculated assuminga load of 23 kg and with all other multipliers set to 1.0.
33
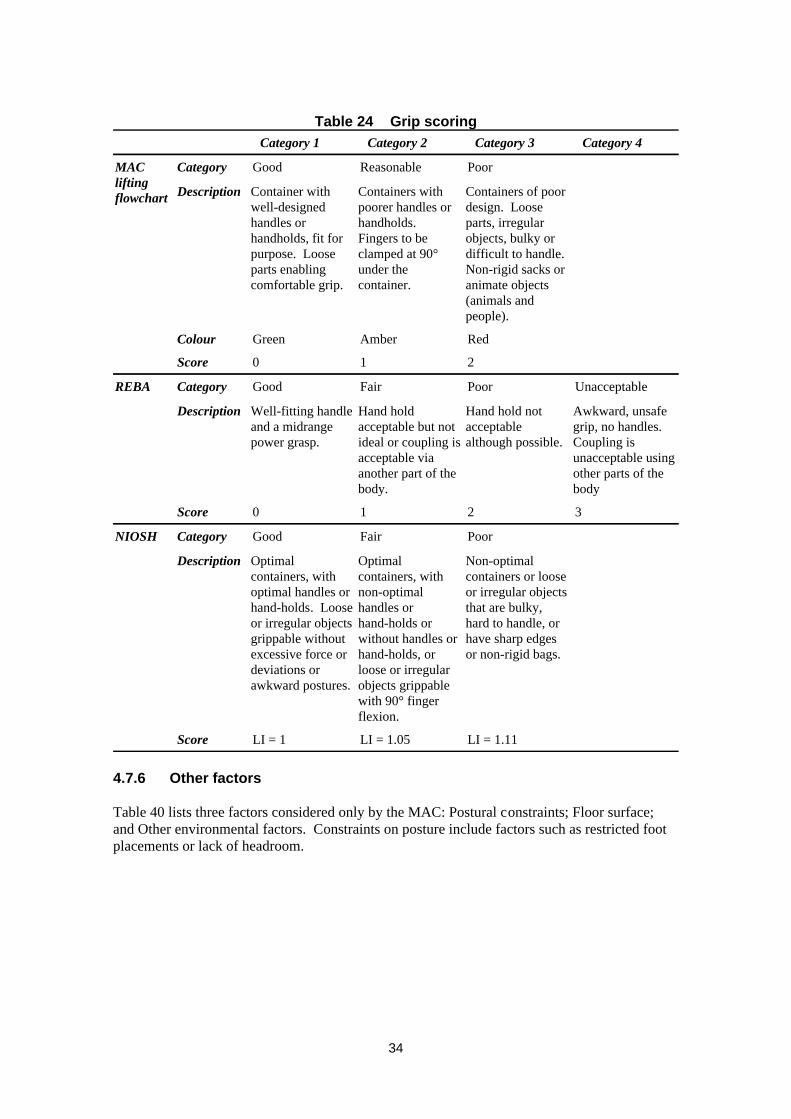
Table 24 Grip scoring
LI = 1.11LI = 1.05LI = 1Score
Non-optimalcontainers or looseor irregular objectsthat are bulky,hard to handle, orhave sharp edgesor non-rigid bags.
Optimalcontainers, withnon-optimalhandles orhand-holds orwithout handles orhand-holds, orloose or irregularobjects grippablewith 90° fingerflexion.
Optimalcontainers, withoptimal handles orhand-holds. Looseor irregular objectsgrippable withoutexcessive force ordeviations orawkward postures.
Description
PoorFairGoodCategoryNIOSH
3210Score
Awkward, unsafegrip, no handles.Coupling isunacceptable usingother parts of thebody
Hand hold notacceptablealthough possible.
Hand holdacceptable but notideal or coupling isacceptable viaanother part of thebody.
Well-fitting handleand a midrangepower grasp.
Description
UnacceptablePoorFairGoodCategoryREBA
210Score
RedAmberGreenColour
Containers of poordesign. Looseparts, irregularobjects, bulky ordifficult to handle.Non-rigid sacks oranimate objects(animals andpeople).
Containers withpoorer handles orhandholds.Fingers to beclamped at 90°under thecontainer.
Container withwell-designedhandles orhandholds, fit forpurpose. Looseparts enablingcomfortable grip.
Description
PoorReasonableGoodCategoryMACliftingflowchart
Category 4Category 3Category 2Category 1
4.7.6 Other factors
Table 40 lists three factors considered only by the MAC: Postural constraints; Floor surface;and Other environmental factors. Constraints on posture include factors such as restricted footplacements or lack of headroom.
34

Table 25 Other factors in the MAC lifting flowchart
+1+1+1Score
AmberAmberAmberColour
Inadequate lightingStrong air movementsExtreme temperaturesDescriptionOther environ-mental factors
210Score
RedAmberGreenColour
Contaminated, wet,sloping or unstable
Dry but in poorcondition or uneven
Dry and in goodcondition
DescriptionFloor surface
310Score
RedAmberGreenColour
Severely restrictedRestrictedNoneDescriptionPosturalconstraints
Category 3Category 2Category 1
35

5 DISCUSSION AND CONCLUSIONS
Measuring exposure to musculoskeletal risk factors is both conceptually and practicallycomplex. This study has shown that a wide variety of methods of assessing risk from manualhandling have been developed and described in the scientific literature. There are clear linksbetween the methods reviewed with concepts and scoring systems from previous methods beingreused, often in modified forms, in later methods. Most rely on snapshot assessments of singlepostures, often those believed to be hazardous or problematic but time sampling and weightingof measurements are possible though time consuming, and offer further difficulties ininterpretation.
HSL/HSE have developed a further tool for assessment of manual handling operations - theManual handling Assessment Charts (MAC). For each of three types of manual handling -lifting, team lifting by up to four persons, and carrying, a flowchart guides the user through anassessment and provides indications of levels of risk, using a “traffic light” system to assigncolour codes and associated numerical values to each factor considered. The conceptual modelunderlying the MAC assumes that the risk factors, except load and frequency of handling, donot interact. The differential weighting of the numerical scores assigned to the colour codes forthe different risk factors, in theory, should allow levels of risk to be assigned to particular totalscores and hence allow boundaries between risk zones to be determined. However, followingan earlier review of the charts, no attempt has been made to assign meaning to the totals of thescores from individual risk factors.
The benchmarking exercise carried out by a small number of ergonomists experienced inassessing manual handling operations showed that the MAC was ranked as one of the easiest ofthe five tools to use and one of the most appropriate methods for assessing manual handlingoperations. The exercise also showed that there were no systematic differences in how thedifferent methods ranked the levels of risk of the tasks studied but the way that the severity oftasks was ranked was random. The tools appear to be assessing risk in different ways and socannot be compared easily.
The status of the different tools is variable. The MAC is still under development and has not yetbeen made public. The QEC has been presented at a number of scientific conferences (Li andBuckle, 1997, 1998, 2000) and published as an HSE Contract Research Report (Li and Buckle,1999b). It has also been presented at HSE sponsored seminars. However, it has not yetappeared in the peer-reviewed scientific literature except for a mention by the same authors in areview of techniques for assessing exposure to WMSDs (Li and Buckle, 1999a). The personalwebsite of Dr Li (Li, 2002a) states that a revised manuscript on the QEC (Li and Buckle, 2000)has been submitted for publication. Also, HSE is sponsoring further work to improve the scope,usability and validity of the QEC (Buckle, 2002).
Of the other tools, REBA was published in the peer-reviewed literature in 2000 (Hignett andMcAtamney, 2000) after a number of earlier conference presentations (Hignett andMcAtamney, 1997; McAtamney and Hignett 1995,1997). OWAS was published in thepeer-reviewed literature as long ago as 1977 (Karhu et al., 1977, 1981), and has been widelyused since (e.g., Vedder 1998). The 1991 revision of the NIOSH equation was published in thepeer-reviewed literature by Waters et al. (1993) though more extensive descriptions occur inNIOSH publications (NIOSH, 1981, Waters et al., 1994).
OWAS, REBA and the QEC use ordinal scoring systems and then combine the scores fordifferent risk factors. OWAS and REBA use “Action Categories” based on four and five point
36
ordinal scales to give an assessment of the urgency of remedial action for the task. The OWASAction Categories are based on expert judgements of the urgency of remedial action for eachposture combination. The REBA scoring system was based on the RULA system (McAtamneyand Corlett, 1993) and modified through judgements of experts (Hignett and McAtamney,2000). This scoring system can be approximated by an additive model.
By contrast, the QEC has an exact mathematical model implicit in its structure with variations inweighting between factors. Originally a series of scores were calculated for different regions ofthe body. Since then Action Levels have been proposed which are related to the total scoreacross all parts of the body. These Action Levels were suggested by an M.Sc. student (Brown,2001) based on a comparison with RULA. Li, (2002b) has published these Action Levels onthe QEC site on the Internet but has not published a justification for them. The original HSEContract Research Report (Li and Buckle, 1999b) described the QEC as a tool for evaluatingchange in exposure to risk factors, not a method of assigning absolute risk. It is unfortunate thatthe authors have abandoned their previous caution with regard to this aspect, especially sincethey noted (Li and Buckle, 1999a) that “the ‘score system’ is at this time largely hypotheticaland needs to be validated through epidemiological studies”.
The 1991 NIOSH lifting equation is based on a multiplicative model of risk relative to areference load of 23 kg where the risk is modified as six parameters vary. NIOSH has taken afundamentally different approach to the scoring systems of the other risk assessment tools.Firstly, they have produced a parametric equation based on measurements of parameters of thetask, not the posture of the individual. Secondly, they have attempted to predict a recommendedweight limit that would be safe for most workers performing the task. The equation uses theLifting Index to assess the risk of an actual task relative to the risk of handling the 23 kgreference weight of the Load Constant in particular, ideal circumstances.
Underlying the MAC and the QEC are additive models and while it is possible to convert theNIOSH equation into an additive model, the form is quite different due to it calculating arelative risk. It is therefore difficult to make simple comparisons between risk factors andscoring systems, but both additive and multiplicative models are valid approaches to the issue ofassessing risk of manual handling so long as the models are restricted to risk factors for a singlepart of the body. The clear need is for risk assessment tools to distinguish between risk to thelow-back and risks to the upper limbs. On this basis both REBA and the QEC are flawedbecause they create overall scores that are effectively tallies of the risk factors present, eventhough some relate specifically to the upper limb and some specifically to the low back.
The MAC has the advantage that it is focussed on the risk of injury to the low back from manualhandling and does not attempt to score risk to the upper limb. Also, the approach adopted withthe MAC of assessing when an individual risk factor is beyond safe limits without attempting toassign an overall risk level to the whole task is a much sounder basis for risk assessment thanany method of assessing the overall risk of the task since any real job is likely to contain severalindependent risks.
Like the other tools, the MAC has not yet been validated as a predictor of risk of injury orsickness absence . HSL are currently running a prospective study on behalf of HSE’s HealthDirectorate to validate the 1991 NIOSH Lifting Equation using sickness absence data and jobparameter data. It should therefore be possible to use these data to validate the ability of theMAC to predict work absence due to low back pain.
37
6 BIBLIOGRAPHY
1 Brown,R. (2001), Further evaluation of the Quick Exposure Check (QEC) System withparticular attention to the scoring system. Unpublished MSc thesis, University ofSunderland
2 Buckle,P. (2002), Further development of the QEC - a tool that evaluates change inexposure to risk for musculoskeletal disorders.Http://www.eihms.surrey.ac.uk/robens/erg/tool.htm
3 Care,B., Quarrie,C. and Monnington,S.C. (2002), Testing and improving the usability ofthe Manual handling Assessment Chart (MAC). (Bootle: Health Directorate, Health andSafety Executive). Internal report
4 Chaffin,D.B. (1969), “A computerized biomechanical model - development of and use instudying gross body actions”, Journal of Biomechanics, 2, 429-441
5 Chaffin,D.B. and Baker,W.H. (1970), “A biomechanical model for analysis of symmetricsagittal plane lifting”, AIIE Transactions, 2, (1), 16-27
6 Chaffin,D.B., Freivalds,A. and Evans,S.M. (1987), “On the validity of an isometric biome-chanical model of worker strengths”, IIE Transactions, 19, (3), 280-288
7 Chaffin,D.B. (1988), “A biomechanical strength model for use in industry”, Applied Indus-trial Hygiene, 3, (3), 79-86
8 Chaffin,D.B. and Erig,M. (1991), “Three-dimensional biomechanical static strength predic-tion model sensitivity to postural and anthropometric inaccuracies”, IIE Transactions, 23,(3), 215-227
9 Dempsey,P.G., Sorock,G.S., Ayoub,M.M., Westfall,P.H., Maynard,W., Fathallah,F. andO’Brien,N. (2002), “Prospective investigation of the revised NIOSH lifting equation”. In:McCabe,P.T. (Ed.) Contemporary Ergonomics 2002, (London: Taylor & Francis), pp.77-81
10 Fransson-Hall,C., Gloria,R., Kilbom,A., Winkel,J., Karlqvist,L. and Wiktorin,C. (1995),“A Portable Ergonomic Observation method (PEO) for computerized on-line recording ofpostures and manual handling”, Applied Ergonomics, 26, (2), 93-100
11 Garg,A. and Chaffin,D.B. (1975), “A biomechanical computerized simulation of humanstrength”, AIIE Transactions, 7, (1), 1-15
12 Health and Safety Commission (2000), Securing Health Together: A long term occupa-tional health strategy for England, Scotland and Wales, (Sudbury, Suffolk: HSE Books),MISC 225
13 Health and Safety Executive (1998), Manual Handling. Manual Handling OperationsRegulations 1992. Guidance on Regulations, (Sudbury, Suffolk: HSE Books), L23,Second edition
38
14 Herrin,G.D., Jariedi,M. and Anderson,C.K. (1986), “Prediction of overexertion injuriesusing biomechanical and psychophysical models”, American Industrial Hygiene Associa-tion Journal, 47, (6), 322-330
15 Hignett,S. and McAtamney,L. (1997), “Rapid entire body assessment (REBA) in the healthcare industry”. In: Seppala,P., Luopajarvi,T., Nygard,C.H., and Mattila,M. (Eds.) FromExperience to Innovation - IEA ‘97. Proceedings of the 13th Triennial Congress of theInternational Ergonomics Association, Tampere, Finland, June 29-July 4, 1997, Volume 4,pp. 162-164
16 Hignett,S. and McAtamney,L. (2000), “Rapid Entire Body Assessment (REBA)”, AppliedErgonomics, 31, (2), 201-205
17 Karhu,O., Kansi,P. and Kuorinka,I. (1977), “Correcting working postures in industry: Apractical method for analysis”, Applied Ergonomics, 8, (4), 199-201
18 Karhu,O., Harkonen,R., Sorvali,P. and Vepsalainen,P. (1981), “Observing workingpostures in industry: Examples of OWAS application”, Applied Ergonomics, 12, (1), 13-17
19 Karlqvist,L., Winkel,J. and Wiktorin,C. (1994), “Direct measurements and systematicobservations of physical workload among medical secretaries, furniture removers and maleand female reference populations”, Applied Ergonomics, 25, (5), 319-326
20 Kemmlert,K. (1995), “A method assigned for the identification of ergonomic hazards -PLIBEL”, Applied Ergonomics, 26, (3), 199-211
21 Kivi,P. and Mattila,M. (1991), “Analysis and improvement of work postures in the build-ing industry: Application of the computerised OWAS method”, Applied Ergonomics, 22,(1), 43-48
22 Leamon,T.B. (1994), “Research to reality: A critical review of the validity of various crite-ria for the prevention of occupationally induced low back pain disability”, Ergonomics, 37,(12), 1959-1974
23 Leskinen,T., Hall,C., Rauas,S., Ulin,S., Tonnes,M., Viikari-Juntura,E. and Takala,E.P.(1997), “Validation of Portable Ergonomic Observation (PEO) method using optoelec-tronic and video recordings”, Applied Ergonomics, 28, (2), 75-83
24 Li, G (2002a), Dr. Guangyan Li, Http://www.sunderland.ac.uk/~ts0gli/myself.htm
25 Li, G (2002b), -QEC- Quick Exposure Checklist for work-related musculoskeletal risks,Http://www.geocities.com/qecuk/
26 Li,G. and Buckle,P. (1997), “The development of a practical tool for musculoskeletal riskassessment”. In: Robertson,S.A. (Ed.) Contemporary Ergonomics 1997, (London: Taylor& Francis), pp. 442-447
27 Li,G. and Buckle,P. (1998), “A practical method for the assessment of work-related muscu-loskeletal risks - Quick Exposure Check (QEC)”. In: Human-System Interaction: TheSky’s No Limit. Proceedings of the Human Factors and Ergonomics Society 42nd AnnualMeeting, Chicago, Illinois, October 5-9, 1998, (Santa Monica, California: The HumanFactors and Ergonomics Society), Volume 2, pp. 1351-1355
39

28 Li,G. and Buckle,P. (1999a), “Current techniques for assessing physical exposure to work-related musculoskeletal risks, with emphasis on posture-based methods”, Ergonomics, 42,(5), 674-695
29 Li,G. and Buckle,P. (1999b), Evaluating Change in Exposure to Risk for MusculoskeletalDisorders - a Practical Tool, (Sudbury, Suffolk: HSE Books), HSE contract researchreport no. 251/1999
30 Li,G. and Buckle,P.W. (2000), “Evaluating change in exposure to risk for musculoskeletaldisorders - a practical tool”. In: Proceedings of the IEA 2000/HFES 2000 Congress,(Santa Monica, California: The Human Factors and Ergonomics Society), Volume 5, pp.407-408
31 Li,G. and Buckle,P. (2000), “Quick Exposure Check (QEC) - A practical tool for theassessment of risks to work-related musculoskeletal disorders”, Revised manuscript resub-mitted to J.Occup.Environ.Med.
32 Martin,J.B. and Chaffin,D.B. (1972), “Biomechanical computerized simulation of humanstrength in sagittal plane activities”, AIIE Transactions, 4, (1), 19-28
33 McAtamney,L. and Corlett,E.N. (1993), “RULA: A Survey Method for the Investigation ofWork-Related Upper Limb Disorders”, Applied Ergonomics, 24, (2), 91-99.
34 McAtamney,L. and Hignett,S. (1995), “REBA: a Rapid Entire Body Assessment methodfor investigating work related musculoskeletal disorders”. In: Embling,B., Fletcher,C.,Livissianos,S., Moody,P., and Nery,D. (Eds.) Widening Our Horizons. Proceedings of the31st Annual Conference of the Ergonomics Society of Australia, Glenelg, South Australia,13-15 December 1995, (Downer ACT: Ergonomics Society of Australia), pp. 45-51
35 McAtamney,L. and Hignett,S. (1997), “REBA (Rapid Entire Body Assessment) - Morethan a postural assessment tool”. In: Robertson,S.A. (Ed.) Contemporary Ergonomics1997, (London: Taylor & Francis), pp. 431-435
36 Monnington,S.C., Pinder, A.D.J. and Quarrie,C. (2002), Development of an inspection toolfor manual handling risk assessment, (Sheffield, Health and Safety Laboratory), HSLInternal Report ERG/02/20
37 NIOSH (1981), Work Practices Guide for Manual Lifting, (Cincinnati, Ohio: U.S. Depart-ment of Health and Human Services), Report No. 81-122
38 Rodgers,S.H. (1978), “Metabolic indices in manual materials handling tasks”. In: C.G.Drury (ed.), Safety in Manual Materials Handling, (Cincinnati, OH: NlOSH), pp. 52-56
39 Rodgers,S.H. and Yates,J.W. (1990), “Physiological basis for manual lifting guidelines”.In: Scientific Support Documentation for the 1991 NIOSH Lifting Equation: TechnicalContract Reports, (Cincinnati, Ohio: NIOSH), pp. 1-56
40 Rodgers,S.H. (1996), “Measuring and setting ergonomic standards - Issues and perspec-tives”. In: Mital,A., Krueger,H., Kumar,S., Menozzi,M., and Fernandez,J. (eds.) Advancesin Occupational Ergonomics and Safety I, (Cincinnati, Ohio, USA: International Societyfor Occupational Ergonomics and Safety), Volume 2, pp. 884-890
40

41 Rodgers,S.H. (1997), “Work Physiology - Fatigue and Recovery”. In: G. Salvendy (ed.),Handbook of Human Factors and Ergonomics, (New York: Wiley Interscience), pp.268-297
42 Snook,S.H. (1978), “The design of manual handling tasks”, Ergonomics, 21, (12), 963-985
43 Snook,S.H. and Ciriello,V.M. (1991), “The design of manual handling tasks: Revisedtables of maximum acceptable weights and forces”, Ergonomics, 34, (9), 1197-1213
44 Tapley,S. (2002), Reliability of Manual handling Assessment Charts (MAC) developed forhealth and safety inspectors in the UK., (Bootle: Health Directorate, Health and SafetyExecutive). Internal report
45 Vedder,J. (1998), “Identifying postural hazards with a video-based occurrence samplingmethod”, International Journal of Industrial Ergonomics, 22, (4-5), 373-380
46 Waters,T.R., Putz-Anderson,V., Garg,A. and Fine,L.J. (1993), “Revised NIOSH equationfor the design and evaluation of manual lifting tasks”, Ergonomics, 36, (7), 749-776
47 Waters,T.R., Putz-Anderson,V. and Garg,A. (1994), Applications Manual for the RevisedNIOSH Lifting Equation, (Cincinnati, Ohio: Division of Biomedical and BehavioralScience, NIOSH, U.S. Department of Health and Human Services)
41