Benchmarking Liability Claims Management · PDF fileBenchmarking Liability Claims Management 3...
33
Benchmarking Liability Claims Management Prepared by Rod McInnes and Steve Curley Presented to the Institute of Actuaries of Australia 16 th General Insurance Seminar 9-12 November 2008 Coolum, Australia This paper has been prepared for the Institute of Actuaries of Australia’s (Institute) 16 th General Insurance Seminar 2008. The Institute Council wishes it to be understood that opinions put forward herein are not necessarily those of the Institute and the Council is not responsible for those opinions. © Finity Consulting Pty Limited The Institute will ensure that all reproductions of the paper acknowledge the Author/s as the author/s, and include the above copyright statement: The Institute of Actuaries of Australia Level 7 Challis House 4 Martin Place Sydney NSW Australia 2000 Telephone: +61 2 9233 3466 Facsimile: +61 2 9233 3446 Email: [email protected] Website: www.actuaries.asn.au
Transcript of Benchmarking Liability Claims Management · PDF fileBenchmarking Liability Claims Management 3...

Benchmarking Liability Claims Management
Prepared by Rod McInnes and Steve Curley
Presented to the Institute of Actuaries of Australia 16th General Insurance Seminar 9-12 November 2008
Coolum, Australia
This paper has been prepared for the Institute of Actuaries of Australia’s (Institute) 16th General Insurance Seminar 2008. The Institute Council wishes it to be understood that opinions put forward herein are not necessarily those of the Institute and the
Council is not responsible for those opinions.
© Finity Consulting Pty Limited
The Institute will ensure that all reproductions of the paper acknowledge the Author/s as the author/s, and include the above copyright statement:
The Institute of Actuaries of Australia Level 7 Challis House 4 Martin Place
Sydney NSW Australia 2000 Telephone: +61 2 9233 3466 Facsimile: +61 2 9233 3446
Email: [email protected] Website: www.actuaries.asn.au

Benchmarking Liability Claims Management
2
Abstract The performance of claims management operations are often considered in terms of the performance against operational process metrics and as an expense item in the profit and loss. We provide the results of a survey of liability claims managers assessing the performance of the industry relative to descriptors of poor, average and best practice and also rating the performance of their own claims operation relative to the industry. We use the results of the survey to provide analysis of claims operations in terms of how they can deliver value to an insurer’s bottom line and how management can benchmark the performance of their claims operations relative to good practice and between claims teams and whether (and to what extent) claims management is delivering value to the business.
Keywords: Liability, Claims Management, Best Practice, Benchmarking, Performance

Benchmarking Liability Claims Management
3
1. Objective This paper sets out our views of best practice techniques for the management for liability claims and benchmarks, based on feedback from experienced liability claims managers, current industry practice against our defined best practice. 2. Best Practice Claims Management Our model of best practice claims management for liability claims is based on the experience we have gained over a number of years in reviewing, assessing and monitoring claims management operations both in Australia and overseas. It reflects the observations we have of the key elements of an effective claims operation and current leading practice in these elements We note that best practice is not fixed but constantly evolving and changing. Best practice also must be considered in context and what is good practice for a large public liability portfolio will vary from that for a small niche portfolio. It is also noted that insurers may, for financial or other reasons, choose not to target best practice but to maintain a lower, more easily achievable standard or may be aiming to move there incrementally over a period of time. Nevertheless we expect that every insurer would aim to ensure that their claims operation is as efficient and effective as it can be given the nature and size of the portfolio and the constraints (budgetary and otherwise) that they operate under. The quality of an insurer’s claims management operation can provide a competitive advantage to an insurer. It is our experience that for liability claims the difference in claims cost outcomes between good (not necessarily best) practice and poor practice can exceed 20 per cent of claims costs. As claims management expenses are only a fraction of total claim costs it can make sense to invest significantly in improving claims management in order to deliver a significant net saving. Best Practice Elements for Liability Claims In assessing best practice liability claims management we generally look to examine performance under a number of key headings: • Effective claims management model • Early claims reporting • Effective triage and segmentation • Timely effective communication • Appropriate reserving • Proactive management • Identify and address outlying claims • Effective provider management • Optimal resourcing • Claims systems • Performance management While we have not attempted to weight the relative importance of the above elements, in our survey we have sought to gain views of practitioners as to the importance of the criteria. It is our view that while some may be more important than others, they should be considered holistically as claims management performance may be limited by the weakest link.

Benchmarking Liability Claims Management
4
3. Best Practice Liability Claims Survey Survey Objective For this study, we undertook a survey of experienced liability claims managers in order to understand views of • The general standard of liability claims management across the industry • Their company’s current position relative to industry. Methodology For each of the best practice elements (above) we identified a number of components that contribute to that element. We identified between 2 and 7 components for each element depending on the element. For each component descriptors of “Poor”, “Satisfactory” and “Best” practice were drafted. A survey questionnaire was developed which asked respondents to rate current “average” industry practice against these descriptors and also to assess their company’s current practice relative to industry. For each component practitioners were asked to nominate a rating of 1 to 5 on the following basis:
Descriptor Rating Poor 1 Midway between poor and satisfactory 2 Satisfactory 3 Midway between satisfactory and best 4 Best practice 5
The survey also asked if the respondent considered that any significant best practice elements were missing and if any of the eleven best practice elements included did not warrant inclusion. Lastly it asked the respondent to list the best practice elements that they considered most critical in getting best practice claims outcomes. A copy of the survey template can be found at Appendix A. We issued the survey questionnaire to a range of senior experienced liability claims managers – where possible we sought a response from the most senior claims manager within the firm. The firms targeted ranged from small niche insurers to major insurers with large public liability portfolios. We also sought responses from a small number of individuals who were not current claims managers but who had considerable liability claims experience. The survey questionnaire was sent to approximately 30 people in the insurance industry with experience in liability claims. We received a total of 20 completed surveys. While the number of responses is relatively small in absolute terms, they represent a good cross section of the industry, including a majority of the major players in liability insurance. We would like to thank all those who responded: without them this paper would not be possible. The detailed data for each question component can be found at Appendix B.

Benchmarking Liability Claims Management
5
4. Comments on Best Practice Model Best Practice Elements considered missing Of the 20 people who responded, five respondents listed one or more additional elements that they considered to be missing from our list of eleven best practice elements. The elements these responses identified were (identified by one respondent unless otherwise stated): • Culture (2 respondents) • Approach to declinature of indemnity under policy • Communication with underwriting • Negotiation methodology • Recovery/contribution identification and pursuit • Training – enhance training to include knowledge of policy wordings and coverage. We acknowledge that each of the above items would be appropriately included in any best practice model. In particular that culture and recovery/contribution could warrant a separate element. We will extend our best practice model to incorporate these activities and include results for these activities in future benchmarking exercises. Best Practice Elements listed that should not be included There was not a single response that indicated that any of the eleven best practice elements listed should not be included or were in any way inappropriate. We consider that this represents a validation of our best practice model for liability claims management.
Benchmarking Liability Claims Management
6
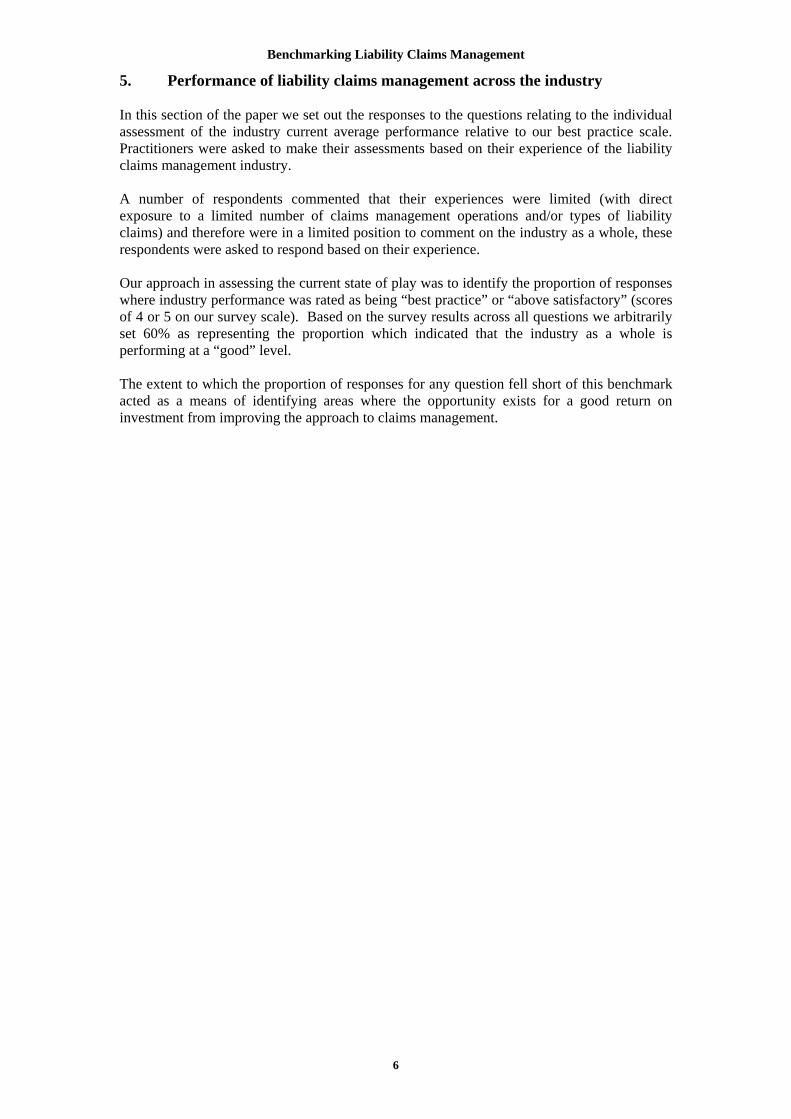
5. Performance of liability claims management across the industry In this section of the paper we set out the responses to the questions relating to the individual assessment of the industry current average performance relative to our best practice scale. Practitioners were asked to make their assessments based on their experience of the liability claims management industry. A number of respondents commented that their experiences were limited (with direct exposure to a limited number of claims management operations and/or types of liability claims) and therefore were in a limited position to comment on the industry as a whole, these respondents were asked to respond based on their experience. Our approach in assessing the current state of play was to identify the proportion of responses where industry performance was rated as being “best practice” or “above satisfactory” (scores of 4 or 5 on our survey scale). Based on the survey results across all questions we arbitrarily set 60% as representing the proportion which indicated that the industry as a whole is performing at a “good” level. The extent to which the proportion of responses for any question fell short of this benchmark acted as a means of identifying areas where the opportunity exists for a good return on investment from improving the approach to claims management.

Benchmarking Liability Claims Management
7
Element 1 - Claims Management Model Claims Management Model incorporates the development and documentation of a claims management model or a policy and approach to how claims are managed (but not a “claims manual”) and how that model is disseminated and made operational consistently throughout the business. Figure 5.1 sets out a description of the components considered under this element that we believe constitutes Best Practice and the survey respondent’s assessment of the industry’s current state of play.
Figure 5.1 – Claims Management Model: Industry Assessment
Component Description of Best Practice
Staff Performance
Consistency
Training
Staff performance assessment primarily based on assessment against these outcome focused standards.Claims management consistent across the class - no significant variation between branch, team or individualClaims management model forms the basis for claims staff training (induction & other)
Fully documented claims management model, providing guidance, direction and an overarching framework for claims staff
Documentation
Outcome Focus
Clarity of Expected Outcomes
Claims management focused on outcomes and bottom line
Expected claims outcomes documented and linked to performance standards for claims staff
0%
25%
50%
75%
100%
Documentation Outcome Focus Clarity ofExpectedOutcomes
StaffPerformance
Consistency Training
Best Practice Above Satisfactory Element Ave "Good"
These results show that for most aspects of the underlying business model, practitioners feel that the industry is falling well short of the 60% benchmark for “good” performance. The one exception is “Outcome Focus” which reaches this standard. The poorest ratings were for the documentation of the Claims Management Model and the consistent execution of the Claims Management Model across the whole organisation. There is considerable scope for improvement in these areas.

Benchmarking Liability Claims Management
8
Element 2 – Early Claims Reporting Early Claims Reporting relates to how early reporting is promoted, facilitated and monitored by the business. Figure 5.2 sets out the components of the Early Claims Reporting best practice element and the survey respondent’s assessment of current industry performance.
Figure 5.2 – Early Claim Reporting: Industry Assessment
Component Description of Best PracticePromote Early Contact Early claims (and potential claims) reporting actively promoted to front-line staff,
policyholders and brokers.Monitor Delays
Systems to Facilitate Reporting Systems in place to facilitate reporting of claims and potential claims, ie including in advance of a formal claim where liability is apparent
Reporting delays (from time of loss and time policyholder was aware) monitored – policyholders/brokers with significant delays followed-up
0%
25%
50%
75%
100%
Promote Early Contact Monitor Delays Systems to Facilitate Reporting
Best Practice Above Satisfactory Element Ave "Good"
The survey results indicate that in relation to Early Claims Reporting industry performance falls short of the 60% “good” benchmark. The results are relatively consistent across the components of best practice, although monitoring delays was rated best and there is considerable scope for improvement in the provision of systems to facilitate early reporting.

Benchmarking Liability Claims Management
9
Element 3 – Triage and Segmentation Triage and Segmentation relates the segmentation of claims according to apparent severity and complexity with the appropriate allocation of resources for the identified severity and complexity. Our definition of best practice Triage and Segmentation and a summary of the survey results for this element are shown in Figure 5.3.
Figure 5.3 – Triage and Segmentation: Industry Assessment
Component Description of Best Practice
Claims allocated to staff on the basis of capability and capacityAllocation by Segment
Regular Reassessment Claims reassessed regularly to identify changes in category (particularly claims becoming more severe / complex)
Initial Triage & Segmentation Claims segmented according to apparent severity and complexity at initial triage/assessment
Formalised Mentoring Process Formalised mentoring processes and/or team workshops established to assist in managing the most difficult claims and developing staff)
0%
25%
50%
75%
100%
Initial Triage &Segmentation
Allocation by Segment Regular Reassessment Formalised MentoringProcess
Best Practice Above Satisfactory Element Ave "Good"
The survey results show industry performance below the “good” benchmark of 60% for most components of the Triage and Segmentation best practice element. The exception is ‘Allocation by Segment’ which was rated as best practice or better than satisfactory by 75% of respondents.

Benchmarking Liability Claims Management
10
Element 4 – Timely Effective communication Timely Effective Communication incorporates timely and effective communication with the policyholder, the claimant (and/or their representative) and providers to ensure relevant information is obtained and expectations are managed. Figure 5.4 shows a definition of the best practice components of Timely Effective Communication and the survey results for this element.
Graph 5.4 – Timely Effective Communication: Industry Assessment
Component Description of Best PracticeEarly Contact Early contact with policyholder and claimant (if unlitigated) to establish and manage
expectations and any issues before they become entrenchedRegular Systematic Comms Systematic approach to communication with regular updates
Simple Clear Language Language used in all communication (written and oral) designed for use of understanding by the reader eg plain English and minimal jargon
0%
25%
50%
75%
100%
Early Contact Regular Systematic Comms Simple Clear Language
Best Practice Above Satisfactory Element Ave "Good"
Timely Effective Communication was rated below the 60% “good” benchmark for all components. The area with the greatest scope for improvement is ‘Regular Systematic Communications’ which had only 30% of respondents rate it best practice or above satisfactory.

Benchmarking Liability Claims Management
11
Element 5 – Reserving Reserving incorporates establishing a reserving policy, the consistent application of the policy (internally and by legal providers) and regular reviews of estimate. The results for the Reserving element of best practice claims management and the best practice descriptions are summarised in Figure 5.5 below.
Figure 5.5 – Reserving: Industry Assessment
Component Description of Best PracticeReserving Policy Documented reserving policy established based on experience and analysis (and tested
against outstanding claim valuations)Initial Estimates & Regular Reviews
Initial estimate placed on the claim upon receipt and regularly reviewed following receipt of additional information or at least every 3 months
Legal Advisers Legal advisers providing case estimates are trained in your reserving policy and provide estimates consistent with the policy (including detailed calculations)
Consistent Application Reserving policy consistently applied in all cases and consistent application verified through file reviews
0%
25%
50%
75%
100%
Reserving Policy Initial Estimates & RegularReviews
Legal Advisers Consistent Application
Best Practice Above Satisfactory Element Ave "Good"
Reserving practice across the industry was generally rated very close to our 60% “good” benchmark. The only exception related to legal advisors using the claims manager’s reserving policy when advising on reserves which scored a lower result with 42% rated best practice or above satisfactory.

Benchmarking Liability Claims Management
12
Element 6 – Proactive Management Proactive Management relates to the claims officer taking the initiative with claims and actively driving the claim towards their preferred resolution. Figure 5.6 below shows the results for the Proactive Management element of claims management, together with our description of best practice..
Figure 5.6 – Proactive Management: Industry Assessment
Component Description of Best PracticeIndividual Claims Mgmt Strategy Establishing (and documenting) a claims management strategy for all significant claims as
soon as practical (within 6 to 8 weeks for liability)Strategies Outcome Focused Claims management strategy set by the claims officer and to encompass
• An approach on indemnity and liability issues• Need for further investigations or legal advice• Target or desired outcome• Steps proposed to achieve that outcome
Active Approach Active management to the target outcome
Regular Review Strategy regularly reviewed – (say) every 6 months or following a significant change in circumstances
Claims Officer Primarily Responsible
Use of investigators, legal and other providers as appropriate to assist with strategy and execution (but scope of work determined by claims officer) and responsibility for management of the claim retained by the claims officer at all times
0%
25%
50%
75%
100%
Individual ClaimsMgmt Strategy
Strategies OutcomeFocused
Active Approach Regular Review Claims OfficerPrimarily
Responsible
Best Practice Above Satisfactory Element Ave "Good"
Proactive Management practice across the industry was rated below the 60% “good” benchmark across all components of this best practice element. Two components were rated significantly lower than the remainder: ‘active management to the target outcome’ and the ‘claims officer being primarily responsible for the claim’. These two components have the greatest scope for improvement and are also arguably the most critical.

Benchmarking Liability Claims Management
13
Element 7 – Identify and address outlying claims Identify and Address Outlying Claims relates to the regular reassessment of claims to identify and address claims not responding as expected to the chosen claims management strategy. The figure below summarises the results for Identify and Address Outlying Claims and also describes best practice.
Figure 5.7 – Identifying and Addressing Outliers: Industry Assessment
Component Description of Best PracticeIdentify & Address Outliers Identify claims not progressing to targeted outcomes (ie “falling through the cracks”),
reassess strategy, targeted outcomes and resourcing to address emerging issuesContinuous Sweeps for Outliers Continuously sweep portfolio for emerging outliers
0%
25%
50%
75%
100%
Identify & Address Outliers Continuous Sweeps for Outliers
Best Practice Above Satisfactory Element Ave "Good"
The results for this element are poor with around 8% of respondents rating it as best practice or above satisfactory. This indicates substantial scope for improvement in these areas.
Benchmarking Liability Claims Management
14
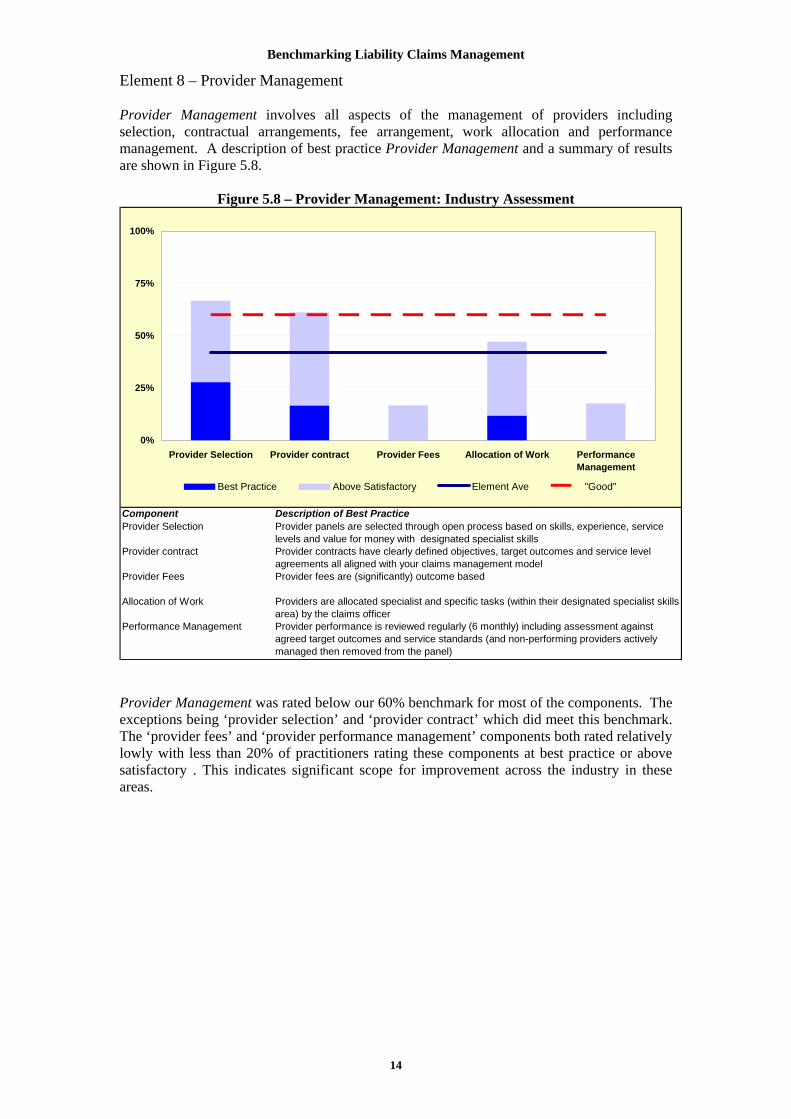
Element 8 – Provider Management Provider Management involves all aspects of the management of providers including selection, contractual arrangements, fee arrangement, work allocation and performance management. A description of best practice Provider Management and a summary of results are shown in Figure 5.8.
Figure 5.8 – Provider Management: Industry Assessment
Component Description of Best PracticeProvider Selection Provider panels are selected through open process based on skills, experience, service
levels and value for money with designated specialist skillsProvider contract Provider contracts have clearly defined objectives, target outcomes and service level
agreements all aligned with your claims management modelProvider Fees Provider fees are (significantly) outcome based
Allocation of Work Providers are allocated specialist and specific tasks (within their designated specialist skills area) by the claims officer
Performance Management Provider performance is reviewed regularly (6 monthly) including assessment against agreed target outcomes and service standards (and non-performing providers actively managed then removed from the panel)
0%
25%
50%
75%
100%
Provider Selection Provider contract Provider Fees Allocation of Work PerformanceManagement
Best Practice Above Satisfactory Element Ave "Good"
Provider Management was rated below our 60% benchmark for most of the components. The exceptions being ‘provider selection’ and ‘provider contract’ which did meet this benchmark. The ‘provider fees’ and ‘provider performance management’ components both rated relatively lowly with less than 20% of practitioners rating these components at best practice or above satisfactory . This indicates significant scope for improvement across the industry in these areas.

Benchmarking Liability Claims Management
15
Element 9 - Resourcing Resourcing encompasses establishing appropriate claims staffing levels, ensuring staff have appropriate competencies, monitoring resource levels and reviewing staff performance. The overall results for the Resourcing element of claims management and a description of best practice are summarised in Figure 5.9 below:
Figure 5.9 – Resourcing: Industry Assessment
Component Description of Best PracticeTarget File Loads Target file loads designed to enable all claims officers to actively manage claims consistent
with your claims management model are established and applied for each (type of) claims officer
Actively Monitor File Loads File loads are actively monitored and adjustments made to ensure they remain within target levels
Staff Competencies Competencies / capabilities for all claims roles are clearly defined and staff are selected for these roles on the basis of having the relevant skills
Staff Performance Assessment Staff performance is assessed against the• Delivery to target outcomes (per claims management strategies)• Meeting required competencies• Meeting processing timeframes
Regular Performance Reviews Formal performance reviews occur regularly (at least quarterly)
Sample File Reviews Assessment of claims officer performance included reviews by a experienced officer of a small sample of claims regularly – this should be used as both a performance assessment and a development tool
0%
25%
50%
75%
100%
Target File Loads Actively MonitorFile Loads
StaffCompetencies
StaffPerformanceAssessment
RegularPerformance
Reviews
Sample FileReviews
Best Practice Above Satisfactory Element Ave "Good"
These results show that for most aspects of Resourcing, respondents considered that the industry is falling well short of the 60% standard. The two exceptions were ‘regular staff performance reviews’ and ‘use of sample file reviews’ which were rated at or close to the 60% benchmark. The remainder were rated best practice or above satisfactory by 25% to 30% of practitioners showing significant scope for improvement.

Benchmarking Liability Claims Management
16
Element 10 – Claims Systems Claims Systems are expected to be modern efficient systems (ie internet based) that are flexible and provide effective support to operational claims staff and management. The results and description of best practice for the Claims Systems element are summarised in Figure 5.10 below.
Figure 5.10 – Claims systems: Industry Assessment
Component Description of Best PracticeModern Efficient System Modern web-based claims system designed for the class of business (liability) and your
claims management model.Efficient Support System provides:
• Process / workflow support• Decision support• Interconnectivity to key providers
Process Measurement Key processes are measured to automatically identify claims approaching milestones or deadlines – with a view to ensuring the milestone or deadline is met
System Flexibility System flexible with minor changes straight forward - quick and inexpensive to implement
0%
25%
50%
75%
100%
Modern Efficient System Efficient Support Process Measurement System Flexibility
Best Practice Above Satisfactory Element Ave "Good"
The Claims Systems element has the lowest ratings of all the best practice elements with practitioners rating of all components being well below the “good” benchmark of 60%. There is clearly scope for substantial improvement across all aspects of Claims Systems.
Benchmarking Liability Claims Management
17
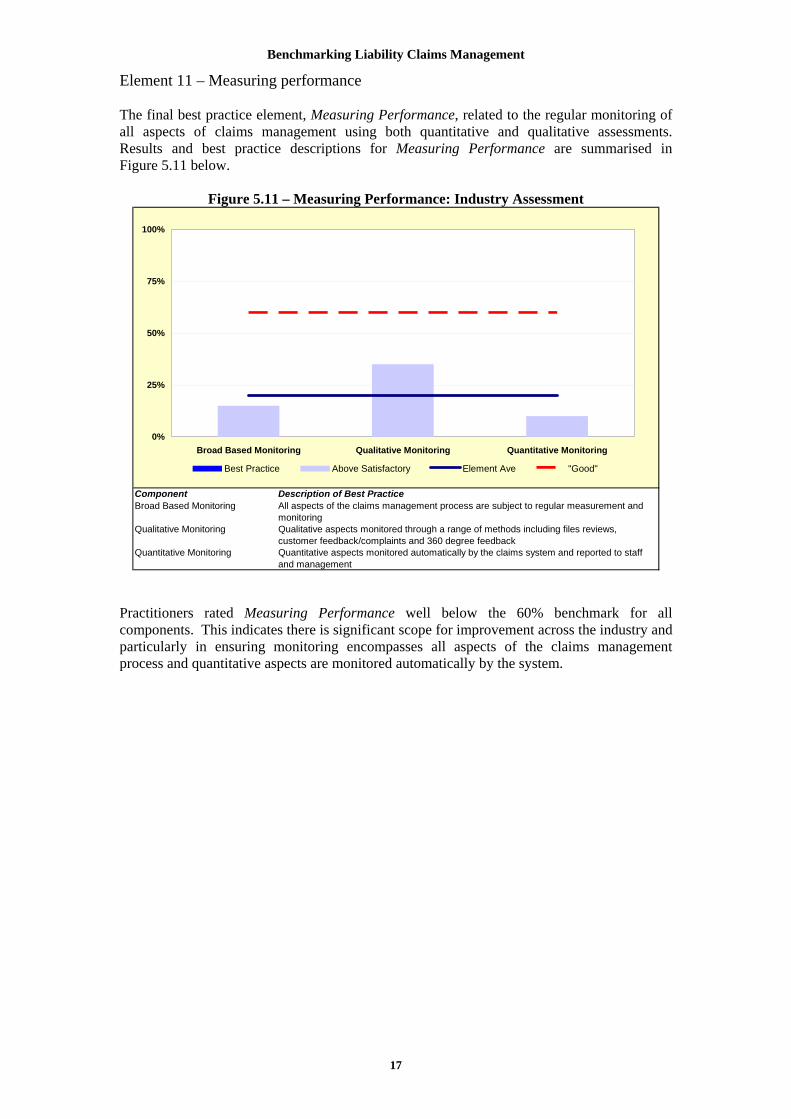
Element 11 – Measuring performance The final best practice element, Measuring Performance, related to the regular monitoring of all aspects of claims management using both quantitative and qualitative assessments. Results and best practice descriptions for Measuring Performance are summarised in Figure 5.11 below.
Figure 5.11 – Measuring Performance: Industry Assessment
Component Description of Best PracticeAll aspects of the claims management process are subject to regular measurement and monitoring
Qualitative Monitoring Qualitative aspects monitored through a range of methods including files reviews, customer feedback/complaints and 360 degree feedback
Quantitative Monitoring Quantitative aspects monitored automatically by the claims system and reported to staff and management
Broad Based Monitoring
0%
25%
50%
75%
100%
Broad Based Monitoring Qualitative Monitoring Quantitative Monitoring
Best Practice Above Satisfactory Element Ave "Good"
Practitioners rated Measuring Performance well below the 60% benchmark for all components. This indicates there is significant scope for improvement across the industry and particularly in ensuring monitoring encompasses all aspects of the claims management process and quantitative aspects are monitored automatically by the system.

Benchmarking Liability Claims Management
18
Summary The average results for all elements of best practice liability claims management are summarised below in Figure 5.12. The 60% benchmark for “good” industry performance is also included for reference.
Figure 5.12 – Summary of Industry Assessments
0% 10% 20% 30% 40% 50% 60% 70%
Claims Management Model
Early Claims Reporting
Triage and Segmentation
Timely Effective Communication
Reserving
Proactive Management
Identify and Address Outliers
Provider Management
Resourcing
Claims System
Measuring Performance
This shows that across the best practice elements there is a broad range of results. Identify and Address Outliers and Claims Systems are the elements with the lowest ratings. These areas have the greatest opportunity for significant improvements across the industry. It is also noted that none of the elements achieve the 60% “good” benchmark we have set which indicates there is scope for improvement across all aspects of liability claims management.

Benchmarking Liability Claims Management
19
6. Company Claims Management Performance In this section we present results of the assessment of individual company liability claim management operation relative to industry average. A small number of respondents considered they were unable to respond to these questions because they were not currently employed in a claims operation or because they considered this information confidential. For these reasons response numbers to these questions are less than the full 20 respondents. Respondents were asked to rate, across the eleven key best practice elements, liability claims management at their company relative to their assessment the industry average and the description we had provided of best practice. The rating scale used was as follows: a – Generally below industry average b – About industry average overall c – A mixture of industry average and higher than average d – Consistently higher than average e – Best practice. Figure 6.1 below combines and summarises the results for all responses and all of our elements of best practice. We have only included the overall summary as results were relatively consistent across all elements. Detailed results are included in Appendix B.
Figure 6.1 – Overall Self Assessment Results
0%
10%
20%
30%
40%
50%
Below IndustryAve
Industry Ave Mix of Ave /Better than Ave
ConsistentlyBetter than Ave
Best Practice
Only 20% of responses indicated their claims management operation was at or below industry average. This indicates a degree of bias in these self assessment ratings by claims managers. We sought in our analysis to allow for this bias and provide meaningful interpretation of the data. In interpreting these survey results our aim was to identify the extent to which individual insurers fell short of good/best practice across the different dimensions. We have defined the proportion falling below “Consistently Better than Average” and “Best Practice” as representing a “performance gap” – areas where there would be an a priori case for investment in improving the management approach. The results for each best practice element are summarised in Figure 6.2 below showing the proportion of respondents with a “performance gap” and the proportions with self assessments of “Consistently Better than Average” and “Best Practice”.

Benchmarking Liability Claims Management
20
Figure 6.2 – Best Practice Self Assessment
44%
50%
56%
61%
35%
33%
61%
56%
61%
83%
83%
0% 10% 20% 30% 40% 50% 60% 70% 80% 90% 100%
Claims Management Model
Early Claims Reporting
Triage and Segmentation
Timely Effective Communication
Reserving
Proactive Management
Identify and Address Outliers
Provider Management
Resourcing
Claims Systems
Measuring Performance
Performance Gap Consistently Better than Average Achieving Best Practice
These results show that the Claims Systems and Measuring Performance best practice elements have the largest proportion of claims managers who consider they are lagging behind industry leaders. Meaning that more insurers have to make up ground to be at, or near, current leading industry practice. Alternatively the small numbers of insurers performing well in these elements have a competitive advantage over a high proportion of their rivals. Conversely for the Reserving and Proactive Management best practice elements the majority of claims managers, around two thirds, are already at, or near, current leading industry practice. This indicates the performance differential in these elements across the industry is lower.

Benchmarking Liability Claims Management
21
7. Most Critical Best Practice Elements The survey asked for respondents to list which elements they considered the most critical in getting best practice claims outcomes, i.e. what do you need to get right first? Most of those surveyed listed one or more elements as outlined in Table 7.1 below.
Table 7.1 – Best Practice Elements Rated Most Critical
Most critical elements ResponsesProactive management ReservingResourcingTimely effective communication Claims management model Triage and segmentationMeasuring PerformanceProvider management Claims systems Identify and address outliersEarly claims reporting
332
5553
2111
The Figure 6.1 below compares the industry average for each best practice element to the importance of each element as shown in Table 7.1 above.
Figure 7.1 – Average Industry Rating and Rated Importance
0
1
2
3
4
5
6
0% 10% 20% 30% 40% 50% 60%
Average Element Rating
Rat
ed Im
port
ance
The trendline suggests there is some correlation between the average industry rating and the rated importance with those best practice elements with higher importance ratings tending to also have high performance score. This suggests, as might be expected, that the industry may have focused on improving its performance in those areas that it considers most important.

Benchmarking Liability Claims Management
22
8. Overall Conclusions Conclusions – Industry Performance There are a number of comments that can be made about these results. Firstly there is a large degree of variability in the assessment of “average” industry practice. We consider the primary reason for this is that respondents’ experience of the “industry”, in general, is narrow. As a result the assessments provided are in reality limited to: • A subset or industry niche • The companies where the respondent worked • The respondent’s current employer (we had one respondent who specifically commented
that they considered they felt unable to comment on practice outside their company). In general, most respondents rated themselves at or better than their peers (or the industry overall). Clearly this reflects a degree of bias. Perhaps the bias is partly a reflection of a respondents’ tendency to over-estimate their own performance and partly the lack of knowledge of the actual position of the industry (as discussed above). There are two conclusions we draw from these observations:
1. There is not generally a good or consistent understanding of the current performance of the industry as a whole by claims managers within liability line of business.
2. Claims managers are not necessarily well placed to objectively assess the
performance of their own claims operations relative to their peers Notwithstanding that many responses may be a greater reflection of individual insurer experiences (as opposed to broader industry experience) we consider the overall results to be representative as we have responses from the majority of the major liability insurers in Australia ie the responses are a fair representation of the market in any case.
3. There is significant scope for improvement in the quality of liability claims management across the industry.
As we have indicated previously, best practice claims management can deliver substantial claims cost savings to insurers. Based on our review the greatest opportunity for improvement is in the following areas (in priority order): • Identify and Address Outliers • Claims System • Measuring Performance • Claims Management Model • Proactive Management • Early Claims Reporting We also consider that some of these represent potential quick wins, and in particular, Proactive Management and Identify and Address Outliers, where nature of the improvements required are very much operational. From a management perspective it is always important to be in a position to know your relative performance against your peers and accepted good/best industry practice and to understand the nature and extent of any competitive advantages and disadvantages. It is also important to understand where to focus improvement initiatives to achieve the greatest return for effort.

Benchmarking Liability Claims Management
23
While in many cases, insurers may choose for many reasons, including budget constraints and capacity limitations, not to pursue “best” practice, these decisions should be conscious ones. That is decisions made with the knowledge of implications for their bottom line and their competitive position relative to the market. We consider, however, that all operations should be pursuing opportunities for improvement – any that do not risk stagnation and being left at a significant competitive disadvantage. For long tail classes of insurance, such as the liability classes, making assessments about current performance is difficult, particularly for insurance executives and claims managers, to undertake independently because of the lack of available data. A best practice framework provides a mechanism for identifying and prioritising improvement opportunities.
4. Insurers need to understand where their claims operations sit relative to best practice
Benchmarking studies, such as this one, are an important tool for assisting the industry and individual insurers understand evolving industry practice and best practice in liability claims management. Further benchmarking work in this area would assist to improve the knowledge of industry and individual insurer performance and to identify priority areas for improvement for insurers.
5. Further benchmarking would assist in improving knowledge of insurer performance and prioritising areas for improvement

Benchmarking Liability Claims Management
24
Appendices
A - Best Practice Liability Claims Management Survey
Instructions Please assess the performance of liability claims management across the whole of the industry based on your experience (ie not reflecting your company’s experience). Read the practice descriptions across the page and circle the description that fully describes the average or the most common claims management practice for the industry. Where there are elements of two descriptions select the mid‐point (eg if you consider there are elements of both “average” or “best” then circle the mid‐point between the two or 4).
Best Practice Questions Section 1: Claims Management Model
No.
Poor Satisfactory Best
1.1 Documentation 1 2 3 4 5
Limited claims documentation – reliant on individual expertise
Mid‐point
Claims documentation focused on processes ie claims manual – not on philosophy and approach
Mid‐point
Fully documented claims management model, providing guidance, direction and an overarching framework for claims staff
1.2 Outcome Focus 1 2 3 4 5
Claims management not focused
Mid‐point
Claims management focused on process and timeliness
Mid‐point
Claims management focused on outcomes and bottom line
1.3 Clarity of Expected Outcomes 1 2 3 4 5
Expected claims outcomes not clear
Mid‐point
Expected claims outcomes not documented but generally “understood”
Mid‐point
Expected claims outcomes documented and linked to performance standards for claims staff
1.4 Staff Performance Assessment 1 2 3 4 5
Staff performance assessment entirely subjective
Mid‐point
Staff performance assessment partly based on quantitative assessment but this is limited to process measures
Mid‐point
Staff performance assessment primarily based on assessment against these outcome focused standards
1.5 Consistency 1 2 3 4 5
Claims management approach varies significantly between individuals
Mid‐point
Claims management approach reasonably consistent between individuals in teams but some variation between branches/teams
Mid‐point
Claims management consistent across the class ‐ no significant variation between branch, team or individual
1.6 Training 1 2 3 4 5
Training on‐the‐job Mid‐point
Training of claims staff focused on process (eg claims manual & IT system)
Mid‐point
Claims management model forms the basis for claims staff training (induction & other)

Benchmarking Liability Claims Management
25
Section 2: Early Claims Reporting
No.
Poor Satisfactory Best
2.1 Promote Early Reporting 1 2 3 4 5 No emphasis on early
reporting Mid‐point
Reporting obligations in policy wording but not promoted
Mid‐point
Early claims (and potential claims) reporting actively promoted to front‐line staff, policyholders and brokers.
2.2 Monitor Reporting Delays 1 2 3 4 5 No monitoring of
reporting delays Mid‐point
Reporting delays between date of loss and report monitored but issue rarely raised with policyholder/broker
Mid‐point
Reporting delays (from time of loss and time policyholder was aware) monitored – policyholders/brokers with significant delays followed‐up
2.3 Systems to Facilitate Reporting 1 2 3 4 5 Rely on formal lodgement
of a claim on the policyholder and the policyholder forwarding that to you in due course
Mid‐point
Rely on policyholder for advice of a claim or potential claim
Mid‐point
Systems in place to facilitate reporting of claims and potential claims, ie including in advance of a formal claim where liability is apparent
Section 3: Triage and Segmentation
No.
Poor Satisfactory Best
3.1 Initial triage and Segmentation 1 2 3 4 5 No segmentation or triage Mid‐
point Some segmentation but effectively only by estimate size
Mid‐point
Claims segmented according to apparent severity and complexity at initial triage/assessment
3.2 Allocation according to Segment 1 2 3 4 5 No attempt to allocate
claims on the basis of staff capability or capacity ‐ allocation random or client based
Mid‐point
Manual allocation (by, say team leader) taking account some capability / capacity factors
Mid‐point
Claims allocated to staff on the basis of capability and capacity
3.3 Regular Reassessment of Segmentation 1 2 3 4 5 No reassessment of claims
segmentation Mid‐point
Reassessments haphazard and not formalised – largely triggered by a significant change in estimate
Mid‐point
Claims reassessed regularly to identify changes in category (particularly claims becoming more severe / complex)
3.4 Formalised Mentoring Process 1 2 3 4 5 Seeking assistance
passively discouraged (ie it seen as the claims officer demonstrating a lack of knowledge or capability)
Mid‐point
Assistance encouraged but generally dependent on the claims officer seeking it
Mid‐point
Formalised mentoring processes and/or team workshops established to assist in managing the most difficult claims and developing staff)

Benchmarking Liability Claims Management
26
Section 4: Timely Effective Communication
No.
Poor Satisfactory Best
4.1 Early Contact 1 2 3 4 5 Initial communication
irregular and usually formal
Mid‐point
Early communication encouraged but largely conducted as a process (not focused on any particular outcome)
Mid‐point
Early contact with policyholder and claimant (if unlitigated) to establish and manage expectations and any issues before they become entrenched
4.2 Regular Systematic Communication 1 2 3 4 5 Communication irregular
and usually formal Mid‐point
Regular communication encouraged but little available to support systematic approach (or left to the individual claims officer)
Mid‐point
Systematic approach to communication with regular updates
4.3 Simple Clear Language 1 2 3 4 5 Language used legalistic
and formal (with significant insurance jargon)
Mid‐point
Some use of plain English in standard documentation but other communication contain significant jargon and legalistic
Mid‐point
Language used in all communication (written and oral) designed for use of understanding by the reader eg plain English and minimal jargon
Section 5: Reserving
No.
Poor Satisfactory Best
5.1 Reserving Policy 1 2 3 4 5 Estimates required but no
formal policy documented Mid‐point
Reserving policy documented based on experience
Mid‐point
Documented reserving policy established based on experience and analysis (and tested against outstanding claim valuations)
5.2 Initial Estimates and Regular Reviews 1 2 3 4 5 Estimates required but
reviews haphazard and currency of estimates questionable
Mid‐point
Initial estimates and regular reviews required but not consistently applied and generally less frequent than 3 monthly
Mid‐point
Initial estimate placed on the claim upon receipt and regularly reviewed following receipt of additional information or at least every 3 months
5.3 Legal Advisers 1 2 3 4 5 Legal advisers rely on their
judgement to advise on case estimates providing an overall figure with little on detail on their calculations
Mid‐point
Legal advisers provide estimates with detailed calculations (but not necessarily consistent with your reserving policy)
Mid‐point
Legal advisers providing case estimates are trained in your reserving policy and provide estimates consistent with the policy (including detailed calculations)
5.4 Consistent Application 1 2 3 4 5 Reserving practice varies
by individual claims officer
Mid‐point
Reserving policy usually applied but consistency not verified or assured
Mid‐point
Reserving policy consistently applied in all cases and consistent application verified through file reviews
Benchmarking Liability Claims Management
27
Section 6: Proactive Management
No.
Poor Satisfactory Best
6.1 Individual Claims Management Strategy 1 2 3 4 5 Strategies not documented
nor clear (in the claims officers mind)
Mid‐point
Documented claims management strategies limited to recommendations in advice from legal or other providers
Mid‐point
Establishing (and documenting) a claims management strategy for all significant claims as soon as practical (within 6 to 8 weeks for liability)
6.2 Strategies Outcome Focused 1 2 3 4 5 The target outcome not
clear and next steps dependent on and reacting to claimant and/or provider input
Mid‐point
General approach understood but not documented nor claim specific and focus more on next steps rather than outcomes
Mid‐point
Claims management strategy set by the claims officer and to encompass • An approach on indemnity
and liability issues • Need for further
investigations or legal advice
• Target or desired outcome • Steps proposed to achieve
that outcome 6.3 Active Approach 1 2 3 4 5
Management reactive Mid‐point
Management active but more to a timetable than an outcome
Mid‐point
Active management to the target outcome,
6.4 Regular Review of the Strategy 1 2 3 4 5
Reviews haphazard – significant gaps without any apparent activity evident
Mid‐point
Regular reviews occurring but strategy (and target outcome) not reassessed
Mid‐point
Strategy regularly reviewed – (say) every 6 months or following a significant change in circumstances
6.5 Claims Officer Primarily Responsible 1 2 3 4 5
High dependence on providers and in particular legal providers for all but simple claims. Legal providers effectively managing these claims ie claims officer only ever acts on legal advice
Mid‐point
Significant dependence on providers for complex claims particularly for determining strategy
Mid‐point
Use of investigators, legal and other providers as appropriate to assist with strategy and execution (but scope of work determined by claims officer) and responsibility for management of the claim retained by the claims officer at all times
Benchmarking Liability Claims Management
28
Section 7: Identify and Address Outlying Claims (ie claims not behaving as expected)
No.
Poor Satisfactory Best
7.1 Identify and Address Outliers 1 2 3 4 5 No process in place for
identifying claims not progressing to plan
Mid‐point
Processes for identifying claims not progressing to plan essentially reactive
Mid‐point
Identify claims not progressing to targeted outcomes (ie “falling through the cracks”), reassess strategy, targeted outcomes and resourcing to address emerging issues
7.2 Continuous Sweeps for Outliers 1 2 3 4 5 Problematic claims only
identified after the problems become entrenched
Mid‐point
Identification of outliers left largely to the individual claims officer
Mid‐point
Continuously sweep portfolio for emerging outliers
Section 8: Provider Management
No.
Poor Satisfactory Best
8.1 Provider Selection 1 2 3 4 5 No formal panel ‐
providers are selected by the claims officer
Mid‐point
Provider panels formally in place but panels are generalist and ongoing (ie no formal review process)
Mid‐point
Provider panels are selected through open process based on skills, experience, service levels and value for money with designated specialist skills
8.2 Provider Contract 1 2 3 4 5 No formal agreements in
place or rely on provider standard terms and conditions
Mid‐point
Formal provider contracts in place, possibly with some service level requirements, but not outcome focused nor aligned with your claims management model
Mid‐point
Provider contracts have clearly defined objectives, target outcomes and service level agreements all aligned with your claims management model
8.3 Provider Fees 1 2 3 4 5 Provider fees are hourly
rates
Mid‐point
Provider fees are fixed prices for specific services
Mid‐point
Provider fees are(significantly) outcome based
8.4 Allocation of Work 1 2 3 4 5 Files allocated by claims
officers based on their preferences with an open ended brief
Mid‐point
Files allocated to providers from panel with consideration of specialist skills but brief tends to be open ended
Mid‐point
Providers are allocated specialist and specific tasks (within their designated specialist skills area) by the claims officer
8.5 Performance Management 1 2 3 4 5 No formal performance
monitoring of providers (other than subjectively by the claims officer in selecting providers)
Mid‐point
Provider performance monitoring focuses on service levels
Mid‐point
Provider performance is reviewed regularly (6 monthly) including assessment against agreed target outcomes and service standards (and non‐performing providers actively managed then removed from the panel)

Benchmarking Liability Claims Management
29
Section 9: Resourcing
No.
Poor Satisfactory Best
9.1 Target File Loads 1 2 3 4 5 No target file load
established Mid‐point
Target file loads established but not necessarily applied (ie enforced) or are not specific (ie only averages). Targets are often over‐ridden for example if there is a desire to reduce expenses
Mid‐point
Target file loads designed to enable all claims officers to actively manage claims consistent with your claims management model are established and applied for each (type of) claims officer and applied
9.2 Actively Monitor File Loads 1 2 3 4 5 Workloads determined
subjectively Mid‐point
File loads monitored but unforced adjustments rare (eg other than when someone leaves)
Mid‐point
File loads are actively monitored and adjustments made to ensure they remain within target levels
9.3 Competencies 1 2 3 4 5 Required skills for claims
staff not documented Mid‐point
Position descriptions focus on duties with general statements of skills required
Mid‐point
Competencies / capabilities for all claims roles are clearly defined and staff are selected for these roles on the basis of having the relevant skills
9.4 Staff Performance Assessment 1 2 3 4 5 Staff performance is
determined subjectively Mid‐point
Staff performance incorporates some objective elements but overall depends on supervisors judgement
Mid‐point
Staff performance is assessed against the • Delivery to target outcomes
(per claims management strategies)
• Meeting required competencies
• Meeting processing timeframes
9.5 Regular Performance Reviews 1 2 3 4 5 Limited or no formal
performance review process
Mid‐point
Formal annual performance review but otherwise informal or irregular
Mid‐point
Formal performance reviews occur regularly (at least quarterly)
9.6 Sample File Reviews 1 2 3 4 5 No file reviews by senior
staff Mid‐point
Irregular file reviews (eg spot checks) and incorporated into performance assessment subjectively
Mid‐point
Assessment of claims officer performance included reviews by a experienced officer of a small sample of claims regularly – this should be used as both a performance assessment and a development tool
Benchmarking Liability Claims Management
30
Section 10: Claims Systems
No.
Poor Satisfactory Best
10.1 Modern Efficient System 1 2 3 4 5 Old legacy mainframe
system Mid‐point
Legacy mainframe with more modern front end
Mid‐point
Modern web‐based claims system designed for the class of business (liability) and your claims management model.
10.2 Efficient Support 1 2 3 4 5 Little or no value‐add
support Mid‐point
Provides some process and workflow support
Mid‐point
System provides: • Process / workflow
support • Decision support • Interconnectivity to key
providers
10.3 Process Measurement 1 2 3 4 5 Process measurement
generally not supported Mid‐point
Some process measurements (usually linked to front‐end system)
Mid‐point
Key processes are measured to automatically identify claims approaching milestones or deadlines – with a view to ensuring the milestone or deadline is met
10.4 Flexibility 1 2 3 4 5 Any system change needs
major change process requiring considerable time and effort
Mid‐point
Front end more flexible but issues with legacy mainframe remain
Mid‐point
System flexible with minor changes straight forward ‐ quick and inexpensive to implement
Section 11: Measuring Performance
No.
Poor Satisfactory Best
11.1 Broad based Monitoring 1 2 3 4 5 Little or no monitoring of
processes (usually not supported by the system)
Mid‐point
Monitoring partially implemented
Mid‐point
All aspects of the claims management process are subject to regular measurement and monitoring
11.2 Qualitative Monitoring 1 2 3 4 5 Qualitative monitoring
based on subjective assessment by supervisor
Mid‐point
Emerging introduction of (some of) file reviews, customer feedback, complaints and 360 degree feedback but largely focused on compliance
Mid‐point
Qualitative aspects monitored through a range of methods including files reviews, customer feedback/complaints and 360 degree feedback
11.3 Quantitative Monitoring 1 2 3 4 5 Limited quantitative
monitoring – generally not supported by the claims system and needs to be done manually
Mid‐point
Emerging introduction of automated monitoring but largely used as a compliance tool
Mid‐point
Quantitative aspects monitored automatically by the claims system and reported to staff and management

Benchmarking Liability Claims Management
31
Other Questions Q12: How would you generally rate claims management at your company relative to
industry average (across each of the key best practice elements)? a) Generally below industry average b) About industry average overall c) A mixture of industry average and higher than average d) Consistently higher than average e) Best Practice
Best Practice Area
Rating (circle one)
1. Claims Management Model
a b c d e
2. Early Claims Reporting
a b c d e
3. Triage and Segmentation
a b c d e
4. Timely Effective Communication
a b c d e
5. Reserving
a b c d e
6. Proactive Management
a b c d e
7. Identify and Address Outliers
a b c d e
8. Provider Management
a b c d e
9. Resourcing
a b c d e
10. Claims Systems
a b c d e
11. Measuring Performance a b c d e Q13: Are there any significant best practice elements you consider missing? Q14: Are there any significant best practice elements listed above that should not be
included? Q15: Which element do you consider most critical in getting best practice claims
outcomes? What do you need to get “right” first?

Benchmarking Liability Claims Management
32
B - Detailed survey response data B.1 Question 1 to Question 11 - detailed data
Question No. 1 2 3 4 5 Ave Median SDQ1.1 1 3 14 2 0 2.85 3 0.67Q1.2 0 1 7 11 1 3.60 4 0.68Q1.3 0 5 9 6 0 3.05 3 0.76Q1.4 1 3 11 5 0 3.00 3 0.79Q1.5 2 7 9 1 1 2.60 3 0.94Q1.6 0 6 10 4 0 2.90 3 0.72Q2.1 0 1 12 5 2 3.40 3 0.75Q2.2 3 3 5 8 1 3.05 3 1.19Q2.3 3 1 12 3 1 2.90 3 1.02Q3.1 2 1 9 5 3 3.30 3 1.13Q3.2 1 0 4 12 3 3.80 4 0.89Q3.3 0 2 9 6 3 3.50 3 0.89Q3.4 0 2 12 5 1 3.25 3 0.72Q4.1 2 0 8 8 2 3.40 3.5 1.05Q4.2 2 1 11 5 1 3.10 3 0.97Q4.3 2 1 7 7 3 3.40 3.5 1.14Q5.1 0 2 6 8 3 3.63 4 0.90Q5.2 0 1 7 8 3 3.68 4 0.82Q5.3 0 1 10 5 3 3.53 3 0.84Q5.4 0 1 6 9 3 3.74 4 0.81Q6.1 1 1 10 6 2 3.35 3 0.93Q6.2 1 1 10 5 3 3.40 3 0.99Q6.3 2 3 10 4 1 2.95 3 1.00Q6.4 2 2 7 7 2 3.25 3 1.12Q6.5 1 6 10 1 2 2.85 3 0.99Q7.1 3 6 10 1 0 2.45 3 0.83Q7.2 3 6 9 2 0 2.50 3 0.89Q8.1 0 1 5 7 5 3.89 4 0.90Q8.2 0 2 5 8 3 3.67 4 0.91Q8.3 7 4 4 3 0 2.17 2 1.15Q8.4 0 1 8 6 2 3.53 3 0.80Q8.5 1 3 10 3 0 2.88 3 0.78Q9.1 0 4 10 4 2 3.20 3 0.89Q9.2 2 2 10 3 3 3.15 3 1.14Q9.3 1 2 10 5 2 3.25 3 0.97Q9.4 0 1 14 5 0 3.20 3 0.52Q9.5 1 1 6 11 1 3.50 4 0.89Q9.6 0 1 8 7 4 3.70 4 0.86Q10.1 3 5 9 3 0 2.60 3 0.94Q10.2 4 6 7 2 1 2.50 2.5 1.10Q10.3 5 6 6 3 0 2.35 2 1.04Q10.4 5 6 7 2 0 2.30 2 0.98Q11.1 3 3 11 3 0 2.70 3 0.92Q11.2 2 3 8 7 0 3.00 3 0.97Q11.3 4 4 10 2 0 2.50 3 0.95

Benchmarking Liability Claims Management
33
B.2 Question 12 - detailed data
Below industry ave Industry ave
Mix of ave / higher than ave
Consistently higher than ave
Best Practice
Claims Management Model 0 0 8 9 1Early Claims Reporting 0 5 4 8 1Triage and Segmentation 0 3 7 7 1Timely Effective Communication 0 3 8 5 2Reserving 0 2 4 8 3Proactive Management 0 1 5 12 0Identify and Address Outliers 1 6 4 7 0Provider Management 0 0 9 6 1Resourcing 0 2 9 6 1Claims Systems 2 9 4 2 1Measuring Performance 0 5 10 2 1