
Benchmarking Campus Communications and …Benchmarking Campus Communications and Marketing Programs...
48
CASE White Paper Council for Advancement and Support of Education Prepared by Lindy Brounley, University of Florida August 2010 Benchmarking Campus Communications and Marketing Programs A Look at Policies, Structures, Tools and Audiences
Transcript of Benchmarking Campus Communications and …Benchmarking Campus Communications and Marketing Programs...

CASE White Paper Council for Advancement and Support of Education
Prepared byLindy Brounley, University of Florida
August 2010
Benchmarking Campus Communications and Marketing Programs
A Look at Policies, Structures, Tools and Audiences
COUNCIL FOR ADVANCEMENT AND SUPPORT OF EDUCATION1307 New York Avenue, NWSuite 1000Washington, DC 20005-4701www.case.org
CASE EUROPE3rd Floor, Paxton House30 Artillery LaneLondon E1 7LSUnited Kingdom
CASE ASIA-PACIFICUnit 05-03 Shaw Foundation Alumni House 11 Kent Ridge Drive Singapore 119244
ACknowledgMents
With thanks to members of the University of Florida Best Practices Subcommittee: Lindy Brounley, chair, associate director, communications, Levin College of Law; Sharon Blansett, assistant director, housing research and organizational development, Division of Housing; Florida Bridgewater-Alford, director, community relations, University Relations; Tracy Brown-Wright, director, communications, College of Nursing; Sarah Carey, director, public relations, College of Veterinary Medicine; Megan Gales, director, communications, College of Engineering; Larry Lansford, director, news and communications, College of Education; Katherine Kinsley-Momberger, art director, Explore Magazine, Division of Research and Graduate Education; Liesl O’Dell, associate director, publications, UF Foundation; Jill Pease, director, communications, College of Public Health and Health Professions; Jeff Stevens, webmaster, graphic artist and writer, College of Liberal Arts and Sciences; Christine Velasquez, coordinator, publications, Health Science Center
© 2010 University of Florida. All rights reserved. No part of the material in this document may be reproduced or used in any form, electronic or mechanical, including photocopying, recording, posting or distributing, or by any information storage and retrieval system, without the written consent of the copyright holder.

3
Benchmarking Campus Communications and Marketing Programs © 2010 University of Florida
Contents
Introduction 5
About the Survey 5
Methodology 5
Findings 6
Strategic Messaging 6
Identity Standards 8
Perceived Effectiveness of Campus Communication 9
Barriers to Communications 12
Communications Structures 13
Communications Channels and Frequency by Targeted Audience 13
Perceived effectiveness of Communications Channels 14
Monitoring Effectiveness of Communications Activities 15
Conclusion 15
Appendixes
A. Survey Instrument 17
B. Survey Data Summary 30
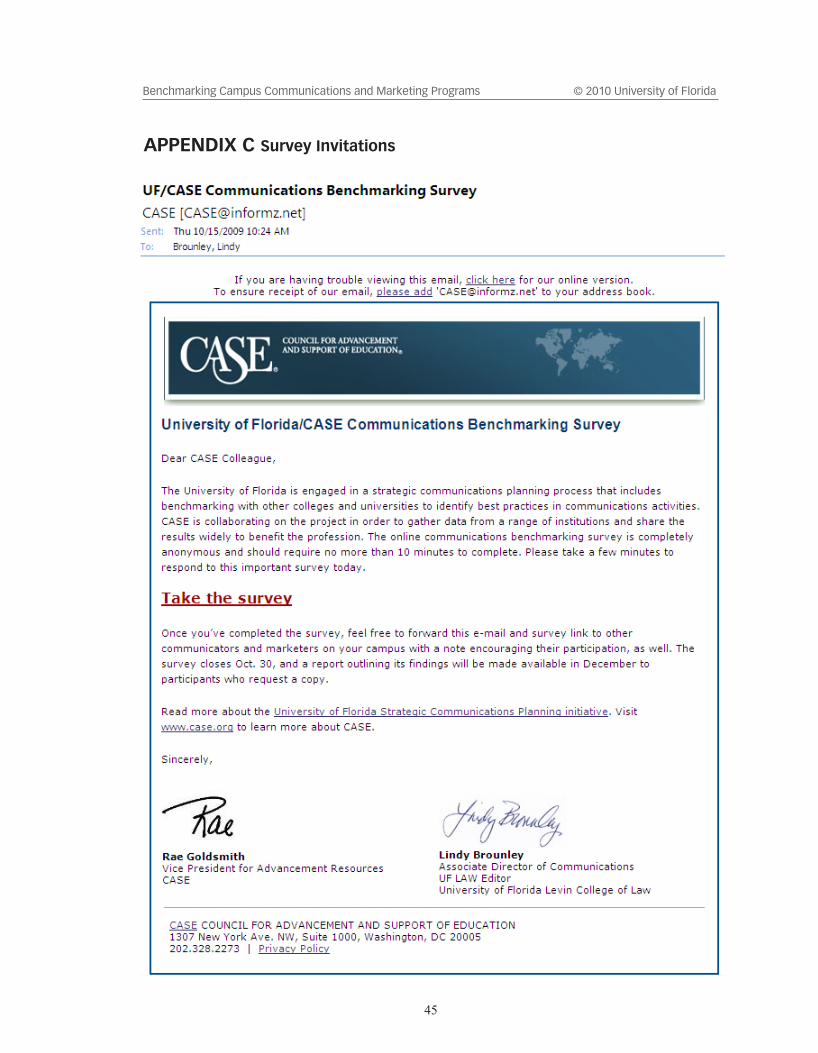
C. Survey Invitations 45
About the University of Florida 48
About CASE 48
4
Benchmarking Campus Communications and Marketing Programs © 2010 University of Florida
Figures
1. At a Glance 6
2. Strategic Messaging 7
3. Identity Standards 8
4. Communications Structure 9
5. Effectiveness of Communications Activities at Institutional and Unit 11 Levels as Ranked by Institutional- and Unit-Level Communicators
6. Institutional Communications Structures Based on Aggregate Responses 13
7. Communications Structure Based on Respondents Sorted by Size 13
8. Percentage of Respondents Engaged in Various Communications Activities 14
9. Frequency of Communications Ranked by Target Audience 14
10. Perceived Effectiveness of Communications Channels by Target Audience 15
11. Monitoring Effectiveness 15

5
Benchmarking Campus Communications and Marketing Programs © 2010 University of Florida
introduCtion
About the survey
The University of Florida, concerned by a perceived lack of continuity and coordination of the various communications efforts across a large and diverse campus, established a Strategic Com-munications Planning Committee in May 2009. The goals of the committee were to—
Coordinate a campuswide effort to promote strategic communications planning,•Strengthen the university’s brand,•Unify key themes and messages,•Maximize use of available research and resources, and •Identify and propagate best practices and cost-effective communications strategies.•
To address the last goal, the committee formed a best practices subcommittee, which con-ducted benchmarking research on academic communications activities to help university admin-istrators and communicators understand current and best practices in terms of effectiveness and best use of resources.
With this goal in mind, a representative of the subcommittee contacted CASE to propose a partnership: the university would lead the drafting of a communications benchmarking survey and CASE would promote participation by sending it to CASE members. CASE readily agreed to the proposal with the understanding that any resulting data would be equally shared by UF and CASE.
Thiswhitepaperreportsonthehigh-levelfindingsoftheUF/CASEsurvey.
Methodology
The survey was developed by the University of Florida, with input from CASE, using the online survey service SurveyMonkey.com. See Appendix A for the complete survey instrument.
CASE distributed the survey by e-mail to its members at higher education institutions in the United States whose titles included one or more of the following identifying words: communica-tions, marketing, university relations, director (or any title above director), advertising, public affairs, manager, publications, electronic, web, media and news. Survey distribution followed this timeline:
Oct. 15, 2009—E-mail launch to 6,754 e-mail addresses drawn from the CASE database, •resulting in 444 completed surveys out of 729 respondents who entered the survey.
Oct. 19, 2009—Post to CASE University Editors (CUE) listserv, resulting in 86 respondents. •Oct. 20, 2009—Invitation in e-mailed • BriefCASE, resulting in 28 respondents.Oct. 26, 2009—Reminder e-mail to the Oct. 15 distribution list.•
6
Benchmarking Campus Communications and Marketing Programs © 2010 University of Florida
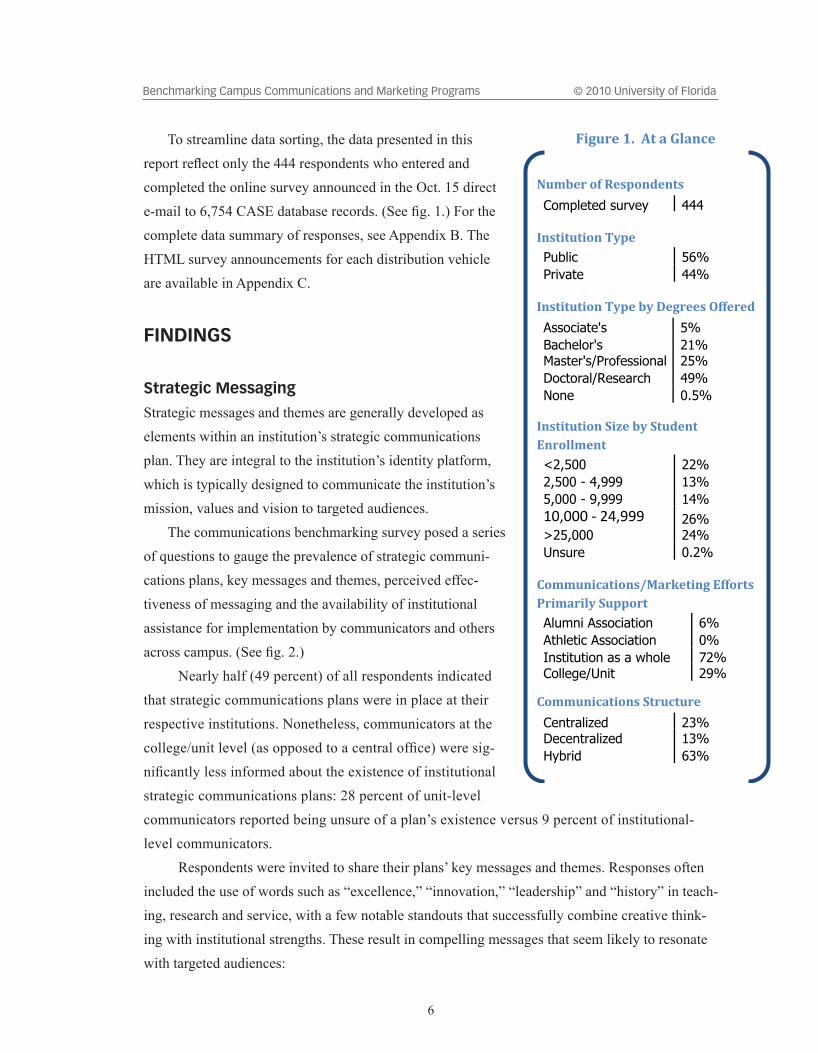
To streamline data sorting, the data presented in this reportreflectonlythe444respondentswhoenteredandcompleted the online survey announced in the Oct. 15 direct e-mailto6,754CASEdatabaserecords.(Seefig.1.)Forthecomplete data summary of responses, see Appendix B. The HTML survey announcements for each distribution vehicle are available in Appendix C.
Findings
strategic Messaging
Strategic messages and themes are generally developed as elements within an institution’s strategic communications plan. They are integral to the institution’s identity platform, which is typically designed to communicate the institution’s mission, values and vision to targeted audiences.
The communications benchmarking survey posed a series of questions to gauge the prevalence of strategic communi-cations plans, key messages and themes, perceived effec-tiveness of messaging and the availability of institutional assistance for implementation by communicators and others acrosscampus.(Seefig.2.)
Nearly half (49 percent) of all respondents indicated that strategic communications plans were in place at their respective institutions. Nonetheless, communicators at the college/unitlevel(asopposedtoacentraloffice)weresig-nificantlylessinformedabouttheexistenceofinstitutionalstrategic communications plans: 28 percent of unit-level communicators reported being unsure of a plan’s existence versus 9 percent of institutional-level communicators.
Respondents were invited to share their plans’ key messages and themes. Responses often included the use of words such as “excellence,” “innovation,” “leadership” and “history” in teach-ing, research and service, with a few notable standouts that successfully combine creative think-ing with institutional strengths. These result in compelling messages that seem likely to resonate with targeted audiences:
!"#$%&'()'*%+,(-.%-/+'
Completed survey 444 '
0-+/1/"/1(-'23,%'
Public 56%
Private 44% '
0-+/1/"/1(-'23,%'$3'4%5&%%+'6))%&%.'
Associate's 5%
Bachelor's 21% Master's/Professional 25%
Doctoral/Research 49%
None 0.5%
0-+/1/"/1(-'718%'$3'7/".%-/'
9-&(::#%-/'
<2,500 22%
2,500 - 4,999 13%
5,000 - 9,999 14%
!"#"""$%$&'#((($ 26% >25,000 24%
Unsure 0.2% '
;(##"-1<=/1(-+>?=&@%/1-5'9))(&/+'
A&1#=&1:3'7",,(&/'
Alumni Association 6%
Athletic Association 0%
Institution as a whole 72% College/Unit 29%
;(##"-1<=/1(-+'7/&"</"&%'
Centralized 23% Decentralized 13%
Hybrid 63%
!
B15"&%'CD''E/'='F:=-<%'
$

7
Benchmarking Campus Communications and Marketing Programs © 2010 University of Florida
“Pacific is Personal. Life Unfolds at Pacific. Tradition •with Texture.”
“Engaging the culture, changing the world. Can a •University change the world? The place where world change begins.”
“UMass Boston is a ‘research university with a teaching •soul.’ UMass Boston’s urban location is a key part of the student experience.”
“Freedom to Flourish. We Are/I Am/This is Knox. Schol-•ar-Teachers Make a Statement, Make a Difference, You Make Knox.”
“Better living for all. Place with a purpose. America’s •Natural Resources University. Solving Global Problems. Leading the Green Revolution. Inventions that Serve the Public Good. Living the Land Grant Mission.”
Not surprisingly, institutions blessed with appealing loca-tions stressed “location, location, location” in strategic messag-ing to external audiences. Institutions with specialized missions or strengths sought to emphasize those aspects of their campus cultures, whether they focused on workforce preparation (a two-year institution), faith-based education, educating students for university transfer or, for smaller institutions, the strength of niche program offerings. Few mixed athletics with academics, and key messages or themes rarely mentioned athletics at all.
To assist with consistency in key messaging at the unit level, many institutions indicated that they offer web and publication templates, online FAQs and staff assistance. Respondents offered examples of other tools and tactics institutions use to strengthen consistent application of key messages and themes, including:
“Brand sheet with approximately 60 words, phrases and •text that can be using in talking points and written material.”
“We meet weekly in a ‘Communicators Council’ to keep all informed, and provided a brand •‘kit’ after our most recent research project and graphic identity revisions.”
“Mission statement, emphasis on speaking with ‘one voice’ from administrators on down. •Key messages repeated CONSTANTLY.”
Web templates 79%
Broch. templates 35%
Pub. templates 41%
Online FAQ 40%
Staff assistance 91%
Examples 40% !
!
!
!
"#$%!&#'(!)*%+)+'+)#*!,-.$!-!%+(-+$/)0!0#11'*)0-+)#*%!23-*4!
Yes 49%
No 36%
Unsure 14% !
"#$%!&#'(!)*%+)+'+)#*!,-.$!
03$-(3&!-(+)0'3-+$5!6$&!1$%%-/$%4!
Yes 64% No 28%
Unsure 8% !
7%!&#'(!)*%+)+'+)#*!$88$0+).$!)*!
0#11'*)0-+)*/!)+%!6$&!1$%%-/$%!
+#!)*+$(*-3!-'5)$*0$%4!
Effective 25%
Somewhat effective 67% Not effective 7% !
7%!&#'(!)*%+)+'+)#*!$88$0+).$!)*!
0#11'*)0-+)*/!)+%!6$&!1$%%-/$%!
+#!$9+$(*-3!-'5)$*0$%4!
Effective 30%
Somewhat effective 63%
Not effective 4% !
7*%+)+'+)#*-3!($%#'(0$%!-.-)3-:3$!
+#!-)5!'*)+%!;)+,!0#123)-*0$!
Web templates 79%
Broch. templates 35%
Pub. templates 41%
Online FAQ 40%
Staff assistance 91%
Examples 40%
!
<)/'($!=>!?+(-+$/)0!
@$%%-/)*/!

8
Benchmarking Campus Communications and Marketing Programs © 2010 University of Florida
“Use office of communication staff to help identify key messages and reinforce those mes-•sages with communicators and others across campus. Show previous work reflecting how integration of messages/colors/logo is effective at raising awareness.”
“We provide ‘crib sheets’ to almost everyone in terms of ways they can insert our key •messages into whatever they are doing. We also work personally with them. Again, being small, we can do lots of stuff one-on-one.”
“We have quarterly meetings where publications/bro-•chures/messages are shown/discussed.”
“Yes, though selectively. Many members of our commu-•nity, which prides [itself] on being anti-establishment, are skeptical about messaging. We work to influence the way in which they tell their stories without specifically addressing key messages.”
Thefinalquoteisindicativeoftherealityofcoordinatingconsistent strategic messaging at many institutions. Essentially, it asserts the perceived “ground truth” of unavoidable, but not insurmountable, challenges in coordinating communications activities at some academic institutions.
identity standards
An institution’s identity standards are the graphic elements of its identity platform. Identity standards should immediately commu-nicate the institution’s name, purpose and graphic representation withthegoalofpresentingaunifiedimpressionoftheinstitutionto its constituents. Identity standards typically establish an insti-tution’s graphic identity through guidelines on where and how to use the institution’s logo, approved color palettes and typefaces, and stipulations regarding the use of design templates for letter-head, business cards, and sometimes web pages, brochures and other common materials. (To view UF’s identity standards, visit http://identity.ufl.edu/)
The vast majority of survey respondents (96 percent) indi-cated that their institutions have established identity standards. (Seefig.3.)Despitethewidespreadpresenceofinstitutionalidentity standards, the communication of those standards to the
Not monitored 58%
Surveys 6%
Audits 39%
!
!
!
!
"#$%!&#'(!)*%+)+'+)#*!,-.$!
/')0$1)*$%!#(!)0$*+)+&!
%+-*0-(0%2!
Yes 95.7%
No 3.8%
Unsure .05% !
3-%!&#'(!)*%+)+'+)#*!4$$*!
$55$6+).$!)*!6#77'*)6-+)*/!)+%!
)0$*+)+&!%+-*0-(0%!+#!+,$!
6-78'%!6#77'*)+&2!
Effective 30%
Somewhat effective 59% Not effective 11% !
"#!6#77'*)6-+#(%!-0,$($!+#!
+,$!)0$*+)+&!%+-*0-(0%2!
Often 52% Sometimes 44%
Rarely 3% !
9%!6#781)-*6$!:)+,!+,$!)0$*+)+&!
%+-*0-(0%!$*5#(6$02!
Yes 46%
No 39%
Unsure 15% !
3#:!-($!#.$(-11!-:-($*$%%!#5!
-*0!6#781)-*6$!:)+,!+,$!
)0$*+)+&!%+-*0-(0%!7#*)+#($02!
Not monitored 58%
Surveys 6%
Audits 39%
79.0%
35.4%
40.6%
39.9% 90.8%
39.9%
!
;)/'($!<=!90$*+)+&!
>+-*0-(0%!
9
Benchmarking Campus Communications and Marketing Programs © 2010 University of Florida
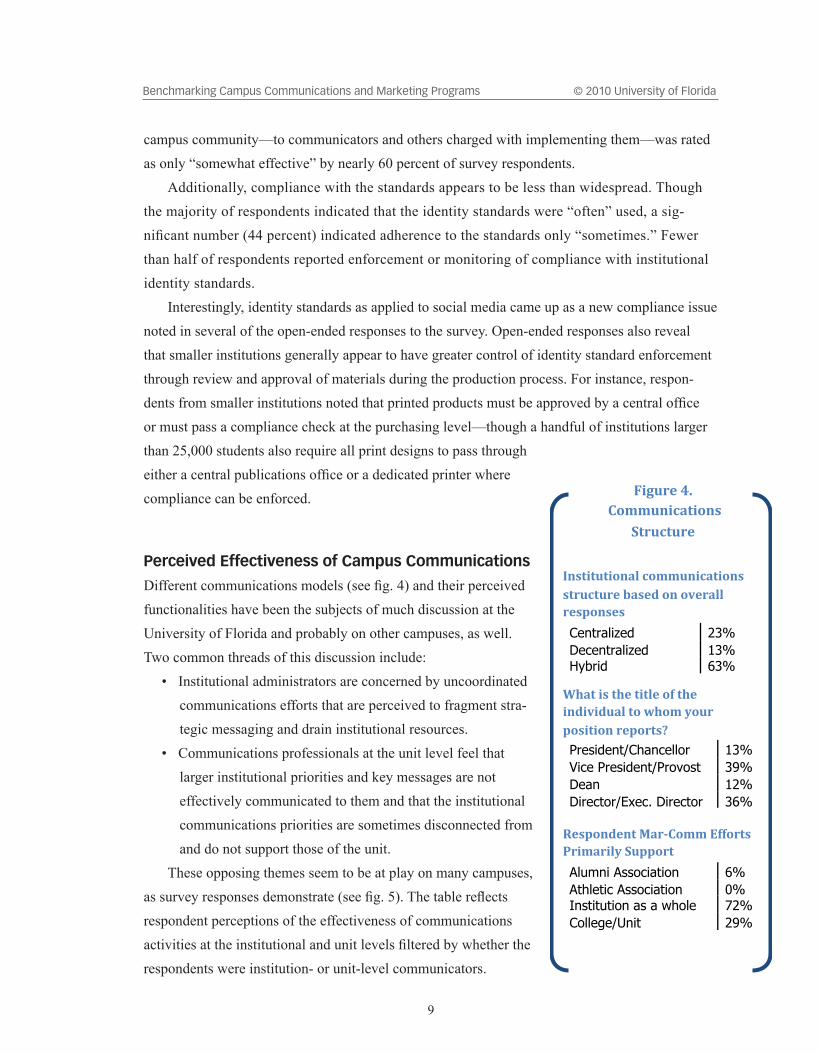
campus community—to communicators and others charged with implementing them—was rated as only “somewhat effective” by nearly 60 percent of survey respondents.
Additionally, compliance with the standards appears to be less than widespread. Though the majority of respondents indicated that the identity standards were “often” used, a sig-nificantnumber(44percent)indicatedadherencetothestandardsonly“sometimes.”Fewerthan half of respondents reported enforcement or monitoring of compliance with institutional identity standards.
Interestingly, identity standards as applied to social media came up as a new compliance issue noted in several of the open-ended responses to the survey. Open-ended responses also reveal that smaller institutions generally appear to have greater control of identity standard enforcement through review and approval of materials during the production process. For instance, respon-dentsfromsmallerinstitutionsnotedthatprintedproductsmustbeapprovedbyacentralofficeor must pass a compliance check at the purchasing level—though a handful of institutions larger than 25,000 students also require all print designs to pass through eitheracentralpublicationsofficeoradedicatedprinterwherecompliance can be enforced.
Perceived effectiveness of Campus Communications
Differentcommunicationsmodels(seefig.4)andtheirperceivedfunctionalities have been the subjects of much discussion at the University of Florida and probably on other campuses, as well. Two common threads of this discussion include:
Institutional administrators are concerned by uncoordinated •communications efforts that are perceived to fragment stra-tegic messaging and drain institutional resources.Communications professionals at the unit level feel that •larger institutional priorities and key messages are not effectively communicated to them and that the institutional communications priorities are sometimes disconnected from and do not support those of the unit.
These opposing themes seem to be at play on many campuses, assurveyresponsesdemonstrate(seefig.5).Thetablereflectsrespondent perceptions of the effectiveness of communications activitiesattheinstitutionalandunitlevelsfilteredbywhethertherespondents were institution- or unit-level communicators.
!
!
!
"#$%&%'%&(#)*!+(,,'#&+)%&(#$!
$%-'+%'-.!/)$.0!(#!(1.-)**!
-.$2(#$.$!
Centralized 23%
Decentralized 13% Hybrid 63%
34)%!&$!%4.!%&%*.!(5!%4.!
�&1&0')*!%(!64(,!7('-!
2($&%&(#!-.2(-%$8!
President/Chancellor 13%
Vice President/Provost 39%
Dean 12%
Director/Exec. Director 36% !
9.$2(#0.#%!:)-;<(,,!=55(-%$!
>-&,)-&*7!?'22(-%!
Alumni Association 6%
Athletic Association 0% Institution as a whole 72%
College/Unit 29%
!
@&A'-.!BC!
!<(,,'#&+)%&(#$!
?%-'+%'-.!

10
Benchmarking Campus Communications and Marketing Programs © 2010 University of Florida
It is interesting to note that, in general, both respondent categories gave themselves higher marks for effectiveness than they gave the other group. For instance, nearly 80 percent of insti-tutional communicators ranked institutional media relations efforts as either “very effective” or “effective,” while only 62 percent of unit-level communicators ranked the same efforts “very effective” or “effective.” Conversely, 66 percent of unit-level communicators said unit-level printed publications were “very effective” or “effective,” while only 43 percent of institutional communicators ranked the same unit-level publications as “very effective” or “effective”; none-theless, 79 percent of the institution-level communicators said their own group’s publications were “very effective” or “effective.”
Both groups appear to be in sync, however, regarding the perceived lack of effectiveness for internal communications and social networking activities, poor effectiveness of media relations activities at the unit level and the high effectiveness of institutional branding.

11
Ben
chm
arki
ng C
ampu
s C
omm
unic
atio
ns a
nd M
arke
ting
Prog
ram
s
© 2
010
Uni
vers
ity o
f Flo
rida
Inst
itutio
nal
Com
mun
icat
ors
Uni
tCom
mun
icat
ors
Inst
itutio
nal
Com
mun
icat
ors
Uni
tCom
mun
icat
ors
Inst
itutio
nal
Com
mun
icat
ors
Uni
tCom
mun
icat
ors
Inst
itutio
nal
Com
mun
icat
ors
Uni
tCom
mun
icat
ors
Inst
. E
ffe
ctiv
en
ess
Ve
ry E
ffe
ctiv
eE
ffe
ctiv
eS
om
ew
ha
t E
ffe
ctiv
eN
ot
Eff
ect
ive
Med
ia r
elat
ions
40%
22%
38%
40%
20%
23%
2%10
%
Elec
tron
ic c
omm
.27
%14
%40
%42
%29
%61
%4%
11%
Inst
itutio
nal b
rand
ing
24%
30%
37%
28%
28%
25%
10%
17%
Con
sist
ent
mes
sagi
ng23
%13
%32
%30
%31
%31
%14
%26
%
Prin
ted
com
mun
icat
ions
38%
17%
41%
31%
18%
33%
2%8%
Soci
al n
etw
orki
ng11
%4%
22%
15%
38%
35%
20%
29%
Inte
rnal
com
mun
icat
ions
12%
6%32
%26
%40
%35
%15
%31
%
Un
it E
ffe
ctiv
en
ess
Med
ia r
elat
ions
15%
18%
17%
30%
35%
40%
20%
9%
Elec
tron
ic c
omm
.8%
17%
28%
40%
41%
34%
11%
6%
Inst
itutio
nal b
rand
ing
8%22
%23
%27
%35
%42
%23
%9%
Con
sist
ent
mes
sagi
ng8%
15%
16%
40%
43%
27%
25%
13%
Prin
ted
com
mun
icat
ions
12%
30%
31%
36%
35%
28%
11%
1%
Soci
al n
etw
orki
ng3%
2%13
%17
%36
%48
%26
%21
%
Inte
rnal
com
mun
icat
ions
3%8%
18%
21%
41%
48%
19%
16%
!
!
!
!
!
!
Figu
re 5
. Eff
ecti
ven
ess
of C
omm
un
icat
ion
s A
ctiv
itie
s at
Inst
itu
tion
al a
nd
Un
it L
evel
s
as R
anke
d b
y In
stit
uti
onal
- an
d U
nit
-Lev
el C
omm
un
icat
ors

12
Benchmarking Campus Communications and Marketing Programs © 2010 University of Florida
Barriers to Communication
Datashowninfigure5clearlyindicatethatinstitutional-andunit-levelcommunicatorshaveverydifferent perceptions of the effectiveness of their own and each other’s efforts. Yet respondents among both groups seem to share opinions regarding barriers to effective communications. Com-mon complaints relate to leadership from administrators, the need for strategic planning, appro-priate dedication of resources and greater cooperation in sharing information and in supporting institutional and unit priorities.
Opinions of institutional communicators on barriers to effective communication
“A lack of leadership that believe in strategic communication plans and implementation.”•“Staff. We simply don’t have the staff to do the work that needs to be done.”•“It is difficult for various units on campus to understand the priorities of other units. For •example, faculty has one set of priorities and media communications has a different set of priorities and it is difficult to communicate priorities to each other.”
“Lack of teamwork and cooperation among key units”•“Inconsistency with types of communications among unit-level areas.”•“Lack of funding and/or desire to fund communication research and evaluation and the •strategic planning that would result.”
“Trying to keep all departments on the reservation. The sheer volume of material that •passes through the communication and marketing—and the timeliness in processing it.”
“Upper administration not sharing information that is helpful to those who do the work. •Lots of closed door meetings with decisions that do not consider implementation difficul-ties which could be solved or advised differently if those people were involved in meetings. Also, the top level dictates with only agreement from the next level down.”
Opinions of college/unit communicators on barriers to effective communication
“Funding and alignment throughout the university.”•“Lack of coordination and lack of understanding by leadership (low priority for budgets, •staffing, and inclusion the in the planning process from the beginning).”
“There is no effort or facilitation for inclusion [of unit-level communicators] from the central •university communications office. I am a [redacted] communicator. Also many of the publica-tions are operating with outdated modes of visual and editorial communications. There has been very little support to increase the quality of [redacted] publications across the board.”
“Size of institution sometimes hampers clarity of message.”•“Lack of alignment, leadership and communication between institution and unit groups. •Also, the institution-level has resource limitations that constrict ability to lead/monitor/support unit communicators, which is very important in a huge institution.”

13
Benchmarking Campus Communications and Marketing Programs © 2010 University of Florida
Communications structures
Centralized and decentralized com-munications models are sometimes viewed by communications profes-sionals as competing in terms of functionality and purpose. However, given the prevalence of models that share both characteristics, this may not be an accurate view. It may be more constructive to focus on the organic connections between both models.(Seefig.6.)
Asthetableinfigure7shows,thelarger the institution, the more likely it is to have a hybrid communications model that blends elements of both cen-tralized and decentralized structures.
Communications Channels and Frequency by targeted Audience
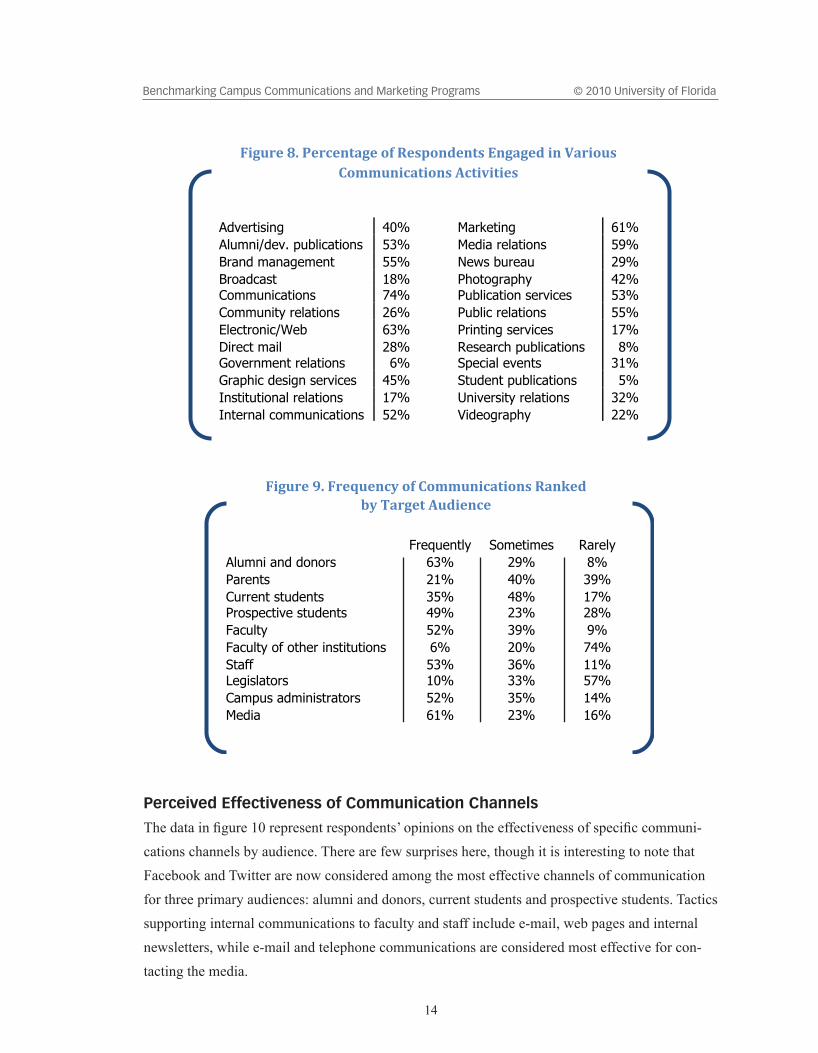
The survey results paint a vibrant picture of campus communications and the many hats that individual campus communicators wear in the performance of their jobs. Communicators engage inthefullgamutofcommunicationsactivities(seefig.8),withthosemostfrequentlyperformedincludingelectronic/webcommunications,marketing,mediarelations,publicrelations,brandmanagement and publications.
Perhaps not surprisingly, those audiences most frequently targeted by campus communica-tions are alumni and donors, media, staff, campus administrators and faculty and prospective students.(Seefig.9.)
Figure 6. Institutional Communications Structures
Based on Aggregate Responses
Hybrid 63 Percent
Decentralized 13 Percent
Centralized 23 Percent
!
!
!
!
!
!
<2,500
2,500 4,999
5,000 9,999
10,000 24,999 >25000
Centralized 41% 38% 37% 11% 4%
Decentralized 13% 8% 15% 13% 15% Hybrid 46% 53% 48% 76% 81%
!
Figure 7. Communications Structure Based on Respondents Sorted by Size*
!"#$%&$'()*$+",-%"$)&."&-//0'1&)(1-'+"/-2$3")%$"&)3&03)($2"+$4)%)($35",-%"$)&."+16$"&)($*-%57"$8*8"9:"4$%&$'("-,")33"
%$+4-'2$'(+",%-/"1'+(1(0(1-'+";1(."<=>??"-%",$;$%"+(02$'(+"%$4-%($2".)@1'*")"&$'(%)316$2"&-//0'1&)(1-'"+(%0&(0%$8"
* Percentages for each communications model are calculated separately for each size category; e.g., 41 percent of all respondents from institutions with 2,500 or fewer students reported having a centralized communication structure.
!
!
!
!
!
!
– – –
14
Benchmarking Campus Communications and Marketing Programs © 2010 University of Florida
Perceived effectiveness of Communication Channels
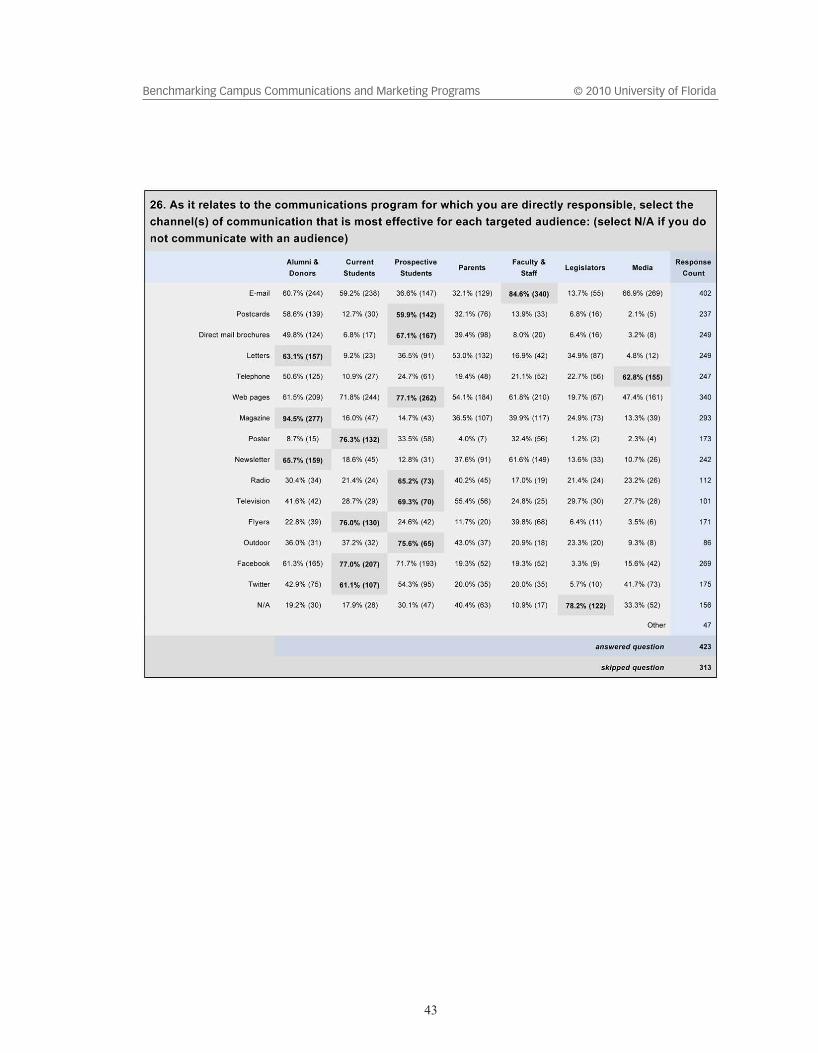
Thedatainfigure10representrespondents’opinionsontheeffectivenessofspecificcommuni-cations channels by audience. There are few surprises here, though it is interesting to note that Facebook and Twitter are now considered among the most effective channels of communication for three primary audiences: alumni and donors, current students and prospective students. Tactics supporting internal communications to faculty and staff include e-mail, web pages and internal newsletters, while e-mail and telephone communications are considered most effective for con-tacting the media.
!!"#$%&'()'*&%+&,-.#&'/0'1&23/,4&,-2'5,#.#&4'",'6.%"/$2'
7/88$,"+.-"/,2'9+-":"-"&2'
Advertising 40%
Alumni/dev. publications 53%
Brand management 55%
Broadcast 18% Communications 74%
Community relations 26%
Electronic/Web 63%
Direct mail 28% Government relations 6%
Graphic design services 45%
Institutional relations 17%
Internal communications 52% !
Marketing 61%
Media relations 59%
News bureau 29%
Photography 42% Publication services 53%
Public relations 55%
Printing services 17%
Research publications 8% Special events 31%
Student publications 5%
University relations 32%
Videography 22% !
'
!
!
!
Frequently Sometimes Rarely
Alumni and donors 63% 29% 8%
Parents 21% 40% 39%
Current students 35% 48% 17% Prospective students 49% 23% 28%
Faculty 52% 39% 9%
Faculty of other institutions 6% 20% 74%
Staff 53% 36% 11% Legislators 10% 33% 57%
Campus administrators 52% 35% 14%
Media 61% 23% 16%
!
!"#$%&'()'!%&*$&+,-'./'0.11$+",23".+4'52+6&7'
8-'92%#&3':$7"&+,&'

15
Benchmarking Campus Communications and Marketing Programs © 2010 University of Florida
Monitoring effectiveness of Communications Activities
The perceived strengths and weaknesses of communications tactics among communicators may be framed primarily from informal feedback, as there appears to be relatively little formal monitoringofoveralleffectiveness(seefig.11).Lessthanhalfthe respondents indicated use of a formal monitoring program of surveysorfocusgroupstodeterminetheeffectivenessofspecificcommunications efforts or tactics. More often, communicators appeartorelyoninformalfeedbackorresponseratestospecifictactics to assess effectiveness.
ConClusionCertain themes emerge within the survey data regarding campus communications. There is a clear disconnect between institutional- and unit-level communicators that appears, on its face, to be the result of ineffective two-way internal communication regarding institutional- and unit-level communications goals. Both institutional- and unit-level communicators recognize this discon-nect and attribute it to lack of leadership in establishing and effectively propagating strategic
!
!
No monitoring in place 14% Surveys 45%
Focus groups 28%
Response rates 49%
Informal feedback 77%
!
!"#$%&'(()'*+,"-+%",#'
.//&0-"1&,&22'
Alumni & Donors
Current Students
Prospective Students Parents
Faculty & Staff Legislators Media
E-mail 61% 59% 37% 32% 84% 14% 67%
Postcards 59% 13% 60% 32% 14% 7% 2%
Direct mail brochures 50% 7% 67% 39% 8% 6% 3% Letters 63% 9% 37% 53% 17% 35% 5%
Telephone 50% 11% 25% 20% 21% 23% 63%
Web pages 61% 72% 77% 54% 62% 20% 47%
Magazine 95% 16% 15% 37% 40% 25% 13% Poster 9% 76% 33% 4% 32% 1% 2%
Newsletter 66% 19% 13% 38% 61% 14% 11%
Radio 42% 21% 65% 40% 17% 21% 23%
Television 42% 29% 69% 55% 25% 30% 28% Flyers 23% 76% 25% 12% 40% 6% 4%
Outdoor 36% 37% 76% 43% 21% 23% 9%
Facebook 61% 77% 72% 19% 19% 3% 16%
Twitter 43% 61% 54% 20% 20% 6% 42% !
Figure 10. Perceived Effectiveness of Communications Channels by Target Audience!
!
!
!
!
!
E-mailPostcardsDirect mail brochuresLettersTelephoneWeb pagesMagazinePosterNewsletterRadioTelevisionFlyersOutdoorFacebookTwitter

16
Benchmarking Campus Communications and Marketing Programs © 2010 University of Florida
communications,whichwouldincludeadequatestaffing/resourcingofcommunicationsprograms,effectivecommunicationofinstitutionalgoals,andbuildingcampusconsensusandinstitutional/unit alignment.
In addition, most of the respondents worked within academic communications structures that are hybrid models combining various aspects of centralized and decentralized structures. It is apparent that the more decentralized the institution is, the more likely internal communications are perceived to be ineffective.
Finally,thecommunicationseffortsofthosepolledarediverseandprolific,butrespondentsindicatedsignificantgapsinplanningintermsofestablishingstrategiccommunicationsplanswithdefinedthemes,messagesandgoalsforeachtargetedaudienceandimplementingformalmeasurement programs to quantify effectiveness of communications activities.
The results of the survey will inform future efforts of the University of Florida’s Strategic Communications Planning Committee. The committee further hopes that its work with CASE will seed internal conversation about the effectiveness of communications at other institutions, large and small. By exploring perceived barriers to communication, opportunities to improve or streamline efforts and ways to improve internal knowledge of and compliance with standards and messages, institutions can position themselves to communicate more effectively and strategically with their constituents.

17
Benchmarking Campus Communications and Marketing Programs © 2010 University of Florida
APPendix A survey instrument
PLEASE NOTE: References to the "INSTITUTION" refer to the larger university/campus rather than the college/unit level.
1. Is your institution
2. What is your institution type?
3. How many full time students are enrolled in your institution?
4. Approximately how many alumni does your institution have?
1. INSTITUTIONAL INFORMATION
Public
Private
Associate's
Bachelor's
Master's/Professional
Doctoral/Research
None
Less than 2,500
2,500 - 4,999
5,000 - 9,999
10,000 - 24,999
25,000+
Unsure
Less than 10,000
10,000 - 49,999
50,000 - 99,999
100,000 - 299,999
300,000+
None
Unsure

18
Benchmarking Campus Communications and Marketing Programs © 2010 University of Florida
PLEASE NOTE: References to the "INSTITUTION" refer to the larger university/campus rather than the college/unit level.
5. Does your institution have a strategic communications plan?
6. Does your institution have clearly articulated key messages?
2. STRATEGIC MESSAGING
Yes
No
Unsure
Yes
No
Unsure

19
Benchmarking Campus Communications and Marketing Programs © 2010 University of Florida
PLEASE NOTE: References to the "INSTITUTION" refer to the larger university/campus rather than the college/unit level.
7. Does your institution have guidelines or identity standards regarding the use of its official logo, seal and school colors?
3. IDENTITY STANDARDS
Yes
No
Unsure
20
Benchmarking Campus Communications and Marketing Programs © 2010 University of Florida
PLEASE NOTE: References to the "INSTITUTION" refer to the larger university/campus rather than the college/unit level.
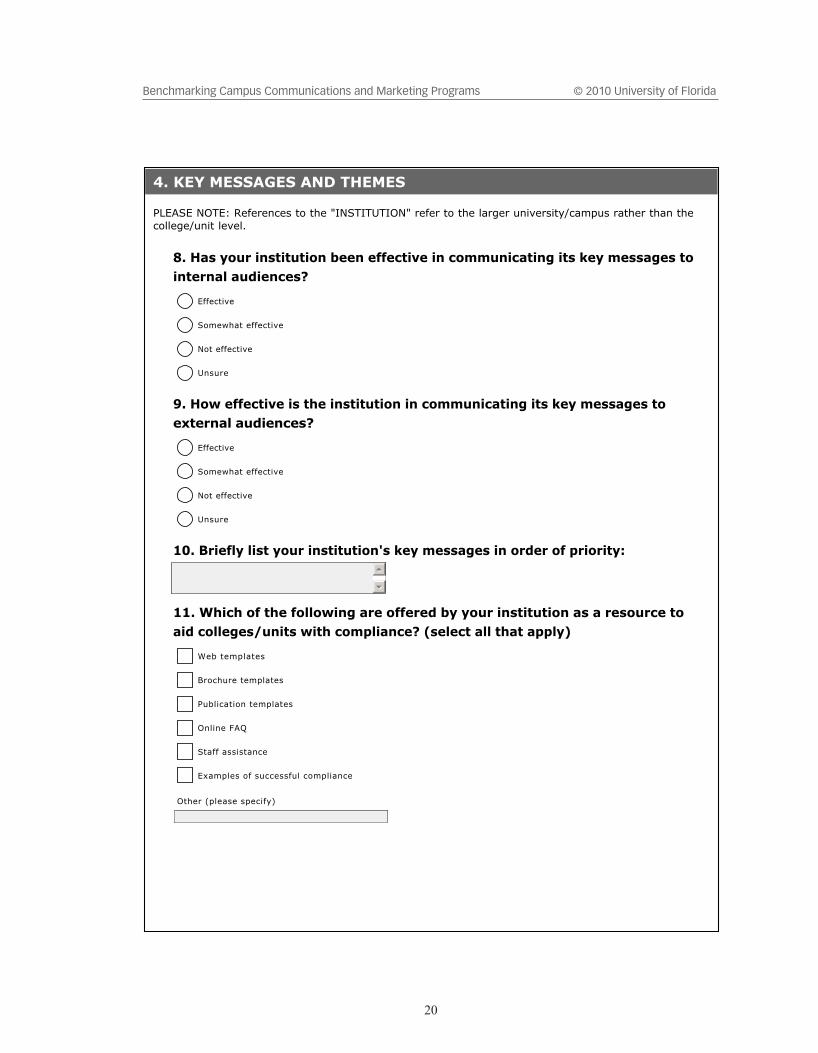
8. Has your institution been effective in communicating its key messages to internal audiences?
9. How effective is the institution in communicating its key messages to external audiences?
10. Briefly list your institution's key messages in order of priority:
11. Which of the following are offered by your institution as a resource to aid colleges/units with compliance? (select all that apply)
4. KEY MESSAGES AND THEMES
Effective
Somewhat effective
Not effective
Unsure
Effective
Somewhat effective
Not effective
Unsure
Web templates
Brochure templates
Publication templates
Online FAQ
Staff assistance
Examples of successful compliance
Other (please specify)

21
Benchmarking Campus Communications and Marketing Programs © 2010 University of Florida
12. Does the institution provide examples to communicators and others on campus of possible ways key messages can be reinforced?
Yes
No
Unsure
If "Yes," please provide example:
22
Benchmarking Campus Communications and Marketing Programs © 2010 University of Florida
PLEASE NOTE: References to the "INSTITUTION" refer to the larger university/campus rather than the college/unit level.
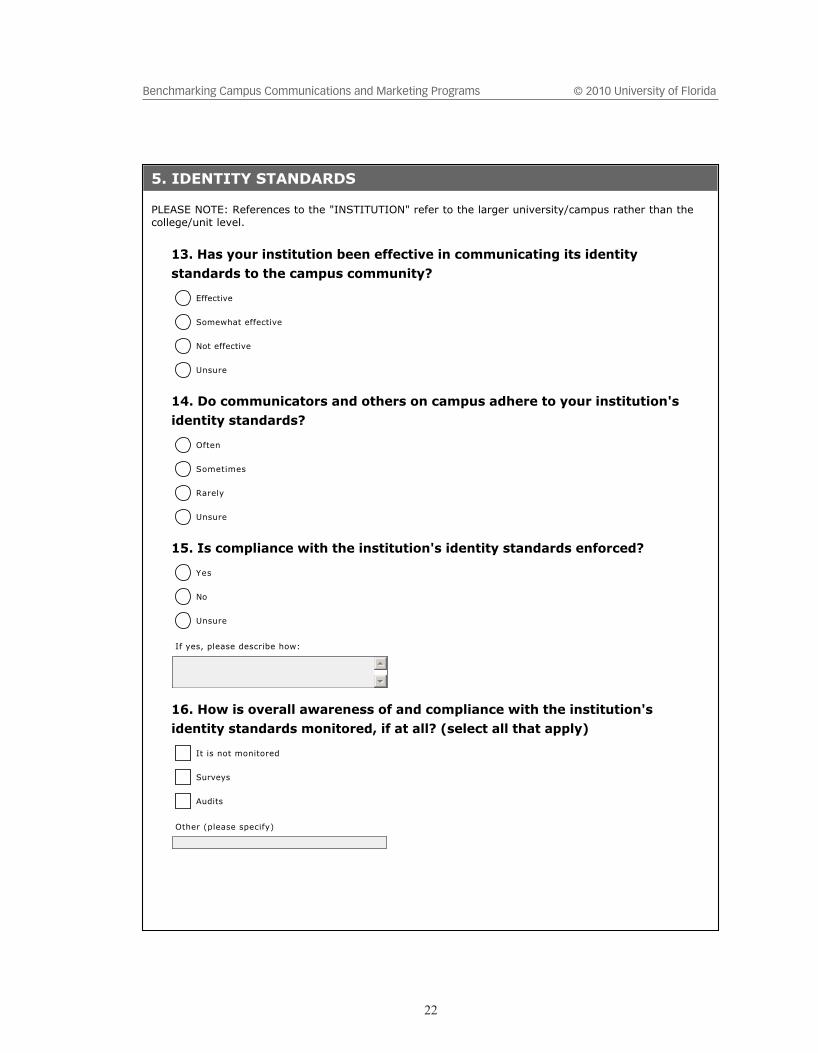
13. Has your institution been effective in communicating its identity standards to the campus community?
14. Do communicators and others on campus adhere to your institution's identity standards?
15. Is compliance with the institution's identity standards enforced?
16. How is overall awareness of and compliance with the institution's identity standards monitored, if at all? (select all that apply)
5. IDENTITY STANDARDS
Effective
Somewhat effective
Not effective
Unsure
Often
Sometimes
Rarely
Unsure
Yes
No
Unsure
If yes, please describe how:
It is not monitored
Surveys
Audits
Other (please specify)
23
Benchmarking Campus Communications and Marketing Programs © 2010 University of Florida
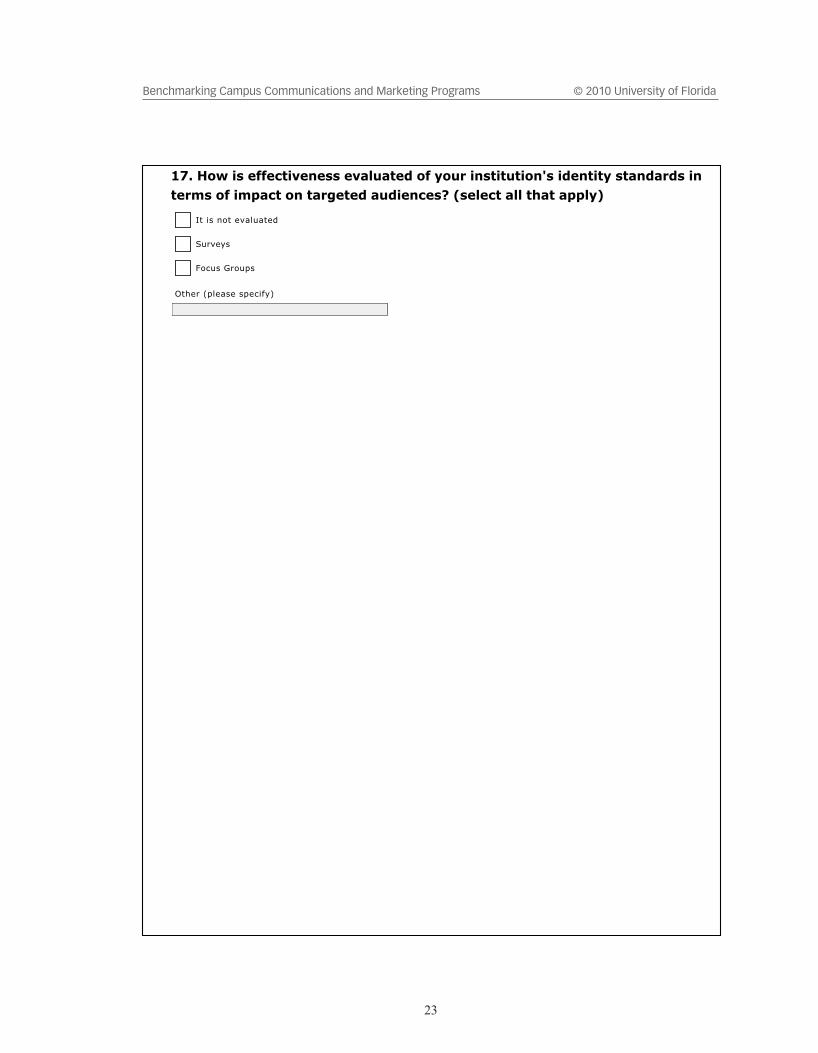
17. How is effectiveness evaluated of your institution's identity standards in terms of impact on targeted audiences? (select all that apply)
It is not evaluated
Surveys
Focus Groups
Other (please specify)

24
Benchmarking Campus Communications and Marketing Programs © 2010 University of Florida
PLEASE NOTE: References to the "INSTITUTION" refer to the larger university/campus rather than the college/unit level.
18. Which of the following best describes the communications structure at your institution?
19. Rate the overall effectiveness of the following communications activities at both the institution-level and at the unit/college-level:
20. In your opinion, what is the biggest barrier to effective communications at your institution?
6. EFFECTIVENESS OF CAMPUS COMMUNICATIONS
Institution-level Unit-level
Media relations
Electronic
communications
Institutional branding
Consistent messaging
Printed
communications
Social networking
Internal
communications
Centralized: communications efforts for the entire campus are managed from a central office
Decentralized: colleges and units conduct independent communications efforts with little campuswide
coordination
Hybrid: some combination of the centralized/decentralized models
If a hybrid model, please describe:
25
Benchmarking Campus Communications and Marketing Programs © 2010 University of Florida
21. What is your title?
22. What is the title of the individual to whom your position reports?
23. Your communications/marketing efforts primarily support
7. ABOUT YOU
President or Chancellor
Vice President or Provost
Dean
Director or Executive Director
Other (please specify)
The alumni association
The athletic association
The institution as a whole
An individual college or unit
Other (please specify)

26
Benchmarking Campus Communications and Marketing Programs © 2010 University of Florida
24. Indicate your primary area(s) of concentration:
Advertising
Alumni/development publications
Brand management
Broadcast communications
Communications
Community relations
Electronic communications
Direct mail
Government relations
Graphic design services
Institutional relations
Internal communications
Marketing
Media relations
News bureau
Photography
Publication services
Public relations
Printing services
Research publications
Special events
Student publications
University relations
Videography
Other (please specify)

27
Benchmarking Campus Communications and Marketing Programs © 2010 University of Florida
25. In terms of the communications program for which you are directly responsible, rank frequency of communications to the following audiences:
26. As it relates to the communications program for which you are directly responsible, select the channel(s) of communication that is most effective for each targeted audience: (select N/A if you do not communicate with an audience)
Frequently Sometimes Rarely
Alumni and donors
Parents
Current students
Prospective students
Faculty Faculty of other
institutions (not on
your campus)
Staff
Legislators Campus
administrators
Media
Alumni &
Donors
Current
Students
Prospective
StudentsParents
Faculty &
StaffLegislators Media
Postcards
Direct mail brochures
Letters
Telephone
Web pages
Magazine
Poster
Newsletter
Radio
Television
Flyers
Outdoor
N/A
Other
28
Benchmarking Campus Communications and Marketing Programs © 2010 University of Florida
27. How is the effectiveness of the communications programs for which you are directly responsible monitored? (select all that apply)
Effectiveness is not monitored
Surveys
Focus groups
Response rates
Informal feedback
Other (please specify)

29
Benchmarking Campus Communications and Marketing Programs © 2010 University of Florida
You're finished! Thank you for completing this survey. If you would like to receive a copy of the survey report, please provide your e-mail address below.
28. I would like to receive the survey report. I understand my responses to this survey will remain confidential, even though I've provided my e-mailaddress below.
8. THAT'S IT!
E-mail Address

30
Benchmarking Campus Communications and Marketing Programs © 2010 University of Florida
APPendix B survey data summary (excluding open-ended responses)
1 of 15
UF/CASE Communications Benchmarking Survey
1. Is your institution
Response
Percent
Response
Count
Public 56.0% 408
Private 44.0% 321
answered question 729
skipped question 7
2. What is your institution type?
Response
Percent
Response
Count
Associate's 4.9% 36
Bachelor's 23.7% 173
Master's/Professional 20.5% 150
Doctoral/Research 50.3% 368
None 0.5% 4
answered question 731
skipped question 5

31
Benchmarking Campus Communications and Marketing Programs © 2010 University of Florida
2 of 15
3. How many full time students are enrolled in your institution?
Response
Percent
Response
Count
Less than 2,500 22.1% 162
2,500 - 4,999 13.4% 98
5,000 - 9,999 14.3% 105
10,000 - 24,999 24.3% 178
25,000+ 24.5% 179
Unsure 1.4% 10
answered question 732
skipped question 4
4. Approximately how many alumni does your institution have?
Response
Percent
Response
Count
Less than 10,000 6.0% 44
10,000 - 49,999 30.0% 219
50,000 - 99,999 18.4% 134
100,000 - 299,999 21.8% 159
300,000+ 13.0% 95
None 0.1% 1
Unsure 10.6% 77
answered question 729
skipped question 7
32
Benchmarking Campus Communications and Marketing Programs © 2010 University of Florida
3 of 15
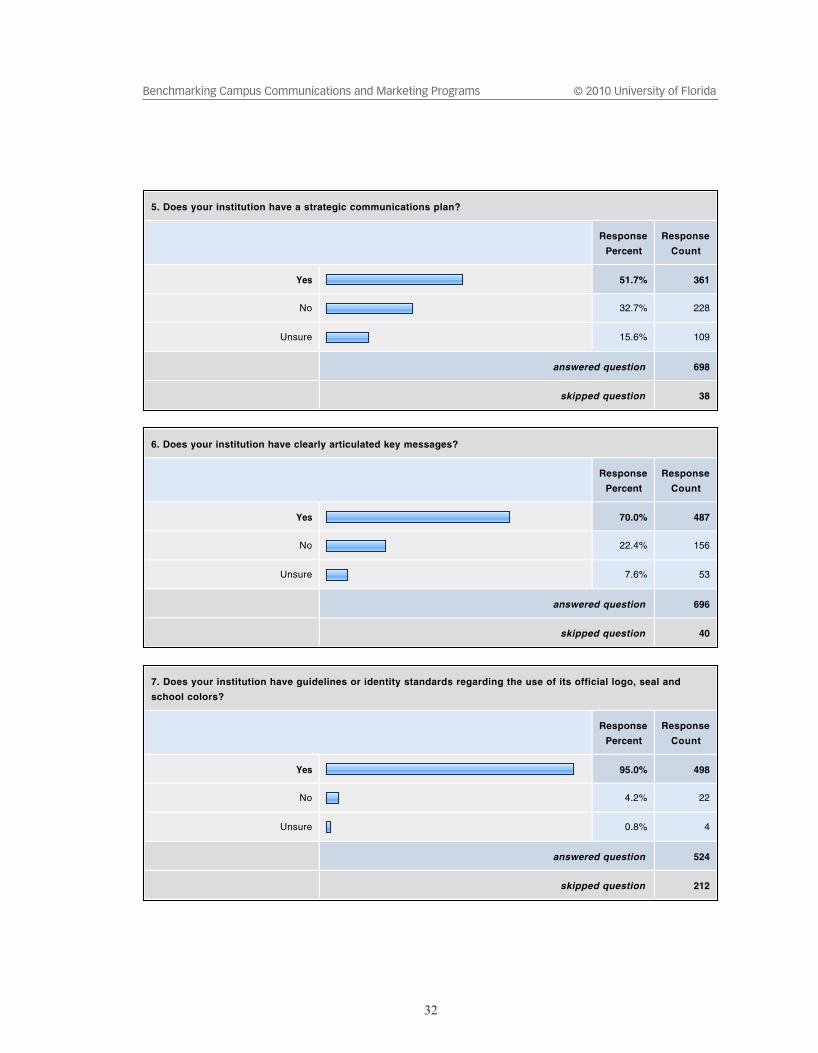
5. Does your institution have a strategic communications plan?
Response
Percent
Response
Count
Yes 51.7% 361
No 32.7% 228
Unsure 15.6% 109
answered question 698
skipped question 38
6. Does your institution have clearly articulated key messages?
Response
Percent
Response
Count
Yes 70.0% 487
No 22.4% 156
Unsure 7.6% 53
answered question 696
skipped question 40
7. Does your institution have guidelines or identity standards regarding the use of its official logo, seal and
school colors?
Response
Percent
Response
Count
Yes 95.0% 498
No 4.2% 22
Unsure 0.8% 4
answered question 524
skipped question 212

33
Benchmarking Campus Communications and Marketing Programs © 2010 University of Florida
4 of 15
8. Has your institution been effective in communicating its key messages to internal audiences?
Response
Percent
Response
Count
Effective 25.7% 85
Somewhat effective 65.3% 216
Not effective 7.9% 26
Unsure 1.2% 4
answered question 331
skipped question 405
9. How effective is the institution in communicating its key messages to external audiences?
Response
Percent
Response
Count
Effective 28.9% 95
Somewhat effective 63.2% 208
Not effective 4.9% 16
Unsure 3.0% 10
answered question 329
skipped question 407
10. Briefly list your institution's key messages in order of priority:
Response
Count
238
answered question 238
skipped question 498

34
Benchmarking Campus Communications and Marketing Programs © 2010 University of Florida
5 of 15
11. Which of the following are offered by your institution as a resource to aid colleges/units with compliance?
(select all that apply)
Response
Percent
Response
Count
Web templates 78.1% 232
Brochure templates 34.7% 103
Publication templates 40.4% 120
Online FAQ 39.7% 118
Staff assistance 89.9% 267
Examples of successful
compliance39.4% 117
Other (please specify) 60
answered question 297
skipped question 439
12. Does the institution provide examples to communicators and others on campus of possible ways key
messages can be reinforced?
Response
Percent
Response
Count
Yes 53.8% 168
No 26.3% 82
Unsure 19.9% 62
If "Yes," please provide example: 92
answered question 312
skipped question 424

35
Benchmarking Campus Communications and Marketing Programs © 2010 University of Florida
6 of 15
13. Has your institution been effective in communicating its identity standards to the campus community?
Response
Percent
Response
Count
Effective 28.3% 137
Somewhat effective 59.7% 289
Not effective 11.6% 56
Unsure 0.4% 2
answered question 484
skipped question 252
14. Do communicators and others on campus adhere to your institution's identity standards?
Response
Percent
Response
Count
Often 49.8% 241
Sometimes 46.5% 225
Rarely 3.3% 16
Unsure 0.4% 2
answered question 484
skipped question 252
36
Benchmarking Campus Communications and Marketing Programs © 2010 University of Florida
7 of 15
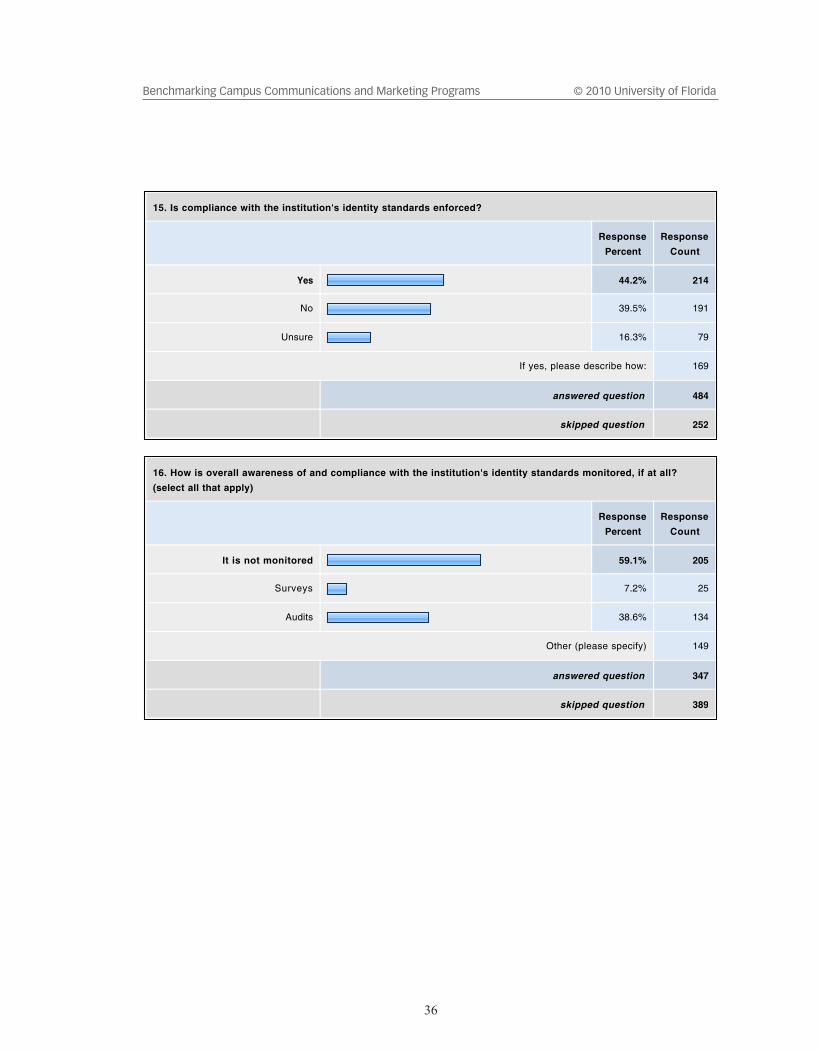
15. Is compliance with the institution's identity standards enforced?
Response
Percent
Response
Count
Yes 44.2% 214
No 39.5% 191
Unsure 16.3% 79
If yes, please describe how: 169
answered question 484
skipped question 252
16. How is overall awareness of and compliance with the institution's identity standards monitored, if at all?
(select all that apply)
Response
Percent
Response
Count
It is not monitored 59.1% 205
Surveys 7.2% 25
Audits 38.6% 134
Other (please specify) 149
answered question 347
skipped question 389

37
Benchmarking Campus Communications and Marketing Programs © 2010 University of Florida
8 of 15
17. How is effectiveness evaluated of your institution's identity standards in terms of impact on targeted
audiences? (select all that apply)
Response
Percent
Response
Count
It is not evaluated 63.5% 270
Surveys 29.2% 124
Focus Groups 29.2% 124
Other (please specify) 55
answered question 425
skipped question 311
18. Which of the following best describes the communications structure at your institution?
Response
Percent
Response
Count
Centralized: communications
efforts for the entire campus are
managed from a central office
23.4% 111
Decentralized: colleges and units
conduct independent
communications efforts with little
campuswide coordination
13.5% 64
Hybrid: some combination of the
centralized/decentralized models63.1% 299
If a hybrid model, please describe: 230
answered question 474
skipped question 262

38
Benchmarking Campus Communications and Marketing Programs © 2010 University of Florida

39
Benchmarking Campus Communications and Marketing Programs © 2010 University of Florida
10 of 15
20. In your opinion, what is the biggest barrier to effective communications at your institution?
Response
Count
422
answered question 422
skipped question 314
21. What is your title?
Response
Count
406
answered question 406
skipped question 330
22. What is the title of the individual to whom your position reports?
Response
Percent
Response
Count
President or Chancellor 13.0% 48
Vice President or Provost 39.5% 146
Dean 11.6% 43
Director or Executive Director 35.9% 133
Other (please specify) 79
answered question 370
skipped question 366

40
Benchmarking Campus Communications and Marketing Programs © 2010 University of Florida
11 of 15
23. Your communications/marketing efforts primarily support
Response
Percent
Response
Count
The alumni association 6.2% 26
The athletic association 0.0% 0
The institution as a whole 72.1% 303
An individual college or unit 21.7% 91
Other (please specify) 46
answered question 420
skipped question 316

41
Benchmarking Campus Communications and Marketing Programs © 2010 University of Florida

42
Benchmarking Campus Communications and Marketing Programs © 2010 University of Florida
13 of 15
Other (please specify) 59
answered question 437
skipped question 299
25. In terms of the communications program for which you are directly responsible, rank frequency of
communications to the following audiences:
Frequently Sometimes RarelyRating
Average
Response
Count
Alumni and donors 62.5% (265) 29.2% (124) 8.3% (35) 1.46 424
Parents 21.2% (89) 40.1% (168) 38.7% (162) 2.17 419
Current students 34.7% (146) 48.0% (202) 17.3% (73) 1.83 421
Prospective students 49.2% (207) 23.0% (97) 27.8% (117) 1.79 421
Faculty 51.3% (218) 38.8% (165) 9.9% (42) 1.59 425
Faculty of other institutions (not on
your campus)5.9% (24) 20.3% (83) 73.8% (302) 2.68 409
Staff 52.4% (226) 36.4% (157) 11.1% (48) 1.59 431
Legislators 9.5% (39) 32.8% (135) 57.7% (237) 2.48 411
Campus administrators 51.3% (217) 34.5% (146) 14.2% (60) 1.63 423
Media 60.7% (258) 23.1% (98) 16.2% (69) 1.56 425
answered question 439
skipped question 297
43
Benchmarking Campus Communications and Marketing Programs © 2010 University of Florida

44
Benchmarking Campus Communications and Marketing Programs © 2010 University of Florida
15 of 15
N/A19.2%
(30)
17.9%
(28)30.1% (47)
40.4%
(63)
10.9%
(17)78.2% (122)
33.3%
(52)
Other
answered question
skipped question
27. How is the effectiveness of the communications programs for which you are directly responsible monitored?
(select all that apply)
Response
Percent
Response
Count
Effectiveness is not monitored 14.5% 63
Surveys 44.4% 193
Focus groups 27.4% 119
Response rates 49.0% 213
Informal feedback 76.6% 333
Other (please specify) 61
answered question 435
skipped question 301
28. I would like to receive the survey report. I understand my responses to this survey will remain confidential,
even though I've provided my e-mail address below.
Response
Percent
Response
Count
E-mail Address 100.0% 394
answered question 394
skipped question 342
45
Benchmarking Campus Communications and Marketing Programs © 2010 University of Florida
APPendix C survey invitations

46
Benchmarking Campus Communications and Marketing Programs © 2010 University of Florida

47
Benchmarking Campus Communications and Marketing Programs © 2010 University of Florida

48
Benchmarking Campus Communications and Marketing Programs © 2010 University of Florida
ABout tHe uniVersitY oF FloridA
The University of Florida is one of the nation’s largest and most diverse public institutions. The university boasts more than 50,000 students, 24,000 employees, and 16 colleges offering more than 100 undergraduate majors and more than 200 graduate programs.
It is ranked No. 13 nationwide amongst all public institutions and No. 19 among public andprivateinstitutionsinresearchexpendituresduringfiscalyear2008bytheNationalScienceFoundation, and is among the most productive research universities in the nation in terms of educationandscientificdiscovery,with150research,educationandservicecenters,bureausandinstitutes. UF is home to a major, regional health science center and—true to its land grant mis-sion and Florida’s agricultural heritage—supports an enormous agricultural research and exten-sionservicewithofficesinall67Floridacounties.Formoreinformation,visitwww.ufl.edu, or [email protected].
ABout CAse
The Council for Advancement and Support of Education (CASE) is the professional organization for advancement professionals at all levels who work in alumni relations, communications and marketing, development and advancement services.
CASE’s membership includes more than 3,400 colleges, universities and independent and secondaryschoolsin61countries.ThismakesCASEoneofthelargestnonprofiteducationasso-ciations in the world in terms of institutional membership. CASE also serves more than 60,000 advancement professionals on staffs of member institutions and has more than 22,500 individual “professional members” and more than 230 Educational Partner corporate members.
CASEhasofficesinWashington,D.C.,LondonandSingapore.Theassociationproduceshigh-quality and timely content, publications, conferences, institutes and workshops that assist advancement professionals perform more effectively and serve their institutions.
For information, visit www.case.org or call +1-202-328-2273.


![Benchmarking Practical RRM Algorithms for D2D Communications in LTE Advanced · 2018-06-08 · arXiv:1306.5305v1 [cs.IT] 22 Jun 2013 Benchmarking Practical RRM Algorithms for D2D](https://static.fdocuments.us/doc/165x107/5e5574dc600940241e3842fb/benchmarking-practical-rrm-algorithms-for-d2d-communications-in-lte-advanced-2018-06-08.jpg)