Benchmarking Business Development Services -...
30
Benchmarking Business Development Services February 2013
Transcript of Benchmarking Business Development Services -...

Benchmarking Business
Development Services
February 2013

2
FIELD Staff
Tamra Thetford, Program Manager Elaine Edgcomb, Strategic Advisor

3
Jefferson Economic Development
Institute, JEDI
Nancy Swift, Executive Director
Marian Doub, Knowledge Manager

4
Logistics
• For best audio, turn your speakers up!
• You may wish to view the presentation in full-screen by clicking on the “full-screen” at the top of your monitor.
• Need Technical Help? Send a chat message or
Email [email protected] for help
• Send comments and questions via chat.
• A link will be sent out after the webinar to the recorded session (for sharing) and the PowerPoint
slides.

© FIELD - The Aspen Institute
Special thanks to
the
SBA PRIME Program

Today’s Goals
© The Aspen Institute 6
• Introduce a new tool on microTracker
that guides programs through
benchmarking BDS
• Demonstrate how MDOs can do in-depth
benchmarking and analysis using a
Premium Plus membership, and
• Show how the results can be used to
advance your organization and its goals.

What is Benchmarking?
© The Aspen Institute 7
• 17
• 88%

Why Benchmark?
© The Aspen Institute 8
• My program assisted 17 entrepreneurs in
FY2011, the industry median is 300.
• 88% of my clients are low-income,
compares well to:
– my organizational target of 85% and
– the industry median for young, rural, training
organizations; 42%.

“How-to” Benchmarking Guide
© The Aspen Institute 9

Jefferson Economic Development Institute
(JEDI)
10
• Stand-alone
microenterprise
organization
• Operating since 1997
• 4.5 FTEs
• Serves far-Northern
CA, rural area

Step 1: What do we want to know?
• Where does JEDI fit in the spectrum of its peers
(rural-based, mature, and training programs)?
• What is the relationship between services
delivered to a client, outcomes achieved, and
time frames, and how does that compare to our
peers?
• What outcomes can be expected in rural areas
with deep poverty targeting?
11

What JEDI looked at…
Who They Serve
Women Minorities Low-
Income Business Status
# of Individuals
Cost and Effectiveness
Graduation Rate
Cost per Individual
Served
12

Targeting peer comparisons
13
JEDI Industry
(median)
Rural
(median)
Mature
(median)
Training-
Led
(median)
Rural &
Mature
(median)
Rural &
Training
(median)
% Women
Served 74%
At or below
150% HHS
Federal
Poverty Level
at intake
54%
At or below
80% HUD at
intake
73%
Average TA
hours/particip
ant
Training
Completion
rate
Cost per client
Cost per
participant

Step 3: Mine microTracker
14

What we learned…
15
Who JEDI Serves
JEDI Clients At Entry FY2011
n=327participants
At the 15 Year Mark
N=2,196 participants
% Women Served 73% 65%
% Minorities Served 16% 16%
% Disabled Served 12% 8%
% with Poverty Level Income 43% 35%
% Low Household Income
(<80% HCD/HUD median income)
79% 72%
% Pre-Venture Businesses (n=876 businesses)
29% 20%
% Clients with Start-up Businesses 25% 33%
% Clients with On-going Businesses
46% 47%

Targeting peer comparisons
16
JEDI Rural
(median)
Mature
(median)
Training-
Led
(median)
Rural &
Mature
(median)
Rural &
Training
(median)
%
Women
Served
74% 52% N=123
56% N=153
55% N=248
52% N=73
50% N=117
150%
Poverty
Income
Level
54% 52% N=80
45% N=106
52% N=168
40% N=47
50% N=74
80% HUD
at entry 73% 57%
N=4
56% N=102
57% N=158
51% N=49
54% N=75

Cost and Effectiveness peer
comparisons
17
JEDI Rural
(median)
Mature
(median)
Training-Led
(median)
Avg. TA
hours per
individual
7 hours 7 hours N=3
3 hours n=20
3 hours n=21
Training
Completion
Rate
82% 82% 83%
Cost per
Individual $1,346 $1,167
N=99
$1,167 N=125
$1,153 N=204
Cost per
Client $3,014 $2,536
N=
$3,036 N=
$2,698 N=

What JEDI looked at…
•Business Operation Start and Survival Rates
•FT/PT operation at survey
•Change in FT/PT operation over time
•Revenue Change
•Employment
Outcomes
18

Outcomes Comparison Types
• Rural
• Mature
• Training-Led
Peer Comparisons
• All Surveys
• 5 Year Group Time Frames
•>5% Revenue Increase
•Create 1 or more FT Jobs
•FT Businesses
•Business income improves household financial circumstances
•Business sustained for 3+ years
•Rise above poverty
Successful Clients
19

Client Outcomes; relation to services
20
• 77% of clients start or
strengthen a business
after receiving 10 or
more hours of JEDI
services
• 41% of all individuals
who receive any
amount of service
start or strengthen a
business

Successful Client and Business
Characteristics
21
Measures of
Success
Existing
Business at
Entry
Business
Operation at
Intake
# of Years
with JEDI IYB Grad
> 5%
Revenue
Increase
(n=65)
100%
34% FT
52% PT
14% DK
Mean: 3.7
Median 3.4 61%
Create 1+ FT
Jobs
(n=22)
68%
20% FT
60% PT
20% DK
Mean: 3.1
Median: 2.9 59%
FT Businesses
(n=142) 48%
32% FT
40% PT
28% DK
Mean: 3.7
Median: 3 56%

JEDI At the Five-Year Mark
22
• 88% operating their business, 84% nationally
• 93% business survival, 88% nationally
• 80% business start rate, 72% nationally
• 50% grew from part-time to full-time, 30%
nationally
• But: 67% of those FT at intake were full-time at 5
years—91% nationally
• Although 44% increased revenues, median revenues
decreased $1,194.
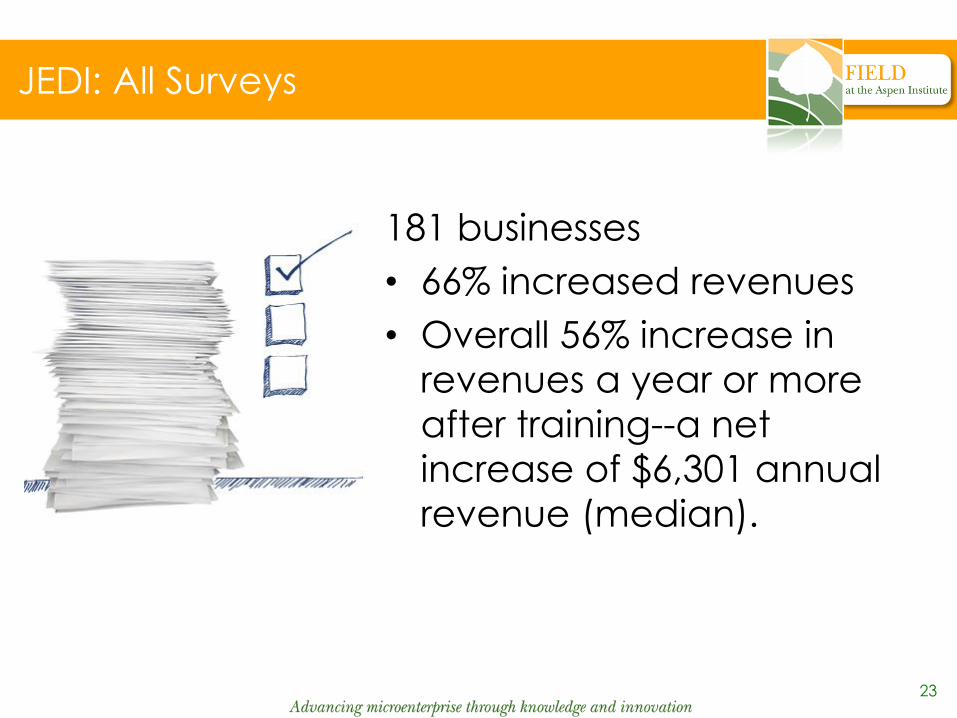
JEDI: All Surveys
23
181 businesses
• 66% increased revenues
• Overall 56% increase in
revenues a year or more
after training--a net
increase of $6,301 annual
revenue (median).

What does this say to JEDI?
• is on track as leader in rural
BDS
• services make a difference
JEDI is deepening our
commitment to personalized
customer service and
outcomes—especially revenue
growth that leads to improved
household circumstances.
24

What does this say to JEDI?
JEDI can now say to policy
makers and others:
• JEDI services provide a
proven pipeline for local
business, job, and revenue
creation
• The majority of business
owners served by JEDI sustain
their businesses for 8 or more
years
25

Questions?

28
microTracker Steps:
• Submit your own data
• Search the industry
directory
• Access profiles of
over 800
microenterprise
development
organizations
• Review reports on
industry-wide
performance data
• Compare your
organization’s data
with other organizations
• Create custom annual
reports for your
organizations
• Access five years of
performance reports on
the industry
• Use microTracker Client
Outcomes survey tools to
go beyond success stories
using respected survey
protocols
• Have your data reviewed
and vetted by FIELD staff
• Access consultation
services to help you
improve data collection
and management
capacities and your data

29
microTracker Steps:

Jefferson Economic Development Institute
Nancy Swift: [email protected]
530-926-6670 x 12
Marian Doub: [email protected]
415-730-1873
FIELD at the Aspen Institute
http://www.fieldus.org
www.facebook.com/FIELDatAspen