Benchmarking and Analysis on the Dividend and Market ... · 11 Performance Measurement ... the...
59
BENCHMARKING AND ANALYSIS ON THE DIVIDEND AND MARKET CAP BASED TWO-MINUTE PORTFOLIO INVESTMENT STRATEGY by Zhong Wang Bachelor of Business Administration Honours, Simon Fraser University 2011 Qi Yang Bachelor of Business Administration, Simon Fraser University 2011 RESEARCH PROJECT SUBMITTED IN PARTIAL FULFILLMENT OF THE REQUIREMENTS FOR THE DEGREE OF MASTER OF SCIENCE IN FINANCE BEEDIE SCHOOL OF BUSINESS c Zhong Wang 2012 c Qi Yang 2012 SIMON FRASER UNIVERSITY Summer 2012 All rights reserved. However, in accordance with the Copyright Act of Canada, this work may be reproduced, without authorization, under the conditions for Fair Dealing. Therefore, limited reproduction of this work for the purposes of private study, research, criticism, review and news reporting is likely to be in accordance with the law, particularly if cited appropriately.
Transcript of Benchmarking and Analysis on the Dividend and Market ... · 11 Performance Measurement ... the...

BENCHMARKING AND ANALYSIS ON THE DIVIDEND AND MARKETCAP BASED TWO-MINUTE PORTFOLIO INVESTMENT STRATEGY
by
Zhong Wang
Bachelor of Business Administration Honours, Simon Fraser University 2011
Qi Yang
Bachelor of Business Administration, Simon Fraser University 2011
RESEARCH PROJECT SUBMITTED IN PARTIAL FULFILLMENT OF
THE REQUIREMENTS FOR THE DEGREE OF
MASTER OF SCIENCE IN FINANCE
BEEDIE SCHOOL OF BUSINESS
c© Zhong Wang 2012
c© Qi Yang 2012
SIMON FRASER UNIVERSITY
Summer 2012
All rights reserved.
However, in accordance with the Copyright Act of Canada, this work may be
reproduced, without authorization, under the conditions for Fair Dealing.
Therefore, limited reproduction of this work for the purposes of private study,
research, criticism, review and news reporting is likely to be in accordance
with the law, particularly if cited appropriately.

Approval
Name: Zhong Wang
Qi Yang
Degree: Master of Science in Finance
Title of Project: Benchmarking and Analysis on the Dividend and Market Cap
Based Two-Minute Portfolio Investment Strategy
Supervisory
Committee:
Dr. Peter KleinSenior SupervisorProfessor, Faculty of Business Administration
Dr. Jijun NiuSecond ReaderAssistant Professor, Faculty of Business Administration
Date Approved:
ii

Abstract
Two-Minute portfolio aims to be a heuristic investment strategy for conservative investors who
prefer a well-diversiVed and less volatile portfolio. The portfolio rebalances to hold top 2 Cana-
dian dividend-paying stocks (by market capitalization) in each of the 10 GICS sectors at 5%
weight. Despite the claim that Two-Minute portfolio consistently outperforms the TSX Compos-
ite Index in most of the recent 26 years, quiet a few ambiguity is left undeVned by the author. The
intention of this project is to backtest the return of the Two-Minute portfolio and compare the
strategy with traditional mean-variance optimization framework. This project has shown that 1)
although per-year return may be higher for the Two-Minute portfolio, holding the Two-Minute
portfolio for a prolonged investment period may not be better oU than holding the TSX Index, 2)
risk-adjusted return in the Two-Minute portfolio is not as desirable as the risk-adjusted return
in the TSX market portfolio, and 3) the weight in Two-Minute portfolio is not mean-variance
optimal when dealing with the correlation between diUerent portfolio securities.
Keywords: Equal-Weight Portfolio, Trading Strategy, Dividend, Market Capitalization, Back-
testing, Rebalancing, Mean-Variance Optimization, Performance Measurement
iii

Acknowledgment
We would like to thank our supervisory committee, Dr. Peter Klein and Dr. Jijun Niu for valuable
feedback and suggestions on our work.
iv

Contents
Approval ii
Abstract iii
Acknowledgment iv
Contents v
List of Tables vii
List of Figures ix
Introduction 1
Literature Review 2
Data 5
Procedure 8
Two-Minute Portfolio Construction . . . . . . . . . . . . . . . . . . . . . . . . . . . . . 8
Portfolio Analysis . . . . . . . . . . . . . . . . . . . . . . . . . . . . . . . . . . . . . . . 10
Results 13
Stock Holding . . . . . . . . . . . . . . . . . . . . . . . . . . . . . . . . . . . . . . . . . 13
Portfolio Value . . . . . . . . . . . . . . . . . . . . . . . . . . . . . . . . . . . . . . . . . 14
Discussion 16
v

Portfolio Return . . . . . . . . . . . . . . . . . . . . . . . . . . . . . . . . . . . . . . . . 16
Asset Allocation . . . . . . . . . . . . . . . . . . . . . . . . . . . . . . . . . . . . . . . . 19
Portfolio Turnover . . . . . . . . . . . . . . . . . . . . . . . . . . . . . . . . . . . . . . . 19
Conclusion 20
Bibliography 22
Appendices 25
Processing and Identifying Holdings In the Two-Minute Portfolio . . . . . . . . . . . . 25
Value of Two-Minute Portfolio Holding Period . . . . . . . . . . . . . . . . . . . . . . . 33
vi

List of Tables
1 Holding of Two Minute Portfolio (Year 2012 to Year 2010) . . . . . . . . . . . . . . 36
2 Holding of Two Minute Portfolio (Year 2009 to Year 2007) . . . . . . . . . . . . . . 37
3 Holding of Two Minute Portfolio (Year 2006 to Year 2004) . . . . . . . . . . . . . . 38
4 Holding of Two Minute Portfolio (Year 2003 to Year 2001) . . . . . . . . . . . . . . 39
5 Holding of Two Minute Portfolio (Year 2000 to Year 1999) . . . . . . . . . . . . . . 40
6 Holding Value of a Hypothetical TwoMinute Portfolio Investor without Account-
ing for Dividend . . . . . . . . . . . . . . . . . . . . . . . . . . . . . . . . . . . . . 41
7 Holding Value of a Hypothetical Two Minute Portfolio Investor with Dividend
Reinvested . . . . . . . . . . . . . . . . . . . . . . . . . . . . . . . . . . . . . . . . 42
8 Holding Value of a Hypothetical TSX Composite Price Index Investor (No Divi-
dend) Reinvested . . . . . . . . . . . . . . . . . . . . . . . . . . . . . . . . . . . . . 43
9 Holding Value of a Hypothetical TSX Composite Total Return Index Investor
(Dividend) Reinvested . . . . . . . . . . . . . . . . . . . . . . . . . . . . . . . . . . 44
10 Number of Years the Portfolio Holding Value of Two-Minute Portfolio Outper-
forms Benchmark Portfolio . . . . . . . . . . . . . . . . . . . . . . . . . . . . . . 45
11 Performance Measurement . . . . . . . . . . . . . . . . . . . . . . . . . . . . . . . 46
12 Mean Variance Optimizer Result 2011 . . . . . . . . . . . . . . . . . . . . . . . . . 47
13 Correlation Matrix of Stock Holding in 2011 . . . . . . . . . . . . . . . . . . . . . 48
14 Correlation of GICS Sectors Return in 2011 . . . . . . . . . . . . . . . . . . . . . . 49
vii

15 Number of Years A Stock Has Been Included in the Two-Minute Portfolio During
1999 to 2012 (Max: 14 Years) . . . . . . . . . . . . . . . . . . . . . . . . . . . . . . 50
viii

List of Figures
1 Annual Return of Investment Strategies . . . . . . . . . . . . . . . . . . . . . . . . 35
ix

Introduction
Two-Minute portfolio is an investment strategy proposed by Rob Carrick [2012] in 1999 in the
Globe and Mail. Rather than traditional portfolio allocation based on mean-variance optimiza-
tion, Carrick claims that an ideal investment strategy for conservative investors is to rebalance
portfolio holding to top 2 Canadian dividend-paying stocks (by market capitalization) in equal
portion in each of the 10 GICS (Global Industry ClassiVcation Standard) sectors. Subsequently,
each of the 10 GICS sectors is weighted equally at 10% of the overall investment portfolio at the
beginning of each calendar year. Carrick notes that by following such a simple strategy, investors
are better diversiVed than the TSX Composite Index (by the measurement of lower market risk
sensitivity, β), and will incur less Vnancial loss during market downturn.
Despite Carrick’s claim that the annual return of the Two-Minute portfolio consistently out-
performs the TSX Composite Index in most of the recent 26 years period, the conclusion on
Carrick’s experiment remains questionable. First of all, Carrick’s experiment has been solely
concerned with annual returns in a single year period, but fails to demonstrate the eUect of
holding the Two-Minute portfolio in a longer time horizon and in which extreme return in any
single year can severely aUect the value of the portfolio holding. Secondly, given that the Two-
Minute portfolio is consisted of 20 dividend-paying stocks, there is has been ambiguity regarding
whether the portfolio has been benchmarked against the TSX Composite Price Index or the TSX
Composite Total Return Index. Prior to 2010, Carrick [2009, 2010] has speciVed the Two-Minute
portfolio has benchmarked against the TSX Total Return Index, but such a description has been
dropped thereafter. The diUerence between the two indexes is rather signiVcant as the former
1

does not reWect the compounding growth from dividend payment. With a longer time horizon,
dividend payment may substantially increase the total value of the Two-Minute portfolio and
therefore resulting Two-Minute portfolio outperforms the TSX Composite Price Index. Thirdly,
despite Carrick’s conclusion Two-Minute portfolio is less volatile than the TSX market portfolio,
his account on the risk of the Two-Minute portfolio is solely based on the claim β (systematic
market risk) for the portfolio is less than 1. There has not been any measures on the individual
risk nor the risk-adjusted return for the investment strategy.
Our Vrst intention with this project is to benchmark the return of the Two-Minute portfo-
lio with these issues in mind and conclude whether a hypothetical investor will be better oU
by following the Two-Minute portfolio investment strategy in a prolonged investment horizon.
To fully observe and account for the volatility in the Two-Minute portfolio strategy and ex-
plain whether the investment strategy is ideal for conservative investors, we will be performing
analysis on the risk-adjusted return of the Two-Minute portfolio. Finally, we will analyze the
diUerences in portfolio weight between Two-Minute strategy and mean-variance strategy.
Literature Review
The Vrst crucial component of the Two-Minute portfolio has been concerned with the strategy’s
characteristic in equal-stock and equal-sector weight. In the past, various literature has been
focused on testing the performance of an equal-weighted portfolio strategy using measures in-
cluding Jensen alpha [Jensen, 1968], Sharpe ratio [Sharpe, 1966], Treynor ratio [Treynor, 1965],
and Information Ratio [Treynor and Mazuy, 1966]. However, no consensus has been drawn
2
concluding whether the equal-weight strategy has been better than a market index portfolio.
Duchin and Levy [2009] have benchmarked the performance between an equal-weighted
(1/N) Talmudic portfolio with out-of-sample Markowitz mean-variance optimized portfolio for
the 1991 to 2007 period. The analysis utilizes the Vrst sub-period of the investment horizon to
calculate parameters of the mean-variance optimization in the second sub-period. Following the
calculation of the mean return and standard deviation of the equal-weighted and mean-variance
portfolio, the diUerence on return at a Vxed standard deviation is reported. To conclude the
research, Duchin and Levy assert that for investors with smaller number of assets in portfolio
(less than 40), when parameters for the optimization are estimated from historical data, there
is no clear evidence that the mean-variance optimized portfolio dominates the equal-weighted
portfolio. The rationale behind is that the equal-weighted portfolio are not subjected to the
sampling errors associated with estimating the parameters from historical data.
DeMiguel et al. [2009] have shown that by using trailing 60-month historical returns, equal
sector weighted portfolio has outperformed both S&P 500 market portfolio and out-of-sample
mean-variance optimized portfolio by obtaining higher Sharpe ratio when taking account the
correlation between asset returns. The authors attribute the poor performance of the mean-
variance optimized portfolio to the optimization’s sensitivity on estimation error. On the other
hand, this conclusion has been rejected by Kritzman et al. [2010], asserting that any reasonable
investor will use a signiVcant longer period of estimation window, and with such a longer es-
timation window, backtesting results show the mean-variance optimized portfolio outperform
equal-weighted portfolio.
3

The second component of the Two-Minute portfolio has been concerned on the timing of
rebalanceing and the consequential eUect on the accumulative return.
Eakins and Stansell [2007] have examined alternative portfolio rebalancing strategies (thresh-
old trigger and calendar interval) on a portfolio initially consisted of 19 sector equally-weighted
(at 5.26%) funds on S&P 1500 Super Composite Index. The examination concludes that except for
sectors experiencing rapid growth, for the 1995 to 2001 period, optimal return based on Sharpe
ratio is achieved based on rebalance threshold when the weight of any sector grows to 9 percent.
On the other hand, no signiVcant performance-wise diUerences can be observed based on dif-
ferent calendar interval rebalancing strategies (based on month, quarter, semi-annual, or annual
rebalancing) as long as the interval is consistent throughout the testing period.
The last but yet distinctive component separating Two-Minute portfolio from most other
equal-sector weighted portfolio strategies is the imposition on large market capitalization and
dividend-paying stocks.
Through empirical testings based on 1963 to 1990 period, Fama and French [1992] conclude
that systematic market risk, β, cannot suXciently explain the average return on a stock, but
with additional factors in size (market capitalization) and book-to-market ratio. Fama and French
[1993] further extend this conclusion, asserting market capitalization is inversely correlated with
stock returns and risks. For instance, stocks with small market capitalization in general 1) earn
higher average returns and 2) are more volatile than market portfolio and stocks with large
market capitalization. Fama and French [1988] observe that dividend yield accounts for 25% of
the variance in the expected return of stock in a period between 2 to 4 years. In addition, Fama
4

and French [1993] imply high book-to-market ratio, a common indicator of dividend-paying
stock, is positively correlated with stock returns.
Fuller and Goldstein [2011] Vnd an asymmetrical relationship between dividend payment
and market return. SpeciVcally, dividend-paying stocks outperform non-dividend-paying stocks
more during a declining market and the magnitude of outperformance increases as the market
further declines.
Data
This section is dedicated to explain the procedures and assumptions that have been performed on
the dataset pertaining to prepare data for the stock screening process. Details on the construction
of the Two-Minute portfolio will be explained in-depth in the next section of this project.
As mentioned previously, the crucial step for rebalanceing in Two-Minute portfolio to deter-
mine market capitalization of dividend-paying stocks in each GICS sectors at the beginning of
each year. Throughout this project, market capitalization is deVned as
MktCapt = Pricet(Closing)× #ShareOutstandingt
Therefore, the following data for all stocks traded in the Toronto Stock Exchange at the Vrst
trading day of each year is required to screen the stock holdings in the Two-Minute portfolio:
• TIC (ticker) of the stock
• Price at the last trading day of previous year
5

• Number of shares outstanding at the last trading day of previous year
• Sum of dividend payment in previous year
• GICS sector code
Nevertheless, we found that no single stock database has complete 26 years historical informa-
tion that is required to identify stocks within the Two-Minute portfolio. The main challenge of
using one database is the following:
• Compustat Monthly Update Daily Security has missed dividend information and share
outstanding prior to 2000.
• CRSP Quarterly Updated Daily Security has missed GICS code and shares outstanding
prior to 1999 and do not use the same ticker code for Canadian stocks as the Compustat
database
Therefore, we have used combined stock and market data from four sources:
• Compustat Monthly Update Security Daily for TIC, Company Name, Stock Exchange Code,
Security Status Market, Issue Type Code, GIC Sectors, Shares Outstanding, Indicated An-
nual Dividend, Daily Close Price from 1998 to 2012 (Dividend payment information for
1998 to 2000 is missing)
• CRSP Quarterly Updated Security Daily for CUSIP, Share Code, Exchange Code, Trading
Status, Price, Number of Shares Outstanding, and Dividend Cash Amount from 1986 to
2000
6

• Compustat Annual Update Security Monthly for TIC, CUSIP, Company Name, Stock Ex-
change Code, Security Status Market, Issue Type Code, GIC Sectors, Shares Outstanding,
Indicated Annual Dividend, and Monthly Close Price 1986 to 1998
• CFMRC for TSX daily returns used for market portfolio benchmarking in the correspond-
ing periods
To narrow down the selection of portfolio holding to a scope that is easily accessible and more
realistic to individual investors, we have Vltered the stock data to include only active common-
share type security traded in the Toronto Stock Exchange. In CRSP Quarterly Updated Security
Daily, we have Vltered data to have a list of CUSIP that has paid dividend in previous year.
Then, complete Compustat Annual Update Security Monthly CUSIP (check digit removed) from
1986 to 1998 is matched against CRSP Quarterly Updated Security Daily CUSIP. In this way, we
have used December Monthly Close Price, Shares Outstanding, GICS Code from Compustat to
calculate market capitalization of dividend paying stock indicated by CRSP.
After a careful look at the data, however, we decide to limit the analysis and benchmark of
Two-Minute portfolio to include only 1999 to 2012 time period. This is due to the historical
Canadian data on number of shares outstanding prior to 1999 is too dirty for any meaningful ex-
amination: First of all, the reporting of number of shares outstanding is not consistent. In many
cases, the number of shares outstanding from the database is zero or the number is signiVcantly
non-linear between two consecutive years. Secondly, the numbers from CRSP and Compustat
for the same month are also signiVcantly diUerent from each other. We think one possible expla-
nation of the poor data quality can be attributed to incomplete historical stock split adjustment,
7

and therefore we cannot acquire meaningful data for these periods.
Procedure
Two-Minute Portfolio Construction
In order to set up the Two-Minute portfolio, we will be closely following Carrick’s description.
SpeciVcally, at the beginning of each year, two stocks in each sector are rebalanced to carry equal
weight; each of the ten GICS sectors will be equally rebalanced to carry weight at 10% (put in
another way, the method indicates equally 5% weight in each of the 20 stock holdings). In brief,
the amount of investment in each security i at the Vrst trading day t of each year immediately
after re-balancing (Si,t) is
Si,t = ∑[Si,t−1 × ((Pi,t + Di,t)/Pi,t−1)]×Wi,t (1)
where
• Pi,t is the daily price of security i in day t
• Wi,t is the allowable weight of the security i at day t
• Di,t is the dollar dividend of security i paid at day t
We have modeled the daily balance of security i as
Si,t = Si,t−1 × ((Pi,t + Di,t)/Pi,t−1)× 1{Wi,t>0} (2)
8

where
• 1{Wi,t>0} value of 1 denotes we are holding security i at time t
Themajor diUerence between (1) and (2) is at rebalancing day the value of each security i depends
on the total value of the portfolio at the previous trading day (in last year); the daily value of each
security i on non-rebalancing day depends only on the value of the security at previous trading
day. Note that we have assumed dividend is reinvested. This assumption is not only easier to
model but is also consistent with the idea embedded in the TSX Composite Total Return index,
which accounts for the compounding of dividend payment.
Since Carrick does not have full disclosure on the list of stocks in the Two-Minute portfolio
in each year, the diXculty associated with the setup is that in certain years the composition of
the Two-Minute portfolio does not have full 20 stocks. For instance, in year 1999 to 2004, only
one stock (NDN.) in the Health Care sector satisVes the requirement of dividend payment. In
such cases, we have adjusted the weight of the one stock to be 10% of the portfolio. On the other
hand, in year 2000, there is no stock in the Information Technology sector pays dividend. We
therefore treat the weight of each remaining sector to be 11.11% and each individual stock to be
5.56%.
The source of such discretion can be traced to Carrick’s inconsistent deVnition of the Two-
Minute portfolio strategy in the past:
• The 2001 article [Carrick, 2001] has used a diUerent sector classiVcation system. SpeciV-
cally, the largest market capitalization stocks from each one of 14 Toronto Stock Exchange
industries are picked, rather than largest two stocks from 10 GICS sectors.
9

• A rather major diUerence is that at least until 2003 [Carrick, 2003], the requirement of
dividend-paying stock has not been imposed. Such a discrepancy will result a signiVcant
diUerent list of holdings.
• The sector weights in 2003 [Carrick, 2003] and subsequent periods may have been biased.
For instance, the 2003 Two-Minute portfolio has been a mixture of GICS sector classiV-
cation and TSE industry classiVcation. SpeciVcally, Carrick chooses one stock from each
of 10 GICS sectors and then one stock from 3 TSE industry classiVcation which he thinks
is under-represented in the GICS sector. In eUect, material sector has a weight of 23.1%,
Vnancial sector has a weight of 15.4%, and the rest 8 of GICS sectors have a weight of 7.7%.
Such a manipulation is clearly a contradiction to the advertisement of sector diversiVca-
tion.
Portfolio Analysis
Beyond benchmarking the dollar value of holding the Two-Minute portfolio at each year, several
performance measurement ratio will be examined. For simplicity, daily risk-free rate (r f ) used
in the following calculations are assumed to be zero. In addition, when presenting the results,
return and standard deviation have been annualized using
r = (1 + E[ri])n − 1
and
σ = σi√
n
10

where
• ri is the daily return of the asset
• E[ri] is the arithmetic average of ri
• σi is the standard deviation on daily return of the asset
• n is the number of trading day in a year
To further determine the time-variability of the results, we have additionally sub-grouped data
into three time-periods:
1. 1999 to 2005
2. 2005 to 2011
3. 1999 to 2011
The Vrst set of ratio we will be looking at is excess return (rexcess) and Jensen’s alpha (α). Excess
return determines if the return of Two-Minute portfolio has been higher than the market return
(TSX in this case); Jensen’s alpha determines the excess (abnormal) return of the Two-Minute
portfolio over the theoretical CAPM (Capital Asset Pricing Model) expected return.
rexcess = avg(rp − rm)
α = rp − [r f + β(rm − r f )]
11

where β, the sensitivity on portfolio return with respect to market return, is deVned as
β =Cov(rp, rm)
Var(rp)
R2 measures the eUectiveness of CAPM in predicting the return on an individual asset. Given
CAPM expected return is based on the systematic risk of an asset, another interpretation is
1− R2 is the proportion of undiversiVable individual risk of the asset.
R2 =
[Cov(rp, rm)
σpσm
]2
With an assumption on normal distribution, two-sided hypothesis testing will be performed
to determine the signiVcance of excess return and Jensen’s alpha. SpeciVcally, we will be testing
H0 :rexcess = 0
HA :rexcess 6= 0
and
H0 :α = 0
HA :α 6= 0
To determine the risk-adjusted return, we will be comparing the Sharpe ratio and Treynor
ratio of Two-Minute portfolio and TSX market potfolio. Sharpe ratio (S) measures a portfolio’s
12

excess return relative to total risk; Treynor ratio (T) measures a portfolio’s excess return relative
to systematic (undiversiVable) risk.
S =ri − r f
σi
T =ri − r f
βi
Information ratio (IR) measures the eUectiveness of the trade-oU between the active return
and the amount of risk taken pertaining to such an active return. Note that the denominator of
the equation is also known as the tracking error.
IR =rp − rm√
Var(rp − rm)
To further examine the risk-reward relationship, we will proceed in comparing the Two-
Minute portfolio with mean-variance eXcient portfolio. Daily return of 2011 will be used to
calculate the expected return and variance-covariance matrix for mean-variance optimization in
2012. With respect to the same standard deviation, if the return of Two-Minute portfolio is less
than the return from the mean-variance optimizer, then the Two-Minute portfolio is not eXcient.
Results
Stock Holding
With the GICS Code and Market Capitalization obtained from previous section, we are able to
identify the stock holding of the Two-Minute portfolio. Table 1 to 5 on page 36 to 40 list the hold-
13

ing of the portfolio at the beginning of each year with the corresponding market capitalization
and the Appendices list the VBA codes we have used to process the data.
As a side note, after compiling the Two-Minute portfolio, we have found minor diUerences
between our holding list and that suggested by Carrick for year 2011. For instance, in the 2011
telecommunication sector, Carrick recommends holding Telus (T.) with $18,717 million market
capitalization as the second largest market cap stock; Our calculation as well as a veriVcation
on Bloomberg Terminal Vnds out the market capitalization for Telus at the beginning of 2011 is
only $7,959 million but rather, Rogers (RCI.B) with market capitalization $15,321 million should
be held. The resulting diUerence is 1.3% higher overall return in Carrick’s 2011 version of Two-
Minute portfolio and will not aUect the conclusion Two-Minute portfolio outperforms TSX in-
dexes in that year. Given that Carrick has signiVcantly updated the deVnition of Two-Minute
portfolio strategy in the past and does not disclose the updated historical holding, it is impossi-
ble for us to further trace back and compare the diUerences between the holding results. Having
that said, in order to maintain screening list from consistent data and criteria throughout time,
we decide to take the dividend and market capitalization calculation we have from Compustat
and CRSP as it is without any manipulation.
Portfolio Value
As previously described, Carrick’s ambiguous imposition regarding whether the dividend-paying
Two-Minute portfolio has been benchmarked against a dividend-paying market index may lead
to a biased conclusion in favour of the Two-Minute portfolio, holding values of the investment
14

strategy in both cases (with and without dividend) at a speciVc period are presented in the fol-
lowing tables:
• Table 6 on page 41 lists the holding value of Two-Minute portfolio without accounting for
dividend
• Table 7 on page 42 lists the holding value of Two-Minute portfolio with accounting for
dividend
• Table 8 on page 43 lists the holding value of TSX Composite Price Index
• Table 9 on page 44 lists the holding value of TSX Composite Total Return Index
The horizontal axis in the tables identiVes the start of the investment period and the vertical
axis identiVes the end of the investment period. For instance, referring to Table 6 on page 41,
if an investor starts with $100,000 capital in the Two-Minute portfolio at the Vrst trading day of
1999, without accounting for dividend payment and any external cashWow, the investor will end
up with $111,056 at the Vrst trading day of 2012.
Table 10 on page 45 demonstrates the summary statistics for the benchmarking of the Two-
Minute portfolio with respect to TSX market portfolio. SpeciVcally, it identiVes the number of
years the portfolio holding value of a Two-Minute portfolio strategy outperforms the TSX Index
during a given investment horizon. For instance, an investor who invests the without-dividend
Two-Minute portfolio strategy in 2007 will have his/her portfolio holding value higher than the
TSX Price Index in 1 of 5 years, measured at each rebalancing.
15

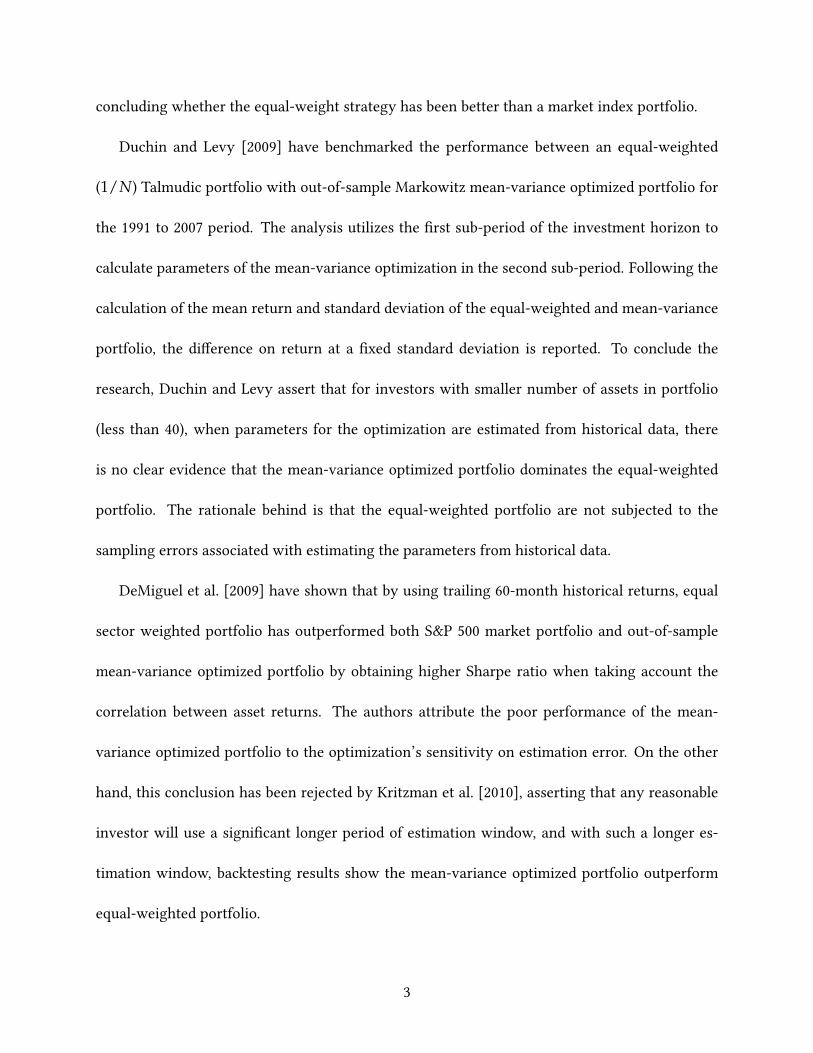
Discussion
Portfolio Return
Of the three cases we have benchmarked, the case with-dividend Two-Minute portfolio against
without dividend TSX index provides the most supportive argument to the Two-Minute portfolio
investment strategy. Carrick’s description on the performance of the Two-Minute portfolio is
most likely to be derived from this case. For instance, by comparing the diagonal axis of Table 7
on page 42 and Table 8 on page 43, we can observe that 1) in 7 of 13 years the annual return of
Two-Minute portfolio strategy outperformed the TSX Index, 2) Two-Minute portfolio performs
less well than the TSX in times of economic bubbles such as 1999 and 2004 to 2007, and 3)
Two-Minute portfolio performs better when TSX performs badly in years such as 2000 and 2008.
The reason behind Two-Minute portfolio attaining higher per annum may be associated with
Jegadeesh and Titman [1993], which concludes that stocks that have performed well in the past
tend to remain performing well in the future 3 to 12 month holding periods: In eUect, rebalancing
by choosing stock with top 2 market capitalization in each sector picks up stocks that perform
well in the past year.
Nevertheless, the above exercise has been only concerned with per annum return in a single
period. A look at the cumulative value of the benchmarking result from Table 10 on page 45
yields a set of strikingly diUerent and inconsistent conclusions.
• If an investor starts with $100,000 in the beginning of 1999, there is only 2 of 13 years the
value of the Two-Minute portfolio is greater than if the capital is invested into the TSX
16

Index.
• An adjacent investment period starts with the beginning of 2000 will outperform the TSX
Price Index in 8 of 12 years.
• An investor follows the Two-Minute portfolio investment strategy at the beginning of 2004
will be underperformed by the TSX Price Index in 8 of 8 years.
Figure 1 on page 35 plots the annual return of the Two-Minute portfolio against the TSX Index.
An observation on the plot reveals that in 1999 the Two-Minute portfolio has been outperformed
by the TSX Total Return Index by 22%. Such 22% diUerence in one year return leads to the fact
that investors who start to invest in Two-Minute portfolio in 2000 will outperform TSX Index 6
more times than investors who start to invest in 1999.
The bottom line we found here is that a single year extreme return can signiVcantly skew the
cumulative return of the underlying investment portfolio. In addition, in a more realistic case
which investors have greater than one year investment horizon and receive dividend, there is
no clear sign that the dollar investment in the Two-Minute portfolio is superior to investment in
either TSX Price or TSX Total Return Index.
Table 11 on page 46 lists the performance measurement ratio described in the procedure
section of this project. In all three sub-periods, the annualized return of the Two-Minute portfolio
is less than the return of TSX market portfolio. However, despite the fact excess returns are
greater than -5%, we cannot reject the null hypothesis that excess return or Jensen’s alpha is
zero at 95% signiVcance. Such results are accompanied by high variances on the diUerences
of return in the two portfolios and oUer additional support to our previous conclusion, that in
17

multiple year investment horizon, there is no evidence that the performance of the Two-Minute
portfolio is better than the TSX market portfolio.
The market risk sensitivity, β, in all sub-periods are less than 1. Such results are consis-
tent with Carrick’s calculation and partially explain Carrick’s description that the Two-Minute
portfolio performs less well when the economic in growth and outperform the TSX when the
economic is in decline: the return of the Two-Minute portfolio is increased only to a fraction
(β) of the increase in the TSX Index and decrease to the same fraction of the decrease in the
TSX Index. Recall holdings in the Two-Minute portfolio are among the top market capitalization
available in the market, the observed lower β is consistent with the size eUect, which implies
that larger market capitalization stocks underperform smaller market capitalization stock: the
Two-Minute portfolio strategy has no exposure to smaller company in the stage of high growth.
However, the result on β should not be overlooked: As R2 is only 31.25% for 1999 to 2005 pe-
riod and 55.51% for 1999 to 2011 period, the lower R2 indicates there remains large portion of
individual risks unexplained by β.
A look at σ from all sub-periods indicate the total risk of the Two-Minute portfolio is less
than the TSX Price Index market portfolio. However, despite lower risks (measured in term of σ
and β) for the Two-Minute portfolio, when the returns from the portfolios are considered, lower
values in the two of risk-adjusted return measures, Sharpe ratio and Treynor ratio, as well as
negative values in the Information Ratio, all suggest the trade-oU between risk and return in the
Two-Minute portfolio is not as eXcient as the TSX Price Index market portfolio.
18

Asset Allocation
Taking a step further on asset allocation, the Two-Minute portfolio’s strategy of holding top 2
market capitalization stocks in each sector is not mean-variance eXcient. With methodology
discussed in the procedure section, Table 12 on page 47 shows ten points on the eXcient frontier
with corresponding return, risk, and weight drawing from historical daily return occurred in
2011. Holding standard deviation at 0.006, the daily return for the Vrst six months of Two-Minute
portfolio in 2012 is -0.00018 and the mean-variance portfolio return is 0.0005.
Notice even in the most conservative case, at least one of the two stocks in the many sectors
has a weight of zero. The implication behind, as suggested in Table 13 on page 48, is that the
high market capitalization security in the same sectors are driven by the same market driver.
In addition, some of the more heavily weighted sector in the TSX Index, such as the Vnancial
sectors, does not occupy any weight in the mean-variance eXcient portfolio. The explanation
can be observed from Table 14 on page 49, which shows that the performance of the Canadian
Financial sector is more than 60% correlated with Energy, Consumer Discretionary, and Utilities
sectors. Therefore, given the risk factors are similar, when the returns in the three sectors are
higher, the weight in the Vnancial sector can be substituted without increasing overall portfolio
risk.
Portfolio Turnover
Table 15 summarizes the turnover of the stocks in the Two-Minute portfolio. It can be observed
that the ranking of market capitalization and dividend paying stocks in the Canadian stock mar-
19

ket is relatively stable in most sectors. Namely, within the 14 years holding period we are ana-
lyzing, all 10 sectors except Energy and Information Technology have at least 1 stock that has
been included in the Two-Minute portfolio for 10 years or more. For 8 of 10 sectors the Two-
Minute portfolio is dominated by less than 4 stocks. However, a second look at the turnover list
may lead to a potentially interesting discussion that whether swapping stocks at the beginning of
each year with a Vrmly set trading rule is necessary and beneVcial. For instance, in the Consumer
Discretionary sector, Shoppers (SC.) and George Weston (WN.) are competing intensively for the
market capitalization leader position. Given that each of the two stocks has been included in the
portfolio for 7 times and there is an alternative pattern of switching between the two stock in the
Two-Minute portfolio, a more careful benchmark with realistic considerations such as taxation
and transaction cost may reveal a seemingly diUerent view on the eUectiveness of Two-Minute
portfolio trading rule, especially if the returns of the two stocks are highly correlated.
Conclusion
In this project, we have shown that despite the per-year return may be higher for the Two-
Minute portfolio, holding the Two-Minute portfolio for a prolonged investment period may not
be better oU than holding the TSX Index (with or without dividend). In fact, in most of the cases
as we have shown, the value of the resulting Two-Minute portfolio is less than holding the TSX
Index despite of dividend payment. Extreme return in any single year could signiVcantly aUect
the accumulative return of the Two-Minute portfolio.
The return of Two-Minute portfolio has been consistently less volatile than the TSX Index
20
mainly arises from the fact Two-Minute portfolio is composed of large-cap stocks rather than
better diversiVcation. Nevertheless, when risk-adjusted return is concerned, the return in the
Two-Minute portfolio is not as desirable as the return in the TSX market portfolio. From the
prospective of diversiVcation, the Two-Minute portfolio investment strategy of holding equal
weight in the top 2 market capitalization stock is not optimal in terms of dealing with the corre-
lation between diUerent securities.
21

Bibliography
Rob Carrick. Our Two-minute Portfolio Check Shows Big Is Best. The Globe and Mail, July 7
2001. URL http://www.globeinvestor.com/portfolio/gam/twominute.html.
Rob Carrick. Revamped 2-minute Portfolio Set To Beat Index. The Globe and Mail, Mar 15 2003.
URL http://www.globeinvestor.com/portfolio/gam/2_minute_portfolio.html.
Rob Carrick. Two-minute Portfolio Beats Index In A Tough Year. The Globe and Mail, Jan
10 2009. URL http://www.theglobeandmail.com/globe-investor/investment-ideas/
a-portfolio-that-rewards-simple-patient-investing/article4192129/.
Rob Carrick. Slow And Steady For The Two-minute Portfolio. The Globe and Mail, Jan
08 2010. URL http://www.theglobeandmail.com/globe-investor/investment-ideas/
slow-and-steady-for-the-two-minute-portfolio/article4301496/.
Rob Carrick. The Two-Minute Portfolio Beat the TSX Last Year. The Globe and Mail, Jan
06 2012. URL http://www.theglobeandmail.com/globe-investor/investment-ideas/
the-two-minute-portfolio-beat-the-tsx-last-year/article545440/.
Victor DeMiguel, Lorenzo Garlappi, and Raman Uppal. Optimal Versus Naive DiversiVcation:
How IneXcient is the 1/N Portfolio Strategy? Review of Financial Studies, 22(5):1915 – 1953,
2009. ISSN 08939454.
Ran Duchin and Haim Levy. Markowitz Versus the Talmudic Portfolio DiversiVcation Strategies.
Journal of Portfolio Management, 35(2):71 – 74, 2009. ISSN 00954918.
22

Stanley G. Eakins and Stanley Stansell. An Examination of Alternative Portfolio Rebalancing
Strategies Applied to Sector Funds. Journal of Asset Management, 8(1):1 – 8, 2007. ISSN
14708272.
Eugene F. Fama and Kenneth R. French. Dividend yields and expected stock returns. Journal of
Financial Economics, 22(1):3 – 25, 1988. ISSN 0304405X.
Eugene F. Fama and Kenneth R. French. The Cross-Section of Expected Stock Returns. The
Journal of Finance, 47(2):pp. 427–465, 1992. ISSN 00221082.
Eugene F. Fama and Kenneth R. French. Common Risk Factors In The Returns On Stocks And
Bonds. Journal of Financial Economics, 33(1):3 – 56, 1993. ISSN 0304405X.
Kathleen P. Fuller and Michael A. Goldstein. Do dividends matter more in declining markets?
Journal of Corporate Finance, 17(3):457 – 473, 2011. ISSN 09291199.
Narasimhan Jegadeesh and Sheridan Titman. Returns to Buying Winners and Selling Losers:
Implications for StockMarket EXciency. Journal of Finance, 48(1):65 – 91, 1993. ISSN 00221082.
Michael C. Jensen. The Performance Of Mutual Funds In The Period 1945-1964. Journal of
Finance, 23(2):389 – 416, 1968. ISSN 00221082.
Mark Kritzman, Sébastien Page, and David Turkington. In Defense of Optimization: The Fallacy
of 1/N. Financial Analysts Journal, 66(2):1 – 9, 2010. ISSN 0015198X.
William F. Sharpe. Mutual Fund Performance. Journal of Business, 39(1):119, 1966. ISSN 00219398.
23

Jack L. Treynor. How to Rate Management of Investment Funds. Harvard Business Review, 43(1):
63 – 75, 1965. ISSN 00178012.
Jack L. Treynor and Kay K. Mazuy. Can Mutual Funds Outguess the Market? Harvard Business
Review, 44(4):131 – 136, 1966. ISSN 00178012.
24

Appendices
Processing and Identifying Holdings In the Two-Minute Portfolio
1 Sub Main()
2 ' Start Program by Running this Macro
3 ' Requires processed WRDS data in "WRDS20XX.csv"
4 ' Zhong Wang (2012)
5
6 StartDate = 1999
7 EndDate = 2012
8
9 Call ReadandJoinWRDSCSV(StartDate , EndDate)
10 Call CreatSummaryPivot
11 Call HoldingSummary(StartDate , EndDate)
12 Call GetTickerList(StartDate , EndDate)
13 Call LookUpCompanyName
14
15 MsgBox "Stage 1 Completed. Fetch Stock daily price with TICList
.txt from WRDS"
16
17 End Sub
18
19 Sub ReadandJoinWRDSCSV(StartDate , EndDate)
20 '
21 On Error Resume Next
22 Application.DisplayAlerts = False
23 ActiveWorkbook.Sheets("AggregatedData").Delete
24
25 Application.DisplayAlerts = True
26 On Error GoTo 0
27
28 Sheets.Add(After:= Worksheets(Worksheets.Count)).Name = "
AggregatedData"
29
30
31 Header = 0
32
33 For i = EndDate To StartDate Step -1
34
35 If i >= 1998 Then
36 Workbooks.Open Filename := ThisWorkbook.Path & "\WRDS\
WRDS" & i & ".csv"
37
38
25

39 If Header = 1 Then
40 Range("A1").Select
41 ActiveCell.Offset(1, 0).Range("A1").Select
42 End If
43
44
45 Range(Selection , Selection.End(xlDown)).Select
46 Range(Selection , Selection.End(xlToRight)).Select
47 Selection.Copy
48 Windows("VBAProctocol_Stage1.xlsm").Activate
49 Sheets("AggregatedData").Select
50 ActiveSheet.Paste
51 Windows("WRDS" & i & ".csv").Activate
52 Application.DisplayAlerts = False
53 ActiveWindow.Close
54 Application.DisplayAlerts = True
55 LastRow = Cells.Find(What:="*", After :=[A1], SearchOrder :=
xlByRows , SearchDirection := xlPrevious).Row
56 Range("A" & LastRow + 1).Select
57
58 Header = 1
59
60 End If
61
62 Next i
63
64 LastRow = Cells.Find(What:="*", After :=[A1], SearchOrder :=
xlByRows , SearchDirection := xlPrevious).Row
65
66 Range("A1").Select
67 Selection.End(xlToRight).Select
68 ActiveCell.Offset(0, 1).Range("A1").Select
69 ActiveCell.FormulaR1C1 = "MktCap"
70 ActiveCell.Offset(1, 0).Range("A1").Select
71 ActiveCell.FormulaR1C1 = "=RC[-9]*RC[-7]"
72 ActiveCell.Select
73 Selection.AutoFill Destination := ActiveCell.Range("A1:A" &
LastRow)
74
75 Range("A1").Select
76 Selection.End(xlToRight).Select
77 ActiveCell.Offset(0, 1).Range("A1").Select
78 ActiveCell.FormulaR1C1 = "Year"
79 ActiveCell.Offset(1, 0).Range("A1").Select
80 ActiveCell.FormulaR1C1 = "=LEFT(RC[-13],4)"
26

81 ActiveCell.Select
82 Selection.AutoFill Destination := ActiveCell.Range("A1:A" &
LastRow)
83
84 Cells.Replace "#N/A", "=Rand()/1000", xlWhole
85
86
87 End Sub
88
89
90 Sub LookUpCompanyName ()
91
92 Dim command As String
93
94 Lastcolumn = Cells.Find(What:="*", After :=[A1], SearchOrder
:= xlByColumns , SearchDirection := xlPrevious).Column
95 LastRow = Cells.Find(What:="*", After :=[A1], SearchOrder :=
xlByRows , SearchDirection := xlPrevious).Row
96 LastAddress = Cells(LastRow , Lastcolumn).Address
97
98 Range("B1").Select
99 ActiveCell.Range("C1:C" & LastRow).Select
100
101 command = "=INDEX(AggregatedData!" & "E2:E50000 ,MATCH(A1:
A500 ,AggregatedData!D2:D50000 ,0))"
102 Selection.FormulaArray = command
103
104
105 End Sub
106
107 Sub HoldingSummary(StartDate , EndDate)
108
109 On Error Resume Next
110
111 Application.DisplayAlerts = False
112 ActiveWorkbook.Sheets("HoldingSummary").Delete
113 Application.DisplayAlerts = True
114 On Error GoTo 0
115
116 Sheets.Add(After:= Worksheets(Worksheets.Count)).Name = "
HoldingSummary"
117
118 For i = StartDate To EndDate
119
120 Range("A1").Select
27

121 ActiveCell.FormulaR1C1 = "Year" & i
122 ActiveCell.Offset(1, 0).Range("A1").Select
123 Sheets("PivotTable").Select
124
125
126 ActiveSheet.PivotTables("PivotTable2").PivotFields("Year").
ClearAllFilters
127 ActiveSheet.PivotTables("PivotTable2").PivotFields("Year").
CurrentPage = i
128
129
130 Range("A7").Select
131 ActiveCell.Range("A1:C1").Select
132 Range(Selection , Selection.End(xlDown)).Select
133 Selection.Copy
134 Sheets("HoldingSummary").Select
135 ActiveSheet.Paste
136 ActiveCell.Columns("A:A").EntireColumn.Select
137 Application.CutCopyMode = False
138 Selection.Insert Shift:=xlToRight , CopyOrigin :=
xlFormatFromLeftOrAbove
139 Selection.Insert Shift:=xlToRight , CopyOrigin :=
xlFormatFromLeftOrAbove
140 Selection.Insert Shift:=xlToRight , CopyOrigin :=
xlFormatFromLeftOrAbove
141 Next i
142
143 Lastcolumn = Cells.Find(What:="*", After :=[A1], SearchOrder
:= xlByColumns , SearchDirection := xlPrevious).Column
144 LastRow = Cells.Find(What:="*", After :=[A1], SearchOrder :=
xlByRows , SearchDirection := xlPrevious).Row
145 LastAddress = Cells(LastRow , Lastcolumn).Address
146
147 Lastcolumn = Cells.Find(What:="*", After :=[A1], SearchOrder
:= xlByColumns , SearchDirection := xlPrevious).Column
148 LastColumnLetter = Left(Cells(1, Lastcolumn).Address(False ,
False), 1 - (Lastcolumn > 26))
149
150 ActiveCell.Columns("A:" & LastColumnLetter).EntireColumn.
EntireColumn.AutoFit
151
152
153 End Sub
154
155
28

156
157 Sub GetTickerList(StartDate , EndDate)
158
159 ActiveWorkbook.Sheets("HoldingSummary").Select
160
161 Lastcolumn = Cells.Find(What:="*", After :=[A1], SearchOrder
:= xlByColumns , SearchDirection := xlPrevious).Column
162 LastRow = Cells.Find(What:="*", After :=[A1], SearchOrder :=
xlByRows , SearchDirection := xlPrevious).Row
163 LastAddress = Cells(LastRow , Lastcolumn).Address
164
165 ActiveSheet.Range("$A$1:" & LastAddress).Select
166
167 Application.DisplayAlerts = False
168 Selection.CreateNames Top:=True , Left:=False , Bottom :=False
, Right:= _
169 False
170 Application.DisplayAlerts = True
171
172
173 On Error Resume Next
174
175 Application.DisplayAlerts = False
176 ActiveWorkbook.Sheets("TICList").Delete
177 Application.DisplayAlerts = True
178 On Error GoTo 0
179
180
181 Sheets.Add(After:= Worksheets(Worksheets.Count)).Name = "
TICList"
182
183
184
185 For i = StartDate To EndDate
186
187 ThisWorkbook.Names("Year" & i).RefersToRange.Copy
188 ActiveSheet.Paste
189
190 Lastcolumn = Cells.Find(What:="*", After :=[A1], SearchOrder
:= xlByColumns , SearchDirection := xlPrevious).Column
191 LastRow = Cells.Find(What:="*", After :=[A1], SearchOrder :=
xlByRows , SearchDirection := xlPrevious).Row
192 LastAddress = Cells(LastRow , Lastcolumn).Address
193
194
29

195 Range("$A" & LastRow + 1).Select
196
197 Next i
198
199
200 ActiveSheet.Range("$A$1:" & LastAddress).RemoveDuplicates
Columns :=1, Header :=xlNo
201
202
203 Lastcolumn = Cells.Find(What:="*", After :=[A1], SearchOrder
:= xlByColumns , SearchDirection := xlPrevious).Column
204 LastRow = Cells.Find(What:="*", After :=[A1], SearchOrder :=
xlByRows , SearchDirection := xlPrevious).Row
205 LastAddress = Cells(LastRow , Lastcolumn).Address
206
207 ActiveSheet.Range("$A$1:" & LastAddress).Select
208
209 For Each cell In Selection
210 If IsNumeric(cell) Then
211 cell.ClearContents
212 End If
213 Next cell
214
215
216 On Error Resume Next
217 Columns (1).SpecialCells(xlCellTypeBlanks).EntireRow.Delete
218 On Error GoTo 0
219 LastRow = Cells.Find(What:="*", After :=[A1],
SearchOrder :=xlByRows , SearchDirection :=
xlPrevious).Row
220
221 Range("A1:A" & LastRow).Select
222 Selection.Copy
223 Application.DisplayAlerts = False
224 Workbooks.Add
225 ActiveSheet.Paste
226 ActiveWorkbook.SaveAs Filename := _
227 ThisWorkbook.Path & "\TICList.txt" _
228 , FileFormat :=xlCSV , CreateBackup := False
229
230 ActiveWorkbook.Close
231 Application.DisplayAlerts = True
232
233 End Sub
234
30

235
236 Sub CreatSummaryPivot ()
237
238 On Error Resume Next
239
240 Application.DisplayAlerts = False
241 ActiveWorkbook.Sheets("PivotTable").Delete
242 Application.DisplayAlerts = True
243 On Error GoTo 0
244
245
246
247 Sheets("AggregatedData").Select
248
249 Lastcolumn = Cells.Find(What:="*", After :=[A1], SearchOrder
:= xlByColumns , SearchDirection := xlPrevious).Column
250 LastRow = Cells.Find(What:="*", After :=[A1], SearchOrder :=
xlByRows , SearchDirection := xlPrevious).Row
251 LastAddress = Cells(LastRow , Lastcolumn).Address
252
253
254
255 Range("A1").Select
256 Range(Selection , Selection.End(xlToRight)).Select
257 Range(Selection , Selection.End(xlDown)).Select
258 Sheets.Add(After:= Worksheets(Worksheets.Count)).Name = "
PivotTable"
259
260 ActiveWorkbook.PivotCaches.Create(SourceType :=xlDatabase ,
SourceData := _
261 "AggregatedData!R1C1:R" & LastRow & "C16", Version :=
xlPivotTableVersion14). _
262 CreatePivotTable TableDestination :="PivotTable!R3C1",
TableName :="PivotTable2" _
263 , DefaultVersion := xlPivotTableVersion14
264 Sheets("PivotTable").Select
265 Cells(3, 1).Select
266 Sheets("PivotTable").Select
267 With ActiveSheet.PivotTables("PivotTable2").PivotFields("
Year")
268 .Orientation = xlPageField
269 .Position = 1
270 End With
271 ActiveSheet.PivotTables("PivotTable2").AddDataField
ActiveSheet.PivotTables( _
31

272 "PivotTable2").PivotFields("MktCap"), "Sum of MktCap",
xlSum
273 With ActiveSheet.PivotTables("PivotTable2").PivotFields("
GSECTOR")
274 .Orientation = xlRowField
275 .Position = 1
276 End With
277 With ActiveSheet.PivotTables("PivotTable2").PivotFields("
SECSTAT")
278 .Orientation = xlPageField
279 .Position = 1
280 End With
281 With ActiveSheet.PivotTables("PivotTable2").PivotFields("
EXCHG")
282 .Orientation = xlPageField
283 .Position = 1
284 End With
285 ActiveSheet.PivotTables("PivotTable2").AddDataField
ActiveSheet.PivotTables( _
286 "PivotTable2").PivotFields("PRCCD"), "Sum of PRCCD",
xlSum
287 With ActiveSheet.PivotTables("PivotTable2").PivotFields("
tic")
288 .Orientation = xlRowField
289 .Position = 2
290 End With
291 Sheets("PivotTable").Name = "PivotTable"
292 ActiveSheet.PivotTables("PivotTable2").PivotFields("tic").
PivotFilters.Add _
293 Type:= xlTopCount , DataField := ActiveSheet.PivotTables("
PivotTable2"). _
294 PivotFields("Sum of MktCap"), Value1 :=2
295 ActiveSheet.PivotTables("PivotTable2").PivotFields("EXCHG")
.ClearAllFilters
296 ActiveSheet.PivotTables("PivotTable2").PivotFields("EXCHG")
.CurrentPage = "7"
297 ActiveSheet.PivotTables("PivotTable2").PivotFields("SECSTAT
").ClearAllFilters
298 ActiveSheet.PivotTables("PivotTable2").PivotFields("SECSTAT
").CurrentPage = "A"
299
300 With ActiveSheet.PivotTables("PivotTable2").PivotFields("
GSECTOR")
301 .PivotItems("(blank)").Visible = False
302 End With
32

303 With ActiveSheet.PivotTables("PivotTable2").PivotFields("
TPCI")
304 .Orientation = xlPageField
305 .Position = 1
306 End With
307 ActiveSheet.PivotTables("PivotTable2").PivotFields("TPCI").
ClearAllFilters
308 ActiveSheet.PivotTables("PivotTable2").PivotFields("TPCI").
CurrentPage = "0"
309
310 With ActiveSheet.PivotTables("PivotTable2")
311 .ColumnGrand = False
312 .RowGrand = False
313 End With
314 ActiveCell.Select
315 ActiveSheet.PivotTables("PivotTable2").PivotFields("GSECTOR
").Subtotals = Array _
316 (False , False , False , False , False , False , False , False
, False , False , False , False)
317 End Sub
Value of Two-Minute Portfolio Holding Period
1 Sub HoldingPeriodValue ()
2 ' Calculate the Holding Period Value
3 ' Zhong Wang and Qi Yang (2012)
4
5 Range("A1").Select
6
7 Range("AQ4").Select
8 Selection.AutoFill Destination := ActiveCell.Range("A1:A3461"
)
9 ActiveCell.Range("A1:A3461").Select
10
11
12 For j = 0 To 12
13
14
15 Cells.Find(What :=1999 + j & "01", After:=ActiveCell , LookIn
:=xlFormulas , LookAt _
16 :=xlPart , SearchOrder :=xlByRows , SearchDirection :=
xlNext , MatchCase := _
17 False , SearchFormat := False).Activate
18 ActiveCell.Offset(-1, 40).Range("A1").Select
19 ActiveCell.FormulaR1C1 = "100000"
33

20
21
22 For i = 1 To 13
23
24
25 Cells.Find(What :=1999 + i & "01", After:=ActiveCell , LookIn
:=xlFormulas , LookAt _
26 :=xlPart , SearchOrder :=xlByRows , SearchDirection :=
xlNext , MatchCase := _
27 False , SearchFormat := False).Activate
28 ActiveCell.Offset(-1, 40).Range("A1").Select
29 Selection.Copy
30 Application.Goto Reference :="R4C46"
31 ActiveCell.Offset (1 + i, j).Range("A1").Select
32 Selection.PasteSpecial Paste := xlPasteValues , Operation :=
xlNone , SkipBlanks _
33 :=False , Transpose := False
34
35 Next i
36
37 Next j
38
39 End Sub
34

Figure 1: Annual Return of Investment Strategies
1999 2000 2001 2002 2003 2004 2005 2006 2007 2008 2009 2010 2011−0.4
−0.35
−0.3
−0.25
−0.2
−0.15
−0.1
−0.05
0
0.05
0.1
0.15
0.2
0.25
0.3
0.35
0.40.4
Ret
urn
(%)
Year
TSXTSX Div2Min2Min Div
35

Table 1: Holding of Two Minute Portfolio (Year 2012 to Year 2010)
Year2012 MktCap Price Year2011 MktCap Price Year2010 MktCap Price
Energy
CNQ. 43074923940 39.33 CNQ. 48072741580 44.14 CNQ. 41730908400 76.95SU. 49527352160 31.46 SU. 59486343360 38.04 SU. 59705870000 38.3
Material
ABX. 48871530960 48.86 ABX. 50867740000 51.59 ABX. 41370194560 42.08POT. 37744187880 43.96 POT. 46439172000 156 POT. 34526353890 116.69
Industrial
CNR. 35157675340 79.21 CNR. 30569290680 66.27 CNR. 26861736780 57.06CP. 11906991630 70.11 CP. 10901330800 64.45 CP. 9527025200 56.6
Con Disc
SJR.B 8415979410 20.19 MG. 13537816600 55.85 SJR.B 8876124500 21.5TRI. 22715918100 27.45 TRI. 31305059600 37.61 TRI. 28242329850 34.05
Con Stap
L. 10636704250 37.75 L. 11283495740 40.37 L. 9391758250 33.95SC. 8836296040 41.14 WN. 10875775240 84.26 SC. 9992531280 45.96
Heal Care
CLC. 861316260 9.59 CLC. 1051272280 11.72 CLC. 1270771260 14.19NDN. 540825930 8.67 DR. 305515980 10.78 VRX. 2423343350 15.31
Financials
RY. 75362272400 52.34 RY. 74309093760 52.14 RY. 75778849120 56.62TD. 69181147350 76.65 TD. 65202993400 74.12 TD. 56448759000 65.64
Info Tech
CSU. 1436553280 82.07 CSU. 864872640 49.41 CSU. 650273600 37.15MDA. 1497450300 47.1 ET. 1275117020 17.26 ET. 968510420 13.22
Telecom
BCE. 33024359550 42.45 BCE. 26674656800 35.3 BCE. 22339873920 29.12RCI.B 16304903040 39.32 RCI.B 15320894020 34.34 RCI.B 15559646280 31.74
Utilities
CU. 5333731320 61.14 FTS. 5920003200 34.07 FTS. 4891185300 28.65FTS. 6185795770 32.83 TA. 4673390190 21.21 TA. 5141088920 23.54
36

Table 2: Holding of Two Minute Portfolio (Year 2009 to Year 2007)
Year2009 MktCap Price Year2008 MktCap Price Year2007 MktCap Price
Energy
ECA. 44804135000 59.75 ECA. 52039297500 69.25 ECA. 43228468200 54.35IMO. 36848045010 42.37 SU. 50700434330 109.61 SU. 41844988680 91.02
Material
ABX. 38137043440 43.72 ABX. 39671493400 45.65 ABX. 31223593260 36.18POT. 28573925700 94.7 POT. 45812453400 144.9 G. 23629783380 33.62
Industrial
BBD.B 6781677120 4.72 CNR. 22528967120 46.07 CNR. 25812393320 50.23CNR. 21649717500 46.25 CP. 9810680880 64.02 CP. 9706111460 62.18
Con Disc
SJR.B 8979183500 22.19 SJR.B 9676098340 23.62 MG. 10235243130 94.17TRI. 22638462950 35.15 TRI. 25726287960 40.14 TRI. 31106470500 48.55
Con Stap
L. 9659150020 35.23 L. 9398684720 34.28 L. 13678540860 49.89SC. 10099009500 46.5 SC. 11638005470 53.69 SC. 11839922280 49.82
Heal Care
CLC. 1185341850 13.23 CLC. 1511041120 17.48 NDN. 3048284000 21.11VRX. 1856988900 11.7 VRX. 2148060160 13.34 VRX. 3957952700 24.7
Financials
RY. 49452993200 36.95 MFC. 59271005520 39.51 MFC. 61087974500 39.5TD. 37312617470 44.09 RY. 64043704200 50.2 RY. 71046803430 55.53
Info Tech
CSU. 435278000 25.75 CSU. 422600000 25 CRY. 369044280 27.06ET. 992811180 13.74 ET. 2144288000 29.65 SO. 193495810 11.21
Telecom
BCE. 20175700000 25 BCE. 31729433940 39.42 BCE. 25444972800 31.33RCI.B 19601741950 37.45 RCI.B 23427441180 44.46 RCI.B 18218661120 34.88
Utilities
FTS. 4239425260 25.06 FTS. 4565123160 29.38 CU. 3953194680 48.54TA. 4989930250 25.25 TA. 6774824320 33.56 TA. 5436480000 26.88
37

Table 3: Holding of Two Minute Portfolio (Year 2006 to Year 2004)
Year2006 MktCap Price Year2005 MktCap Price Year2004 MktCap Price
Energy
ECA. 46251381380 53.87 ECA. 30668034600 66.6 ECA. 23839083450 51.35IMO. 40313611950 119.89 IMO. 24778784030 70.07 IMO. 21368851680 58.08
Material
ABX. 17890558200 33.3 ABX. 14892832970 28.01 ABX. 15827139540 29.66TCK.B 12324903450 61.97 POT. 10560847810 96.41 POT. 5843679900 111.34
Industrial
CNR. 25171131300 93.45 CNR. 20694134000 72.25 CNR. 16029680800 82.64CP. 7345491840 46.56 CP. 6507315000 41 CP. 5811104000 36.64
Con Disc
MG. 9035690690 83.53 MG. 9395881410 98.03 MG. 9911425500 104.7TRI. 26007919420 39.97 TRI. 27654268880 42.22 TRI. 31088001560 47.74
Con Stap
L. 15506031900 56.58 L. 19488418180 71.06 L. 18684668700 67.85WN. 11303728800 87.6 WN. 14157006020 109.82 WN. 13923916020 105.39
Heal Care
NDN. 2902903910 20.39 CLC. 1035606750 13.25 NDN. 2811356630 19.97VRX. 4588888080 28.76 NDN. 2368327200 16.7
Financials
MFC. 54821554800 69.2 MFC. 45355871160 55.82 BNS. 33334403080 65.96RY. 59244791320 91.72 RY. 41163580900 63.82 RY. 41155787250 62.19
Info Tech
CRY. 302148440 22.66 CRY. 357870240 27.31 CRY. 192422160 15.69CTY. 89727750 10.55 CTY. 120590400 14.55 CTY. 97794200 11.9
Telecom
BCE. 25843628040 27.87 BCE. 26875501680 29.06 BCE. 26897590720 29.12RCI.B 12883044810 49.89 T. 6859100040 35.48 T. 5101661100 26.85
Utilities
CU. 3600390430 43.43 TA. 3526128270 18.27 TA. 3535918110 18.63TA. 5260992000 26.5 VNR. 2586253600 22.6 VNR. 2518736360 22.01
38

Table 4: Holding of Two Minute Portfolio (Year 2003 to Year 2001)
Year2003 MktCap Price Year2002 MktCap Price Year2001 MktCap Price
Energy
ECA. 23557427400 49.4 IMO. 16913530000 43.6 ECA. 10137848000 40.25IMO. 17166282530 45.31 SU. 10898069900 48.89 IMO. 16748589000 39
Material
ABX. 13387400000 24.7 ABX. 13776407900 25.7 ABX. 10110871440 25.56POT. 5255154150 100.95 POT. 5075576800 97.72 POT. 5972803200 113.95
Industrial
BBD.B 5824172550 5.65 BBD.B 17282758550 16.85 BBD.B 22396779600 21.9CNR. 13357140030 66.69 CNR. 14740697650 76.55 CP. 13702920000 42
Con Disc
MG. 8611089480 91.14 MG. 8254662240 100.76 SJR.B 6218048000 32TRI. 28028413560 43.26 TRI. 29719385040 47.12 TRI. 33175233000 54.6
Con Stap
L. 14917662000 54 L. 14149678660 51.22 L. 14084262000 51WN. 12084954000 91.5 WN. 13291212600 101.1 WN. 11034807750 83.95
Heal Care
NDN. 3105447800 22.1 NDN. 2619393750 18.75 NDN. 3081270400 22.1
Financials
BNS. 27146969700 53.85 RY. 34809876000 51.6 RY. 28951392000 48RY. 38791135670 58.31 TD. 25808767040 40.36 TD. 25620498750 41.25
Info Tech
CTY. 40195000 5
Telecom
BCE. 26336227500 29.1 BCE. 28706449500 35.65 BCE. 34217480000 41.8T. 3289207840 17.69 T. 4347792000 24 T. 7279231050 40.95
Utilities
TA. 2955420000 17.55 CU. 1968945190 49.43 CU. 2078379100 52.85VNR. 2086759410 18.89 TA. 3635029280 21.52 TA. 3584492500 21.25
39
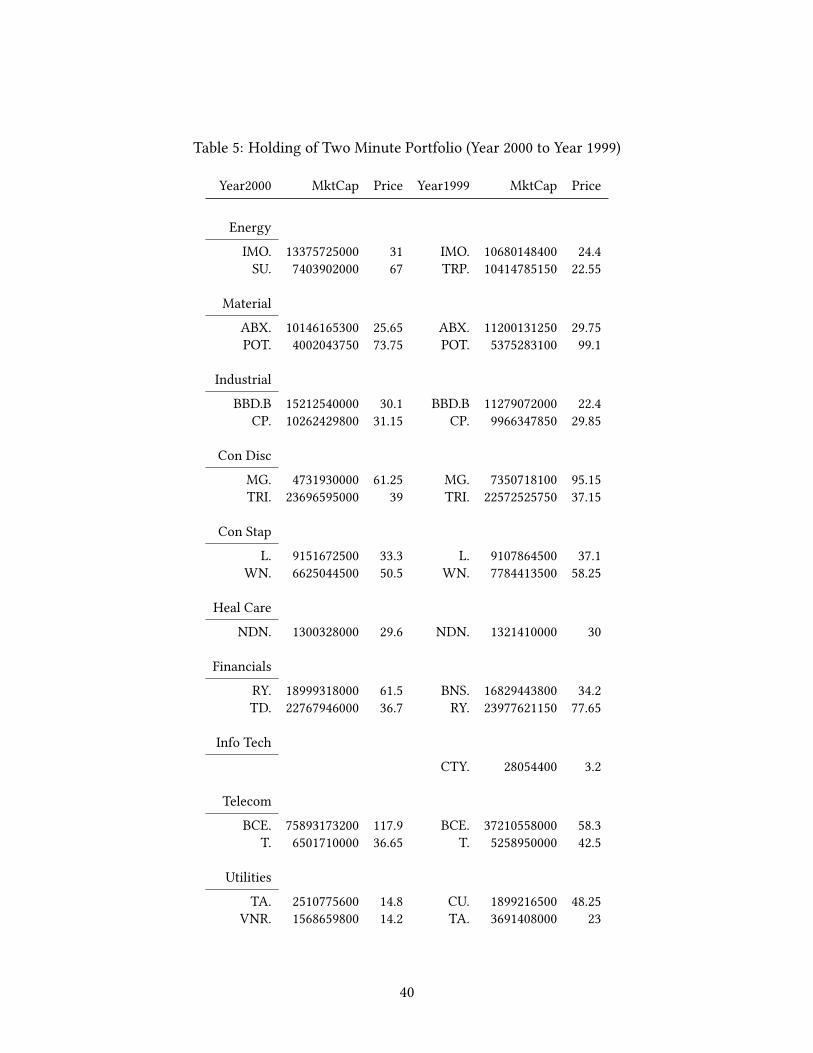
Table 5: Holding of Two Minute Portfolio (Year 2000 to Year 1999)
Year2000 MktCap Price Year1999 MktCap Price
Energy
IMO. 13375725000 31 IMO. 10680148400 24.4SU. 7403902000 67 TRP. 10414785150 22.55
Material
ABX. 10146165300 25.65 ABX. 11200131250 29.75POT. 4002043750 73.75 POT. 5375283100 99.1
Industrial
BBD.B 15212540000 30.1 BBD.B 11279072000 22.4CP. 10262429800 31.15 CP. 9966347850 29.85
Con Disc
MG. 4731930000 61.25 MG. 7350718100 95.15TRI. 23696595000 39 TRI. 22572525750 37.15
Con Stap
L. 9151672500 33.3 L. 9107864500 37.1WN. 6625044500 50.5 WN. 7784413500 58.25
Heal Care
NDN. 1300328000 29.6 NDN. 1321410000 30
Financials
RY. 18999318000 61.5 BNS. 16829443800 34.2TD. 22767946000 36.7 RY. 23977621150 77.65
Info Tech
CTY. 28054400 3.2
Telecom
BCE. 75893173200 117.9 BCE. 37210558000 58.3T. 6501710000 36.65 T. 5258950000 42.5
Utilities
TA. 2510775600 14.8 CU. 1899216500 48.25VNR. 1568659800 14.2 TA. 3691408000 23
40

Table 6: Holding Value of a Hypothetical Two Minute Portfolio Investor without Accounting for Dividend
Year 1999 2000 2001 2002 2003 2004 2005 2006 2007 2008 2009 2010 2011 20121999 1000002000 103570 100002001 113296 109391 1000002002 108499 104760 95706 1000002003 94686 91423 83521 87191 1000002004 116529 112513 102788 107305 123130 1000002005 124693 120395 109990 114823 131756 107057 1000002006 132520 127952 116894 122030 140027 113777 106277 1000002007 131943 127395 116385 121499 139417 113281 105814 99758 1000002008 136043 131354 120001 125274 143749 116802 109103 102858 103108 1000002009 98839 95433 87185 91016 104439 84860 79266 74730 74911 72653 1000002010 105490 101854 93051 97140 111466 90570 84600 79758 79951 77542 106908 1000002011 117221 113181 103399 107943 123862 100642 94008 88627 88843 86165 118797 111121 1000002012 111056 107228 97961 102265 117347 95349 89064 83966 84170 81633 112549 105276 94740 100000
41

Table 7: Holding Value of a Hypothetical Two Minute Portfolio Investor with Dividend Reinvested
Year 1999 2000 2001 2002 2003 2004 2005 2006 2007 2008 2009 2010 2011 20121999 1000002000 105291 1000002001 118109 112174 1000002002 112696 107033 95417 1000002003 99354 94361 84121 88161 1000002004 127925 121497 108312 113514 128757 1000002005 140690 133620 119119 124840 141605 109978 1000002006 152741 145065 129322 135533 153734 119398 108566 1000002007 156201 148352 132252 138604 157217 122103 111025 102266 1000002008 164971 156681 139677 146386 166044 128959 117259 108007 105615 1000002009 124409 118158 105335 110394 125219 97252 88428 81451 79647 75413 1000002010 139837 132810 118397 124083 140746 109311 99394 91552 89524 84764 112400 1000002011 161179 153079 136467 143021 162227 125994 114563 105524 103187 97701 129555 115262 1000002012 158744 150767 134405 140861 159777 124091 112833 103931 101628 96226 127598 113521 98490 100000
42

Table 8: Holding Value of a Hypothetical TSX Composite Price Index Investor (No Dividend) Reinvested
Year 1999 2000 2001 2002 2003 2004 2005 2006 2007 2008 2009 2010 2011 20121999 1000002000 125148 1000002001 131387 104985 1000002002 116668 93224 88797 1000002003 102834 82170 78268 88142 1000002004 126538 101111 96309 108460 123051 1000002005 139496 111464 106172 119566 135652 110240 1000002006 174566 139487 132864 149626 169755 137955 125141 1000002007 197178 157556 150074 169008 191744 155825 141351 112954 1000002008 212483 169785 161723 182126 206627 167920 152322 121721 107762 1000002009 140886 112575 107230 120758 137004 111339 100997 80707 71451 66305 1000002010 181055 144672 137803 155188 176066 143083 129793 103717 91823 85209 128512 1000002011 204481 163391 155633 175267 198846 161596 146586 117137 103704 96234 145139 112939 1000002012 186266 148836 141769 159654 181133 147201 133528 106702 94466 87662 132210 102878 91092 100000
43

Table 9: Holding Value of a Hypothetical TSX Composite Total Return Index Investor (Dividend) Reinvested
Year 1999 2000 2001 2002 2003 2004 2005 2006 2007 2008 2009 2010 2011 20121999 1000002000 127068 1000002001 134947 106201 1000002002 121732 95801 90208 1000002003 109205 85942 80924 89709 1000002004 137066 107868 101570 112596 125512 1000002005 153736 120987 113923 126290 140778 112162 1000002006 195889 154161 145160 160918 179377 142916 127419 1000002007 226626 178350 167937 186167 207523 165341 147412 115691 1000002008 250307 196986 185485 205620 229208 182618 162816 127780 110449 1000002009 171265 134782 126913 140690 156829 124951 111402 87430 75572 68422 1000002010 227299 178880 168436 186720 208139 165832 147850 116035 100297 90808 132718 1000002011 263777 207587 195467 216686 241542 192445 171577 134656 116393 105381 154017 116048 1000002012 241451 190017 178923 198346 221099 176157 157055 123259 106542 96462 140981 106226 91536 100000
44

Table 10: Number of Years the Portfolio Holding Value of Two-Minute Portfolio Outperforms Benchmark Portfolio
Two Min (No Div)/TSX Price Index
Two Min (Div) /TSX Price Index
Two Min (Div) / TSXTotal Return Index
1999 0 of 13 yr 2 of 13 yr 0 of 13 yr2000 5 of 12 8 of 12 5 of 122001 4 of 11 4 of 11 4 of 112002 0 of 10 3 of 10 1 of 102003 1 of 9 2 of 9 2 of 92004 0 of 8 0 of 8 0 of 82005 0 of 7 0 of 7 0 of 72006 0 of 6 1 of 6 0 of 62007 1 of 5 2 of 5 1 of 52008 1 of 4 2 of 4 1 of 42009 0 of 3 0 of 3 0 of 32010 1 of 2 2 of 2 1 of 22011 1 of 1 1 of 1 1 of 1
45

Table 11: Performance Measurement
1999-2005 2005-2011 1999-2011
Rp 3.31% -0.26% 1.03%Rm 9.53% 6.55% 6.65%Excess Return -5.68% -6.39% -5.28%
p-value (0.2885) (0.1006) (0.1361)Jensen α -1.14% -4.30% -2.70%
p-value (0.7978) (0.1241) (0.3358)σp 14.24% 15.84% 15.31%σm 16.48% 21.42% 19.59%β 0.4831 0.6510 0.5830R2 0.3125 0.7738 0.5551Tracking Error 14.56% 10.61% 13.09%Sharpe 2MPort 0.2324 -0.0164 0.0670Sharpe TSXComp 0.5782 0.3057 0.3395Treynor 2MPort 0.0685 -0.0040 0.0176Treynor TSXComp 0.0953 0.0655 0.0665Info Ratio -0.4272 -0.6417 -0.4298N 1761 1756 3267
46

Table 12: Mean Variance Optimizer Result 2011
PortReturn PortRisk Weight
Conserver Aggres.
0.0005 0.0063 ABX. 0.0618 0.056 0.0473 0.0364 0 0 0 0 0 00.0007 0.0064 POT. 0 0 0 0 0 0 0 0 0 00.0009 0.0066 CP. 0 0.0061 0 0 0 0 0 0 0 00.0011 0.0068 MG. 0 0 0 0 0 0 0 0 0 00.0013 0.0073 TRI. 0.0183 0 0 0 0 0 0 0 0 00.0015 0.0082 L. 0.0057 0 0 0 0 0 0 0 0 00.0017 0.0095 WN. 0.0958 0.0672 0.031 0 0 0 0 0 0 00.0019 0.0110 RY. 0 0 0 0 0 0 0 0 0 00.0021 0.0127 BCE. 0.3492 0.3867 0.4213 0.4487 0.4404 0.3912 0.313 0.2048 0.0805 00.0023 0.0145 TA. 0.0429 0.0359 0.0136 0 0 0 0 0 0 0
SU. 0 0 0 0 0 0 0 0 0 0TD. 0 0 0 0 0 0 0 0 0 0
CNR. 0 0 0.0251 0.052 0.0687 0.0797 0.0793 0.07 0.0596 0CLC. 0.0735 0.0516 0.0237 0 0 0 0 0 0 0RCI.B 0.0705 0.0867 0.0959 0.1021 0.0868 0.0259 0 0 0 0CSU. 0.1531 0.1876 0.223 0.2622 0.3418 0.4637 0.5918 0.7252 0.8599 1ET. 0.0079 0 0 0 0 0 0 0 0 0FTS. 0.0706 0.0686 0.0598 0.0338 0 0 0 0 0 0CNQ. 0 0 0 0 0 0 0 0 0 0DR. 0.0508 0.0536 0.0593 0.0648 0.0624 0.0396 0.0159 0 0 0
47

Table 13: Correlation Matrix of Stock Holding in 2011
Stock ABX. POT. CP. MG. TRI. L. WN. RY. BCE. TA. SU. TD. CNR. CLC. RCI.B CSU. ET. FTS. CNQ. DR.ABX. 1.00 0.02 0.02 0.09 0.13 0.19 0.15 0.11 0.06 0.15 0.35 0.13 0.06 -0.04 0.12 0.04 0.13 0.20 0.37 0.13POT. 0.02 1.00 0.19 0.15 0.19 0.15 0.10 0.15 0.17 0.18 0.19 0.19 0.24 0.05 0.17 0.02 0.07 0.20 0.20 0.06CP. 0.02 0.19 1.00 0.56 0.55 0.36 0.28 0.45 0.29 0.45 0.50 0.51 0.74 0.13 0.29 0.14 0.15 0.34 0.50 0.05MG. 0.09 0.15 0.56 1.00 0.49 0.26 0.29 0.53 0.34 0.52 0.53 0.59 0.59 0.22 0.26 0.08 0.20 0.40 0.50 0.12TRI. 0.13 0.19 0.55 0.49 1.00 0.47 0.32 0.53 0.36 0.48 0.49 0.56 0.57 0.17 0.42 0.08 0.12 0.49 0.46 0.02L. 0.19 0.15 0.36 0.26 0.47 1.00 0.46 0.35 0.35 0.43 0.39 0.41 0.42 0.12 0.35 0.17 0.11 0.40 0.38 0.02
WN. 0.15 0.10 0.28 0.29 0.32 0.46 1.00 0.28 0.23 0.32 0.25 0.28 0.31 0.07 0.26 0.05 0.04 0.32 0.26 -0.01RY. 0.11 0.15 0.45 0.53 0.53 0.35 0.28 1.00 0.39 0.54 0.56 0.82 0.57 0.18 0.37 0.07 0.15 0.50 0.53 0.13
BCE. 0.06 0.17 0.29 0.34 0.36 0.35 0.23 0.39 1.00 0.45 0.24 0.39 0.43 0.24 0.50 0.07 0.18 0.35 0.29 0.15TA. 0.15 0.18 0.45 0.52 0.48 0.43 0.32 0.54 0.45 1.00 0.46 0.56 0.56 0.17 0.41 0.05 0.22 0.54 0.45 0.10SU. 0.35 0.19 0.50 0.53 0.49 0.39 0.25 0.56 0.24 0.46 1.00 0.58 0.56 0.25 0.29 0.06 0.18 0.52 0.85 0.20TD. 0.13 0.19 0.51 0.59 0.56 0.41 0.28 0.82 0.39 0.56 0.58 1.00 0.64 0.18 0.41 0.13 0.13 0.55 0.59 0.16
CNR. 0.06 0.24 0.74 0.59 0.57 0.42 0.31 0.57 0.43 0.56 0.56 0.64 1.00 0.20 0.46 0.13 0.11 0.43 0.56 0.06CLC. -0.04 0.05 0.13 0.22 0.17 0.12 0.07 0.18 0.24 0.17 0.25 0.18 0.20 1.00 0.15 0.05 0.09 0.28 0.26 0.24RCI.B 0.12 0.17 0.29 0.26 0.42 0.35 0.26 0.37 0.50 0.41 0.29 0.41 0.46 0.15 1.00 -0.01 0.13 0.38 0.34 0.02CSU. 0.04 0.02 0.14 0.08 0.08 0.17 0.05 0.07 0.07 0.05 0.06 0.13 0.13 0.05 -0.01 1.00 0.18 0.07 0.07 0.05ET. 0.13 0.07 0.15 0.20 0.12 0.11 0.04 0.15 0.18 0.22 0.18 0.13 0.11 0.09 0.13 0.18 1.00 0.10 0.23 -0.02FTS. 0.20 0.20 0.34 0.40 0.49 0.40 0.32 0.50 0.35 0.54 0.52 0.55 0.43 0.28 0.38 0.07 0.10 1.00 0.52 0.17CNQ. 0.37 0.20 0.50 0.50 0.46 0.38 0.26 0.53 0.29 0.45 0.85 0.59 0.56 0.26 0.34 0.07 0.23 0.52 1.00 0.19DR. 0.13 0.06 0.05 0.12 0.02 0.02 -0.01 0.13 0.15 0.10 0.20 0.16 0.06 0.24 0.02 0.05 -0.02 0.17 0.19 1.00
48
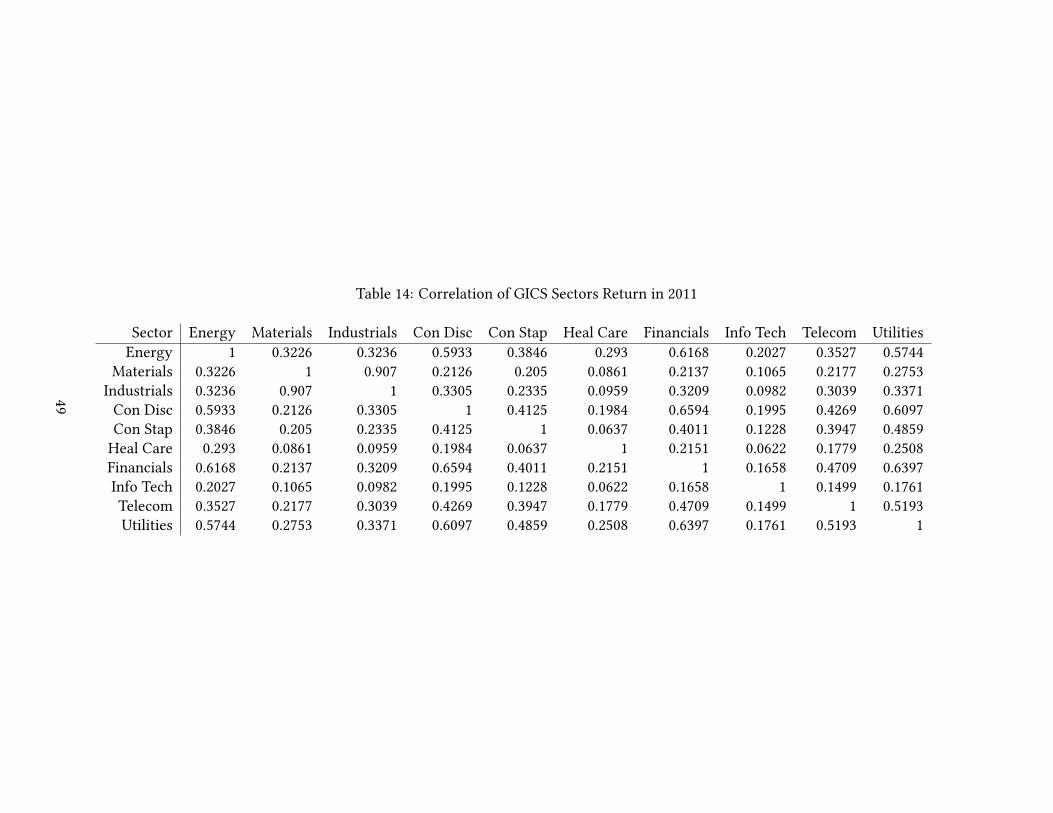
Table 14: Correlation of GICS Sectors Return in 2011
Sector Energy Materials Industrials Con Disc Con Stap Heal Care Financials Info Tech Telecom UtilitiesEnergy 1 0.3226 0.3236 0.5933 0.3846 0.293 0.6168 0.2027 0.3527 0.5744
Materials 0.3226 1 0.907 0.2126 0.205 0.0861 0.2137 0.1065 0.2177 0.2753Industrials 0.3236 0.907 1 0.3305 0.2335 0.0959 0.3209 0.0982 0.3039 0.3371Con Disc 0.5933 0.2126 0.3305 1 0.4125 0.1984 0.6594 0.1995 0.4269 0.6097Con Stap 0.3846 0.205 0.2335 0.4125 1 0.0637 0.4011 0.1228 0.3947 0.4859Heal Care 0.293 0.0861 0.0959 0.1984 0.0637 1 0.2151 0.0622 0.1779 0.2508Financials 0.6168 0.2137 0.3209 0.6594 0.4011 0.2151 1 0.1658 0.4709 0.6397Info Tech 0.2027 0.1065 0.0982 0.1995 0.1228 0.0622 0.1658 1 0.1499 0.1761Telecom 0.3527 0.2177 0.3039 0.4269 0.3947 0.1779 0.4709 0.1499 1 0.5193Utilities 0.5744 0.2753 0.3371 0.6097 0.4859 0.2508 0.6397 0.1761 0.5193 1
49

Table 15: Number of Years A Stock Has Been Included in the Two-Minute Portfolio During 1999 to 2012 (Max: 14 Years)
Con Disc Con Stap Energy Financial Heal CareMG. 9 L. 14 CNQ. 3 BNS. 3 CLC. 6SJR.B 5 SC. 5 ECA. 8 MFC. 4 DR. 1TRI. 14 WN. 9 IMO. 9 RY. 14 NDN. 10
SU. 7 TD. 7 VRX. 5TRP. 1
Industrial Info Tech Material Utilities TelecomBBD.B 6 CRY. 4 ABX. 14 CU. 6 BCE. 14CNR. 11 CSU. 5 G. 1 FTS. 5 RCI.B 7CP. 11 CTY. 5 POT. 12 TA. 13 T. 7
ET. 4 TCK.B 1 VNR. 4MDA. 1SO. 1
50