
Benchmark study using a multi-scale, multi-methodological ...
54
1 Benchmark study using a multi-scale, multi-methodological approach for the 1 petrophysical characterization of reservoir sandstones 2 3 Peleg Haruzi 1,2 , Regina Katsman 1 , Matthias Halisch 3 , Nicolas Waldmann 1 , and Baruch Spiro 1,4 4 5 1 The Dr. Moses Strauss Department of Marine Geosciences, Faculty of Natural Sciences, The University of 6 Haifa, Haifa, Mount Carmel 3498838, Israel 7 2 Agrosphere Institute, IBG-3, Institute of Bio- and Geosciences, Forschungszentrum Jülich GmbH, Germany 8 3 Leibniz Institute for Applied Geophysics, Dept. 5 – Petrophysics & Borehole Geophysics, Stilleweg 2, D- 9 30655 Hannover, Germany 10 4 Department of Earth Sciences, Natural History Museum, Cromwell Road, London SW7 5BD, UK 11 12 13 Correspondence to: Regina Katsman ([email protected]) 14 Matthias Halisch ([email protected]) 15 16 17 18 Keywords: multi-methodological approach, permeability, petrography, petrophysics, 3D imaging, pore-scale 19 modelling, upscaling, REV analysis, benchmark study. 20 21
Transcript of Benchmark study using a multi-scale, multi-methodological ...

1
Benchmark study using a multi-scale, multi-methodological approach for the 1
petrophysical characterization of reservoir sandstones 2
3
Peleg Haruzi1,2, Regina Katsman1, Matthias Halisch3, Nicolas Waldmann1, and Baruch Spiro1,4 4
5
1 The Dr. Moses Strauss Department of Marine Geosciences, Faculty of Natural Sciences, The University of 6
Haifa, Haifa, Mount Carmel 3498838, Israel 7
2Agrosphere Institute, IBG-3, Institute of Bio- and Geosciences, Forschungszentrum Jülich GmbH, Germany 8
3 Leibniz Institute for Applied Geophysics, Dept. 5 – Petrophysics & Borehole Geophysics, Stilleweg 2, D-9
30655 Hannover, Germany 10
4 Department of Earth Sciences, Natural History Museum, Cromwell Road, London SW7 5BD, UK 11
12
13
Correspondence to: Regina Katsman ([email protected]) 14
Matthias Halisch ([email protected]) 15
16
17
18
Keywords: multi-methodological approach, permeability, petrography, petrophysics, 3D imaging, pore-scale 19
modelling, upscaling, REV analysis, benchmark study. 20
21

2
Abstract 22
This paper presents a detailed description and evaluation of a multi-methodological petrophysical 23
approach for the comprehensive multiscale characterization of reservoir sandstones. The suggested 24
methodology enables the identification of links between Darcy-scale permeability and an extensive set of 25
geometrical, textural and topological rock descriptors quantified at the pore scale. This approach is applied 26
to the study of samples from three consecutive sandstone layers of Lower Cretaceous age in northern 27
Israel. These layers differ in features observed at the outcrop, hand specimen, petrographic microscope 28
and micro-CT scales. Specifically, laboratory porosity and permeability measurements of several 29
centimetre-sized samples show low variability in the quartz arenite (top and bottom) layers but high 30
variability in the quartz wacke (middle) layer. The magnitudes of this variability are also confirmed by 31
representative volume sizes and by anisotropy evaluations conducted on micro-CT-imaged 3D pore 32
geometries. Two scales of directional porosity variability are revealed in quartz arenite sandstone of the 33
top layer: the pore size scale of ~0.1 mm in all directions, and ~3.5 mm scale related to the occurrence of 34
high- and low-porosity horizontal bands occluded by Fe oxide cementation. This millimetre-scale 35
variability controls the laboratory-measured macroscopic rock permeability. More heterogeneous pore 36
structures were revealed in the quartz wacke sandstone of the intermediate layer, which shows high inverse 37
correlation between porosity and clay matrix in the vertical direction attributed to depositional processes 38
and comprises an internal spatial irregularity. Quartz arenite sandstone of the bottom layer is homogenous 39
and isotropic in the investigated domain revealing porosity variability at a ~0.1 mm scale, which is 40
associated with the average pore size. Good agreement between the permeability upscaled from the pore-41
scale modelling and the estimates based on laboratory measurements is shown for the quartz arenite layers. 42
The proposed multi-methodological approach leads to an accurate petrophysical characterization of 43
reservoir sandstones with broad ranges of textural, topological and mineralogical characteristics and is 44
particularly applicable for describing anisotropy and heterogeneity of sandstones on various rock scales. 45
The results of this study also contribute to the geological interpretation of the studied stratigraphic units. 46
47

3
1. Introduction 48
Permeability is an effective property of a reservoir rock that varies enormously over a wide range of 49
rock length scales, attributed to a hierarchy of dominant sedimentary depositional features (Norris and Lewis, 50
1991; Nordahl and Ringrose, 2008; Ringrose and Bentley, 2015). Permeability should thus be properly 51
upscaled through the following sequence of scales (Nordahl and Ringrose, 2008; Ringrose and Bentley, 2015 52
and references therein): (1) from the pore scale (the micro scale, typically microns to millimetres) to the 53
representative elementary volume of a single lamina (the macro scale, typically millimetres to centimetres, 54
e.g., Wildenschild and Sheppard, 2013; Andrä et al., 2013b 55
; Bogdanov et al., 2011; Narsilio et al., 2009); (2) to the scale of geological heterogeneity, e.g., the scale of a 56
stratigraphic unit (decimetres to decametres, e.g., Jackson et al. 2003; Nordahl et al. 2005); and (3) to the field 57
scale or the scale of an entire reservoir or aquifer (hundreds of metres to kilometres) (Haldorsen and Lake 58
1984; Rustad et al., 2008). Pore scale imaging and modelling enable us to relate macroscopic permeability to 59
basic microscopic rock descriptors (Kalaydjian, 1990; Whitaker, 1986; Cerepi et al., 2002; Haoguang et al., 60
2014; Nelson, 2009). Therefore, the first stage in the above sequence is crucial for successful upscaling to the 61
overall reservoir scale permeability. 62
Over the past few decades, 3D pore scale imaging and flow simulations (Bogdanov et al., 2012; Blunt 63
et al., 2013; Cnudde and Boone, 2013; Wildenschild and Sheppard, 2013; Halisch, 2013a) have started to 64
serve as a reliable method for rock characterization. The advantages of these techniques are their non-65
destructive character and their capability to provide reliable information about the real pore-space structure 66
and topology of rocks that is impossible to obtain using the conventional experimental methods (e.g., Arns et 67
al., 2007; Knackstedt et al., 2010; Blunt et al., 2013). However, despite its importance, the upscaling from the 68
pore scale is sometimes omitted; as a result, effective petrophysical rock characteristics (e.g., porosity, surface 69
area, and permeability) are often evaluated at the macro scale through only conventional laboratory 70
experiments, which often suffer from errors due to local heterogeneities, anisotropy, or an insufficient number 71
of samples (e.g., Meyer, 2002; Halisch, 2013a). 72
Digital 3D micro scale core analysis should also become a necessary technique for rocks that are 73
difficult to characterize due to various reasons (e.g., for tight sandstones, Liu et al., 2017; Du et al., 2018; 74
Munawar et al., 2018; Zhang et al., 2019), or for those with inhomogeneous or anisotropic pore space (e.g., 75
4
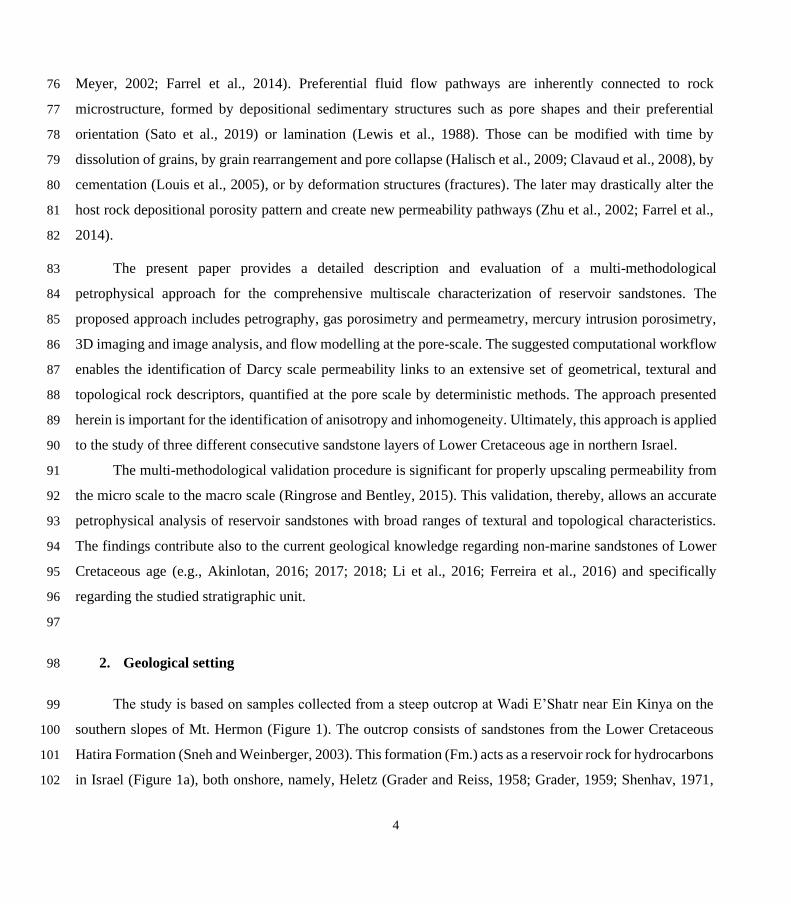
Meyer, 2002; Farrel et al., 2014). Preferential fluid flow pathways are inherently connected to rock 76
microstructure, formed by depositional sedimentary structures such as pore shapes and their preferential 77
orientation (Sato et al., 2019) or lamination (Lewis et al., 1988). Those can be modified with time by 78
dissolution of grains, by grain rearrangement and pore collapse (Halisch et al., 2009; Clavaud et al., 2008), by 79
cementation (Louis et al., 2005), or by deformation structures (fractures). The later may drastically alter the 80
host rock depositional porosity pattern and create new permeability pathways (Zhu et al., 2002; Farrel et al., 81
2014). 82
The present paper provides a detailed description and evaluation of a multi-methodological 83
petrophysical approach for the comprehensive multiscale characterization of reservoir sandstones. The 84
proposed approach includes petrography, gas porosimetry and permeametry, mercury intrusion porosimetry, 85
3D imaging and image analysis, and flow modelling at the pore-scale. The suggested computational workflow 86
enables the identification of Darcy scale permeability links to an extensive set of geometrical, textural and 87
topological rock descriptors, quantified at the pore scale by deterministic methods. The approach presented 88
herein is important for the identification of anisotropy and inhomogeneity. Ultimately, this approach is applied 89
to the study of three different consecutive sandstone layers of Lower Cretaceous age in northern Israel. 90
The multi-methodological validation procedure is significant for properly upscaling permeability from 91
the micro scale to the macro scale (Ringrose and Bentley, 2015). This validation, thereby, allows an accurate 92
petrophysical analysis of reservoir sandstones with broad ranges of textural and topological characteristics. 93
The findings contribute also to the current geological knowledge regarding non-marine sandstones of Lower 94
Cretaceous age (e.g., Akinlotan, 2016; 2017; 2018; Li et al., 2016; Ferreira et al., 2016) and specifically 95
regarding the studied stratigraphic unit. 96
97
2. Geological setting 98
The study is based on samples collected from a steep outcrop at Wadi E’Shatr near Ein Kinya on the 99
southern slopes of Mt. Hermon (Figure 1). The outcrop consists of sandstones from the Lower Cretaceous 100
Hatira Formation (Sneh and Weinberger, 2003). This formation (Fm.) acts as a reservoir rock for hydrocarbons 101
in Israel (Figure 1a), both onshore, namely, Heletz (Grader and Reiss, 1958; Grader, 1959; Shenhav, 1971, 102

5
Calvo, 1992; Calvo et al., 2011), and offshore, namely, Yam Yafo (Gardosh and Tannenbaum, 2014; Cohen, 103
1971; Cohen, 1983). 104
The Hatira Fm. is the lower part of the Kurnub Group (Figure 1d) of Lower Cretaceous (Neocomian – 105
Barremian) age. The Hatira Fm. nomenclature used in Israel and Jordan is equivalent to Grès de Base in 106
Lebanon (Massaad, 1976). This formation occurs in Israel in outcrops from the Eilat area along the rift valley, 107
in the central Negev, and in the northernmost outcrops on Mount Hermon; it forms part of a large Palaeozoic 108
– Mesozoic platform and continental margin deposits in north-eastern Africa and Arabia. The Hatira Fm. 109
consists of siliciclastic units, typically dominated by quartz-rich sandstones (Kolodner et al., 2009 and 110
references therein). The underlying Palaeozoic sandstones cover large areas in North Africa and Arabia from 111
Morocco to Oman; these sandstones overlie a Precambrian basement affected by Neoproterozoic (pan African) 112
orogenesis (Garfunkel, 1988, 1999; Avigad et al., 2003, 2005). The lower Palaeozoic sandstones in Israel and 113
Jordan originated from the erosion of that Neoproterozoic basement, the Arabian-Nubian Shield, with 114
contributions from older sources. These lower Palaeozoic sandstones (Cambrian and Ordovician) are 115
described as first-cycle sediments (Weissbrod and Nachmias, 1986; Amireh, 1997; Avigad et al., 2005). 116
Exposures of the Hatira Fm. in the Central Negev, the Arava Valley, Eilat and Sinai were originally defined 117
as the Wadi (Kurnub) Hatira Sandstone (Shaw, 1947). The largely siliciclastic section of the Hatira Fm. is 118
intercalated with carbonates and shales representing marine ingressions that increase towards the north 119
(Weissbrod, 2002). 120
The Lower Cretaceous sandstones of the Kurnub Group are described as super mature, cross-bedded, 121
medium- to fine-grained, moderately sorted to well-sorted quartz arenites with a high zircon-tourmaline-rutil 122
(ZTR) index (for more details, see Kolodner, 2009). Earlier observations indicated the relatively scarce 123
occurrence of siltstones and claystones compared to sandstones (Massaad, 1976; Abed, 1982; Amireh, 1997). 124
These Lower Cretaceous sandstones are mainly the recycled products of older siliciclastic rocks throughout 125
the Phanerozoic; the sand was first eroded from the surface of the pan African orogeny ca. 400 Ma prior to its 126
deposition in the Lower Cretaceous sediments (Kolodner et al., 2009). 127
The Mount Hermon block was located at the southern border of the Tethys Ocean during the Early 128
Cretaceous (Bachman and Hirsch, 2006). A paleo-geographical reconstruction indicates that the sandy Hatira 129
Fm. (Figure 1) was deposited in a large basin, which included both terrestrial and coastal environments such 130

6
as swamps and lagoons (Sneh and Weinberger, 2003). The Hermon block, located next to the Dead Sea 131
Transform, was rapidly uplifted during the Neogene (Shimron, 1998). The area is marked by intense erosion, 132
which resulted in extensive outcrops such as those near Ein Kinya on the south-eastern side of Wadi E’Shatr 133
(Figure 1). 134
The Kurnub Group in the study area (Figure 1b, d) consists of a volcanic sequence at its base that is 135
overlain with an angular uncomformity by sandstone and clay layers of the Hatira Fm.; the upper unit consists 136
of limestone, marl and chalk – the Nabi Said Fm. (Sneh and Weinberger, 2003). At the section investigated 137
by Saltzman (1968), which is approximately 100 m SW of the sampling area of the present study, the 58 m 138
thick variegated sandstone is interbedded with layers of clay and clay-marl. The sandy component is white-139
yellow-brown/red and consists of largely angular, poorly sorted, fine- to coarse-grained quartz sand. 140
Individual sandstone layers are cemented by Fe oxide (Fe-ox). The outcrops show lenticular benches 0.2 m -141
1.0 m thick. The clay-rich interlayers are grey and normally siltic and brittle. Locally, these layers contain 142
lignite. The outcrop investigated and the specific beds sampled in the present study are shown in Figure 1c. 143

7
144
Figure 1: Geographical and geological settings. (a) Schematic relief map of Israel (modified from www.mapsland.com). 145
(b) Geological map of Ein Kinya. The Hatira Fm. sandstone and the overlying limestone and marl of the Nabi Said Fm. 146

8
are marked as Klhn (map is adopted from Sneh and Weinberger, 2014). (c) Outcrop of the Lower Cretaceous Hatira Fm. 147
sandstones (Klhn) at Ein Kinya. The studied sandstone layers have distinct colours: yellow-brown (1), grey-green (2), 148
and red-purple (3). (d) Stratigraphic table of the geological map (modified from Sneh and Weinberger, 2014). 149
3. Methods 150
3.1. Sample description 151
Samples were extracted from three consecutive layers of different colours from a stratigraphic sequence 152
(Figures 1c, 1d). The lower layer (3) is ~1.5 m thick and consists of sandstone that is light (pale) red-purple in 153
colour with undulating bedding planes between the sub-layers. The middle layer (2) is composed of grey – 154
green shaly sandstone that is 20 cm thick with dark horizons at the bottom and top. The upper layer (1) 155
comprises 1.5 m thick homogenous brown-yellow sandstone. Large sample blocks of ~10-20 cm size were 156
collected from these three layers, and the directions perpendicular to the bedding planes (defined as the z-157
directions in our study) were noted. Subsequently, in the laboratory, smaller sub-samples (described below) 158
were prepared from these large samples for textural observations and various analytical measurements and 159
computations. In total, 7 sub-samples from the top layer, 8 sub-samples from the middle layer and 4 sub-160
samples from the bottom layer were investigated in the laboratory (Table 2). 161
3.2. Laboratory and computational methods for rock characterization 162
The integrated analytical programme designed for this study includes the following laboratory 163
measurements and computations conducted at different scales (from the micro scale reflecting the scale of 164
individual pores and grains to the core scale reflecting the scale of the laminas at the outcrop) (Table 1). 165
Specimens ~5-7 cm in size were investigated by petrographic and petrophysical lab methods. Sub-samples ~1 166
cm in size were retrieved from the aforementioned plugs for investigation by 3D imaging, digital image 167
analysis and simulation techniques (described in detail below). 168
Petrographic and petrophysical analysis (#1-7 in Table 1) were conducted following the RP40 guidelines 169
(Recommended Practices for Core Analysis, API, 1998), giving detailed information on theory, advantages 170
and drawbacks of each method. An extended computational workflow (#8 in Table 1) combines several 171
methods that may contain some variability in their application for the rock characterization. Those are 172
described in more detail below. 173

9
Table 1. Laboratory methods employed and petrophysical characteristics determined from these methods 174
Method Determined petrophysical characteristics
1. Scanning electron microscopy (SEM)
Mineral abundance, grain surface characterization of
matrix and cementation
2. Grain size analysis (Laser diffraction) Grain size distribution (GSD)
3. X-ray diffraction (XRD) Mineral components
4. Nitrogen gas porosimetry Porosity (𝜙)
5. Steady state permeametry Permeability (1D) (κ)
6. Mercury intrusion porosimetry (MIP) Pore throat size distribution (PTSD), specific surface
area (SSA), characteristic length ( 𝑙𝑐 ), pore throat
length of maximal conductance (𝑙𝑚𝑎𝑥), permeability
(κ)
7. Optical microscopy
Plane-parallelized (PPL) and cross-parallelized
(XPL) and reflected-light (RL) microscopy,
binocular (BINO).
Mineral abundance, grain surface characterization,
cementation
8. Extended computational workflow:
• Digital image analysis (DIA)
• Fluid flow modelling
Porosity ( 𝜙 ), pore specific surface area (PSA),
tortuosity (τ), pore size distribution (PSD),
connectivity index (CI), micro-CT predicted
porosity from MIP
Permeability tensor (�̿�), tortuosity (τ)
175
Petrographic descriptions of rock compositions and textures at the micro scale, notably those of the fine 176
fraction, were performed using scanning electron microscopy (JCM-6000 Bench Top SEM device; e.g., 177
Krinsley et al., 2005) using both backscatter and secondary electron modes. 178
Thin-section optical microscopy (Olympus BX53 device, e.g., MacKenzie et al., 2017) was used to 179
estimate the mineral abundance and surface features of the grains, and the mineralogical and textural features 180
of matrix and cement. Grain size distributions were determined by a laser diffraction particle size analyser (LS 181

10
13 320; e.g., Wang et al., 2013). X-ray diffraction (Miniflex 600 device by Rigaku; e.g., Asakawa et al., 2020) 182
was applied to powdered samples to determine their mineralogical composition. 183
Effective porosity and permeability were evaluated on dried cylindrical samples (2.5 cm in diameter and 184
5-7 cm in length). Effective porosity (𝜙) was measured using a steady-state nitrogen gas porosimeter produced 185
by Vinci Technologies (HEP-E, Vinci Technologies; e.g. Viswanathan et al., 2018). Absolute permeability (κ) 186
was measured by using a steady-state nitrogen gas permeameter (GPE, Vinci Technologies; e.g., Tidwell et 187
al., 1999). 188
Mercury intrusion porosimetry (Micromeritics AutoPore IV 9505, which considers pore throats larger 189
than 0.006 μm; e.g., Giesche, 2006) was applied to dried cylindrical samples ~1 cm3 in size to evaluate the 190
following parameters (Table 1): 191
• Pore throat size distribution (PTSD, Lenormand, 2003). 192
• Specific surface area (SSA): the pore surface to bulk sample volume (Rootare and Prenzlow, 1967; 193
Giesche, 2006). 194
• Characteristic length (𝑙𝑐): the largest pore throat width (obtained from the increasing intrusion 195
pressure) at which mercury forms a connected cluster (Katz and Thompson, 1987). 196
• Pore throat length of maximal conductance (𝑙𝑚𝑎𝑥): defines a threshold for the pore throat size l at 197
which all connected paths composed of 𝑙 ≥ 𝑙𝑚𝑎𝑥 contribute significantly to the hydraulic 198
conductance, whereas those with 𝑙 < 𝑙𝑚𝑎𝑥 may completely be ignored (Katz and Thompson, 199
1987). 200
• Permeability (Katz and Thompson, 1987): 201
𝜅 =1
89𝑙𝑚𝑎𝑥
2 𝑙𝑚𝑎𝑥
𝑙𝑐𝜙𝑆(𝑙𝑚𝑎𝑥) (1) 202
where 𝑆(𝑙𝑚𝑎𝑥) is the fraction of connected pore space that is composed of pore throat widths of size lmax and 203
larger. This model (Katz and Thompson, 1987), which was derived from percolation theory (Ambegaokar et 204
al., 1971), is applicable for sandstones with a broad distribution of local conductances with short-range 205
correlations only. 206
An extended computational workflow (similar to the procedure presented by Boek and Venturoli, 2010; 207
Andrä et al., 2013a,b) (Figure 2) serves as one of the main methodologies in our study to upscale permeability 208

11
and derive microscopic rock descriptors. It includes 3D micro-CT imaging of porous samples, digital image 209
processing and segmentation, statistical analyses for the determination of representative elementary volumes, 210
and pore-scale flow modelling through the 3D pore geometry of the rock. First, cylindrical subsamples 4-8 211
mm in diameter and 5-10 mm in length were retrieved from the larger samples studied in the laboratory (Figure 212
2a) and were scanned non-destructively (Figure 2b) by using a Nanotom 180 S micro-CT device (GE Sensing 213
& Inspection Technologies, phoenix|X-ray product line, Brunke et al., 2008). The achieved voxel size of the 214
data sets was 2.5 µm or 5 µm (isotropic), suitable for imaging pore throats that effectively contribute to the 215
flow in the studied type of sandstone (e.g., Nelson, 2009). Afterwards, all data sets were filtered for de-noising, 216
X-ray artefact removal and edge enhancement (Figure 2c). The post-processed images scanned with 2.5 µm 217
resolution had an edge length of 1180 voxels or 2950 µm. Image artefacts were processed as described by 218
Wildenschild and Sheppard (2013). Beam hardening artefacts were removed by applying the best-fit quadratic 219
surface algorithm (Khan et al., 2016) to each reconstructed 2D slice of the image. Ring artefact reduction and 220
image smoothing (with preservation of sharp edge contrasts) were performed using a non-local means filter 221
(Schlüter, 2014). Segmentation was performed to convert the grey-scale images obtained after image filtering 222
into binary images to distinguish between voids and solid phases (Figure 2c). The local segmentation approach, 223
which considers the spatial dependence of the intensity for the determination of a voxel phase, was used in 224
addition to a histogram-based approach (Iassonov et al., 2009; Schlüter et al., 2014). Segmentation was 225
performed by the converging active contours algorithm (Sheppard et al., 2004), a combination of a watershed 226
(Vincent et al., 1991) with an active contour algorithm (Kass et al., 1988). 227
228

12
229
230
231
Figure 2: Extended computational workflow. See text for more details. Images (e) and (f) are adopted from 232
Bogdanov et al. (2012). 233
Simulations involving the real geometry of an imaged rock are computationally power and time 234
consuming. Therefore, the determination of a representative elementary volume (REV) is required (Figure 2d), 235
assuming that porous media are homogeneous at REV dimensions (Bear, 2013) to perform fluid flow 236
simulations. Porosity, a basic macroscopic structural property of porous media, is used here for the estimation 237
of an REV (Bear, 2013; Halisch, 2013a; Tatomir et al., 2016) based on its correlation with permeability 238
(Kozeny, 1927; Carman, 1937) (see discussion on this issue in the Discussion Sect.). 239

13
A “classic” REV approach was used that claims that the REV is attained when porosity fluctuations in 240
the sub-volumes that grow isotropically in three orthogonal directions become sufficiently small (Bear, 2013; 241
Halisch, 2013a, b). Practically, a large number of randomly distributed cubes were analysed through the entire 242
3D sample for their image porosity (IP). The chosen initial cube size (with an edge length of 10 pixels in our 243
case) was increased by 10-100 voxels. The REV size was specified when agreements between the mean and 244
median IP values as well as saturation in the IP fluctuations were attained. 245
Further, the representative binary 3D image (REV) of the pore space was spatially discretised by 246
tetrahedrals with Materialize software (Belgium) (Figure 2e). This step is required for importing the REV into 247
the FEM-based modelling software (Comsol Multiphysics simulation environment, v5.2a). Stokes flow (Re << 248
1) is simulated (Table 1) in the pore network (Figure 2f) by the following equations (e.g., Narsilio et al., 2009; 249
Bogdanov et al., 2011): 250
Stokes equation: −𝛻𝑝 +μ𝛻2�̅� = 0 (2) 251
Continuity equation: 𝛻 ∙ �̅� = 0 (3) 252
where 𝛻𝑝 is the local pressure gradient, �̅� is the local velocity vector in the pore space and 𝜇 is the dynamic 253
fluid viscosity. Fixed pressures (p=const) were specified at the inlet and outlet boundaries of the fluid domain 254
with a constant pressure gradient of 2.424 𝑃𝑎/𝑚𝑚 over the domain, prescribed in all the simulations for 255
consistency. At the internal pore walls and at the lateral domain boundaries, no-slip boundary conditions (�̅� =256
0) were imposed (e.g., Guibert et al., 2016). These boundary conditions are also used to simulate the flow 257
setup in a steady-state experimental permeameter (e.g., Renard et al., 2001). The macroscopic fluid velocity 258
< �̅� > was evaluated by volumetrically averaging the local microscopic velocity field (e.g., Narsilio, 2009; 259
Guibert et al., 2016). Then, from the average macroscopic velocity vectors 𝑣𝑖𝑗 in three orthogonal i-directions 260
corresponding to the pressure gradients ∇𝑝𝑗 imposed in j-directions, the full 3D second rank upscaled 261
permeability tensor �̿� can be found: 262
(
𝑣𝑥𝑥 𝑣𝑥
𝑦𝑣𝑥
𝑧
𝑣𝑦𝑥 𝑣𝑦
𝑦𝑣𝑦
𝑧
𝑣𝑧𝑥 𝑣𝑧
𝑦𝑣𝑧
𝑧
) = −1
𝜇𝜙(
𝜅𝑥𝑥 𝜅𝑥𝑦 𝜅𝑥𝑧
𝜅𝑦𝑥 𝜅𝑦𝑦 𝜅𝑦𝑧
𝜅𝑧𝑥 𝜅𝑧𝑦 𝜅𝑧𝑧
) (
∇𝑝𝑥 0 00 ∇𝑝𝑦 0
0 0 ∇𝑝𝑧
) (4) 263
14
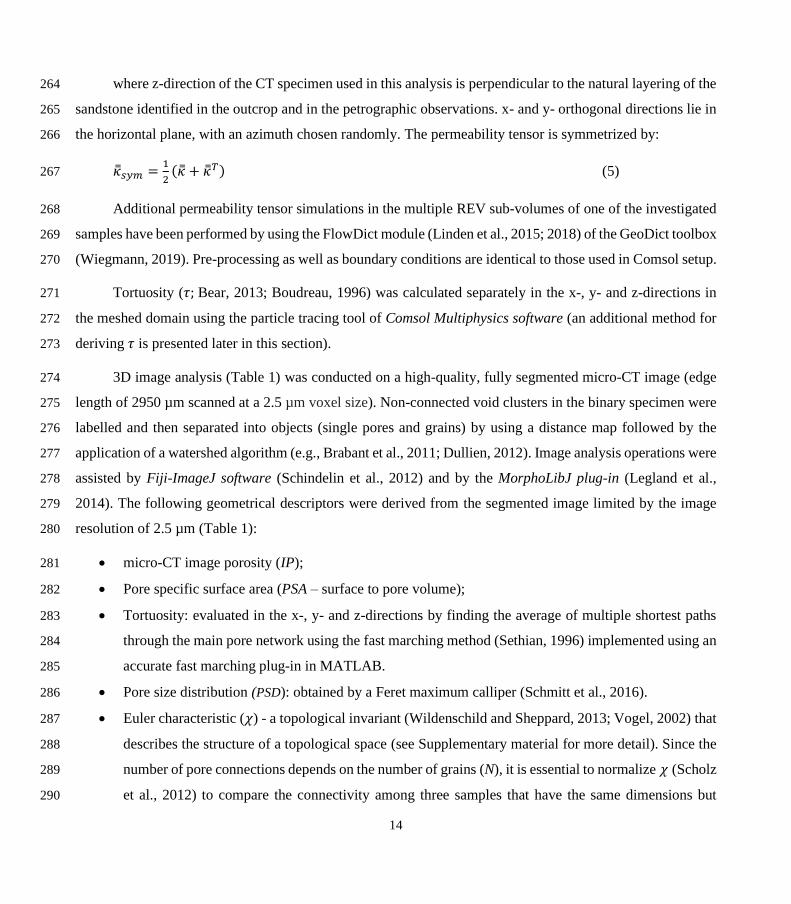
where z-direction of the CT specimen used in this analysis is perpendicular to the natural layering of the 264
sandstone identified in the outcrop and in the petrographic observations. x- and y- orthogonal directions lie in 265
the horizontal plane, with an azimuth chosen randomly. The permeability tensor is symmetrized by: 266
�̿�𝑠𝑦𝑚 =1
2(�̿� + �̿�𝑇) (5) 267
Additional permeability tensor simulations in the multiple REV sub-volumes of one of the investigated 268
samples have been performed by using the FlowDict module (Linden et al., 2015; 2018) of the GeoDict toolbox 269
(Wiegmann, 2019). Pre-processing as well as boundary conditions are identical to those used in Comsol setup. 270
Tortuosity (𝜏; Bear, 2013; Boudreau, 1996) was calculated separately in the x-, y- and z-directions in 271
the meshed domain using the particle tracing tool of Comsol Multiphysics software (an additional method for 272
deriving 𝜏 is presented later in this section). 273
3D image analysis (Table 1) was conducted on a high-quality, fully segmented micro-CT image (edge 274
length of 2950 µm scanned at a 2.5 µm voxel size). Non-connected void clusters in the binary specimen were 275
labelled and then separated into objects (single pores and grains) by using a distance map followed by the 276
application of a watershed algorithm (e.g., Brabant et al., 2011; Dullien, 2012). Image analysis operations were 277
assisted by Fiji-ImageJ software (Schindelin et al., 2012) and by the MorphoLibJ plug-in (Legland et al., 278
2014). The following geometrical descriptors were derived from the segmented image limited by the image 279
resolution of 2.5 µm (Table 1): 280
• micro-CT image porosity (IP); 281
• Pore specific surface area (PSA – surface to pore volume); 282
• Tortuosity: evaluated in the x-, y- and z-directions by finding the average of multiple shortest paths 283
through the main pore network using the fast marching method (Sethian, 1996) implemented using an 284
accurate fast marching plug-in in MATLAB. 285
• Pore size distribution (PSD): obtained by a Feret maximum calliper (Schmitt et al., 2016). 286
• Euler characteristic (𝜒) - a topological invariant (Wildenschild and Sheppard, 2013; Vogel, 2002) that 287
describes the structure of a topological space (see Supplementary material for more detail). Since the 288
number of pore connections depends on the number of grains (N), it is essential to normalize 𝜒 (Scholz 289
et al., 2012) to compare the connectivity among three samples that have the same dimensions but 290

15
different grain sizes. Thus, a Connectivity Index (CI) parameter, CI =|χ|/N was defined, where χ and 291
N were computed using image analysis. 292
293
Table 1 allows conducting a comparison between the characteristics derived by the different methods at 294
the different scales of investigation (similarly to Table 1 in Tatomir et al. (2016) that focuses on the similar 295
rock). 296
Additionally, we propose a new simple method to estimate the image porosity at a given resolution. 297
Multiplication of the mercury effective saturation at the capillary pressure corresponding to the micro-CT 298
resolution (e.g., 2.5 µm) by the porosity of the same sample measured by a gas porosimeter yields the micro-299
CT-predicted image porosity from MIP at the given resolution limit (Table 1). 300
301
302

16
4. Results 303
4.1. Petrographic and petrophysical rock characteristics 304
Three types of sandstone rocks were characterized by techniques 1-8 listed in Table 1. The results are 305
presented in Figures 3-8 and summarized in Table 2. 306
Sandstone S1: The top unit layer with a thickness of ~1.5 m (Figure 1c) consists of yellow-brown 307
sandstone (Figure 3a), which is moderately consolidated. The sandstone is a mature quartz arenite (following 308
Pettijohn et al., 1987) with minor Fe-ox, feldspar and heavy minerals (e.g., rutile and zirconium). The grain 309
size distribution has a mean of ~325 µm (Figure 6a, Table 2). The grains are moderately sorted (according to 310
the classification of Folk and Ward, 1957) and sub-rounded to well-rounded with local thick (millimetre-scale), 311
relatively dark envelopes (Figure 3b). The sandstone consists of alternating millimetre-scale layers of large 312
and small sand grains. Secondary silt (~ 45 µm) and clay (~0.95 µm) populations are detected in the grain size 313
distribution (Figure 6). X-ray diffraction detected a small amount of kaolinite. The Fe-ox grain-coating and 314
meniscus-bridging cement is composed of overgrown flakes aggregated into structures ~10 μm in size (Figure 315
3c-3f). Mn oxide is also evident but is scarce (Figure 3e). 316
The pore network is dominated by primary inter-granular well-interconnected macro porosity (Figure 317
3b). However, sealed and unsealed cracks in grains are also observed. Higher Fe-ox cementation at the 318
millimetre scale on horizontal planes is recognized (Figure 3a). In addition, smaller voids between Fe-ox 319
aggregates and flakes occur at the micrometre scale and smaller (Figure 3d-f). 320
The pore throat size analysis conducted with MIP shows that 82 % of the pore volume is composed of 321
macro pores (>10 µm) following a log-normal distribution with a peak at 44 µm (Figure 7a). The characteristic 322
length, i.e., the largest pore throat length at which mercury forms a connected cluster, is 𝑙𝑐 = 42.9 µm (Figure 323
7b), and the pore throat length of maximal conductance is 𝑙𝑚𝑎𝑥 = 34.7 µm (Figure A1 in Appendix A). The 324
porosity evaluated by laboratory gas porosimetry varies in the range of 26-29 % for 7 different samples of S1 325
(Figure 8). Multiplying the mercury effective saturation (85.8 %) at the micro-CT resolution (2.5 µm) (Figure 326
7a, red dashed line) by the porosity of the same sample measured by gas porosimetry (27.3 %) yields a micro-327
CT-predicted image porosity of 23.5 % at a resolution limit of 2.5 µm (Table 2). 328

17
The permeability evaluated by a laboratory gas permeameter has averages of 350 mD (range of 130-329
500 mD) for 5 samples measured perpendicular to the depositional plane (z-direction) and 640 mD for 2 330
samples measured parallel to the depositional plane (x- and y-directions) (Figure 8). MIP measurement (Katz 331
and Thompson, 1987) yields a permeability (see Sect. 3.2) of 330 mD (Table 2). 332
333
Figure 3: Representative images of sandstone S1. (a) Darker laminae in the x-y plane at the millimetre scale are observed. 334
(b) Thin section image of S1, P refers to open pores, Q – to quartz, Ox to oxide. (c) Fe-ox flakes (yellow) on quartz grains 335
(pale grey). (d) SEM image of S1: grain-coating, meniscus-bridging cement and overgrowth of Fe-ox flakes. (e,f) 336
Magnified images at different scales. 337
338
339

18
Table 2. Petrophysical characteristics of the three studied sandstone layers. 340
Method S1 S2 S3
Grain size Laser diffraction 325 µm
medium sand
moderately sorted
sand: 92.6 %
silt: 6.6 %
clay: 0.8 %
154 µm
very fine sand
poorly sorted
65.7 %
31.3 %
3 %
269 µm
fine sand
moderately sorted
94.4 %
4.8 %
0.8 %
Pore throat size MIP Mode 1: 44 µm
Mode 2: 0.035 µm
Mode 3: 2.2 µm
macro pores
well sorted
0.035 µm
3.5 µm
meso pores
poorly sorted
35 µm
0.035 µm
2.2 µm
macro pores
well sorted
Pore size Image analysis
(min. object size 2.5
µm)
194 µm
(FWHM [150,335] µm)
Mode 1: 21 µm
Mode 2: ~100
µm
223 µm
(FWHM [145,400] µm)
Characteristic
length, 𝒍𝒄
MIP 42.9 µm 12.3 µm 36.9 µm
𝒍𝒎𝒂𝒙 contributing to
maximal
conductance
MIP 34.7 µm 8 µm 31.4 µm
Porosity, ϕ
Gas porosimetry 28 ± 2 % (7) 19 ± 5 % (8) 31 ± 1 % (4)
CT predicted image
porosity from MIP
23.5 %
6.6 % 30.4 %
Micro-CT
segmented
17.5 % 6.9 % 28.3 %
Permeability, κ
⊥ - perpendicular to
layering (z-direction)
|| - parallel to layering
(x-y plane)
Gas permeametry ⊥ 350 mD (5)
|| 640 mD (2)
⊥ 2.77 mD (5)
|| 7.73 mD (3)
⊥ 220* mD (2)
|| 4600* mD (2)
MIP 330 mD (1) 4 mD (1) 466 mD (3)
Flow modelling (
420 66.3 1.9166.3 344 12.81.91 12.8 163
) mD -
(4517 5 38
5 4808 54738 547 4085
) mD
Specific surface
area, SSA (surface-
to- bulk-volume)
MIP
3.2 µ𝑚−1 12.2 µ𝑚−1 0.16 µ𝑚−1
Pore specific surface
area, PSA (surface-
to-pore-volume)
Micro-CT at 2.5 µm
resolution size 0.068 µ𝑚−1
0.136 µ𝑚−1
0.069 µ𝑚−1
Connectivity index Image analysis 3.49 0.94 10
Tortuosity, τ Flow modelling
- - x: 1.443
y: 1.393
z: 1.468
Micro-CT
shortest path
analysis
x: 1.385
y: 1.373
z: 1.477
- x: 1.316
y: 1.338
z: 1.394
Legend: 341

19
Numbers in parentheses related to gas porosity, gas permeability and MIP permeability, indicate the number 342
of plugs for the measurements. Other measurements and calculations were conducted on single plugs. 343
FWHM - full width at half maximum, log-normal distribution. 344
345
Sandstone S2: The intermediate unit layer with a thickness of ~20 cm consists of grey-green moderately 346
consolidated sandstone (Figures 1c, 4) composed of sub-rounded to rounded, very fine sand grains (~154 μm); 347
the sandstone is poorly sorted with 35 % of the particles being silt and clay (Figure 6, Table 2). Secondary silt 348
(~ 40 µm), sand (~400 µm) and clay (~1.5 µm) populations are also detected. The grains are composed of 349
quartz with minor Fe-ox coating the grains and minor quantities of heavy minerals (e.g., rutile and zirconium) 350
(Figure 4c). Clay filling the pore space was identified by XRD as a kaolinite mineral. It appears as a grain-351
coating, meniscus-bridging, and pore-filling matrix (Figure 4b, c). Therefore, the unit layer (Figure 1c) is 352
classified as a quartz wacke sandstone (Pettijohn et al., 1987). 353
The pore space is reduced by clays deposited on coarser grains, identified mostly in laminae (Figure 4a, 354
d). However, the inter-granular connectivity of macro pores can still be recognized (Figure 4b, c). The 355
effective pore network consists of inter-granular macro pores distributed between the laminae or zones richer 356
in clay and Fe-ox. Integrating the grain size and pore throat size analysis results (Figs. 6, 7) confirms that the 357
reduction in the inter-granular pore space in S2 is due to the clay matrix, which is reflected in the poor grain 358
sorting and large variance in pore size. In the pore throat size analysis (Figure 7), only 15 % of the pore volume 359
is composed of macro pores that are larger than 10 µm. The prominent sub-micron pore mode is ~35 nm, with 360
a population containing ~45 % of the pore volume (Figure 7a). This population of pores occurs inside the clay 361
matrix. The secondary pore volume population is poorly distributed within the range of 0.8-30 µm. The 362
characteristic length (Sect. 3.2), 𝑙𝑐 = 12.3 µm (Figure 7b), and the pore throat length of maximal 363
conductance, 𝑙𝑚𝑎𝑥 = 8 µm (Figure A1 in Appendix A) (both lengths have large analytical uncertainties 364
resulting from uncertainty in the threshold pressure, cyan colour in Figure 7b), suggest a connectivity of macro 365
pores regardless of their small fraction within the total pore space. The porosity of S2 evaluated for 8 different 366
samples varies in the range of 14.5-23.5 % (Figure 8). From the PTSD (Table 1) and gas porosimetry results 367
(for a sample with a porosity of 18.6 %), micro-CT predicts an image porosity of 6.6 % at a resolution limit 368
of 2.5 µm (Table 2). The gas permeability in the z-direction was measured in 5 samples (Figure 8): in four of 369
them, the permeability ranges within 1-12 mD and increases with porosity. However, one sample had an 370

20
exceptionally large porosity and permeability of 23 % and 62 mD, respectively. The permeability measured 371
for 3 samples in the x-y plane ranges within 4-12 mD, also showing ~15 % porosity (Figure 8). In addition, 372
samples with ~15 % porosity have permeability values larger in the x-y plane (parallel to the layering) than 373
in the z-direction (perpendicular to the layering). The permeability derived from MIP reaches 4 mD, which 374
agrees with an average of 2.77 mD and 7.73 mD (Table 2) measured in the z-direction with a gas permeameter 375
(excluding one exceptionally high value, Figure 8). 376
377
Figure 4. Representative images of sandstone S2. (a) Dark stains in the rock are mud streaks, yellowish zones are due to 378
increased Fe-Ox cement. (b) The dark laminae are richer in clays and Fe-ox. P refers to open pores, Q – to quartz, C – 379
to clay. (c) Clay and silt accumulated as meniscus and as clay matrix. (d) Pore clogged by clay and Fe-ox. (e) Rock 380
texture. The clay matrix is white, and quartz grains are pale grey. 381
382
Sandstone S3: The bottom unit layer with a thickness of ~1.5 m consists of (pale) red-purple poorly 383
consolidated sandstone (Figure 1c) with grains covered by a secondary red patina (Figure 5). The sandstone 384
is composed of friable to semi-consolidated, fine (~269 µm), moderately sorted sand (Table 2), where only 385
5.6 % of particles are silt and clay (Figure 6). Secondary silt (~ 50 µm) and clay (~ 0.96 µm) populations were 386

21
also detected. The sandstone consists of sub-rounded to rounded grains showing a laminated sedimentary 387
texture consisting of the cyclic alternation of relatively dark and light red bands of millimetre-scale thickness 388
(Figure 5a). The dark laminae contain slightly more Fe-ox meniscus-bridging and pore-filling cementation 389
(Figure 5b, d). Overall, this bed consists of a ferruginous quartz arenite. The grains are dominated by quartz 390
with very minor feldspar and black opaque mineral grains, perhaps Fe-ox (Figure 5d). X-ray diffraction 391
indicated quartz only. The Fe-ox coating of grains is less extensive than in other samples (Figure 5c). The 392
pore interconnectivity in this sandstone is high (Figure 5d). Heavier cementation is rarely observed (Figure 393
5d) and is organized in horizontal laminae (Figure 5a). Features including grain cracks, grain-to-grain 394
interpenetration, and pressure solution are also recognized (Figure 5e). The PTSD showed that 95 % of the 395
pore volume is presented by macro pores (Figure 7a), which agrees with the scarcity of fine particles. The 396
characteristic length and pore throat length of maximal conductance are 𝑙𝑐 = 36.9 µm (Figure 7b) and 𝑙𝑚𝑎𝑥 =397
31.4 µm (Figure A1 in Appendix A), respectively. 398
The porosity measured by a gas porosimeter in the laboratory varies in the range of 30-32 % for 4 399
different samples (Figure 8). From PTSD and gas porosimetry (Figures 7, 8), the micro-CT-predicted image 400
porosity at a resolution limit of 2.5 µm is 30.4 % (Table 2). The permeability measured by a laboratory gas 401
permeameter averages 220 mD for 2 samples measured in the z-direction and 4600 mD for 2 samples 402
measured in the x-y plane (Figure 8), showing a ten-fold difference (discussed in Sect. 5). The permeability 403
derived from MIP reaches 466 mD (Table 2). 404

22
405
Figure 5. Representative images of sandstone S3. (a) Laminae are recognized by their slightly dark and red colour. (b) 406
General view reveals red laminae ~300 μm thick. (c) High-resolution observation of a clear grain. (d) A millimetre-scale 407
lamina is indicated by enhanced meniscus-type Fe-ox cementation and partly by inter-granular fill. Grain surfaces are 408
coated by thin Fe-ox. Black and orange cements represent crystallized and non-crystallized Fe-ox, respectively. Some 409
cracked grains are observed, sporadically cemented by Fe-ox. P refers to open pores, Q – to quartz. (e) Partially dissolved 410
grains are coated by cement. 411
412
413

23
414
415
Figure 6: (a) Grain size distribution. (b) Magnified grain size distribution in the fine grain size region plotted 416
for sandstones S1 (green), S2 (blue) and S3 (purple). S1 and S3 have a unimodal distribution and are 417
moderately sorted with a small skewness tail. Sample S2 has a multi-modal distribution and is poorly sorted. 418
419
Figure 7: Cumulative pore throat sizes of the studied sandstones. (a) Capillary pressure on a logarithmic 420
scale. The resolution limit of the micro-CT imaging indicates the fraction of the pore space that could be 421
resolved. (b) Capillary pressure on a linear scale. The triangles indicate the characteristic length, 𝑙𝑐. 422
(a) (b)

24
423
424
Figure 8: Results of porosity-permeability lab measurements. The permeability of the samples was measured 425
in directions perpendicular to the bedding (z-direction) and parallel to the bedding (x-y plane). 426
Overall, the relative decrease in 𝑙𝑚𝑎𝑥 with respect to 𝑙𝑐 is greater for the layers containing more fines 427
(Table 2). 428
Additionally, pore surface roughness may be evaluated from the specific surface area (SSA) measured 429
by MIP (Table 2). A larger SSA implies a rougher surface (e.g., Tatomir et al., 2016). The SSAs for S1 and S2 430
(3.2 μm−1 and 12.2 μm−1, respectively) are similar to those given in the literature for sandstones of similar 431
properties (e.g., Cerepi et al., 2002). The SSA of S2 is higher because of its high silt and clay content of 34.3 432
%, which is only 7.4 % for S1 (Figure 6a). The SSA of S3 (where silt and clay constitute only 5.6 %, including 433
the Fe-ox rim coating) is only 0.16 µm-1, which is 20 times smaller than that of S1 (Table 2). The difference 434
in SSAs between S1 and S3, which are similar in their grain and pore throat size distributions (Figs. 6, 7), is a 435
result of S1 having a higher Fe-Ox grain coating than S3 (compare Figures 3d and 5c). 436

25
In summary, although the S1 pore network has larger pore throats, it also has greater grain roughness 437
and lower connectivity than S3. These two properties dominate and generate a smaller permeability for S1 438
than for S3 (Table 2). 439
4.2. Image analysis 440
Visualized segmented sub-volumes of samples S1, S2, and S3, depicting quartz, pores, clay and heavy 441
minerals, are presented in Figure 9. The main pore size population in PSD of S1 is at ~100-500 µm range with 442
majority at ~194 µm (Figure 10). A smaller population of pores of ~30-100 µm was identified as well, which 443
may refer to (Mode 1) pore throat size derived from the MIP experiment (Table 2). Image resolution of 2.5 444
µm limited the analysis. The pore specific surface area (PSA) calculated from micro-CT images is 445
0.068 µm−1. The tortuosity, measured from the whole CT image, indicates similar values in the x- and y-446
directions of 1.37 and 1.38, respectively, whereas in the z-direction, the tortuosity is 1.48 (Table 2). As many 447
paths were considered, this difference indicates the textural features that appear in horizontal plane (Figure 448
3a). 449
450
Figure 9: Visualized in these pictures sub-volumes of segmented CT samples of (a) S1, (b) S2, (c) S3. S1 and 451
S2 in this visualization have volumes 33 mm3 scanned with 5 µm voxel size resolution, S3 has volume 1.53 mm3 452
scanned with 2.5 µm voxel size. 453

26
454
Figure 10: Statistics of the pore sizes calculated by image analysis for three sandstone samples: S1, S2, and 455
S3. Number of pores analysed: S1 – 3500, S2 – 45000, S3 – 3500. The CT data sets used for this analysis had 456
2.5 µm voxel size resolution to capture grain and pore shapes better, compared to those at resolution of 5 µm. 457
For S2 (Figure 9), the main pore size population is in the ~15-50 µm range (Figure 10), with majority 458
at ~21 µm. This may refer to the pore throat size derived from MIP. However, smaller pore throat sizes which 459
were derived from the MIP (mode peak is at ~3.5 µm) could not be visualized due to the limited resolution of 460
the image (2.5 µm), and because of high uncertainty associated with size of pores smaller than 10 µm (four 461
voxels). Accordingly, they were excluded from the PSD evaluation (Figure 10). A large pore population is 462
also recognized at ~100 µm (Figure 10), which corresponds to the pore size scale recognized from the 463
petrography (Figure 4), MIP (Figure 7) and CT image (Figure 9). The pore specific surface area (PSA) 464
calculated from micro-CT images is 0.136 µ𝑚−1 (Table 2), which is twice as large as the PSA of S1. 465
For S3 (Figure 9), the main pore size population is in the ~100-500 µm range (Figure 10), with majority 466
at ~223 µm. The geometry-based tortuosity values measured from the whole CT image with multiple paths is 467
1.32, 1.34 and 1.39 in the x-, y- and z-directions, respectively. The tortuosity is lower for S3 than for S1 in all 468
directions, which is a direct result of the smaller amount of cement in the pore throats. The PSA of S3 is 469
0.069 µm−1, which is similar to that of S1. 470

27
4.3 REV Analysis 471
4.3.1. Quartz arenite sandstones (S1 and S3) 472
One-dimensional profiles of porosity of S1 (Figure 11(a-c)) were evaluated by averaging the pore 473
voxels over each slice in sequential slices in three orthogonal directions (hereafter referred as slice-by-slice 474
porosity). The investigated domain had a volume of 6.8 × 6.9 × 9.2 mm3 scanned with a voxel size of 5 µm 475
(suitable for imaging pore throats that effectively contribute to the flow in S1, Table 2). The slice-by-slice 476
porosity distinguishes the z-direction as having an exceptional behaviour, with variance in porosity 477
fluctuations being four times larger than that in x- and y- directions (i.e., 0.98 in z- direction, compared to 0.17 478
and 0.16 in the x- and y- directions, respectively). Porosity fluctuates with peak to trough length of ~0.1 mm 479
in x- and y- directions that could refer to an average pore cross-section over the slice, and thus being attributed 480
to grain packing. In z- direction an additional larger scale wavelength of ~3.5 mm is observed, where peaks 481
and troughs could refer to higher and lower porosity layers, respectively, thus being attributed to depositional 482
processes. 483

28
484
Figure 11: Determination of REV in S1. a) One-dimensional porosity profile of S1 slices evaluated in 485
a) x-direction, b) y-direction and c) z-direction. (d) Classic REV analysis. Investigated volume size is 6.8 × 486
6.9 × 9.2 mm3. 487
Alternatively, the REV size was estimated as ~2.5 mm (Figures 11d) by classic REV analysis, where 488
the mean, median, 25th and 75th percentile porosity changes decline. Considering these results (Figure 11), we 489
decided to use a segmented specimen cube with a maximal available edge length of 2950 μm, scanned with a 490
higher resolution of 2.5 μm (to preserve the grain surface geometry and a consistency between S1 and S3 491
samples) for flow simulations. 492
One-dimensional profiles of slice-by-slice porosity were evaluated in sequential slices in the orthogonal 493
directions of S3 with a maximal segmented volume of 3 × 3 × 4.2 mm3 scanned with a voxel size of 2.5 µm 494

29
(Figures 12a-c). Porosity fluctuates in all directions with peak to trough distance of ~0.1 mm that could refer 495
to an average pore cross-section over the slice, as clarified for S1. The variance is similar in all directions 496
(0.87, 0.94, 1.08, correspondingly) that implies a homogenous sample. REV with an edge length of 875 μm 497
was estimated by classic analysis (Figure 12d), which was used for the flow simulation in S3. 498
499
500
501
Figure 12: Determination of REV in S3. a) One-dimensional porosity profile of S3 slices evaluated in a) x-502
direction, b) y-direction and c) z-direction. (d) Classic REV analysis. Investigated volume size is 3 × 3 × 4.2 503
mm3. 504

30
4.3.2. Quartz wacke sandstone (S2) 505
Sample S2 is more heterogeneous than S1 and S3 because of the deposition of clay in a patchy 506
distribution. The sample is visualized in Figure 9b with quartz grains (yellow), pore volume (black), clay 507
matrix (brown) and heavy minerals (white). In Figure 13a-c, the porosity of sequential slices in the orthogonal 508
directions is shown together with clay matrix content, evaluated in segmented volume of 7.9 × 6.8 × 9.2 mm3 509
size scanned with a voxel size of 5 µm. In z-direction a clear trend in porosity is observed, which has a negative 510
correlation with the clay content (Figure 13f), whereas in the horizontal (x-y) plane there is no clear correlation 511
(Figure 13d-e). This correlation in z- direction implies that the porosity is controlled by depositional processes. 512
However, the similar large-scale wavy structures of the clay content in x- and y- directions (Figures 13a, b) 513
may refer to errors originated from the scanning and inversion in the CT acquisition, as x- and y-coordinates 514
are associated with the side boundaries of the cylindrical sample 515
516
Figure 13: Correlation between porosity and clay. Porosity and clay profiles (left and right y-axes, 517
correspondingly) in slices of S2 evaluated in (a) x-direction, (b) y-direction (c) z-direction. Scatterplots of clay 518

31
content and porosity in S2 in (d) x-direction, (e) y-direction, (f) z-direction.) Investigated maximal segmented 519
volume size is 7.9 × 6.8 × 9.2 mm3 (see text for more detail). 520
521
522
Figure 14: Classic REV analysis of S2. Investigated volume size is 7.9 × 6.8 × 9.2 mm3. 523
Classic REV evaluation (Figure 14d) may indicate a cube edge size of ~ 3 mm. However, the porosity 524
trend in z-direction (Figure 13c) in the volume under investigation, implies that no REV can be found in S2 525
sample. As a result, flow modelling could not be conducted in sample S2. 526
4.4. Flow modelling at the pore scale 527
Fluid flow was modelled at the pore scale in two different micro-CT-scanned geometries: 1) a full cube 528
of sample S1, and 2) sample S3 within its REV dimensions (Table 3), imaged with 2.5 µm voxel size. 529
Modelling of the 3D geometry of sample S2 was not performed due to its non-stationarity, which did not allow 530
finding the REV in the investigated domain. 531
Table 3. Porosity losses in S1 and S3 over the course of applying the extended computational workflow (Figure 532
2). 533
Sample Sample size
(mean mesh edge size) [µ𝑚] CT segmented
image porosity (%)
Connected
porosity (%)
Mesh
porosity (%)
Gas porosity
(%)
S1 (entire sample,
1180 voxels)
2950 (14) 17.5 15.6 13.6 28
S3 (REV, 350
voxels)
875 (5) 28.3 27.9 25.9 31

32
534
The porosity of the meshed domain of sample S1 is 13.6 % (in contrast to 17.5 % in the segmented 535
image, Table 3), and the mesh edge length is 14 µm along the pore walls. The observed porosity loss results 536
from disconnecting narrow pore throats from the connected cluster imaged with a 2.5 µm voxel size due to 537
the use of a 14 µm mesh size (the lowest possible for our computational needs). A maximum Reynolds number 538
of 𝑅𝑒 = 0.084 was used to guarantee the simulation in a creeping flow regime. 539
The symmetrized permeability tensor, �̿� (Eq.5), was obtained as follows (Table 2): 540
�̿�𝒔𝒚𝒎 = (420 66.3 1.9166.3 344 12.81.91 12.8 163
) (6) 541
542
The permeability tensor is anisotropic, with 𝜅𝑧𝑧 being more than twice smaller than 𝜅𝑥𝑥 and 𝜅𝑦𝑦. This 543
result is in agreement with the appearance of horizontal banding with higher cementation (Figure 3a). 544
The porosity of the meshed domain of sample S3 is 25.9 % (in contrast to 28.3 % in the segmented 545
image, Table 3), and the mesh edge length is 5 µm along the pore walls. A maximum Reynolds number of 546
𝑅𝑒 = 0.22 was used to guarantee the simulation in a creeping flow regime. The symmetrized permeability 547
tensor is close to isotropic (Table 2): 548
�̿�𝒔𝒚𝒎 = (4517 5 38
5 4808 547
38 547 4085
) (7) 549
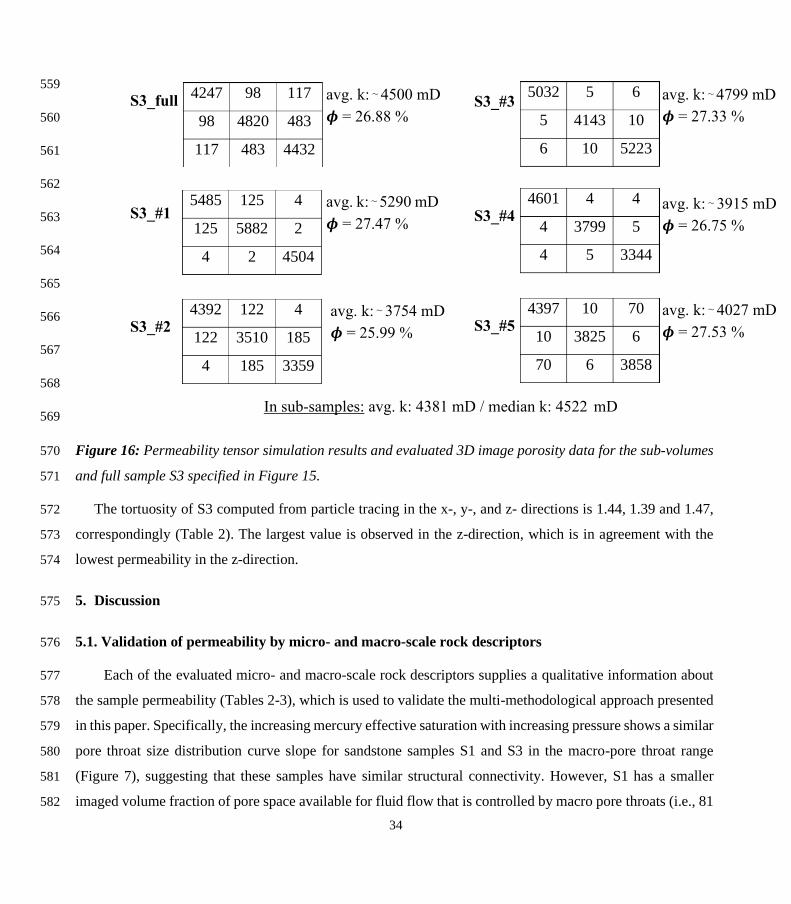
Additional permeability tensor simulations on equivalently REV sized segmented sub-volumes of S3 550
and on the full S3 (Figure 15, cube volume of 3 ×3 ×3 mm3) have been performed with GeoDict toolbox, to 551
ensure consistency of the estimated REV size. Sub-volumes locations are presented. Symmetrized 552
permeability tensors simulated in these domains (Figure 16) are close to the former one (Eq. 7) being also 553
nearly isotropic. 554

33
555
Figure 15: Selection of the sub-volumes in the S3 CT dataset, for additional permeability tensor simulations. 556
Each sub-volume has a size of 350 voxels cubed, while full volume is of 1200 voxels cubed size. 557
558
34
559
560
561
562
563
564
565
566
567
568
569
Figure 16: Permeability tensor simulation results and evaluated 3D image porosity data for the sub-volumes 570
and full sample S3 specified in Figure 15. 571
The tortuosity of S3 computed from particle tracing in the x-, y-, and z- directions is 1.44, 1.39 and 1.47, 572
correspondingly (Table 2). The largest value is observed in the z-direction, which is in agreement with the 573
lowest permeability in the z-direction. 574
5. Discussion 575
5.1. Validation of permeability by micro- and macro-scale rock descriptors 576
Each of the evaluated micro- and macro-scale rock descriptors supplies a qualitative information about 577
the sample permeability (Tables 2-3), which is used to validate the multi-methodological approach presented 578
in this paper. Specifically, the increasing mercury effective saturation with increasing pressure shows a similar 579
pore throat size distribution curve slope for sandstone samples S1 and S3 in the macro-pore throat range 580
(Figure 7), suggesting that these samples have similar structural connectivity. However, S1 has a smaller 581
imaged volume fraction of pore space available for fluid flow that is controlled by macro pore throats (i.e., 81 582
S3_full
S3_#1
S3_#2
S3_#3
S3_#4
S3_#5
avg. k: ~
4500 mD
𝝓 = 26.88 %
avg. k: ~ 5290 mD
𝝓 = 27.47 %
avg. k: ~
3754 mD
𝝓 = 25.99 %
avg. k: ~
4799 mD
𝝓 = 27.33 %
avg. k: ~
3915 mD
𝝓 = 26.75 %
avg. k: ~ 4027 mD
𝝓 = 27.53 %
In sub-samples: avg. k: 4381 mD / median k: 4522 mD
4247 98 117
98 4820 483
117 483 4432
5485 125 4
125 5882 2
4 2 4504
4392 122 4
122 3510 185
4 185 3359
5032 5 6
5 4143 10
6 10 5223
4601 4 4
4 3799 5
4 5 3344
4397 10 70
10 3825 6
70 6 3858

35
% in S1 vs. 93 % in S3, Figure7) due to its higher contents of silt, clay, and Fe-ox cement. The intermediate 583
layer (S2) with 19 % porosity comprises more fines, which form a clay matrix (Table 2) due to poor grain 584
sorting and smaller mechanical resistance of clay to pressure under the burial conditions. Only ~15 % of the 585
pore volume fraction in S2 is controlled by bottle-neck macro pore throats (Figure 7). However, the 586
characteristic length of S2, 12.3 µm (Table 2), indicates that macro-pore connectivity is still possible even 587
when the pore space consists mainly of sub-macro-scale porosity. This 0.15 volume fraction is in agreement 588
with Harter (2005), who estimated a volume fraction threshold of 0.13 for correlated yet random 3D fields 589
required for full interconnectivity. 590
The value of the connectivity index of S3 (10) evaluated from CT data is approximately three times higher 591
than that of S1 (3.49), while both rocks are defined as moderately sorted sandstones (Table 2). This difference 592
is due to S1 having a smaller number of inequivalent loops within the imaged pore network than S3, leading 593
to smaller Euler characteristics (see Supplementary material for more detail). Inequivalent loops are positively 594
correlated with pore throats; their number is affected by the resolution of the CT image and by the partial 595
volume effect at grain surfaces (Cnudde and Boone, 2013; Kerckhofs et al., 2008), where some voxels could 596
be identified as grains and thus “clog” the small pore throats. Artefact porosity loss is apparent for S1, where 597
the IP is 17.5 % (in contrast to the CT porosity of 23.5 % predicted from MIP, Table 2). The connectivity 598
index of S2 (0.94, Table 2) is lower than those of both S1 and S3 because of the clay matrix, which clogs 599
pores with sizes below the image resolution. The effect of the partial volume effect on the image connectivity 600
and on the preservation of small features was reviewed by Schlüter et al. (2014). 601
A correlation was found between the grain size and the amount of Fe-ox cement in S1 evaluated at each 602
slice along the z-direction (from the image analysis, Figure 17). Exceptionally large grains are detected 603
(indicated by the red rectangle) near the cemented region at ~750 μm. Large grains and a relatively high 604
amount of cement can also be observed in the S1 thin section (Figure 3b). Large grains cause large pores and 605
generate relatively permeable horizons through which water flow and solute transport can become focused 606
(McKay et al., 1995; Clavaud et al., 2008), supplying iron solutes. We suggest that a vadose zone was formed 607
after flooding events, where the water flow mechanism could have changed from gravity dominated to 608
capillary dominated. Water then flowed due to capillary forces along grain surfaces towards regions with 609
larger surface areas, and iron solutes precipitated in a reaction with oxygen available in the partly saturated 610
zone. We suggest that with time, this cementation mechanism caused a decrease in the pore throat size near 611

36
the preferential path, while the preferential path with a low surface area remained open, eventually generating 612
the observed anisotropic flow pattern. 613
614
Figure 17. Grain size scattering and Fe-ox cement content in sandstone S1 in slices along the z-direction. The 615
red rectangle emphasizes very large grains that were detected. 616
In this respect, permeability anisotropy in sandstones at a small scale is usually attributed to the shape or 617
preferential orientation of grains and pores (e.g., Sato et al., 2019) and to a heterogeneous distribution of 618
cementing material at grain contacts (Louis et al., 2005). Clay-free and cement-free layers in S1 thus constitute 619
the main avenues for flow in the parallel direction, shown by variation in porosity in z-direction (Fig. 11c) 620
that is correlated with anisotropic permeability tensor (Eq. 6). At a larger scale, a higher degree of permeability 621
anisotropy is usually associated with the presence of localized beds, foliation, and compaction bands that 622
constitute barriers to flow in the perpendicular direction (see Halisch et al., 2009; Clavaud et al., 2008 and 623
references therein). 624
Flow modelling in the specified REV of S1 shows anisotropy (Table 2) and an average permeability value 625
of 310 mD that is close to that derived from MIP (330 mD). However, the average permeability is lower than 626
ce
men
t co
nte
nt, %

37
the average experimental gas permeability (~543 mD); this difference should be related to the loss of porosity 627
due to limitations on the CT resolution, image processing and meshing (Table 3, see Sect. 5.2 for more details). 628
In contrast, flow modelling and upscaling to the macro scale indicate an isotropic S3 sample (Eq.7). 629
However, the modelled permeability (~4500 mD) is ten times higher than the MIP-derived permeability (~466 630
mD, Table 2). Gas permeability measurements indicate anisotropy, yielding permeabilities of ~4600 mD in 631
the x-y plane and ~220 mD in the z-direction (with an anisotropy ratio of ~20, defined here as κ||/κ⊥, e.g., Tiab 632
and Donaldson, 2004). For comparison, the values of this ratio obtained from experimental permeability 633
measurements were ~1.2 for Bentheim sandstone (Louis et al., 2005), ~1.7-2.5 for a sandstone within the 634
Cretaceous Virgelle Member, Alberta, Canada (Meyer and Krause, 2001), and ~8.5 for Berea sandstone (Sato 635
et al., 2019). However, in our laboratory measurements conducted parallel to the layering (in the x-y plane), 636
poorly cemented grains in S3 could dislocate from the weakly consolidated sample due to the application of a 637
pressure gradient. This could have resulted in a higher measured gas flux and thus a higher permeability 638
parallel to the layering, yielding a high anisotropy. 639
Alternatively, the disagreement between the laboratory-determined permeability perpendicular to the 640
layering, κ⊥, and the isotropic permeability obtained from the flow modelling (Table 2, Eq.7) may also stem 641
from the small dimension of the modelled REV domain (cube edge length of ~0.875 mm), which may not 642
have included the additional textural features (e.g., Figure 5d) that constrain fluid flow on a larger scale of the 643
lab sample of S3 (2.5 cm in diameter and 5-7 cm in length). 644
However, the consistency of the REV size in S3 by the additional permeability simulations on 645
equivalently REV sized segmented sub-volumes and on the entire sample (Figures 15, 16), is confirmed by 646
yielding nearly isotropic permeability tensors that are also in a good agreement with previously simulated 647
permeability tensor in the REV (Eq.7). The average permeability derived from all REV-sized sub-volumes is 648
~4381 mD, compared to the average permeability of ~4500 mD simulated over the entire S3 geometry. This, 649
again, is in a good accordance with the gas permeability of S3 measured parallel to the layering (~4600 mD, 650
Table 2). These additional simulation results (Figure 16), strengthen our conclusion that those may not have 651
included the textural features that constrain fluid flow on a larger scale of the sample S3 tested by the 652
laboratory experiments. Similarly, the differences with the permeability estimated by MIP seem to originate 653
from the same reason. 654

38
For sample S2, REV and slice-by-slice porosity analysis indicated an REV size larger than the 655
investigated sample size (Figure 13c, 14). For this reason, the analytical programme formulated in our study 656
cannot entirely be applied to S2 due to the impossibility of determining a reliable REV and hence conducting 657
pore-scale flow modelling. As a result, although sample S2 represents a common sandstone, it is very 658
heterogeneous in nature, and a sample larger than at least 9 mm (which is a maximal length in z-direction of 659
the tested domain (Figure 13c)) is required to capture its REV. The MIP-derived permeability is 4 mD; this 660
low permeability is due to a clay-rich matrix that encloses substantial void space (Hurst and Nadeau, 1995; 661
Neuzil, 2019). The gas permeability of the quartz wacke layer (S2, ~4.6 mD on average) is approximately two 662
orders of magnitude lower than that of the quartz arenite layers (S1 and S3, Table 2). The permeability 663
anisotropy ratio of S2 is ~2.8. The high inverse correlation between the porosity and clay matrix content 664
enhanced in the z-direction (Figures 13c,f) suggests that the clay matrix pattern appears as horizontal layering, 665
thus generating the observed anisotropy. 666
Finally, non-marine sandstones of Lower Cretaceous age (as well as sandstones in general), feature a 667
big complexity and variability in their characteristics, as immediately seen even from a comparison of our 668
samples S1, S2, S3 from the same outcrop (Table 2). For instance, low porosity of Wealden quartz arenite 669
sandstones from Weald Basin within Ashdown and Wadhurst Clay Fms. in southeast England, ranges between 670
6.3 % and 13.2 %, while permeability between 0.4 mD and 11.9 mD (Akinlotan, 2016), suggested to be 671
controlled mainly by grain sizes, grain shapes, and sorting that are directly linked to their depositional 672
environment. Average porosities of 3.06 % and 0.19 % were evaluated in medium and fine grained 673
tight gas sandstones, correspondingly, from Lower Cretaceous Denglouku Fm. in the Songliao Basin, 674
China (Zhang et al., 2019). Alternatively, a secondary porosity of 4 % to 22 % was generated by 675
acidic fluids acting in the compactional regime, destructing a high primary porosity in sandstone of 676
Lower Cretaceous Shurijeh Fm. in the eastern Kopet-Dagh Basin in NE Iran (Moussavi-Harami and 677
Brenner, 1993). Significant average porosity and permeability of 20 % and 3700 mD, respectively, 678
were quantified in the Masila Block, Upper Qishn Fm. of the Lower Cretaceous Age, Republic of 679
Yemen (Harding et al., 2002). Multi-methodological approach suggested in this study is applicable 680
to all those sandstones with broad ranges of their textural, topological and mineralogical 681
characteristics and should lead to their accurate petrophysical characterization. 682

39
683
5.2. Upscaling permeability: accuracy of the extended computational workflow 684
The extended computational workflow (Figure 2) serves as the main tool in this study for 685
upscaling permeability from the pore-scale velocity field. The accuracy of each step in the workflow 686
affects the ultimate result. 687
Following the steps of the workflow, a micro-CT image resolution of 2.5 μm limits the 688
reliability of the representation of the porous medium and defines the lower pore identification limit 689
using this method. As an example of this limitation, the SSA (bulk specific surface area) calculated 690
by MIP is larger than the PSA (pore specific surface area) calculated by micro-CT image analysis in 691
all the samples (Table 2), although the pore volume is always smaller than the bulk volume. The PSA 692
from micro-CT is limited by the image resolution and therefore does not consider relatively small 693
pores with large surfaces. The PSAs of S1 and S3 are similar, but the SSA (from MIP) of S1 is 20 694
times larger than that of S3 because S1 has a larger surface area at small pores created mainly by Fe-695
ox cement (compare Figure 3c-f for S1 to Figure 5c for S3). In contrast to SSA, PSA in S2 is only 696
twice as large as that of S1 due to the presence of clay and clay matrix with large surface areas. 697
Image processing and segmentation were applied in this study to recover the image geometry, 698
which was blurred by noise or affected by the partial volume effect (see Sect. 3). Then, the loss of 699
pore space due to the resolution limits was estimated in this study from the amount of mercury filling 700
the pores with diameters equal to the resolution limit (Figure 7a). After segmentation, sample S1 had 701
a segmented image porosity of 17.5 % and a CT predicted porosity of 23.5 % from MIP (Tables 2, 702
3). Therefore, the difference in porosities generated by the partial volume effect in the image 703
processing scheme (e.g., Cnudde and Boone, 2013) is a significant component of error, especially for 704
small structures, such as pores with a large surface area-to-volume ratio. In contrast, the image 705
porosity of S3 after segmentation was 28.3 %, which is close to the porosity of 30.4 % estimated from 706
MIP (Tables 2, 3). This is a result of the very small degree of cementation and the absence of Fe-ox 707
flakes in the majority of the sample pores, leading to the small contribution of the partial volume 708
40
effect. In comparison, a fine-grained and well-sorted Lower Cretaceous Fm. sandstone from Heletz 709
Field (e.g., Figure 1a) (Tatomir et al., 2016) comprising clay and calcite, had MIP and micro-CT 710
porosities of 26.7 % and 20.9 %, respectively. 711
An additional source of inaccuracy is the use of a porosity-based REV for permeability approximations. 712
Mostaghimi et al. (2012) showed that for CT images of sandpacks (homogenous samples), the porosity-based 713
REV had an edge length of 0.5 mm, whereas the permeability-based REV was twice as large. Moreover, the 714
porosity- and permeability- based REVs in images of crushed bead packs derived by Zhang et al. (2000) had 715
edge lengths of 1.71 and 2.57 mm, respectively. According to Mostaghimi et al. (2012), larger REV values for 716
permeability rely on contributions from the tortuosity and connectivity of pore spaces, whereas the larger REV 717
values of Zhang et al. (2000) might be related to the heterogeneity of the sample. 718
This discrepancy indicates a larger REV for a rock property evaluated using physics-based simulations 719
than for those estimated using morphology-based methods (Saxena et al., 2018 and references therein). 720
Furthermore, implementing the classic REV determination methodology (e.g., Callow et al., 2020) using very 721
small search sub-volumes is not in agreement with capturing a sufficient structural complexity (Saxena et al., 722
2018). 723
Flow simulations performed in sub-volumes and full sample of S3 (Figures 15, 16) support this 724
conclusion. Small dimensions of the evaluated REV (~ 0.875 mm) of homogeneous S3 ensure efficient 725
calculations. Both, porosity and permeability demonstrate a good agreement (Table 2, Figure 16), thus 726
confirming a representativeness of the estimated REV and a continuity of these characteristics over the chosen 727
sample. However, the differences in porosity between the sub-samples and the full sample are smaller than the 728
corresponding differences in permeability (Figure 16), as anticipated from the porosity-based REV derivation 729
discussed above. 730
An additional verification of the REV size for flow simulations in S3 follows the approach given by 731
Saxena et al. (2018). They demonstrated that for homogeneous sandstones, the smallest pore throats can be 732
accurately resolved at 𝑁𝐼 > 10, where 𝑁𝐼 = 𝐷𝐷/∆𝑥 is a ratio of the pore throat size corresponding to mercury 733
entry pressure, 𝐷𝐷, and of the voxel size, ∆𝑥. NI controls the lower bound on permeability that can be reliably 734
calculated using a digital rock image, to capture sufficient structural complexity of rock microstructure which 735
affects flow, attributed to DD visualized using Δx. For our sub-volumes of sample S3 imaged with ∆𝑥 = 2.5 736
µm resolution, and 𝐷𝐷 = 35 µm (Table 2), 𝑁𝑖 = 14 > 10. In addition, there is a requirement for the minimal 737

41
REV size for representativeness for permeability calculation, 𝑁𝑅𝐸𝑉 = 𝐿/𝐷𝑒𝑓𝑓 > 5 (Saxena et al., 2018), where 738
𝐿 is a digital rock (i.e., domain) length, and 𝐷𝑒𝑓𝑓 is the effective grain diameter (e.g., Říha et al., 2018). For 739
S3 sub-volumes with 𝐿 = 875 µm REV size and 𝐷𝑒𝑓𝑓 = 58.6 µ𝑚 (computed from laboratory grain size data 740
which includes both sand and fines, Figure 6), this requirement is achieved as well: 𝑁𝑅𝐸𝑉 = 15 > 5, which 741
also proves the reliability of the sub-volume permeability modelling with the presented approach. The 742
calculations in sub-volume performed with Comsol (Eq. 7, Table 2) demonstrate the smallest deviation in 743
mean permeability compared to that in the full sample (0.85 %). In comparison, other sub-volumes modelled 744
with GeoDict (Figure 16) have larger mean permeability deviations from the full sample (ranging between 5 745
% and 17 %), still demonstrating a very good agreement with those conducted on the full-scale S3 domain. 746
Further, according to Saxena et al. (2018), REV size supported by 𝑁𝑅𝐸𝑉 for flow simulations, should 747
also be insensitive to the choice of boundary conditions, which effect on tensorial flow properties diminishes 748
with an increasing sample size (e.g., Guibert et al., 2016; Gerke et al., 2019). No-slip boundary conditions 749
applied in our study at four lateral faces of the modelling domains, correspond to those in the experimental 750
permeability measurements and are also the most commonly used boundary conditions for the pore-scale flow 751
simulations (Guibert et al., 2016 and references therein). However, they were recently shown to suppress the 752
transversal flow through the simulation domain to some extent, resulting in deviation in alignment of the 753
permeability tensor and in underestimation of its magnitude (Gerke et al., 2019) even at REV dimensions. 754
Thus, the difference in the mean permeability derived from all REV-sized sub-volumes (~ 4381 mD) and that 755
simulated over the entire S3 geometry (~ 4500 mD) (Figure 16) can also be attributed to this effect. For the 756
future studies we suggest that determining REV size for the flow simulation from porosity is justified, by 757
acknowledging the typical ratio of two between those for permeability and porosity. 758
To upscale to permeability reliably, the REV domain should be sufficiently large such that it is bounded 759
from below by the scale of the textural bedding but should not be larger than necessary to optimize the 760
computational efficiency (while remaining within the same scale of heterogeneity, i.e., at the macro scale). As 761
a result, a REV with an edge length of ~2950 μm was chosen in the current study in sample S1, based on slice-762
by-slice porosity profiles that reveal mm-scale layering in the z-direction (Figure 11c), rather than on the 763
classic isotropic REV approach. For comparison, in other studies, the edge lengths of REVs in sandstones were 764
0.68 mm (Ovaysi and Piri, 2010), 0.8 mm (Mostaghimi et al., 2012), and 1.2 mm (Okabe and Oseto, 2006; 765
Tatomir et al., 2016) derived by the classic approach. In contrast to the classic REV estimation, where porosity 766

42
analysis does not consider directionality, 1D profiles from slice-by-slice porosity provides additional 767
information on anisotropy and inhomogeneity of the sample which have implications on the ultimate 768
determination of the REV. In the future studies, the 1D profiles can be used to calculate spatial correlation 769
length (e.g., using variogram analyses) of geological structures that include layering, as in S1 in the current 770
study. 771
Another source of inaccuracy is the geometry used for the flow model. The geometry considered in this 772
study included only the pore network connecting six faces of the REV cube. Other pore spaces in the REV 773
disconnected from the main network were deleted (because all paths smaller than the resolution were 774
prescribed as grain pixels due to the partial volume effect), thus resulting in the smaller effective size of the 775
simulation domain. The image porosity of sample S1 was 17.5 %, whereas its connected porosity was 776
estimated as 15.6 % (Table 3), while those of sample S3 were 28.3 % and 27.9 %, respectively. 777
Furthermore, the mesh was generated by taking a trade-off between the size of the mesh elements (4 778
elements in the smallest pore throat) and computational limits into account, while coarsening the mesh 779
elements towards the pore centre. The connectivity between pores with very fine pore throats that could not 780
be replaced by mesh elements could be lost, resulting in the loss of those pores in the calculations. In sample 781
S1, the porosity used in the simulation was approximately 50 % smaller than the porosity estimated by gas 782
porosimetry (Tables 2, 3). In contrast, the porosity used in the simulations in S3 was mostly preserved, 783
comprising ~84 % of that estimated in the laboratory. 784
For comparison, in the fine-grained sample of the Lower Cretaceous sandstone from Heletz Field in 785
Israel (Figure 1a), which has grain size characteristics similar to those of S1 but with higher clay and additional 786
calcite contents (Tatomir et al., 2016), the permeability upscaled from micro-CT flow modelling (conducted 787
by the same simulation method as that in the current study) exceeded the gas permeability by a factor of ~7. 788
This could be related to the reduction in the specific surface area by image processing and meshing 789
(Mostaghimi et al., 2012) conducted for the flow modelling. 790
Finally, the upscaling process from the flow modelling successfully predicted the permeability 791
anisotropy ratio of ~ 2.3 in S1, as discussed above. For comparison, the permeability anisotropy ratio evaluated 792
using micro-CT flow monitoring in clay-free sandstones (Clavaud et al., 2008) had a mean value of ~2.5 793
(ranging from ~1.7 to ~5.2), related to the presence of less permeable silty layers. This is consistent with the 794

43
ratio estimated at the pore scale in Rothbach sandstone (~5) (Louis et al., 2005), attributed to lamination due 795
to differences both in the characteristics of the solid phase (grain size and packing) and in the content of the 796
Fe-ox. 797
798
6. Conclusions 799
This paper presents a detailed description and evaluation of a multi-methodological petrophysical approach 800
for the comprehensive multiscale characterization of reservoir sandstones. The validation was performed on 801
samples from three different consecutive layers of Lower Cretaceous sandstone in northern Israel. The 802
following conclusions can be drawn: 803
1. The suggested methodology enables the identification of links between Darcy-scale permeability 804
and an extensive set of geometrical, textural and topological rock descriptors. Specifically, 805
micro-scale geometrical rock descriptors (grain and pore size distributions, pore throat size, 806
characteristic length, pore throat length of maximal conductance, specific surface area, and 807
connectivity index) and macro-scale petrophysical properties (porosity and tortuosity), along 808
with anisotropy and inhomogeneity, are used to predict the permeability of the studied layers. 809
2. Laboratory porosity and permeability measurements conducted on centimetre-scale samples 810
show less variability for the quartz arenite (top and bottom) layers and more variability for the 811
quartz wacke (intermediate) layer. The magnitudes of this variability in the samples are correlated 812
with the dimensions of their representative volumes and anisotropy, both of which are evaluated 813
within the micro-CT-imaged 3D pore geometry. This variability is associated with clay and 814
cementation patterns in the layers. 815
3. Two different porosity variation patterns are revealed in the top quartz arenite layer: fluctuations 816
at ~100 μm half wavelength in all direction, associated with an average pore cross-section, and 817
those at ~3.5 mm wavelength in the vertical direction only, associated with the occurrence of 818
high- and low-porosity horizontal bands occluded by Fe-ox cementation. The latter millimetre-819
scale variability is found to control the macroscopic rock permeability measured in the 820

44
laboratory. Bands of lower porosity could be generated by Fe-ox cementation in regions with 821
higher surface areas adjacent to preferential fluid flow paths. 822
4. More heterogeneous pore structures were revealed in the quartz wacke sandstone of the 823
intermediate layer. This heterogeneity resulted mainly from the presence of patchy clay 824
deposition structure. 825
5. Quartz arenite sandstone of the bottom layer shows stationarity in the investigated domain and 826
lower anisotropy characteristics than that of the top layer, due to less horizontal cement bands. 827
6. The macroscopic permeability upscaled from the pore-scale velocity field simulated by flow 828
modelling in the micro-CT-scanned geometry of millimetre-scale sample shows agreement with 829
laboratory petrophysical estimates obtained for centimetre-scale samples for the quartz arenite 830
layers. Comparison of permeability tensors evaluated in multiple REV sub-volumes and in the 831
full segmented sample of the bottom layer, shows a particular agreement attributed to the 832
homogeneity of this sample. 833
7. The multi-methodological petrophysical approach detailed and evaluated in this study allows the 834
accurate petrophysical characterization of reservoir sandstones with broad ranges of textural and 835
topological features. 836
837
Acknowledgements 838
This project was supported by fellowships from the Ministry of Energy, Israel, and the University of 839
Haifa. The authors are grateful to Igor Bogdanov from the University of Pau for his continuing scientific 840
support. Special thanks to Rudy Swennen and his group from KU Leuven for their contributions to the MIP, 841
thin section preparation, microscopy and micro-CT image processing; to Veerle Cnudde and her group from 842
Ghent University for teaching us the image processing techniques; to Kirill Gerke and Timofey Sizonenko 843
from the Russian Academy of Sciences for providing their image processing code; to Uzi Saltzman from 844
Engineering Geology and Rock Mechanics Company, Israel, for sending his detailed historic geological 845
description of the study area; and to Or Bialik, Nimer Taha and Ovie Emmanuel Eruteya from the 846
University of Haifa, Israel, for their assistance in the laboratory work. We thank the editor and two 847
anonymous reviewers for their significant contribution in enhancing this paper. 848
849

45
Competing interests 850
The authors declare that they have no conflicts of interest. 851
852
Author contributions 853
PH and RK designed the study. PH developed codes for pore-scale modelling with contributions by RK and 854
MH. BS advised the microscopy and led the geological interpretations. MH scanned the samples. NW led the 855
laboratory measurements. All co-authors participated in the analysis of the results. PH wrote the text with 856
contributions from all co-authors. All co-authors contributed to the discussion and revisions and approved the 857
paper. 858
859
Supplementary Material & Data Availability 860
3-D µ-CT datasets are freely available at the open access data repository “PANGAEA” under the given doi: 861
https://doi.pangaea.de/10.1594/PANGAEA.907552. 862
863

46
References 864
Abed, A. M.: Depositional environments of the early cretaceous Kurnub (Hatira) sandstones, North Jordan, 865
Sedimentary Geology, 31(3-4), 267-279, 1982. 866
Akinlotan, O.: Porosity and permeability of the English (Lower Cretaceous) sandstones, Proceedings of the 867
Geologists' Association, 127, 681-690, 2016. 868
Akinlotan, O.: Mineralogy and palaeoenvironments: the Weald Basin (Early Cretaceous), Southeast England, 869
The Depositional Record, 3(2), 187-200, 2017. 870
Akinlotan, O.: Multi-proxy approach to palaeoenvironmental modelling: the English Lower Cretaceous Weald 871
Basin, Geol. J. 53, 316–335, 2018. 872
Ambegaokar, V., Halperin, B. I., & Langer, J. S. (1971). Hopping conductivity in disordered systems. Physical 873
review B, 4(8), 2612. 874
American Petroleum Institute, API : Recommended Practices for Core Analysis, RP 40, second edition, 1998. 875
Amireh, B. S.: Sedimentology and palaeogeography of the regressive-transgressive Kurnub Group (Early 876
Cretaceous) of Jordan, Sedimentary Geology, 112(1-2), 69-88., 1997. 877
Andrä, H., Combaret, N., Dvorkin, J., Glatt, E., Han, J., Kabel, M., Keehm. Y., Krzikalla, F., Lee, M., 878
Madonna, C., Marsh, M., Mukerji, T., Saenger, E., Sain, R., Saxena, N., Ricker, S., Wiegmann, A., and 879
Zhan, X.: Digital rock physics benchmarks-Part I: Imaging and segmentation, Computers & Geosciences, 880
50, 25-32, 2013a. 881
Andrä, H., Combaret, N., Dvorkin, J., Glatt, E., Han, J., Kabel, M., Keehm. Y., Krzikalla, F., Lee, M., 882
Madonna, C., Marsh, M., Mukerji, T., Saenger, E., Sain, R., Saxena, N., Ricker, S., Wiegmann, A., and 883
Zhan, X.: Digital rock physics benchmarks-Part II: Computing effective properties, Computers & 884
Geosciences, 50, 33-43, 2013b. 885
Arns, J.Y., Sheppard, A.P., Arns, C.H., Knackstedt, M.A., Yelkhovsky, A., and Pinczewski, W.V.: Pore-level 886
validation of representative pore networks obtained from micro-CT images. In: Proceedings of the annual 887
symposium of the society of core analysis, SCA2007-A26, Calgary, Canada, 2007. 888
Asakawa, S., Watanabe, T., Lyu, H., Funakawa, S. and Toyohara, H.: Mineralogical composition of tidal flat 889
sediments in Japan, Soil Science and Plant Nutrition, 1-9, 2020. 890
Avigad, D., Kolodner, K., McWilliams, M., Persing, H., and Weissbrod, T.: Origin of northern Gondwana 891
Cambrian sandstone revealed by detrital zircon SHRIMP dating, Geology, 31(3), 227-230, 2003. 892
Avigad, D., Sandler, A., Kolodner, K., Stern, R. J., McWilliams, M., Miller, N., and Beyth, M.: Mass-893
production of Cambro-Ordovician quartz-rich sandstone as a consequence of chemical weathering of Pan-894
African terranes: Environmental implications, Earth and Planetary Science Letters, 240(3-4), 818-826, 895
2005. 896
Bear, J.: Dynamics of fluids in porous media. Courier Corporation, 2013. 897
Blunt, M. J., Bijeljic, B., Dong, H., Gharbi, O., Iglauer, S., Mostaghimi, P., Paluszny, A., and Pentland, C.: 898
Pore-scale imaging and modelling, Advances in Water Resources, 51, 197-216, 2013. 899
Boek, E. S., and Venturoli, M.: Lattice-Boltzmann studies of fluid flow in porous media with realistic rock 900
geometries, Computers & Mathematics with Applications, 59(7), 2305-2314, 2010. 901

47
Bogdanov, I. I., Guerton, F., Kpahou, J., and Kamp, A. M.: Direct pore-scale modeling of two-phase flow 902
through natural media, in: Proceedings of the 2011 COMSOL Conference in Stuttgart, 2011. 903
Bogdanov, I. I., Kpahou, J., and Guerton, F.: Pore-scale single and two-phase transport in real porous medium, 904
in: Proceedings of ECMOR XIII-13th European Conference on the Mathematics of Oil Recovery, 905
September, 2012. 906
Boudreau, B. P.: The diffusive tortuosity of fine-grained unlithified sediments, Geochimica et Cosmochimica 907
Acta, 60(16), 3139-3142, 1996. 908
Brabant, L., Vlassenbroeck, J., De Witte, Y., Cnudde, V., Boone, M. N., Dewanckele, J., and Van Hoorebeke, 909
L.: Three-dimensional analysis of high-resolution X-ray computed tomography data with Morpho+, 910
Microscopy and Microanalysis, 17(2), 252-263, 2011. 911
Brunke, O., Brockdorf, K., Drews, S., Müller, B., Donath, T., Herzen, J., and Beckmann, F.: Comparison 912
between X-ray tube based and synchrotron radiation based μCT, in: Developments in X-ray Tomography 913
VI, edited by: Stock, S. R., San Diego: SPIE, 7078, 2008. 914
Callow, B., Falcon-Suarez, I., Marin-Moreno, H., Bull, J. M., and Ahmed, S. Optimal X-ray micro-CT image 915
based methods for porosity and permeability quantification in heterogeneous sandstones, Geophysical 916
Journal International, 223(2), 1210-1229, 2020. 917
Calvo, R., The diagenetic history of Heletz Formation and the timing of hydrocarbons accumulation in Heletz-918
Kokhav oil field. M.Sc. thesis, The Hebrew University of Jerusalem, 72 p. (in Hebrew, with English 919
abstract), 1992. 920
Calvo, R., Ayalon, A., Bein, A., and Sass, E.: Chemical and isotopic composition of diagenetic carbonate 921
cements and its relation to hydrocarbon accumulation in the Heletz-Kokhav oil field (Israel), Journal of 922
Geochemical Exploration, 108(1), 88-98, 2011. 923
Carman, P. C.: Fluid flow through granular beds, Trans. Inst. Chem. Eng., 15, 150-166, 1937. 924
Cerepi, A., Durand, C., and Brosse, E.: Pore microgeometry analysis in low-resistivity sandstone reservoirs, 925
Journal of Petroleum Science and Engineering, 35(3-4), 205-232, 2002. 926
Clavaud, J. B., Maineult, A., Zamora, M., Rasolofosaon, P., and Schlitter, C.: Permeability anisotropy and its 927
relations with porous medium structure, Journal of Geophysical Research: Solid Earth, 113(B1), 2008. 928
Cnudde, V., and Boone, M. N.: High-resolution X-ray computed tomography in geosciences: A review of the 929
current technology and applications, Earth-Science Reviews, 123, 1-17, 2013. 930
Cohen, A., and Boehm, S.: Lithofacies and environments of deposition of the Lower Cretaceous Helez & 931
Telamim Formations, Geological Survey of Israel Report No. 5, 1983. 932
Cohen, Z.: The geology of the Lower Cretaceous in Southern Coastal Plain, Ph.D. thesis, The Hebrew 933
University of Jerusalem, 98 pp. (in Hebrew, with English abstract), 1971. 934
Cressie, N.. Fitting variogram models by weighted least squares. Journal of the international Association for 935
mathematical Geology, 17(5), 563-586, 1985. 936
Du, S., Pang, S., and Shi, Y.: Quantitative characterization on the microscopic pore heterogeneity of tight oil 937
sandstone reservoir by considering both the resolution and representativeness, J. Pet. Sci. Eng., 169, 388–938
392, 2018. 939
Dullien, F. A.: Porous media: fluid transport and pore structure, Academic press, 2012. 940

48
Harter, T.: Finite-size scaling analysis of percolation in three-dimensional correlated binary Markov chain 941
random fields, Physical Review E, 72(2), 026120, 2005. 942
Farrel, N.J.C., Healy, D., and Taylor, C.W.: Anisotropy of permeability in faulted porous sandstones. Journal 943
of Structural Geology 63, 50-67, 2014. 944
Ferreira, N. N., Ferreira, E. P., Ramos, R. R., and Carvalho, I. S.: Palynological and sedimentary analysis of 945
the Igarapé Ipiranga and Querru 1 outcrops of the Itapecuru Formation (Lower Cretaceous, Parnaíba 946
Basin), Brazil, Journal of South American Earth Sciences, 66, 15-31, 2016. 947
Folk, R. L., and Ward, W. C.: Brazos River bar [Texas]; a study in the significance of grain size parameters, 948
Journal of Sedimentary Research, 27(1), 3-26, 1957. 949
Gardosh, M. A., and Tannenbaum, E.: The petroleum systems of Israel, in: Petroleum systems of the Tethyan 950
region: AAPG Memoir, edited by: Marlow, L., Kendall, C., and Yose, L., 106, 179-216, 2014. 951
Garfunkel, Z.: The pre-quaternary geology in Israel, in: The zoogeography of Israel, edited by: Tchernov, E., 952
and Yom-Tov, Y., Dr W. Junk Publishers, Dordrecht, Netherlands, 7-34, 1988. 953
Garfunkel, Z.: History and paleogeography during the Pan-African orogen to stable platform transition: 954
reappraisal of the evidence from the Elat area and the northern Arabian-Nubian Shield, Israel Journal of 955
Earth Sciences, 48, 135-157, 1999. 956
Gerke, K. M., Karsanina, M. V., and Katsman, R.: Calculation of tensorial flow properties on pore level: 957
Exploring the influence of boundary conditions on the permeability of three-dimensional stochastic 958
reconstructions, Physical Review E, 100, 053312, 2019. 959
Giesche, H.: Mercury porosimetry: a general (practical) overview. Particle & particle systems characterization, 960
23(1), 9-19, 2006. 961
Grader, P., and Reiss, Z.: On the Lower Cretaceous of the Heletz area, Geological Survey of Israel, Bull No. 962
16, 14 pp., 1958. 963
Grader, P.: The geology of the Heletz oil field, Ph.D. thesis, The Hebrew University of Jerusalem, 81 pp. (in 964
Hebrew, with English abstract), 1959. 965
Gringarten, E., and Deutsch, C.V.: Teacher's aide semivariogram interpretation and modeling. Mathematical 966
Geology, 33(4), 507-534, 2001. 967
Guibert, R., Horgue, P., Debenest, G., and Quintard, M.: A comparison of various methods for the numerical 968
evaluation of porous media permeability tensors from pore-scale geometry, Mathematical Geosciences, 969
48(3), 329-347, 2016. 970
Haldorsen, H. H., and Lake, L. W.: A new approach to shale management in field-scale models, Society of 971
Petroleum Engineers Journal, 24(04), 447-457, 1984. 972
Halisch, M.: Application and assessment of the lattice boltzmann method for fluid flow modeling in porous 973
rocks, PhD thesis, Technical University of Berlin, 182 pp., 2013a. 974
Halisch, M.: The REV Challenge – estimating representative elementary volumes and porous rock 975
inhomogeneity from high resolution micro-CT data sets, Society of Core Analysts (SCA) Proceedings, 976
SCA2013-069, 2013b. 977

49
Halisch, M., Weller, A., Debschütz, W., Sattler, C. D., and El-Sayed, A. M.: A complex core-log case study 978
of an anisotropic sandstone, originating from Bahariya Formation, Abu Gharadig Basin, Egypt, 979
Petrophysics, 50(06), 2009. 980
Haoguang, W. E. I., Kun, M. A., Xiang’an, Y. U. E., and Xinxin, W. A. N. G.: The Relationship of Ultra-Low 981
Permeability Sandstone Aspect Ratio With Porosity, Permeability, Advances in Petroleum Exploration 982
and Development, 7(1), 7-12, 2014. 983
Harding, T. G., Norris, B., and Smith, K.H.: Horizontal Water Disposal Well Performance in a High Porosity 984
and Permeability Reservoir Conference: SPE International Thermal Operations and Heavy Oil 985
Symposium and International Horizontal Well Technology Conference. 986
SPE-18153-MS, https://doi.org/10.2118/79007-MS, 2002. 987
Hurst, A., and Nadeau, P. H.: Clay microporosity in reservoir sandstones: an application of quantitative 988
electron microscopy in petrophysical evaluation, AAPG bulletin, 79(4), 563-573, 1995. 989
Iassonov, P., Gebrenegus, T., and Tuller, M.: Segmentation of X‐ray computed tomography images of porous 990
materials: A crucial step for characterization and quantitative analysis of pore structures, Water Resources 991
Research, 45(9), 2009. 992
Jackson, M. D., Muggeridge, A. H., Yoshida, S., and Johnson, H. D.: Upscaling permeability measurements 993
within complex heterolithic tidal sandstones, Mathematical Geology, 35(5), 499-520, 2003. 994
Kalaydjian, F.: Origin and quantification of coupling between relative permeabilities for two-phase flows in 995
porous media, Transport in porous media, 5(3), 215-229, 1990. 996
Kass, M., Witkin, A., and Terzopoulos, D.: Snakes: Active contour models, International Journal of Computer 997
Vision, 1(4), 321-331, 1988. 998
Katz, A. J., and Thompson, A. H.: Prediction of rock electrical conductivity from mercury injection 999
measurements, Journal of Geophysical Research: Solid Earth, 92(B1), 599-607, 1987. 1000
Kerckhofs, G., Schrooten, J., Van Cleynenbreugel, T., Lomov, S. V., and Wevers, M.: Validation of x-ray 1001
micro-focus computed tomography as an imaging tool for porous structures, Review of Scientific 1002
Instruments, 79(1), 013711, 2008. 1003
Khan, F., Enzmann, F., and Kersten, M.: Multi-phase classification by a least-squares support vector machine 1004
approach in tomography images of geological samples, Solid Earth, 7(2), 481-492, 2016. 1005
Knackstedt, M., Jaime, P., Butcher, A.R., Botha, P.W.S.K., Middleton, J., and Sok, R.: Integrating reservoir 1006
characterization: 3D dynamic, petrophysical and geological description of reservoir facies. In: 1007
Proceedings of the SPE Asia Pacific oil and gas conference and exhibition, 18–20 October, 2010, 1008
Brisbane, Queensland, Australia, SPE 133981, 2010. 1009
Kolodner, K., Avigad, D., Ireland, T. R., and Garfunkel, Z.: Origin of Lower Cretaceous (‘Nubian’) sandstones 1010
of North‐east Africa and Arabia from detrital zircon U‐Pb SHRIMP dating, Sedimentology, 56(7), 2010-1011
2023, 2009. 1012
Kozeny, J.: Uber kapillare leitung der wasser in boden, Royal Academy of Science, Vienna, Proceedings Class 1013
I, 136, 271-306, 1927. 1014
Krinsley, D. H., Pye, K., Boggs Jr, S., and Tovey, N. K.: Backscattered scanning electron microscopy and 1015
image analysis of sediments and sedimentary rocks. Cambridge University Press, 2005. 1016

50
Lenormand, R.: Sca2003-52: Interpretation of mercury injection curves to derive pore size distribution, in: 1017
Proceedings of 2003 International Symposium of SCA., 2003. 1018
Legland, D., Arganda-Carreras, I., Andrey, P.: MorphoLibJ: integrated library and plugins for mathematical morphology 1019
with ImageJ. Bioinformatics, 32(22), 3532-3534, 2016. 1020
Li, Y., He, D., Chen, L., Mei, Q., Li, C., and Zhang, L.: Cretaceous sedimentary basins in Sichuan, SW China: 1021
Restoration of tectonic and depositional environments, Cretaceous Research, 57, 50-65, 2016. 1022
Linden, S., Wiegmann, A., and Hagen, H.: The LIR space partitioning system applied to the Stokes equations, 1023
Graph. Models 82, 58–66 (2015). 1024
Linden S., Cheng L., Wiegmann A.: Specialized methods for direct numerical simulations in porous media, 1025
Math2Market GmbH, technical report, https://doi.org/10.30423/report.m2m-2018-01. 2018. 1026
Liu, X., Wang, J., Ge, L., Hu, F., Li, C., Li, X., Yu, J., Xu, H., Lu, S., and Xue, Q.: Porescale characterization 1027
of tight sandstone in Yanchang Formation Ordos Basin China using micro-CT and SEM imaging from 1028
nm- to cm-scale, Fuel, 209, 254–264, 2017. 1029
Lewis, J.J.M.: Outcrop-derived quantitative models of permeability heterogeneity for genetically different 1030
sand bodies. In: SPE Annual Technical Conference and Exhibition, 2-5 October 1988, Houston, Texas, 1031
1988. 1032
Louis, L., David, C., Metz, V., Robion, P., Menendez, B., and Kissel, C.: Microstructural control on the 1033
anisotropy of elastic and transport properties in undeformed sandstones. International journal of rock 1034
mechanics and mining sciences, 42(7-8), 911-923, 2005. 1035
Massaad, M.: Origin and environment of deposition of Lebanon basal sandstones, Eclogae Geologicae 1036
Helvetiae, 69(8), 1976. 1037
Mckay, G., Use of Adsorbents for the Removal of Pollutants from Wastewater. CRC press, 1995. 1038
MacKenzie, W. S., Adams, A. E., & Brodie, K. H. Rocks and Minerals in Thin Section: A Colour Atlas. CRC Press., 1039
2017. 1040
Meyer, R., and Krause, F. F.: A comparison of plug-derived and probe-derived permeability in cross-bedded 1041
sandstones of the Virgelle Member, Alberta, Canada: The influence of flow directions on probe 1042
permeametry, AAPG bulletin, 85(3), 477-489, 2001. 1043
Meyer, R.: Anisotropy of Sandstone Permeability. CREWES Research Report, Vol. 14, 2002. 1044
Mostaghimi, P., Blunt, M. J., and Bijeljic, B.: Computations of absolute permeability on micro-CT images, 1045
Mathematical Geosciences, 45(1), 103-125, 2012. 1046
Moussavi-Harami, R., and Brenner, R. L.: Diagenesis of non-marine petroleum reservoirs: the Neocomian 1047
(Lower Cretaceous) Shurijeh Formation, Kopet-Dagh basin, NE Iran. Journal of Petroleum Geology, 1048
16(1), 55-72, 1993. 1049
Munawar, M.J., Lin, C., Cnudde, V., Bultreys, T., Dong, C., Zhang, X., De Boever, W., Zahid, M.A., and Wu, 1050
Y.: Petrographic characterization to build an accurate rock model using micro-CT: case study on low-1051
permeable to tight turbidite sandstone from Eocene Shahejie Formation, Micron 109, 22–33, 2018. 1052
Narsilio, G. A., Buzzi, O., Fityus, S., Yun, T. S., and Smith, D. W.: Upscaling of Navier-Stokes equations in 1053
porous media: Theoretical, numerical and experimental approach, Computers and Geotechnics, 36(7), 1054
1200-1206, 2009. 1055

51
Nelson, P. H.: Pore-throat sizes in sandstones, tight sandstones, and shales, AAPG bulletin, 93(3), 329-340, 1056
2009. 1057
Neuzil, C. E.: Permeability of Clays and Shales, Annual Review of Earth and Planetary Sciences, 47, 247-273, 1058
2019. 1059
Nordahl, K., and Ringrose, P. S.: Identifying the representative elementary volume for permeability in 1060
heterolithic deposits using numerical rock models, Mathematical Geosciences, 40(7), 753, 2008. 1061
Nordahl. K., Ringrose, P. S., and Wen, R.: Petrophysical characterisation of a heterolithic tidal reservoir 1062
interval using a process-based modelling tool, Petroleum Geoscience, 11, 17-28, 2005. 1063
Norris, R. J., and J. J. M. Lewis. The geological modeling of effective permeability in complex heterolithic 1064
facies, in SPE Annual Technical Conference and Exhibition, Society of Petroleum Engineers, 1991. 1065
Okabe, H., and Oseto, K.: Pore-scale heterogeneity assessed by the lattice-Boltzmann method, Society of Core 1066
Analysts (SCA2006-44), 12-16, 2006. 1067
Ovaysi, S., and Piri, M.: Direct pore-level modeling of incompressible fluid flow in porous media, Journal of 1068
Computational Physics, 229(19), 7456-7476, 2010. 1069
Pettijohn, F. J., Potter, P. E., and Siever, R.: Sand and Sandstone. Springer Verlag, 2nd ed., New York, 1987. 1070
Ploner, A.:The use of the variogram cloud in geostatistical modelling. Environmetrics: The official journal of 1071
the International Environmetrics Society, 10(4), 413-437, 1999. 1072
Pyrcz, M. J., and Deutsch, C. V.: The whole story on the hole effect. Geostatistical Association of Australasia, 1073
Newsletter, 18, 3-5, 2003. 1074
Renard, P., Genty, A., and Stauffer, F.: Laboratory determination of the full permeability tensor, Journal of 1075
Geophysical Research: Solid Earth, 106(B11), 26443-26452, 2001. 1076
Reynolds, A. D.: Paralic reservoirs. Geological Society, London, Special Publications, 444(1), 7-34, 2017. 1077
Říha, J., Petrula, L., Hala, M., and Alhasan, Z. Assessment of empirical formulae for determining the hydraulic 1078
conductivity of glass beads, Journal of Hydrology and Hydromechanics, 66(3), 337-347, 2018. 1079
Ringrose, P., and Bentley, M.: Reservoir Model Design: A Practitioner's Guide, Springer, 249 p. New York, 1080
2015. 1081
Rootare, H. M., and Prenzlow, C. F.: Surface areas from mercury porosimeter measurements, The Journal of 1082
physical chemistry, 71(8), 2733-2736, 1967. 1083
RP40, A. P. I. (1960). API recommended practice for core-analysis procedure. Edition, API, New York, 12-13. 1084
Rustad, A. B., Theting, T. G., and Held, R. J.: Pore space estimation, upscaling and uncertainty modelling for 1085
multiphase properties. In SPE Symposium on Improved Oil Recovery, Society of Petroleum Engineers, 1086
2008. 1087
Saltzman, U.: Survey of the southeastern flanks of Mount Hermon, Tahal report (in Hebrew), 1968. 1088
Sato, M., Panaghi, K., Takada, N., and Takeda, M.: Effect of Bedding Planes on the Permeability and 1089
Diffusivity Anisotropies of Berea Sandstone, Transport in Porous Media, 127(3), 587-603, 2019. 1090
Saxena, N., Hows, A., Hofmann, R., Alpak, F. O., Freeman, J., Hunter, S., and Appel, M. Imaging and 1091
computational considerations for image computed permeability: operating envelope of digital rock 1092
physics, Advances in Water Resources, 116, 127-144, 2018. 1093

52
Schindelin, J., Arganda-Carreras, I., Frise, E., Kaynig, V., Longair, M., Pietzsch, T., Preibisch, S., Rueden, 1094
C., Saalfeld, S., Schmid, B., Tinevez, J., White, D., Hartenstein, V., Eliceiri, K., Tomancak, P., and 1095
Cardona, A.: Fiji: an open-source platform for biological-image analysis, Nature methods, 9(7), 676, 2012. 1096
Schlüter, S., Sheppard, A., Brown, K., and Wildenschild, D.: Image processing of multiphase images obtained 1097
via X‐ray microtomography: a review, Water Resources Research, 50(4), 3615-3639, 2014. 1098
Schmitt, M., Halisch, M., Müller, C., and Fernandes, C. P.: Classification and quantification of pore shapes in 1099
sandstone reservoir rocks with 3-D X-ray micro-computed tomography, Solid Earth, 7(1), 285-300, 2016. 1100
Scholz, C., Wirner, F., Götz, J., Rüde, U., Schröder-Turk, G. E., Mecke, K., and Bechinger, C.: Permeability 1101
of porous materials determined from the Euler characteristic, Physical review letters, 109(26), 264504, 1102
2012. 1103
Sethian, J. A.: A fast marching level set method for monotonically advancing fronts, Proceedings of the 1104
National Academy of Sciences, 93(4), 1591-1595, 1996. 1105
Shaw, S. M.: Southern Palestine geological map on a Scale 1:250,000 with explanatory notes, Palestine Geol. 1106
Soc. Publ., Jerusalem, 1947. 1107
Shenhav, H.: Lower Cretaceous sandstone reservoirs, Israel: petrography, porosity, permeability, AAPG 1108
Bulletin, 55(12), 2194-2224, 1971. 1109
Sheppard, A. P., Sok, R. M., and Averdunk, H.: Techniques for image enhancement and segmentation of 1110
tomographic images of porous materials, Physica A: Statistical mechanics and its applications, 339(1-2), 1111
145-151, 2004. 1112
Shimron, A. E.: Tectonic evolution of the southern Mount Hermon, Geological Survey of Israel Report, 1113
GSI/10/98, 1998. 1114
Sneh, A., and Weinberger, R.: Geology of the Metula quadrangle, northern Israel: Implications for the offset 1115
along the Dead Sea Rift, Israel Journal of Earth Sciences, 52, 2003. 1116
Sneh, A., and Weinberger, R.: Metula sheet 2-11, Geology Survey of Israel, Ministry of Energy, 2014. 1117
Tatomir, A. B., Halisch, M., Duschl, F., Peche, A., Wiegand, B., Schaffer, M., Licha, T., Niemi, A., Bensabat, 1118
J., and Sauter, M.: An integrated core-based analysis for the characterization of flow, transport and 1119
mineralogical parameters of the Heletz pilot CO2 storage site reservoir, International Journal of 1120
Greenhouse Gas Control, 48, 24-43, 2016. 1121
Stephens, D. B., Hsu, K. C., Prieksat, M. A., Ankeny, M. D., Blandford, N., Roth, T. Kelsey, J., Whitworth, J. 1122
R.: A comparison of estimated and calculated effective porosity. Hydrogeology Journal, 6(1), 156-165, 1123
1998. 1124
Tiab, D., and Donaldson, E. C.: Petrophysics: Theory and Practice of Measuring Reservoir Rock and Fluid 1125
Transport Properties, Elsevier, 2004. 1126
Tidwell, V. C., and Wilson, J. L.: Permeability upscaling measured on a block of Berea Sandstone: Results 1127
and interpretation, Mathematical Geology, 31(7), 749-769, 1999. 1128
Vincent, L., and Soille, P.: Watersheds in digital spaces: an efficient algorithm based on immersion 1129
simulations, IEEE Transactions on Pattern Analysis & Machine Intelligence, 6, 583-598, 1991. 1130

53
Vogel, H. J.: Topological characterization of porous media, in: Morphology of condensed matter, edited by: 1131
Mecke, K. R., and Stoyan, D., Springer, Berlin, 75-92, 2002. 1132
Wang, W. P., Liu, J. L., Zhang, J. B., Li, X. P., Cheng, Y. N., Xin, W. W., & Yan, Y. F. Evaluation of laser 1133
diffraction analysis of particle size distribution of typical soils in China and comparison with the Sieve-1134
Pipette method. Soil science, 178(4), 194-204, 2013. 1135
Viswanathan, J., Konwar, D., & Jagatheesan, K. Laboratory Characterization of Reservoir Rock and Fluids of 1136
Upper Assam Basin, India. In Novel Issues on Unsaturated Soil Mechanics and Rock Engineering: 1137
Proceedings of the 2nd GeoMEast International Congress and Exhibition on Sustainable Civil 1138
Infrastructures, Egypt 2018–The Official International Congress of the Soil-Structure Interaction Group 1139
in Egypt (SSIGE) (p. 179). Springer., 2018. 1140
Weissbrod, T.: Stratigraphy and correlation of the Lower Cretaceous exposures across the Dead Sea Transform 1141
with emphasis on tracing the Amir Formation in Jordan, Israel Journal of Earth Sciences, 51(2), 55–78, 1142
2002. 1143
Weissbrod, T., and Nachmias, J.: Stratigraphic significance of heavy minerals in the late Precambrian-1144
Mesozoic clastic sequence (“Nubian Sandstone”) in the Near East, Sedimentary Geology, 47(3-4), 263-1145
291, 1986. 1146
Whitaker, S.: Flow in porous media I: A theoretical derivation of Darcy's law, Transport in porous media, 1(1), 1147
3-25, 1986. 1148
Wiegmann, A.: GeoDict, the Digital Material Laboratory - Easy-to-use - Powerful - Accurate, Whitepaper, 1149
2019, https://doi.org/10.30423/WHITEPAPER.M2M-2019 1150
Wildenschild, D., and Sheppard, A. P.: X-ray imaging and analysis techniques for quantifying pore-scale 1151
structure and processes in subsurface porous medium systems, Advances in Water Resources, 51, 217-1152
246, 2013. 1153
Zhang, D., Zhang, R., Chen, S., and Soll, W. E.: Pore scale study of flow in porous media: Scale dependency, 1154
REV, and statistical REV, Geophysical research letters, 27(8), 1195-1198, 2000. 1155
Zhang, P., Leed,Y.I., and Zhange, J.: A review of high-resolution X-ray computed tomography applied to 1156
petroleum geology and a case study, Micron, 124, 102702, 2019. 1157
Zhu, W., Montési, L.G.J., and Wong, T.F.: Effects of Stress on the Anisotropic Development of Permeability 1158
during Mechanical Compaction of Porous Sandstones, Geological Society, London, 119-136, Special 1159
Publications, 200, 2002. 1160
1161
1162
1163
1164
1165

54
1166
Appendix A: Maximum hydraulic conductance 1167
1168
Figure A1: The pore throat length of the maximal hydraulic conductance, 𝑙𝑚𝑎𝑥, is defined from the maximal 1169
(normalized) hydraulic conductance (Katz and Thompson, 1987), specified at the vertical axis of the chart. 1170
The corresponding pore throat diameters (x-axis) marked by black arrows define the pore throat diameters 1171
(or pore throat lengths of maximal conductance), 𝑙𝑚𝑎𝑥, where all connected paths composed of 𝑙 ≥ 𝑙𝑚𝑎𝑥 1172
contribute significantly to the hydraulic conductance (see Sect.3.2). 1173
1174
1175
1176


